Attached files
UNITED STATES
SECURITIES AND EXCHANGE COMMISSION
Washington, D.C. 20549
_______________
Form 10-K
ANNUAL REPORT PURSUANT TO SECTION 13 OR 15(d) OF
THE SECURITIES EXCHANGE ACT OF 1934
For the Fiscal Year Ended January 3, 2010
Commission File No.: 001-33994
Interface, Inc.
(Exact name of registrant as specified in its charter)
|
Georgia
|
58-1451243
|
|
|
(State of incorporation)
|
(I.R.S. Employer Identification No.)
|
|
|
2859 Paces Ferry Road, Suite 2000
|
||
|
Atlanta, Georgia
|
30339
|
|
|
(Address of principal executive offices)
|
(zip code)
|
Registrant’s telephone number, including area code: (770) 437-6800
Securities Registered Pursuant to Section 12(b) of the Act:
|
Title of Each Class
|
Name of Each Exchange on Which Registered:
|
|
|
Class A Common Stock, $0.10 Par Value Per Share
|
Nasdaq Global Select Market
|
|
|
Series B Participating Cumulative Preferred Stock Purchase Rights
|
Nasdaq Global Select Market
|
Securities Registered Pursuant to Section 12(g) of the Act: None
Indicate by check mark if the registrant is a well-known seasoned issuer, as defined in Rule 405 of the Securities Act. YES o NO þ
Indicate by check mark if the registrant is not required to file reports pursuant to Section 13 or Section 15(d) of the Act. YES o NO þ
Indicate by check mark whether the registrant (1) has filed all reports required to be filed by Section 13 or 15(d) of the Securities Exchange Act of 1934 during the preceding 12 months (or for such shorter period that the registrant was required to file such reports), and (2) has been subject to such filing requirements for the past 90 days. YES þ NO o
Indicate by check mark whether the registrant has submitted electronically and posted on its corporate Web site, if any, every Interactive Date File required to be submitted and posted pursuant to Rule 405 of Regulation S-T (§232.405 of this chapter) during the preceding 12 months (or for such shorter period that the registrant was required to submit and post such files). YES o NO o
Indicate by check mark if disclosure of delinquent filers pursuant to Item 405 of Regulation S-K is not contained herein, and will not be contained, to the best of registrant’s knowledge, in definitive proxy or information statements incorporated by reference in Part III of this Form 10-K or any amendment to this Form 10-K. o
Indicate by check mark whether the registrant is a large accelerated filer, an accelerated filer, a non-accelerated filer or a smaller reporting company. See the definitions of “large accelerated filer,” “accelerated filer” and a “smaller reporting company” in Rule 12b-2 of the Securities Exchange Act of 1934. (Check one):
|
Large Accelerated Filer o
|
Accelerated Filer þ
|
Non-Accelerated Filer o
|
Smaller Reporting Company o
|
Indicate by check mark whether the registrant is a shell company (as defined in Rule 12b-2 of the Exchange Act). YES o NO þ
Aggregate market value of the voting and non-voting stock held by non-affiliates of the registrant as of July 2, 2009 (assuming conversion of Class B Common Stock into Class A Common Stock): $339,520,732 (57,351,475 shares valued at the last sales price of $5.92 on July 2, 2009). See Item 12.
Number of shares outstanding of each of the registrant’s classes of Common Stock, as of March 1, 2010:
|
Class
|
Number of Shares | ||||
|
Class A Common Stock, $0.10 par value per share
|
56,721,192 | ||||
|
Class B Common Stock, $0.10 par value per share
|
6,596,352 | ||||
DOCUMENTS INCORPORATED BY REFERENCE
Portions of the Proxy Statement for the 2010 Annual Meeting of Shareholders are incorporated by reference into Part III.
1
PART I
ITEM 1. BUSINESS
Introduction and General
We are a worldwide leader in design, production and sales of modular carpet, and a manufacturer, marketer and servicer of select other floorcovering products for the commercial, institutional and residential markets. In recent years, modular carpet sales growth in the floorcovering industry has significantly outpaced the growth of the overall industry, as architects, designers and end users increasingly recognized the unique and superior attributes of modular carpet, including its dynamic design capabilities, greater economic value (which includes lower costs as a result of reduced waste in both installation and replacement), and installation ease and speed. Our Modular Carpet segment sales, which do not include modular carpet sales in our Bentley Prince Street segment, grew from $646.2 million to $765.3 million during the 2005 to 2009 period, representing a 4% compound annual growth rate.
Our Bentley Prince Street® brand is a leader in the high-end, designer-oriented sector of the broadloom market segment, where custom design and high quality are the principal specifying and purchasing factors.
As a global company with a reputation for high quality, reliability and premium positioning, we market products in over 110 countries under established brand names such as InterfaceFLOR®, Heuga®, Bentley Prince Street and FLOR® in modular carpet; Bentley Prince Street and Prince Street House and Home™ in broadloom carpet; and Intersept® in antimicrobial chemicals. Our principal geographic markets are the Americas, Europe and Asia-Pacific, where the percentages of our total net sales were approximately 58%, 30% and 12%, respectively, for fiscal year 2009.
Capitalizing on our leadership in modular carpet for the corporate office segment, we embarked on a market diversification strategy in 2001 to increase our presence and market share for modular carpet in non-corporate office market segments, such as government, education, healthcare, hospitality and retail space, which combined are almost twice the size of the approximately $1 billion U.S. corporate office segment. In 2003, we expanded our diversification strategy to target the approximately $11 billion U.S. residential market segment for carpet. As a result, our mix of corporate office versus non-corporate office modular carpet sales in the Americas shifted to 40% and 60%, respectively, for 2009 compared with 64% and 36%, respectively, in 2001. (Company-wide, our mix of corporate office versus non-corporate office sales was 55% and 45%, respectively, in 2009.) We believe the appeal and utilization of modular carpet is growing in each of these non-corporate office segments, and we are using our considerable skills and experience with designing, producing and marketing modular products that make us the market leader in the corporate office segment to support and facilitate our penetration into these new segments around the world.
In the fourth quarter of 2008, and particularly in November and December, the worldwide financial and credit crisis caused many corporations, governments and other organizations to delay or curtail spending on renovation and construction projects where our carpet is used. This downturn negatively impacted our performance. In the fourth quarter of 2008, we announced a restructuring plan pursuant to which we ceased manufacturing operations at our facility in Canada and reduced our worldwide employee base by a total of approximately 530 employees in the areas of manufacturing, sales and administration. In the first and second quarters of 2009, we announced further restructuring plans to further align our cost structure with market demand for our products, resulting in the reduction of an additional 370 employees worldwide. The employee reductions amounted to about 23% of our worldwide workforce. These plans have reduced costs across our worldwide operations, and more closely aligned our operations with the decreased demand levels that we have experienced since the fourth quarter of 2008.
Our Strengths
Our principal competitive strengths include:
Market Leader in Attractive Modular Carpet Segment. We are the world’s leading manufacturer of carpet tile. Modular carpet has become more prevalent across all commercial interiors markets as designers, architects and end users have become more familiar with its unique attributes. We continue to drive this trend with our product innovations and designs discussed below. According to the 2009 Floor Focus interiors industry survey of the top 250 designers in the United States, carpet tile was ranked as the number one “hot product” for the eighth consecutive year. We believe that we are well positioned to lead and capitalize upon the continued shift to modular carpet, both domestically and around the world.
2
Established Brands and Reputation for Quality, Reliability and Leadership. Our products are known in the industry for their high quality, reliability and premium positioning in the marketplace. Our established brand names in carpets are leaders in the industry. The 2009 Floor Focus survey ranked our InterfaceFLOR brand first or second in each of the survey categories of quality, performance, value, service and design. InterfaceFLOR also ranked second in the category of “best overall business experience” for carpet companies in this survey. On the international front, InterfaceFLOR and Heuga are well-recognized brand names in carpet tiles for commercial, institutional and residential use. More generally, as the appeal and utilization of modular carpet continues to expand into new market segments such as education, hospitality and retail space, our reputation as the pioneer of modular carpet — as well as our established brands and leading market position for modular carpet in the corporate office segment — will enhance our competitive advantage in marketing to the customers in these new markets.
Innovative Product Design and Development Capabilities. Our product design and development capabilities have long given us a significant competitive advantage, and they continue to do so as modular carpet’s appeal and utilization expand across virtually every market segment and around the globe. One of our best design innovations is our i2™ modular product line, which includes our popular Entropy® product for which we received a patent in 2005 on the key elements of its design. The i2 line introduced and features mergeable dye lots, and includes carpet tile products designed to be installed randomly without reference to the orientation of neighboring tiles. The i2 line offers cost-efficient installation and maintenance, interactive flexibility, and recycled and recyclable materials. Our i2 line of products, which now comprises approximately 40% of our total U.S. modular carpet business, represents a differentiated category of smart, environmentally sensitive and stylish modular carpet, and Entropy has been the fastest growing product in our history. The award-winning design firm David Oakey Designs had a pivotal role in developing our i2 product line, and our long-standing exclusive relationship with David Oakey Designs remains vibrant and augments our internal research, development and design staff. Another recent innovation is our patent-pending TacTiles® carpet tile installation system, which uses small squares of adhesive plastic film to connect intersecting carpet tiles, thus eliminating the need for traditional carpet adhesive and resulting in a reduction in installation time and waste materials.
Made-to-Order and Global Manufacturing Capabilities. The success of our modernization and restructuring of operations over the past several years gives us a distinct competitive advantage in meeting two principal requirements of the specified products markets we primarily target — that is, providing custom samples quickly and on-time delivery of customized final products. We also can generate realistic digital samples that allow us to create a virtually unlimited number of new design concepts and distribute them instantly for customer review, while at the same time reducing sampling waste. Approximately 75% to 80% of our modular carpet products in the United States and Asia-Pacific markets are now made-to-order, and we are increasing our made-to-order production in Europe as well. Our made-to-order capabilities not only enhance our marketing and sales, they significantly improve our inventory turns. Our global manufacturing capabilities in modular carpet production are an important component of this strength, and give us an advantage in serving the needs of multinational corporate customers that require products and services at various locations around the world. Our manufacturing locations across four continents enable us to compete effectively with local producers in our international markets, while giving international customers more favorable delivery times and freight costs.
Recognized Global Leadership in Ecological Sustainability. Our long-standing goal and commitment to be ecologically “sustainable” — that is, the point at which we are no longer a net “taker” from the earth and do no harm to the biosphere — has emerged as a competitive strength for our business and remains a strategic initiative. It now includes Mission Zero®, our global branding initiative, which represents our mission to eliminate any negative impact our companies may have on the environment by the year 2020. Our acknowledged leadership position and expertise in this area resonate deeply with many of our customers and prospects around the globe, and provide us with a differentiating advantage in competing for business among architects, designers and end users of our products, who increasingly make purchase decisions based on “green” factors. The 2009 Floor Focus survey, which named our InterfaceFLOR business the top among “Green Leaders” and gave us the top honors for “Green Kudos”, found that 67% of the designers surveyed consider sustainability an added benefit and 30% consider it a “make or break” issue when deciding what products to recommend or purchase.
Strong Operating Leverage Position. Our operating leverage, which we define as our ability to realize profit on incremental sales, is strong and allows us to increase earnings at a higher rate than our rate of increase in net sales. Our operating leverage position is primarily a result of (1) the specified, high-end nature and premium positioning of our principal products in the marketplace, and (2) the mix of fixed and variable costs in our manufacturing processes that allow us to increase production of most of our products without significant increases in capital expenditures or fixed costs. For example, while net sales from our Modular Carpet segment increased from $646.2 million in 2005 to $930.7 million in 2007 (a period in which our industry and business were recovering from a prior downturn), our operating income from that segment increased from $77.4 million (12.0% of net sales) in 2005 to $133.7 million (14.4% of net sales) in 2007.
3
Experienced and Motivated Management and Sales Force. An important component of our competitive position is the quality of our management team and its commitment to developing and maintaining an engaged and accountable workforce. Our team is highly skilled and dedicated to guiding our overall growth and expansion into our targeted market segments, while maintaining our leadership in traditional markets and our high contribution margins. We utilize an internal marketing and predominantly commissioned sales force of approximately 700 experienced personnel, stationed at over 70 locations in over 30 countries, to market our products and services in person to our customers. We have also developed special features for our incentive compensation and our sales and marketing training programs in order to promote performance and facilitate leadership by our executives in strategic areas.
Our Business Strategy and Principal Initiatives
Our business strategy is (1) to continue to use our leading position in the modular carpet market segment and our product design and global made-to-order capabilities as a platform from which to drive acceptance of modular carpet products across several industry segments, while maintaining our leadership position in the corporate office market segment, and (2) to return to our historical profit levels in the high-end, designer-oriented sector of the broadloom carpet market. We will seek to increase revenues and profitability by capitalizing on the above strengths and pursuing the following key strategic initiatives:
Continue to Penetrate Non-Corporate Office Market Segments. We will continue our strategic focus on product design and marketing and sales efforts for non-corporate office market segments such as government, education, healthcare, hospitality, retail and residential space. We began this initiative as part of our market diversification strategy in 2001 (when our initial objective was reducing our exposure to the more severe economic cyclicality of the corporate office segment), and it has become a principal strategy generally for growing our business and enhancing profitability. We have shifted our mix of corporate office versus non-corporate office modular carpet sales in the Americas to 40% and 60%, respectively, for fiscal 2009 from 64% and 36%, respectively, in fiscal 2001. To implement this strategy, we:
|
·
|
introduced specialized product offerings tailored to the unique demands of these segments, including specific designs, functionalities and prices;
|
|
·
|
created special sales teams dedicated to penetrating these segments at a high level, with a focus on specific customer accounts rather than geographic territories; and
|
|
·
|
realigned incentives for our corporate office segment sales force generally in order to encourage their efforts, and where appropriate, to assist our penetration of these other segments.
|
As part of this strategy, we launched our FLOR and Prince Street House and Home lines of products in 2003 to focus on the approximately $11 billion U.S. residential carpet market segment. These products were specifically created to bring high style modular and broadloom floorcovering to the U.S. residential market. FLOR is offered by many specialty retailers, over the Internet and in a number of major retail catalogs. Through such direct and indirect retailing, FLOR sales have grown more than 50% from 2005 to 2009. Prince Street House and Home brings new colors and patterns to the high-end consumer market with a collection of broadloom carpet and rugs sold through hundreds of retail stores and interior designers. Through agreements between our FLOR brand and both Martha Stewart Living Omnimedia and the national homebuilder KB Home, we are further expanding our penetration of the U.S. residential market with a line of Martha Stewart-branded carpet tiles. Through our Heuga Home division, we have been increasing our marketing of modular carpet to the residential segment of international soft floorcovering markets, the size of which we believe to be approximately $2.3 billion in Western Europe alone.
Penetrate Expanding Geographic Markets for Modular Products. The popularity of modular carpet continues to increase compared with other floorcovering products across most markets, internationally as well as in the United States. While maintaining our leadership in the corporate office segment, we will continue to build upon our position as the worldwide leader for modular carpet in order to promote sales in all market segments globally. A principal part of our international focus – which utilizes our global marketing capabilities and sales infrastructure – is the significant opportunities in several emerging geographic markets for modular carpet. Some of these markets, such as China, India and Eastern Europe, represent large and growing economies that are essentially new markets for modular carpet products. Others, such as Germany and Italy, are established markets that are transitioning to the use of modular carpet from historically low levels of penetration. Each of these emerging markets represents a significant growth opportunity for our modular carpet business. Our initiative to penetrate these markets will include drawing upon our internationally recognized InterfaceFLOR and Heuga brands.
4
Continue to Minimize Expenses and Invest Strategically. We have steadily trimmed costs from our operations for several years through multiple and sometimes painful initiatives, which have made us leaner today and for the future. Our supply chain and other cost containment initiatives have improved our cost structure and yielded the operating efficiencies we sought. While we still seek to minimize our expenses in order to increase profitability, we will also take advantage of strategic opportunities to invest in systems, processes and personnel that can help us grow our business and increase profitability and value.
Sustain Leadership in Product Design and Development. As discussed above, our leadership position for product design and development is a competitive advantage and key strength, especially in the modular carpet market segment, where our i2 products and recent TacTiles installation system have confirmed our position as an innovation leader. We will continue initiatives to sustain, augment and capitalize upon that strength to continue to increase our market share in targeted market segments. Our Mission Zero global branding initiative, which draws upon and promotes our ecological sustainability commitment, is part of those initiatives and includes placing our Mission Zero logo on many of our marketing and merchandising materials distributed throughout the world.
Use Strong Free Cash Flow Generation to De-leverage Our Balance Sheet. Our principal businesses have been structured – including through our rationalization and repositioning initiatives over the past eight years – to yield high contribution margins and generate strong free cash flow (by which we mean cash available to apply towards debt service). Our historical investments in global manufacturing capabilities and mass customization techniques and facilities, which we have maintained, also contribute to our ability to generate substantial levels of free cash flow. We will use our strong free cash flow generation capability to continue to repay debt and strengthen our financial position. We will also continue to execute programs to reduce costs further and enhance free cash flow. In addition, our existing capacity to increase production levels without significant capital expenditures will further enhance our generation of free cash flow if and when demand for our products rises.
Challenges
In order to capitalize on our strengths and to implement successfully our business strategy and the principal initiatives discussed above, we will have to handle successfully several challenges that confront us or that affect our industry in general. As discussed in the Risk Factors in Item 1A of this Report, several factors could make it difficult for us, including:
|
|
•
|
|
sales of our principal products have been and may continue to be affected by adverse economic cycles in the renovation and construction of commercial and institutional buildings;
|
|
|
|
|
|
|
|
•
|
|
we compete with a large number of manufacturers in the highly competitive commercial floorcovering products market, and some of these competitors have greater financial resources than we do;
|
|
|
|
|
|
|
|
•
|
|
our success depends significantly upon the efforts, abilities and continued service of our senior management executives and our principal design consultant, and our loss of any of them could affect us adversely;
|
|
|
|
|
|
|
|
•
|
|
our substantial international operations are subject to various political, economic and other uncertainties that could adversely affect our business results;
|
|
|
|
|
|
|
|
•
|
|
large increases in the cost of petroleum-based raw materials could adversely affect us if we are unable to pass these cost increases through to our customers;
|
|
|
|
|
|
|
|
•
|
|
unanticipated termination or interruption of any of our arrangements with our primary third party suppliers of synthetic fiber could have a material adverse effect on us; and
|
|
|
|
|
|
|
|
•
|
|
we have a significant amount of indebtedness, which could have important negative consequences to us.
|
We believe our business model is strong enough, and our strategic initiatives are properly calibrated, for us to handle these and other challenges we will encounter in our business.
Floorcovering Products and Services
Interface is the world’s largest manufacturer and marketer of modular carpet. We also manufacture and sell broadloom carpet, which generally consists of tufted carpet sold primarily in twelve-foot rolls, under the Bentley Prince Street brand. Our broadloom operations focus on the high quality, designer-oriented sector of the U.S. broadloom carpet market and select international markets.
5
Modular Carpet
Our modular carpet system, which is marketed under the established global brands InterfaceFLOR and Heuga, and more recently under the Bentley Prince Street brand, utilizes carpet tiles cut in precise, dimensionally stable squares (usually 50 cm x 50 cm) or rectangles to produce a floorcovering that combines the appearance and texture of traditional soft floorcovering with the advantages of a modular carpet system. Our GlasBac® technology employs a fiberglass-reinforced polymeric composite backing that provides dimensional stability and reduces the need for adhesives or fasteners. We also make carpet tiles with a backing containing post-industrial and/or post-consumer recycled materials, which we market under the GlasBacRE brand. In 2008, we introduced the Convert™ collection of carpet tile designed and manufactured with yarn containing varying degrees of post-consumer nylon, depending on the style and color.
Our carpet tile has become popular for a number of reasons. Carpet tile incorporating this reinforced backing may be easily removed and replaced, permitting rearrangement of furniture without the inconvenience and expense associated with removing, replacing or repairing other soft surface flooring products, including broadloom carpeting. Because a relatively small portion of a carpet installation often receives the bulk of traffic and wear, the ability to rotate carpet tiles between high traffic and low traffic areas and to selectively replace worn tiles can significantly increase the average life and cost efficiency of the floorcovering. In addition, carpet tile facilitates access to sub-floor air delivery systems and telephone, electrical, computer and other wiring by lessening disruption of operations. It also eliminates the cumulative damage and unsightly appearance commonly associated with frequent cutting of conventional carpet as utility connections and disconnections are made. We believe that, within the overall floorcovering market, the worldwide demand for modular carpet is increasing as more customers recognize these advantages.
We use a number of conventional and technologically advanced methods of carpet construction to produce carpet tiles in a wide variety of colors, patterns, textures, pile heights and densities. These varieties are designed to meet both the practical and aesthetic needs of a broad spectrum of commercial interiors – particularly offices, healthcare facilities, airports, educational and other institutions, hospitality spaces, and retail facilities – and residential interiors. Our carpet tile systems permit distinctive styling and patterning that can be used to complement interior designs, to set off areas for particular purposes and to convey graphic information. While we continue to manufacture and sell a substantial portion of our carpet tile in standard styles, an increasing percentage of our modular carpet sales is custom or made-to-order product designed to meet customer specifications.
In addition to general uses of our carpet tile, we produce and sell a specially adapted version of our carpet tile for the healthcare facilities market. Our carpet tile possesses characteristics — such as the use of the Intersept antimicrobial, static-controlling nylon yarns, and thermally pigmented, colorfast yarns — which make it suitable for use in these facilities in place of hard surface flooring. Moreover, we launched our FLOR line of products to specifically target modular carpet sales to the residential market segment. Through our relationship with David Oakey Designs, we also have created modular carpet products (some of which are part of our i2 product line) specifically designed for each of the education, hospitality and retail market segments.
We also manufacture and sell two-meter roll goods that are structure-backed and offer many of the advantages of both carpet tile and broadloom carpet. These roll goods are often used in conjunction with carpet tiles to create special design effects. Our current principal customers for these products are in the education, healthcare and government market segments.
Broadloom Carpet
We maintain a significant share of the high-end, designer-oriented broadloom carpet segment by combining innovative product design and short production and delivery times with a marketing strategy aimed at interior designers, architects and other specifiers. Our Bentley Prince Street designs emphasize the dramatic use of color and multi-dimensional texture. In addition, we have launched the Prince Street House and Home collection of high-style broadloom carpet and area rugs targeted at design-oriented residential consumers. We received the 2007 Best of NeoCon Silver Award in the modular category for the Saturnia™ Collection, which is made up of carpet tile and broadloom products.
Other Products
We sell a proprietary antimicrobial chemical compound under the registered trademark Intersept. We incorporate Intersept in all of our modular carpet products and have licensed Intersept to another company for use in air filters. We also sell our TacTiles carpet tile installation system, along with a variety of traditional adhesives and products for carpet installation and maintenance that are manufactured by a third party. In addition, we continue to manufacture and sell our Intercell® brand raised/access flooring product in Europe.
6
Services
For several years, we provided or arranged for commercial carpet installation services, primarily through our Re:Source® service provider network. We decided to exit our owned Re:Source dealer businesses, and in 2005 we completed the exit activities related to the owned dealer businesses. In early 2006, we sold certain assets relating to our aligned non-owned dealer network, and have since discontinued its operations as well. We continue to provide “turnkey” project management services for national accounts and other large customers through our InterfaceSERVICES™ business.
Marketing and Sales
We have traditionally focused our carpet marketing strategy on major accounts, seeking to build lasting relationships with national and multinational end-users, and on architects, engineers, interior designers, contracting firms, and other specifiers who often make or significantly influence purchasing decisions. While most of our sales are in the corporate office segment, both new construction and renovation, we also emphasize sales in other segments, including retail space, government institutions, schools, healthcare facilities, tenant improvement space, hospitality centers, residences and home office space. Our marketing efforts are enhanced by the established and well-known brand names of our carpet products, including the InterfaceFLOR, FLOR and Heuga brands in modular carpet and Bentley Prince Street brand in broadloom carpet. Our exclusive consulting agreement with the award-winning, premier design firm David Oakey Designs enabled us to introduce more than 25 new carpet designs in the United States in 2009 alone.
An important part of our marketing and sales efforts involves the preparation of custom-made samples of requested carpet designs, in conjunction with the development of innovative product designs and styles to meet the customer’s particular needs. Our mass customization initiative simplified our carpet manufacturing operations, which significantly improved our ability to respond quickly and efficiently to requests for samples. In most cases, we can produce samples to customer specifications in less than five days, which significantly enhances our marketing and sales efforts and has increased our volume of higher margin custom or made-to-order sales. In addition, through our websites, we have made it easy to view and request samples of our products. We also have technology which allows us to provide digital, simulated samples of our products, which helps reduce raw material and energy consumption associated with our samples.
We primarily use our internal marketing and sales force to market our carpet products. In order to implement our global marketing efforts, we have product showrooms or design studios in the United States, Canada, Mexico, Brazil, Denmark, England, Northern Ireland, France, Germany, Spain, Belgium, the Netherlands, India, Australia, Japan, Italy, Norway, United Arab Emirates, Russia, Singapore, Hong Kong and China. We expect to open offices in other locations around the world as necessary to capitalize on emerging marketing opportunities.
Manufacturing
We manufacture carpet at three locations in the United States and at facilities in the Netherlands, the United Kingdom, Australia and Thailand. In addition, we currently are constructing a new manufacturing facility in China that is expected to begin production in late 2010. Pursuant to our restructuring plan adopted in the fourth quarter of 2008, we have ceased manufacturing operations at our facility in Canada.
Having foreign manufacturing operations enables us to supply our customers with carpet from the location offering the most advantageous delivery times, duties and tariffs, exchange rates, and freight expense, and enhances our ability to develop a strong local presence in foreign markets. We believe that the ability to offer consistent products and services on a worldwide basis at attractive prices is an important competitive advantage in servicing multinational customers seeking global supply relationships. We will consider additional locations for manufacturing operations in other parts of the world as necessary to meet the demands of customers in international markets.
To the extent practicable, we seek to standardize our worldwide modular carpet manufacturing procedures. In connection with the implementation of this plan, we strive to establish global standards for our tufting equipment, yarn systems and product styling. We previously had changed our standard carpet tile size to be 50 cm x 50 cm, which we believe has allowed us to reduce operational waste and fossil fuel energy consumption and to offer consistent product sizing for our global customers.
7
We also implemented a new, flexible-inputs carpet backing line at our modular carpet manufacturing facility in LaGrange, Georgia. Using next generation thermoplastic technology, the custom-designed backing line dramatically improves our ability to keep reclaimed and waste carpet in the production “technical loop,” and further permits us to explore other plastics and polymers as inputs. This new process, which we call “Cool Blue™”, came on line for production of certain carpet styles in late 2005. In 2007, we implemented new technology that more cleanly separates the face fiber and backing of reclaimed and waste carpet, thus making it easier to recycle some of its components and providing a purer supply of inputs for the Cool Blue process. This technology, which is part of our ReEntry®2.0 carpet reclamation program, allows us to send some of the reclaimed face fiber back to our fiber supplier to be blended with virgin or other post-industrial materials and extruded into new fiber.
The environmental management systems of our floorcovering manufacturing facilities in LaGrange, Georgia, West Point, Georgia, City of Industry, California, Shelf, England, Northern Ireland, Australia, the Netherlands and Thailand are certified under International Standards Organization (ISO) Standard No. 14001.
Our significant international operations are subject to various political, economic and other uncertainties, including risks of restrictive taxation policies, foreign exchange restrictions, changing political conditions and governmental regulations. We also receive a substantial portion of our revenues in currencies other than U.S. dollars, which makes us subject to the risks inherent in currency translations. Although our ability to manufacture and ship products from facilities in several foreign countries reduces the risks of foreign currency fluctuations we might otherwise experience, we also engage from time to time in hedging programs intended to further reduce those risks.
Competition
We compete, on a global basis, in the sale of our floorcovering products with other carpet manufacturers and manufacturers of vinyl and other types of floorcoverings. Although the industry has experienced significant consolidation, a large number of manufacturers remain in the industry. We believe we are the largest manufacturer of modular carpet in the world. However, a number of domestic and foreign competitors manufacture modular carpet as one segment of their business, and some of these competitors have financial resources greater than ours. In addition, some of the competing carpet manufacturers have the ability to extrude at least some of their requirements for fiber used in carpet products, which decreases their dependence on third party suppliers of fiber.
We believe the principal competitive factors in our primary floorcovering markets are brand recognition, quality, design, service, broad product lines, product performance, marketing strategy and pricing. In the corporate office market segment, modular carpet competes with various floorcoverings, of which broadloom carpet is the most common. The quality, service, design, better and longer average product performance, flexibility (design options, selective rotation or replacement, use in combination with roll goods) and convenience of our modular carpet are our principal competitive advantages.
We believe we have competitive advantages in several other areas as well. First, our exclusive relationship with David Oakey Designs allows us to introduce numerous innovative and attractive floorcovering products to our customers. Additionally, we believe that our global manufacturing capabilities are an important competitive advantage in serving the needs of multinational corporate customers. We believe that the incorporation of the Intersept antimicrobial chemical agent into the backing of our modular carpet enhances our ability to compete successfully across all of our market segments generally, and specifically with resilient tile in the healthcare market.
In addition, we believe that our goal and commitment to be ecologically “sustainable” by 2020 is a brand-enhancing, competitive strength as well as a strategic initiative. Increasingly, our customers are concerned about the environmental and broader ecological implications of their operations and the products they use in them. Our leadership, knowledge and expertise in the area, especially in the “green building” movement and the related LEED certification program, resonate deeply with many of our customers and prospects around the globe, and these businesses are increasingly making purchase decisions based on “green” factors. Our modular carpet products historically have had inherent installation and maintenance advantages that translated into greater efficiency and waste reduction. We have further enhanced the “green” quality of our modular carpet in our highly successful i2 product line, and we are using raw materials and production technologies, such as our Cool Blue backing line and our ReEntry 2.0 reclaimed carpet separation process, that directly reduce the adverse impact of those operations on the environment and limit our dependence on petrochemicals.
8
To further raise awareness of our goal of becoming sustainable, we launched our Mission Zero global branding initiative, which represents our mission to eliminate any negative impact our companies may have on the environment by the year 2020. As part of this initiative, our Mission Zero logo appears on many of our marketing and merchandising materials distributed throughout the world. To further our Mission Zero goals, we partnered with other like-minded organizations to launch the website missionzero.org in 2008 to facilitate the sharing of ideas, best practices and resources in the area of sustainability.
Interior Fabrics
In July 2007, we sold our Fabrics Group business segment to a third party. This business designs, manufactures and markets specialty fabrics for open plan office furniture systems and other commercial interiors. In April 2006, we sold our European fabrics business to an entity formed by the business’s management team. Current and prior periods have been restated to include the results of operations and related disposal costs, gains and losses for these businesses as discontinued operations. In addition, assets and liabilities of these businesses have been reported in assets and liabilities held for sale for all reported periods.
Specialty Products
In March 2007, we sold Pandel, Inc., our subsidiary that historically conducted our Specialty Products business segment. Pandel produces vinyl carpet tile backing and specialty mat and foam products.
Product Design, Research and Development
We maintain an active research, development and design staff of approximately 60 people and also draw on the research and development efforts of our suppliers, particularly in the areas of fibers, yarns and modular carpet backing materials. Our research and development costs were $12.7 million, $15.3 million and $15.8 million in 2009, 2008, and 2007, respectively.
Our research and development team provides technical support and advanced materials research and development for the entire family of Interface companies. The team assisted in the development of our NexStep® backing, which employs moisture-impervious polycarbite precoating technology with a chlorine-free urethane foam secondary backing, and also helped develop a post-consumer recycled content, polyvinyl chloride, or PVC, extruded sheet process that has been incorporated into our GlasBacRE modular carpet backing. Our post-consumer recycled content PVC extruded sheet exemplifies our commitment to “closing-the-loop” in recycling. More recently, this team developed our patent-pending TacTiles carpet tile installation system, which uses small squares of adhesive plastic film to connect intersecting carpet tiles. The team also helped implement our Cool Blue flexible inputs backing line and our ReEntry 2.0 reclaimed carpet separation technology and post-consumer recycling technology for nylon face fibers. With a goal of supporting sustainable product designs in floorcoverings applications, we continue to evaluate 100% renewable polymers based on corn-derived polylactic acid (PLA) for use in our products.
Our research and development team also is the coordinator of our QUEST and EcoSense initiatives (discussed below under “Environmental Initiatives”) and supports the dissemination, consultancies and technical communication of our global sustainability endeavors. This team also provides all biochemical and technical support to Intersept antimicrobial chemical product initiatives.
Innovation and increased customization in product design and styling are the principal focus of our product development efforts. Our carpet design and development team is recognized as an industry leader in carpet design and product engineering for the commercial and institutional markets.
David Oakey Designs provides carpet design and consulting services to our floorcovering businesses pursuant to a consulting agreement with us. David Oakey Designs’ services under the agreement include creating commercial carpet designs for use by our floorcovering businesses throughout the world, and overseeing product development, design and coloration functions for our modular carpet business in North America. The current agreement runs through April 2011. While the agreement is in effect, David Oakey Designs cannot provide similar services to any other carpet company. Through our relationship with David Oakey Designs, we introduced more than 25 new carpet designs in 2009 alone, and have enjoyed considerable success in winning U.S. carpet industry awards.
David Oakey Designs also contributed to our ability to efficiently produce many products from a single yarn system. Our mass customization production approach evolved, in major part, from this concept. In addition to increasing the number and variety of product designs, which enables us to increase high margin custom sales, the mass customization approach increases inventory turns and reduces inventory levels (for both raw materials and standard products) and their related costs because of our more rapid and flexible production capabilities.
9
Our i2 product line — which includes, among others, our patented Entropy modular carpet product — represents an innovative breakthrough in the design of modular carpet. The i2 line introduced and features mergeable dye lots, cost-efficient installation and maintenance, interactive flexibility and recycled and recyclable materials. Some of these products may be installed without regard to the directional orientation of the carpet tile, and their features also make installation, maintenance and replacement of modular carpet easier, less expensive and less wasteful.
Environmental Initiatives
In the latter part of 1994, we commenced a new industrial ecological sustainability initiative called EcoSense, inspired in part by the interest of customers concerned about the environmental implications of how they and their suppliers do business. EcoSense, which includes our QUEST waste reduction initiative, is directed towards the elimination of energy and raw materials waste in our businesses, and, on a broader and more long-term scale, the practical reclamation — and ultimate restoration — of shared environmental resources. The initiative involves a commitment by us:
|
•
|
to learn to meet our raw material and energy needs through recycling of carpet and other petrochemical products and harnessing benign energy sources; and
|
|
|
•
|
to pursue the creation of new processes to help sustain the earth’s non-renewable natural resources.
|
We have engaged some of the world’s leading authorities on global ecology as environmental advisors. The list of advisors includes: Paul Hawken, author of The Ecology of Commerce: A Declaration of Sustainability and The Next Economy, and co-author with Amory Lovins and Hunter Lovins of Natural Capitalism: Creating the Next Industrial Revolution; Mr. Lovins, energy consultant and co-founder of the Rocky Mountain Institute; John Picard, President of E2 Environmental Enterprises; Jonathan Porritt, director of Forum for the Future; Bill Browning, fellow and former director of the Rocky Mountain Institute’s Green Development Services; Dr. Karl-Henrik Robert, founder of The Natural Step; Janine M. Benyus, author of Biomimicry; Walter Stahel, Swiss businessman and seminal thinker on environmentally responsible commerce; and Bob Fox, renowned architect.
Our leadership, knowledge and expertise in this area, especially in the “green building” movement and the related LEED certification program, resonate deeply with many of our customers and prospects around the globe, and these businesses are increasingly making purchase decisions based on “green” factors. As more customers in our target markets share our view that sustainability is good business and not just good deeds, our acknowledged leadership position should strengthen our brands and provide a differentiated advantage in competing for business.
In 2006, we launched InterfaceRAISE™, our consulting business that helps clients imagine, plan and execute new ways of advancing business goals while responding to the needs of society and the environment. The operations of this business are not a significant percentage of our consolidated operations.
Backlog
Our backlog of unshipped orders was approximately $112.5 million at February 28, 2010, compared with approximately $100.3 million at March 1, 2009. Historically, backlog is subject to significant fluctuations due to the timing of orders for individual large projects and currency fluctuations. All of the backlog orders at February 28, 2010 are expected to be shipped during the succeeding six to nine months.
Patents and Trademarks
We own numerous patents in the United States and abroad on floorcovering products and on manufacturing processes. The duration of United States patents is between 14 and 20 years from the date of filing of a patent application or issuance of the patent; the duration of patents issued in other countries varies from country to country. We maintain an active patent and trade secret program in order to protect our proprietary technology, know-how and trade secrets. Although we consider our patents to be very valuable assets, we consider our know-how and technology even more important to our current business than patents, and, accordingly, believe that expiration of existing patents or nonissuance of patents under pending applications would not have a material adverse effect on our operations.
10
We also own many trademarks in the United States and abroad. In addition to the United States, the primary countries in which we have registered our trademarks are the United Kingdom, Germany, Italy, France, Canada, Australia, Japan, and various countries in Central and South America. Some of our more prominent registered trademarks include: Interface®, InterfaceFLOR, Heuga, Intersept, GlasBac, Bentley Prince Street, FLOR, Intercell, and Mission Zero. Trademark registrations in the United States are valid for a period of 10 years and are renewable for additional 10-year periods as long as the mark remains in actual use. The duration of trademarks registered in other countries varies from country to country.
Financial Information by Operating Segments and Geographic Areas
The Notes to Consolidated Financial Statements appearing in Item 8 of this Report set forth information concerning our sales, income and assets by operating segments, and our sales and long-lived assets by geographic areas. Additional information regarding sales by operating segment is set forth in Item 7, “Management’s Discussion and Analysis of Financial Condition and Results of Operations.”
Employees
At January 3, 2010, we employed a total of 3,099 employees worldwide. Of such employees, 1,697 were clerical, staff, sales, supervisory and management personnel and 1,402 were manufacturing personnel. We also utilized the services of 75 temporary personnel as of January 3, 2010.
Some of our production employees in Australia and the United Kingdom are represented by unions. In the Netherlands, a Works Council, the members of which are Interface employees, is required to be consulted by management with respect to certain matters relating to our operations in that country, such as a change in control of Interface Europe B.V. (our modular carpet subsidiary based in the Netherlands), and the approval of the Council is required for some of our actions, including changes in compensation scales or employee benefits. Our management believes that its relations with the Works Council, the unions and all of our employees are good.
Environmental Matters
Our operations are subject to laws and regulations relating to the generation, storage, handling, emission, transportation and discharge of materials into the environment. The costs of complying with environmental protection laws and regulations have not had a material adverse impact on our financial condition or results of operations in the past and are not expected to have a material adverse impact in the future. The environmental management systems of our floorcovering manufacturing facilities in LaGrange, Georgia, West Point, Georgia, City of Industry, California, Shelf, England, Northern Ireland, Australia, the Netherlands and Thailand are certified under ISO Standard No. 14001.
Executive Officers of the Registrant
Our executive officers, their ages as of January 3, 2010, and their principal positions with us are set forth below. Executive officers serve at the pleasure of the Board of Directors.
|
Name
|
Age
|
Principal Position(s)
|
|
Daniel T. Hendrix
|
55
|
President and Chief Executive Officer
|
|
Robert A. Coombs
|
51
|
Senior Vice President
|
|
Patrick C. Lynch
|
40
|
Senior Vice President and Chief Financial Officer
|
|
Lindsey K. Parnell
|
52
|
Senior Vice President
|
|
John R. Wells
|
48
|
Senior Vice President
|
|
Raymond S. Willoch
|
51
|
Senior Vice President-Administration, General Counsel and Secretary
|
|
Maria C. Davlantes
|
41
|
Chief Marketing Officer
|
Mr. Hendrix joined us in 1983 after having worked previously for a national accounting firm. He was promoted to Treasurer in 1984, Chief Financial Officer in 1985, Vice President-Finance in 1986, Senior Vice President in October 1995, Executive Vice President in October 2000, and President and Chief Executive Officer in July 2001. He was elected to the Board in October 1996 and has served on the Executive Committee of the Board since July 2001.
11
Mr. Coombs originally worked for us from 1988 to 1993 as a marketing manager for our Heuga carpet tile operations in the United Kingdom and later for all of our European floorcovering operations. In 1996, Mr. Coombs returned to us as Managing Director of our Australian operations. He was promoted in 1998 to Vice President-Sales and Marketing, Asia-Pacific, with responsibility for Australian operations and sales and marketing in Asia, which was followed by a promotion to Senior Vice President, Asia-Pacific. He was promoted to Senior Vice President, European Sales, in May 1999 and Senior Vice President, European Sales and Marketing, in April 2000. In February 2001, he was promoted to President and Chief Executive Officer of Interface Overseas Holdings, Inc. with responsibility for all of our floorcoverings operations in both Europe and the Asia-Pacific region, and he became a Vice President of Interface. In September 2002, Mr. Coombs relocated back to Australia, retaining responsibility for our floorcovering operations in the Asia-Pacific region while Mr. Parnell (see below) assumed responsibility for floorcovering operations in Europe. Mr. Coombs was promoted to Senior Vice President of Interface in July 2008.
Mr. Lynch joined us in 1996 after having previously worked for a national accounting firm. He became Assistant Corporate Controller in 1998 and Assistant Vice President and Corporate Controller in 2000. Mr. Lynch was promoted to Vice President and Chief Financial Officer in July 2001. Mr. Lynch was promoted to Senior Vice President in March 2007.
Mr. Parnell was the Production Director for Firth Carpets (our former European broadloom operations) at the time it was acquired by us in 1997. In 1998, Mr. Parnell was promoted to Vice President, Operations for the United Kingdom, and in 1999 he was promoted to Senior Vice President, Operations for our entire European floorcovering division. In September 2002, he was promoted to President and Chief Executive Officer of our floorcovering operations in Europe, and became a Vice President of Interface in October 2002. Mr. Parnell was promoted to Senior Vice President of Interface in July 2008.
Mr. Wells joined us in February 1994 as Vice President-Sales of Interface Flooring Systems, Inc. (now InterfaceFLOR, LLC), our principal U.S. modular carpet subsidiary. Mr. Wells was promoted to Senior Vice President-Sales & Marketing of Interface Flooring Systems in October 1994. He was promoted to Vice President of Interface and President of Interface Flooring Systems in July 1995. In March 1998, Mr. Wells was also named President of both Prince Street Technologies, Ltd. and Bentley Mills, Inc., making him President of all three of our U.S. carpet mills at that time. In November 1999, Mr. Wells was named Senior Vice President of Interface, and President and Chief Executive Officer of Interface Americas Holdings, LLC (formerly Interface Americas, Inc.), thereby assuming operations responsibility for all of our floorcovering businesses in the Americas.
Mr. Willoch, who previously practiced with an Atlanta law firm, joined us in June 1990 as Corporate Counsel. He was promoted to Assistant Secretary in 1991, Assistant Vice President in 1993, Vice President in January 1996, Secretary and General Counsel in August 1996, and Senior Vice President in February 1998. In July 2001, he was named Senior Vice President-Administration and assumed corporate responsibility for various staff functions.
Ms. Davlantes joined us in May 2008 as Senior Vice President of Marketing for FLOR, our residential carpet tile business. In November 2009, she was promoted to Chief Marketing Officer of Interface, Inc., while still maintaining her responsibilities at FLOR. Prior to joining us, Ms. Davlantes had acquired 17 years of marketing experience with Spiegel, McKinsey & Company, Charcol and BP.
Available Information
We make available free of charge on or through our Internet website our annual report on Form 10-K, quarterly reports on Form 10-Q, current reports on Form 8-K and amendments to those reports filed or furnished pursuant to Section 13(a) or 15(d) of the Securities Exchange Act of 1934 as soon as reasonably practicable after we electronically file such material with, or furnish it to, the SEC. Our Internet address is http://www.interfaceglobal.com.
12
Forward-Looking Statements
This report on Form 10-K contains “forward-looking statements” within the meaning of the Securities Act of 1933, and the Securities Exchange Act of 1934, and the Private Securities Litigation Reform Act of 1995. Words such as “believes,” “anticipates,” “plans,” “expects” and similar expressions are intended to identify forward-looking statements. Forward-looking statements include statements regarding the intent, belief or current expectations of our management team, as well as the assumptions on which such statements are based. Any forward-looking statements are not guarantees of future performance and involve a number of risks and uncertainties that could cause actual results to differ materially from those contemplated by such forward-looking statements. We undertake no obligation to update or revise forward-looking statements to reflect changed assumptions, the occurrence of unanticipated events or changes to future operating results over time. Important factors currently known to management that could cause actual results to differ materially from those in forward-looking statements include risks and uncertainties associated with economic conditions in the commercial interiors industry as well as the risks and uncertainties discussed in Item 1A, “Risk Factors”.
ITEM 1A. RISK FACTORS
You should carefully consider the following factors, in addition to the other information included in this Annual Report on Form 10-K and the documents incorporated herein by reference, before deciding whether to purchase our common stock. Any or all of the following risk factors could have a material adverse effect on our business, financial condition, results of operations and prospects.
Sales of our principal products have been and may continue to be affected by adverse economic cycles in the renovation and construction of commercial and institutional buildings.
Sales of our principal products are related to the renovation and construction of commercial and institutional buildings. This activity is cyclical and has been affected by the strength of a country’s or region’s general economy, prevailing interest rates and other factors that lead to cost control measures by businesses and other users of commercial or institutional space. The effects of cyclicality upon the corporate office segment tend to be more pronounced than the effects upon the institutional segment. Historically, we have generated more sales in the corporate office segment than in any other market. The effects of cyclicality upon the new construction segment of the market also tend to be more pronounced than the effects upon the renovation segment. The adverse cycle during the years 2001 through 2003 significantly lessened the overall demand for commercial interiors products, which adversely affected our business during those years. These effects may recur and could be more pronounced if the current global economic conditions do not improve or are further weakened.
The ongoing worldwide financial and credit crisis could have a material adverse effect on our business, financial condition and results of operations.
The ongoing worldwide financial and credit crisis has reduced the availability of liquidity and credit to fund the continuation and expansion of many business operations worldwide. This shortage of liquidity and credit, combined with recent substantial losses in worldwide equity markets, could lead to an extended worldwide economic recession and result in a material adverse effect on our business, financial condition and results of operations. Specifically, the limited availability of credit and liquidity adversely affects the ability of customers and suppliers to obtain financing for significant purchases and operations. Consequently, customers may defer, delay or cancel renovation and construction projects where our carpet is used, resulting in decreased orders and sales for us, and they also may not be able to pay us for those products and services we already have provided to them. For the same reasons, suppliers may not be able to produce and deliver raw materials and other goods and services that we have ordered from them, thus disrupting our own manufacturing operations. In addition, our ability to obtain funding from capital markets may be severely restricted at a time when we would like, or need, to access those markets. This inability to obtain that funding could prevent us from pursuing important strategic growth plans, from reacting to changing economic and business conditions, and from refinancing existing debt (which in turn could lead to a default on our debt). The financial and credit crisis also could have an impact on the lenders under our credit facilities, causing them to fail to meet their obligations to provide us with loans and letters of credit, which are important sources of liquidity for us.
Our domestic revolving credit facility matures in December 2012, our outstanding 11 3/8% Senior Secured Notes mature in November 2013, and our outstanding 9.5% Senior Subordinated Notes mature in February 2014. We cannot assure you that we will be able to renegotiate or refinance any of this debt on commercially reasonable terms, or at all, especially given the ongoing worldwide financial and credit crisis.
13
We compete with a large number of manufacturers in the highly competitive commercial floorcovering products market, and some of these competitors have greater financial resources than we do.
The commercial floorcovering industry is highly competitive. Globally, we compete for sales of floorcovering products with other carpet manufacturers and manufacturers of other types of floorcovering. Although the industry has experienced significant consolidation, a large number of manufacturers remain in the industry. Some of our competitors, including a number of large diversified domestic and foreign companies who manufacture modular carpet as one segment of their business, have greater financial resources than we do.
Our success depends significantly upon the efforts, abilities and continued service of our senior management executives and our principal design consultant, and our loss of any of them could affect us adversely.
We believe that our success depends to a significant extent upon the efforts and abilities of our senior management executives. In addition, we rely significantly on the leadership that David Oakey of David Oakey Designs provides to our internal design staff. Specifically, David Oakey Designs provides product design/production engineering services to us under an exclusive consulting contract that contains non-competition covenants. Our current agreement with David Oakey Designs extends to April 2011. The loss of any of these key persons could have an adverse impact on our business because each has a great deal of knowledge, training and experience in the carpet industry – particularly in the areas of sales, marketing, operations, product design and management – and could not easily or quickly be replaced.
Our substantial international operations are subject to various political, economic and other uncertainties that could adversely affect our business results, including by restrictive taxation or other government regulation and by foreign currency fluctuations.
We have substantial international operations. In 2009, approximately 49% of our net sales and a significant portion of our production were outside the United States, primarily in Europe and Asia-Pacific. Our corporate strategy includes the expansion and growth of our international business on a worldwide basis. As a result, our operations are subject to various political, economic and other uncertainties, including risks of restrictive taxation policies, changing political conditions and governmental regulations. We also make a substantial portion of our net sales in currencies other than U.S. dollars (approximately 47% of 2009 net sales), which subjects us to the risks inherent in currency translations. The scope and volume of our global operations make it impossible to eliminate completely all foreign currency translation risks as an influence on our financial results.
Large increases in the cost of petroleum-based raw materials could adversely affect us if we are unable to pass these cost increases through to our customers.
Petroleum-based products comprise the predominant portion of the cost of raw materials that we use in manufacturing. While we attempt to match cost increases with corresponding price increases, continued volatility in the cost of petroleum-based raw materials could adversely affect our financial results if we are unable to pass through such price increases to our customers.
Unanticipated termination or interruption of any of our arrangements with our primary third party suppliers of synthetic fiber could have a material adverse effect on us.
The unanticipated termination or interruption of any of our supply arrangements with our current suppliers of synthetic fiber (nylon), which typically are not pursuant to long-term agreements, could have a material adverse effect on us because we do not have the capability to manufacture our own fiber for use in our carpet products. If any of our supply arrangements with our primary suppliers of synthetic fiber is terminated or interrupted, we likely would incur increased manufacturing costs and experience delays in our manufacturing process (thus resulting in decreased sales and profitability) associated with shifting more of our synthetic fiber purchasing to another synthetic fiber supplier.
14
We have a significant amount of indebtedness, which could have important negative consequences to us.
Our significant indebtedness could have important negative consequences to us, including:
|
·
|
making it more difficult for us to satisfy our obligations with respect to such indebtedness;
|
|
·
|
increasing our vulnerability to adverse general economic and industry conditions;
|
|
·
|
limiting our ability to obtain additional financing to fund capital expenditures, acquisitions or other growth initiatives, and other general corporate requirements;
|
|
·
|
requiring us to dedicate a substantial portion of our cash flow from operations to interest and principal payments on our indebtedness, thereby reducing the availability of our cash flow to fund capital expenditures, acquisitions or other growth initiatives, and other general corporate requirements;
|
|
·
|
limiting our flexibility in planning for, or reacting to, changes in our business and the industry in which we operate;
|
|
·
|
placing us at a competitive disadvantage compared to our less leveraged competitors; and
|
|
·
|
limiting our ability to refinance our existing indebtedness as it matures.
|
The terms of our primary revolving credit facility in the U.S. and the indentures governing our 9.5% Senior Subordinated Notes due 2014 and our 11 3/8% Senior Secured Notes due 2013 govern our ability and the ability of our subsidiaries to, among other things, incur additional indebtedness, pay dividends or make certain other restricted payments or investments in certain situations, consummate certain asset sales, enter into certain transactions with affiliates, create liens, merge or consolidate with any other person, or sell, assign, transfer, lease, convey or otherwise dispose of all or substantially all of our assets. They also require us to comply with certain other reporting, affirmative and negative covenants and, at times, meet certain financial tests. If we fail to satisfy these tests or comply with these covenants, a default may occur, in which case the lenders could accelerate the debt as well as any other debt to which cross-acceleration or cross-default provisions apply. We cannot assure you that we would be able to renegotiate, refinance or otherwise obtain the necessary funds to satisfy these obligations.
The market price of our common stock has been volatile and the value of your investment may decline.
The market price of our Class A common stock has been volatile in the past and may continue to be volatile going forward. Such volatility may cause precipitous drops in the price of our Class A common stock on the Nasdaq Global Select Market and may cause your investment in our common stock to lose significant value. As a general matter, market price volatility has had a significant effect on the market values of securities issued by many companies for reasons unrelated to their operating performance. We thus cannot predict the market price for our common stock going forward.
Our earnings in a future period could be adversely affected by non-cash adjustments to goodwill, if a future test of goodwill assets indicates a material impairment of those assets.
As prescribed by accounting standards governing goodwill and other intangible assets, we undertake an annual review of the goodwill asset balance reflected in our financial statements. Our review is conducted during the fourth quarter of the year, unless there has been a triggering event prescribed by applicable accounting rules that warrants an earlier interim testing for possible goodwill impairment. In the past, we have had non-cash adjustments for goodwill impairment as a result of such testings ($61.2 million in 2008, $44.5 million in 2007, and $20.7 million in 2006). A future goodwill impairment test may result in a future non-cash adjustment, which could adversely affect our earnings for any such future period.
Our Chairman currently has sufficient voting power to elect a majority of our Board of Directors.
Our Chairman, Ray C. Anderson, beneficially owns approximately 54% of our outstanding Class B common stock. The holders of the Class B common stock are entitled, as a class, to elect a majority of our Board of Directors. Therefore, Mr. Anderson has sufficient voting power to elect a majority of the Board of Directors. On all other matters submitted to the shareholders for a vote, the holders of the Class B common stock generally vote together as a single class with the holders of the Class A common stock. Mr. Anderson’s beneficial ownership of the outstanding Class A and Class B common stock combined is approximately 6%.
15
Our Rights Agreement could discourage tender offers or other transactions for our stock that could result in shareholders receiving a premium over the market price for our stock.
Our Board of Directors has adopted a Rights Agreement pursuant to which holders of our common stock will be entitled to purchase from us a fraction of a share of our Series B Participating Cumulative Preferred Stock if a third party acquires beneficial ownership of 15% or more of our common stock without our consent. In addition, the holders of our common stock will be entitled to purchase the stock of an Acquiring Person (as defined in the Rights Agreement) at a discount upon the occurrence of triggering events. These provisions of the Rights Agreements could have the effect of discouraging tender offers or other transactions that could result in shareholders receiving a premium over the market price for our common stock.
ITEM 1B. UNRESOLVED STAFF COMMENTS
None.
ITEM 2. PROPERTIES
We maintain our corporate headquarters in Atlanta, Georgia in approximately 20,000 square feet of leased space. The following table lists our principal manufacturing facilities and other material physical locations (some locations are comprised of multiple buildings), all of which we own except as otherwise noted:
|
Location
|
Segment
|
Floor Space(Sq. Ft.)
|
||||
|
Bangkok, Thailand(1)
|
Modular Carpet
|
275,946 | ||||
|
Craigavon, N. Ireland(2)
|
Modular Carpet
|
80,986 | ||||
|
LaGrange, Georgia
|
Modular Carpet
|
539,545 | ||||
|
LaGrange, Georgia(2)
|
Modular Carpet
|
209,337 | ||||
|
Picton, Australia
|
Modular Carpet
|
98,774 | ||||
|
Scherpenzeel, the Netherlands
|
Modular Carpet
|
245,420 | ||||
|
Scherpenzeel, the Netherlands(2)
|
Modular Carpet
|
121,515 | ||||
|
Shelf, England
|
Modular Carpet
|
206,882 | ||||
|
West Point, Georgia
|
Modular Carpet
|
250,000 | ||||
|
City of Industry, California(2)
|
Bentley Prince Street
|
558,596 | ||||
__________
|
(1)
|
Owned by a joint venture in which we have a 70% interest.
|
|
(2)
|
Leased.
|
We maintain marketing offices in over 70 locations in over 30 countries and distribution facilities in approximately 40 locations in six countries. Most of our marketing locations and many of our distribution facilities are leased. We are currently constructing a modular carpet manufacturing facility in Taicang, China, which we anticipate will be completed in 2010. This will be a leased facility comprised of approximately 54,000 square feet. We also have a 78,389 square foot manufacturing facility in Belleville, Canada, where we have ceased operations.
We believe that our manufacturing and distribution facilities and our marketing offices are sufficient for our present operations. We will continue, however, to consider the desirability of establishing additional facilities and offices in other locations around the world as part of our business strategy to meet expanding global market demands. Substantially all of our owned properties in the United States, Europe and Australia are subject to mortgages, which secure borrowings under our debt instruments.
ITEM 3. LEGAL PROCEEDINGS
We are subject to various legal proceedings in the ordinary course of business, none of which is required to be disclosed under this Item 3.
ITEM 4. RESERVED
16
PART II
|
ITEM 5.
|
MARKET FOR THE REGISTRANT’S COMMON EQUITY, RELATED STOCKHOLDER MATTERS AND ISSUER PURCHASES OF EQUITY SECURITIES
|
Our Class A Common Stock is traded on the Nasdaq Global Select Market under the symbol IFSIA. Our Class B Common Stock is not publicly traded but is convertible into Class A Common Stock on a one-for-one basis. As of March 1, 2010, we had 671 holders of record of our Class A Common Stock and 67 holders of record of our Class B Common Stock. We estimate that there are in excess of 6,500 beneficial holders of our Class A Common Stock. The following table sets forth, for the periods indicated, the high and low intraday prices of the Company’s Class A Common Stock on the Nasdaq Global Select Market as well as dividends paid during such periods.
|
High
|
Low
|
Dividends Per Share
|
||||||||||
|
2010
|
||||||||||||
|
First Quarter (through March 1, 2010)
|
$ | 9.15 | $ | 7.05 | -- | |||||||
|
2009
|
||||||||||||
|
Fourth Quarter
|
$ | 8.99 | $ | 6.90 | $ | 0.0025 | ||||||
|
Third Quarter
|
9.01 | 5.22 | 0.0025 | |||||||||
|
Second Quarter
|
7.02 | 3.08 | 0.0025 | |||||||||
|
First Quarter
|
5.12 | 1.45 | 0.0025 | |||||||||
|
2008
|
||||||||||||
|
Fourth Quarter
|
$ | 11.80 | $ | 3.63 | $ | 0.03 | ||||||
|
Third Quarter
|
13.85 | 11.04 | 0.03 | |||||||||
|
Second Quarter
|
15.00 | 12.10 | 0.03 | |||||||||
|
First Quarter
|
18.00 | 13.11 | 0.03 | |||||||||
On February 25, 2009, our Board reduced the quarterly dividend from $0.03 per share to $0.0025 per share. Future declaration and payment of dividends is at the discretion of our Board, and depends upon, among other things, our investment policy and opportunities, results of operations, financial condition, cash requirements, future prospects, and other factors that may be considered relevant by our Board at the time of its determination. Such other factors include limitations contained in the agreement for our primary revolving credit facility and in the indentures for our public indebtedness, each of which specify conditions as to when any dividend payments may be made. As such, we may discontinue our dividend payments in the future if our Board determines that a cessation of dividend payments is proper in light of the factors indicated above.
During the past three years, we have issued the following shares of Class B Common Stock to our employees in exchange for shares of Class A Common Stock on a one-for-one basis: 30,000 shares on August 2, 2007; 47,708 shares on August 14, 2007; 8,500 shares on August 23, 2007; 45,600 shares on May 18, 2009; and 855 shares on December 16, 2009. The transactions were exempt from registration pursuant to Section 3(a)(9) of the Securities Act of 1933, as each involved a security exchanged by the Company with its existing shareholder exclusively where no commission or other remuneration was paid or given directly or indirectly. Shares of Class B Common Stock are convertible into Class A Common Stock on a one-for-one basis.
17
Stock Performance
The following graph and table compare, for the five-year period ended January 3, 2010, the Company’s total returns to shareholders (stock price plus dividends, divided by beginning stock price) with that of (i) all companies listed on the Nasdaq Composite Index, and (ii) a self-determined peer group comprised primarily of companies in the commercial interiors industry, assuming an initial investment of $100 in each on January 2, 2005.
Comparison of 5 Year Cumulative Total Return
Assumes Initial Investment of $100
January 2010
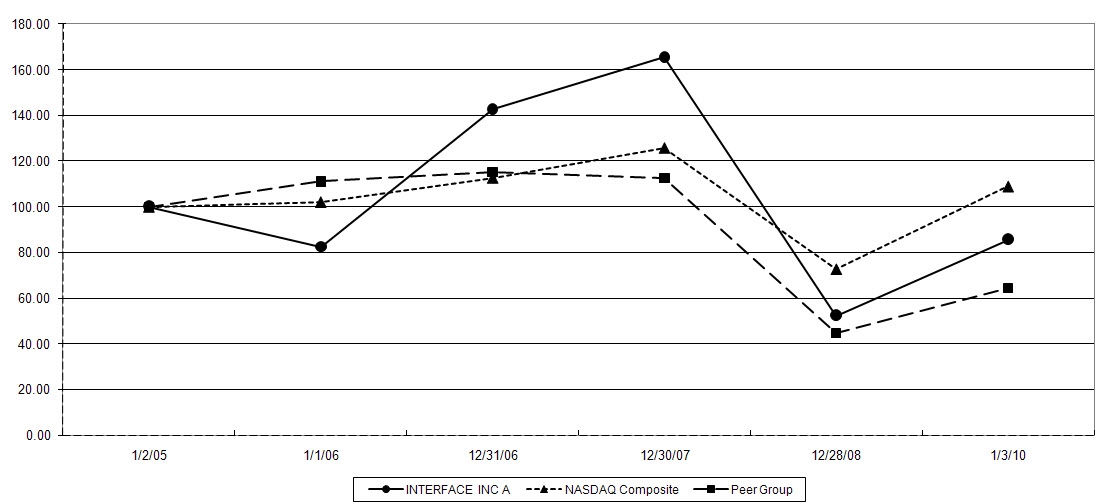
|
1/02/05
|
1/01/06
|
12/31/06
|
12/30/07
|
12/28/08
|
1/3/10
|
|
|
Interface, Inc.
|
$100
|
$82
|
$143
|
$166
|
$ 52
|
$ 86
|
|
NASDAQ Composite Index
|
$100
|
$102
|
$113
|
$126
|
$ 73
|
$109
|
|
Self-Determined Peer Group (13 Stocks)
|
$100
|
$111
|
$115
|
$113
|
$ 45
|
$ 65
|
Notes to Performance Graph
|
(1)
|
The lines represent annual index levels derived from compound daily returns that include all dividends.
|
|
(2)
|
The indices are re-weighted daily, using the market capitalization on the previous trading day.
|
|
(3)
|
If the annual interval, based on the fiscal year-end, is not a trading day, the preceding trading day is used.
|
|
(4)
|
The index level was set to $100 as of 1/02/05 (the last day of fiscal 2004).
|
|
(5)
|
The Company’s fiscal year ends on the Sunday nearest December 31.
|
|
(6)
|
The following companies are included in the Self-Determined Peer Group depicted above: Actuant Corp.; Acuity Brands, Inc.; Albany International Corp., BE Aerospace, Inc.; The Dixie Group, Inc.; Herman Miller, Inc.; HNI Corporation (formerly known as Hon Industries, Inc.); Kimball International, Inc.; Knoll, Inc. (beginning in March, 2005 upon trading commencement); Mohawk Industries, Inc.; Steelcase, Inc.; Unifi, Inc.; and USG Corp.
|
18
ITEM 6. SELECTED FINANCIAL DATA
We derived the summary consolidated financial data presented below from our audited consolidated financial statements and the notes thereto for the years indicated. You should read the summary financial data presented below together with the audited consolidated financial statements and notes thereto included within this document. Amounts for all periods presented have been adjusted for discontinued operations.
|
Selected Financial Data(1)
|
||||||||||||||||||||
|
2009
|
2008
|
2007
|
2006
|
2005
|
||||||||||||||||
|
(in thousands, except per share data and ratios)
|
||||||||||||||||||||
|
Net sales
|
$ | 859,888 | $ | 1,082,344 | $ | 1,081,273 | $ | 914,659 | $ | 786,924 | ||||||||||
|
Cost of sales
|
576,871 | 710,299 | 703,751 | 603,551 | 527,647 | |||||||||||||||
|
Operating income(2)
|
62,994 | 41,659 | 129,391 | 99,621 | 77,716 | |||||||||||||||
|
Income (loss) from continuing operations(3)(4)
|
12,673 | (34,513 | ) | 58,972 | 36,235 | 15,933 | ||||||||||||||
|
Loss from discontinued operations, net of tax(5)
|
(909 | ) | (5,154 | ) | (68,660 | ) | (24,092 | ) | (12,107 | ) | ||||||||||
|
Loss on disposal of discontinued operations
|
-- | -- | -- | (1,723 | ) | (1,935 | ) | |||||||||||||
|
Net income (loss) attributable to Interface, Inc.
|
10,918 | (40,873 | ) | (10,812 | ) | 9,992 | 1,240 | |||||||||||||
|
Income (loss) from continuing operations per common share attributable to Interface, Inc.(6)
|
||||||||||||||||||||
|
Basic
|
$ | 0.19 | $ | (0.58 | ) | $ | 0.94 | $ | 0.65 | $ | 0.29 | |||||||||
|
Diluted
|
$ | 0.19 | $ | (0.58 | ) | $ | 0.93 | $ | 0.64 | $ | 0.28 | |||||||||
|
Average Shares Outstanding(6)
|
||||||||||||||||||||
|
Basic
|
63,213 | 61,439 | 61,425 | 55,398 | 53,022 | |||||||||||||||
|
Diluted
|
63,308 | 61,439 | 61,938 | 56,374 | 53,955 | |||||||||||||||
|
Cash dividends per common share
|
$ | 0.01 | $ | 0.12 | $ | 0.08 | $ | -- | $ | -- | ||||||||||
|
Property additions
|
8,753 | 29,300 | 40,592 | 28,540 | 19,354 | |||||||||||||||
|
Depreciation and amortization
|
25,189 | 23,664 | 22,487 | 21,750 | 20,448 | |||||||||||||||
|
Balance Sheet Data
|
||||||||||||||||||||
|
Working capital
|
$ | 236,630 | $ | 221,323 | $ | 238,578 | $ | 380,253 | $ | 317,668 | ||||||||||
|
Total assets
|
727,239 | 706,035 | 835,232 | 928,340 | 838,990 | |||||||||||||||
|
Total long-term debt
|
280,184 | 287,588 | 310,000 | 411,365 | 458,000 | |||||||||||||||
|
Shareholders’ equity(4)
|
246,181 | 217,437 | 301,116 | 279,900 | 176,485 | |||||||||||||||
|
Current ratio(7)
|
2.6 | 2.4 | 2.3 | 3.2 | 3.0 | |||||||||||||||
__________
|
(1)
|
In the third quarter of 2007, we sold substantially all of the assets related to our Fabrics Group business segment. The balances have been adjusted to reflect the discontinued operations of this business. For further analysis, see “Notes to Consolidated Financial Statements – Discontinued Operations” included in Item 8 of this Report.
|
|
(2)
|
In the first quarter of 2009, we recorded a restructuring charge of $5.7 million. In the second quarter of 2009, we recorded a restructuring charge of $1.9 million. In the second quarter of 2009, we recorded income from litigation settlements of $5.9 million. In the fourth quarter of 2008, we recorded a restructuring charge of $11.0 million. Also in the fourth quarter of 2008, we recorded an impairment charge of $61.2 million related to the goodwill of our Bentley Prince Street business segment. In the first quarter of 2007, we disposed of our Pandel business, which comprised our Specialty Products business segment, and recognized a loss of $1.9 million on this disposition.
|
|
(3)
|
Included in the 2008 loss from continuing operations is tax expense of $13.3 million related to the anticipated repatriation in 2009 of foreign earnings. For further analysis, see “Notes to Consolidated Financial Statements – Taxes on Income” included in Item 8 of this Report.
|
|
(4)
|
Amounts for all periods presented have been adjusted to reflect the adoption of a new accounting standard that governs the treatment of non-controlling interests in subsidiaries. This standard was adopted by us in the first quarter of 2009.
|
|
(5)
|
Included in loss from discontinued operations, net of tax, are goodwill and other intangible asset impairment charges of $48.3 million in 2007 and $20.7 million in 2006. Also included in loss from discontinued operations, net of tax, are charges for write-offs and impairments of other assets of $5.2 million in 2008 and $8.8 million in 2007.
|
|
(6)
|
Amounts for all periods presented have been adjusted to reflect the adoption of a new accounting standard regarding the treatment of unvested restricted shares which have the right to receive dividends. This standard was adopted by us in the first quarter of 2009.
|
|
(7)
|
For purposes of computing our current ratio: (a) current assets include assets of businesses held for sale of $1.5 million, $3.2 million, $4.8 million, $158.3 million and $204.6 million in fiscal years 2009, 2008, 2007, 2006 and 2005, respectively, and (b) current liabilities include liabilities of businesses held for sale of $0.2 million, $22.9 million and $36.8 million in fiscal years 2007, 2006 and 2005, respectively.
|
19
|
ITEM 7.
|
MANAGEMENT’S DISCUSSION AND ANALYSIS OF FINANCIAL CONDITION AND RESULTS OF OPERATIONS
|
General
Our revenues are derived from sales of floorcovering products, primarily modular and broadloom carpet. Our business, as well as the commercial interiors industry in general, is cyclical in nature and is impacted by economic conditions and trends that affect the markets for commercial and institutional business space. The commercial interiors industry, including the market for floorcovering products, is largely driven by reinvestment by corporations into their existing businesses in the form of new fixtures and furnishings for their workplaces. In significant part, the timing and amount of such reinvestments are impacted by the profitability of those corporations. As a result, macroeconomic factors such as employment rates, office vacancy rates, capital spending, productivity and efficiency gains that impact corporate profitability in general, also affect our business.
During the past several years, we have successfully focused more of our marketing and sales efforts on non-corporate office segments to reduce somewhat our exposure to economic cycles that affect the corporate office market segment more adversely, as well as to capture additional market share. Our mix of corporate office versus non-corporate office modular carpet sales in the Americas has shifted over the past several years to 40% and 60%, respectively, for 2009 compared with 64% and 36%, respectively, in 2001. Company-wide, our mix of corporate office versus non-corporate office sales was 55% and 45%, respectively, in 2009. We expect a further shift in the future as we continue to implement our market diversification strategy.
After a downturn during the years 200l-2003, the commercial interiors industry began a recovery that continued at a gradual pace from 2005 through the first half of 2008, which led to improved sales and operating profitability for us during that recovery. In the fourth quarter of 2008, and particularly in November and December, the worldwide financial and credit crisis caused many corporations, governments and other organizations to delay or curtail spending on renovation and construction projects where our carpet is used. This downturn, which continued throughout 2009, negatively impacted our performance and led to the goodwill impairment and restructuring charges, discussed below, that we incurred in the fourth quarter of 2008 and the first half of 2009.
During 2009, we had net sales of $859.9 million, compared with $1.1 billion in 2008. Operating income for 2009 was $63.0 million, compared with operating income of $41.7 million in 2008. Income from continuing operations in 2009 was $12.7 million, or $0.19 per diluted share, compared with a loss from continuing operations of $34.5 million, or $0.58 per share, in 2008. Net income attributable to Interface, Inc. was $10.9 million, or $0.17 per diluted share, in 2009, compared with a net loss attributable to Interface, Inc. of $40.9 million, or $0.67 per share, in 2008.
Included in our results for 2009 are $7.6 million of restructuring charges and $6.1 million of costs related to the tender offer for our 10.375% Senior Notes, each of which is discussed below. In addition, our results for 2009 include income of $5.9 million related to settlements of patent litigation. The $5.9 million of income from litigation settlements is the net amount after deducting all legal fees and related expenses. (We received $16.0 million of gross proceeds from these settlements.) Included in our results for 2008 are a goodwill impairment charge of $61.2 million, restructuring charges of $11.0 million, and a repatriation charge of $13.3 million, each of which is discussed below.
Restructuring Charges
2008 Restructuring Plan
In the fourth quarter of 2008, we committed to a restructuring plan intended to reduce costs across our worldwide operations, and more closely align our operations with reduced demand levels. The reduction of the demand levels is primarily a result of the worldwide recession and the associated delays and reductions in the number of construction projects where our carpet products are used. The plan primarily consists of ceasing manufacturing operations at our facility in Belleville, Canada, and reducing our worldwide employee base by a total of approximately 530 employees in the areas of manufacturing, sales and administration. In connection with the restructuring plan, we recorded a pre-tax restructuring charge in the fourth quarter of 2008 of $11.0 million. We record our restructuring accruals under the provisions of the applicable accounting standards. The restructuring charge was comprised of employee severance expense of $7.8 million, impairment of assets of $2.6 million, and other exit costs of $0.7 million (primarily related to lease exit costs and other closure activities). Approximately $8.3 million of the restructuring charge involved cash expenditures, primarily severance expense. Actions and expenses related to this plan were substantially completed in the first quarter of 2009.
20
2009 Restructuring Plan
In the first quarter of 2009, we adopted a restructuring plan, primarily comprised of a further reduction in our worldwide employee base by a total of approximately 290 employees and continuing actions taken to better align fixed costs with demand for our products on a global level. In connection with the plan, we recorded a pre-tax restructuring charge of $5.7 million, comprised of $4.0 million of employee severance expense and $1.7 million of other exit costs (primarily costs to exit the Canadian manufacturing facilities, lease exit costs and other costs). Approximately $5.2 million of the restructuring charge will involve cash expenditures, primarily severance expense. In the second quarter of 2009, we recorded an additional $1.9 million restructuring charge as a continuation of this plan. The charge in the second quarter of 2009 is due to approximately 80 additional employee reductions, and relates entirely to employee severance expense. The 2009 restructuring plan is expected to yield annualized cost savings of approximately $21 million.
Goodwill Impairment Write-Down
During the fourth quarters of 2009, 2008 and 2007, we performed the annual goodwill impairment test required by accounting standards. We perform this test at the reporting unit level, which is one level below the segment level for the Modular Carpet segment and at the level of the Bentley Prince Street segment. In effecting the impairment testing, we prepared valuations of reporting units on both a market comparable methodology and an income methodology in accordance with the applicable standards, and those valuations were compared with the respective book values of the reporting units to determine whether any goodwill impairment existed. In preparing the valuations, past, present and future expectations of performance were considered. In the fourth quarter of 2008, a goodwill impairment of $61.2 million related to our Bentley Prince Street reporting unit was identified due largely to the following factors:
|
·
|
There was a significant decline in Bentley Prince Street’s performance, primarily in the last three months of 2008. This decline also was reflected in the forward projections of Bentley Prince Street’s budgeting process. The projections showed a decline in both sales and operating income over Bentley Prince Street’s three-year budgeting process. These declines impacted the value of the business from an income valuation approach. The declines in projections were primarily related to the global economic crisis and its impact on the broadloom carpet market.
|
|
·
|
There was an increase in the discount rate used to create the present value of future expected cash flows. This increase from approximately 12% to 16% was more reflective of our market capitalization and risk premiums on a reporting unit level, which impacted the value of the business using an income valuation approach.
|
|
·
|
There was a decrease in the market multiple factors used for a market valuation approach. This decrease was reflective of the general market conditions regarding current market activities and market valuation guidelines.
|
Our other core modular carpet business reporting units maintained fair values in excess of their respective carrying values as of the fourth quarter of 2009, and therefore no impairment was indicated during their testing.
In 2007, we recorded charges of $44.5 million for goodwill impairment and $3.8 million for other impaired tangible assets related to the sale of our Fabrics Group business segment. As discussed below, these charges related to the Fabrics Group business segment are included as part of our loss from discontinued operations during those respective periods.
11 3/8% Senior Secured Notes
On June 5, 2009, we completed a private offering of $150 million aggregate principal amount of 11 3/8% Senior Secured Notes due 2013 (the “Senior Secured Notes”). Interest on the Senior Secured Notes is payable semi-annually on May 1 and November 1 (the first interest payment was on November 1, 2009). The Senior Secured Notes are guaranteed, jointly and severally, on a senior secured basis by certain of our domestic subsidiaries. The Senior Secured Notes are secured by a second-priority lien on substantially all of our and certain of our domestic subsidiaries’ assets that secure our domestic revolving credit facility (discussed below) on a first-priority basis.
21
The Senior Secured Notes were sold at a price of 96.301% of their face value, resulting in $144.5 million of gross proceeds. The $5.5 million original issue discount will be amortized over the life of the notes through interest expense. After deducting the initial purchasers’ discount and other fees and expenses associated with the sale, net proceeds were $139.5 million. We used $137.4 million of those net proceeds to repurchase $127.2 million aggregate principal amount of our 10.375% Senior Notes due 2010 pursuant to a tender offer we conducted. (Included in the $137.4 million used to repurchase the $127.2 million aggregate principal amount of 10.375% Senior Notes were a purchase price premium of $5.7 million and accrued interest of $4.5 million). The remaining $2.1 million of the net proceeds was used to repay a portion of the $14.6 million of 10.375% Senior Notes that remained outstanding following the tender offer. (The balance of the 10.375% Senior Notes was then repaid at maturity on February 1, 2010.)
Repatriation of Earnings of Foreign Subsidiaries
In the fourth quarter of 2008, we recorded a tax charge of approximately $13.3 million for the anticipated future repatriation of approximately $37 million of earnings from our Canadian and European subsidiaries. We anticipated repatriating most of these earnings in 2009 to accumulate cash in the United States in light of the then pending maturity of our 10.375% Senior Notes due February 2010. As a result, we determined that those earnings were no longer indefinitely reinvested outside of the U.S. and recorded the appropriate charge, in accordance with the provisions of applicable accounting standards. For additional information on this tax charge, see the Note entitled “Taxes on Income” in Item 8 of this Report.
Discontinued Operations
In the third quarter of 2007, we completed the sale of our Fabrics Group business segment to a third party pursuant to an agreement we entered into in the second quarter of 2007. Following working capital and other adjustments provided for in the agreement, we received $60.7 million in cash at the closing of the transaction. We initially recognized a $6.5 million receivable related to additional purchase price under the agreement pursuant to an earn-out arrangement focused on the performance of that business segment, as owned and operated by the purchaser, during the 18-month period following the closing. However, in the third quarter of 2008, we determined that the receipt of this deferred amount was less than probable and therefore reserved for the full amount of this deferred purchase price. As discussed in the Notes to Consolidated Financial Statements in Item 8 of Part II of this Report, in the first quarter of 2007, we recorded charges for impairment of goodwill of $44.5 million and impairment of other intangible assets of $3.8 million related to the Fabrics Group business segment. In addition, as a result of the agreed-upon purchase price for the segment, we recorded an additional impairment of assets of $13.6 million in the second quarter of 2007.
In accordance with applicable accounting standards, we have reported the results of operations for the former Fabrics Group business segment for all periods reflected herein, as “discontinued operations.” Consequently, our discussion of revenues or sales, taxes and other results of operations (except for net income or loss amounts), including percentages derived from or based on such amounts, excludes these discontinued operations unless we indicate otherwise.
Our discontinued operations had no net sales in 2009 and 2008, and had net sales of $82.0 million in 2007 (these results are included in our Consolidated Statements of Operations as part of the “Loss from Discontinued Operations, Net of Tax”). Loss from operations of these businesses, inclusive of goodwill impairments and other asset impairments as well as costs to sell these businesses, net of tax, was $0.9 million, $5.2 million and $68.7 million in 2009, 2008 and 2007, respectively. For additional information on discontinued operations, see the Notes entitled “Discontinued Operations,” “Sale of Fabrics Business” and “Taxes on Income” in Item 8 of this Report.
Sale of Pandel
In the first quarter of 2007, we sold our Pandel, Inc. business for $1.4 million and recorded a loss of $1.9 million on this sale. Pandel comprised our Specialty Products segment.
22
Analysis of Results of Operations
The following discussion and analyses reflect the factors and trends discussed in the preceding sections.
Our net sales that were denominated in currencies other than the U.S. dollar were approximately 47% in 2009, approximately 50% in 2008, and approximately 49% in 2007. Because we have such substantial international operations, we are impacted, from time to time, by international developments that affect foreign currency transactions. For example, the performance of the euro against the U.S. dollar, for purposes of the translation of European revenues into U.S. dollars, favorably affected our reported results during the years 2007-2008, when the euro was strengthening relative to the U.S. dollar. During the year 2009, the dollar strengthened versus the euro. The following table presents the amount (in U.S. dollars) by which the exchange rates for converting euros into U.S. dollars have affected our net sales and operating income during the past three years:
|
2009
|
2008
|
2007
|
||||||||||
|
(in millions)
|
||||||||||||
|
Net sales
|
$ | (13.8 | ) | $ | 24.5 | $ | 31.1 | |||||
|
Operating income
|
(1.0 | ) | 3.0 | 4.9 | ||||||||
The following table presents, as a percentage of net sales, certain items included in our Consolidated Statements of Operations during the past three years:
|
Fiscal Year
|
||||||||||||
|
|
2009
|
2008
|
2007
|
|||||||||
|
Net sales
|
100.0 | % | 100.0 | % | 100.0 | % | ||||||
|
Cost of sales
|
67.1 | 65.6 | 65.1 | |||||||||
|
Gross profit on sales
|
32.9 | 34.4 | 34.9 | |||||||||
|
Selling, general and administrative expenses
|
25.4 | 23.9 | 22.8 | |||||||||
|
Loss on disposal – Pandel
|
-- | -- | 0.2 | |||||||||
|
Impairment of goodwill
|
-- | 5.7 | -- | |||||||||
|
Restructuring charge
|
0.9 | 1.0 | -- | |||||||||
|
Income from litigation settlements
|
(0.7 | ) | -- | -- | ||||||||
|
Operating income
|
7.3 | 3.8 | 11.9 | |||||||||
|
Interest/Other expense
|
4.1 | 3.1 | 3.2 | |||||||||
|
Bond retirement expenses
|
0.7 | -- | -- | |||||||||
|
Income from continuing operations before tax
|
2.6 | 0.8 | 8.7 | |||||||||
|
Income tax expense
|
1.1 | 4.0 | 3.3 | |||||||||
|
Income (loss) from continuing operations
|
1.5 | (3.2 | ) | 5.5 | ||||||||
|
Discontinued operations, net of tax
|
(0.1 | ) | (0.5 | ) | (6.3 | ) | ||||||
|
Net income (loss)
|
1.4 | (3.7 | ) | (0.9 | ) | |||||||
|
Net income (loss) attributable to Interface, Inc.
|
1.3 | (3.8 | ) | (1.0 | ) | |||||||
Below we provide information regarding net sales for each of our three operating segments, and analyze those results for each of the last three fiscal years. Fiscal year 2009 was a 53-week period, while fiscal years 2008 and 2007 were 52-week periods. The 53 weeks in 2009 versus the 52 weeks in 2008 and 2007 are a factor in certain of the comparisons reflected below.
Net Sales by Business Segment
We currently classify our businesses into the following three operating segments for reporting purposes:
|
•
|
Modular Carpet segment, which includes our InterfaceFLOR, Heuga and FLOR modular carpet businesses, and also includes our Intersept antimicrobial chemical sales and licensing program;
|
|
|
•
|
Bentley Prince Street segment, which includes our Bentley Prince Street broadloom, modular carpet and area rug businesses; and
|
|
|
•
|
Specialty Products segment, which includes our former subsidiary Pandel, Inc. that we sold in March 2007.
|
23
Net sales by operating segment were as follows during the past three years:
|
Fiscal Year
|
Percentage Change
|
|||||||||||||||||||
|
(in thousands)
|
2009 compared
|
2008 compared
|
||||||||||||||||||
|
Net Sales By Segment
|
2009
|
2008
|
2007
|
with 2008
|
with 2007
|
|||||||||||||||
|
Modular Carpet
|
$ | 765,264 | $ | 946,816 | $ | 930,717 | (19.2 | %) | 1.7 | % | ||||||||||
|
Bentley Prince Street
|
94,624 | 135,528 | 148,364 | (30.2 | %) | (8.7 | %) | |||||||||||||
|
Specialty Products
|
-- | -- | 2,192 | -- | (100.0 | %) | ||||||||||||||
|
Total
|
$ | 859,888 | $ | 1,082,344 | $ | 1,081,273 | (20.6 | %) | 0.0 | % | ||||||||||
Modular Carpet Segment. For 2009, net sales for the Modular Carpet segment decreased $181.5 million (19.2%) versus 2008. This decline is primarily attributable to the reduced order activity for renovation and construction projects as a result of the worldwide financial and credit crisis. The weighted average selling price per square yard in 2009 was down 2.1% compared with 2008 as a result of the enhanced price sensitivity of our customers due to the financial and credit crisis. On a geographic basis, our net sales in the Americas were down 12%, primarily driven by the decline in the corporate office segment (23% decrease) as well as decreases in the hospitality (45% decrease) and healthcare (18% decrease) segments. These decreases were somewhat mitigated, however, by increases in the institutional (which includes education and government facilities, a 15% increase) and retail (7% increase) segments. Net sales in Europe were down 25% in local currency and 29% as reported in U.S. dollars, with this difference due to the strengthening of the U.S. dollar versus the euro and British Pound Sterling on a year-over-year basis. The sales decline in Europe occurred across most markets (and particularly the corporate office market, down 31% in local currency), with the exception of the healthcare and government markets which saw increases (in local currency) of 7% and 3%, respectively. Net sales in Asia-Pacific were down 18%, due primarily to the decrease in the corporate office segment (23% decrease), which comprises the majority of that division’s sales. This decrease was somewhat mitigated, however, by increases in the education (43% increase) and hospitality (13% increase) segments.
For 2008, net sales for the Modular Carpet segment increased $16.1 million (1.7%) versus 2007. The weighted average selling price per square yard in 2008 was up 4.6% compared with 2007 as a result of the premium positioning of our products in the marketplace and our ability to pass along increases in our raw material prices to our customers. On a geographic basis, our net sales in the Americas increased 2.0%, primarily as a result of increases into the institutional (which includes education and government facilities, a 16% increase), healthcare (9% increase) and other non-office markets that combined to more than offset the decline in the corporate office market (9% decrease). Net sales in Europe remained flat as reported in U.S. dollars, but declined 7% in local currencies primarily due to the downturn in the corporate office market (down 11% in local currency) which comprises the majority of that area’s sales. Asia-Pacific experienced a 10% sales increase, primarily due to the continued strength of the corporate office market (9% increase) and the success of our market diversification strategy, which saw significant increases in the retail (28% increase) and hospitality (85% increase) segments. Across all geographic regions (Americas, Europe and Asia-Pacific), sales began declining in the fourth quarter of 2008, as customers began delaying or reducing the number of renovation and construction projects where our carpet products are used, in response to the worldwide financial and credit crisis.
Bentley Prince Street Segment. For 2009, net sales in our Bentley Prince Street segment decreased $40.9 million (30.2%) versus 2008. This decrease is primarily attributable to the reduced order activity for renovation and construction projects as a result of the worldwide financial and credit crisis, as well as the general market movement away from broadloom carpet and toward carpet tile. This decrease was somewhat offset by a 2.4% increase in weighted average selling price per square yard, a result of the increase in modular carpet as a percentage of its sales (modular carpet represented 29% of its sales in 2009 versus 25% in 2008). With the exception of a 4% increase in the government segment, the sales decrease occurred across all markets, with the most significant declines being in the corporate (23% decrease), hospitality (72% decrease) and residential (68% decrease) segments.
For 2008, net sales in the Bentley Prince Street segment decreased $12.8 million (8.7%) versus 2007. This decrease was primarily due to lower sales volume of broadloom carpet, in line with the general decrease in demand for broadloom carpet, coupled with the impact of the downturn in demand in response to the worldwide financial and credit crisis. This decrease in volume was somewhat offset by an 8% increase in weighted average selling price per square yard, a result of the greater volume of higher-priced modular carpet in its product mix (modular carpet represented 25% of its sales in 2008 versus 21% in 2007) and the premium positioning of its products in the marketplace. The sales decrease occurred primarily in the corporate office (13% decrease) and retail (35% decrease) segments, and was somewhat offset by increases in the institutional (16% increase) and healthcare (18% increase) segments. In general, sales began declining in the fourth quarter of 2008, as customers began delaying or reducing the number of renovation and construction projects where our carpet products are used, in response to the worldwide financial and credit crisis.
Specialty Products Segment. Because we sold Pandel, Inc. (which comprised the Specialty Products segment) in March 2007, we had no sales in the Specialty Products segment in 2009, 2008 or after the first quarter of 2007. Thus, the segment is not comparable for the past two years.
24
Cost and Expenses
Company Consolidated. The following table presents, on a consolidated basis for our operations, our overall cost of sales and selling, general and administrative expenses during the past three years:
|
Cost and Expenses
|
Fiscal Year
|
Percentage Change
|
||||||||||||||||||
|
2009
|
2008
|
2007
|
2009 compared
with 2008
|
2008 compared
with 2007
|
||||||||||||||||
|
(in thousands)
|
||||||||||||||||||||
|
Cost of Sales
|
$ | 576,871 | $ | 710,299 | $ | 703,751 | (18.8 | %) | 0.9 | % | ||||||||||
|
Selling, General and Administrative Expenses
|
218,322 | 258,198 | 246,258 | (15.4 | %) | 4.8 | % | |||||||||||||
|
Total
|
$ | 795,193 | $ | 968,497 | $ | 950,009 | (17.9 | %) | 1.9 | % | ||||||||||
For 2009, our costs of sales decreased $133.4 million (18.8%) versus 2008. Fluctuations in currency exchange rates accounted for approximately 4% ($23 million) of this decrease. The primary components of the $133.4 million decrease in costs of sales were reductions in raw materials costs ($89 million) and labor costs ($13 million) associated with decreased production levels in 2009, largely a result of the worldwide financial and credit crisis that began in the fourth quarter of 2008. Our raw material prices in 2009 were approximately 4-6% lower than raw material prices in 2008. As a percentage of net sales, cost of sales increased to 67.1% during 2009 versus 65.6% during 2008. This percentage increase was due to under-absorption of fixed overhead costs associated with the lower production volumes.
For 2008, our cost of sales increased $6.5 million (0.9%) versus 2007. Our raw materials prices in 2008 were relatively consistent with raw material prices in 2007. The translation of euros into U.S. dollars resulted in an approximately $14.2 million increase in the cost of sales in 2008 compared with 2007. These increases were offset primarily by decreased variable production costs in absolute dollar terms in the fourth quarter of 2008, as production volumes were lower in that period than in the prior year period as a result of decreased sales activity. As a percentage of sales, cost of sales increased to 65.6% during 2008 versus 65.1% during 2007. The percentage increase was due to under-absorption of fixed overhead costs as a result of (1) lower production volumes in our American and European modular carpet operations, (2) additional fixed costs as a result of our plant expansion in our Asia-Pacific modular carpet operations, and (3) lower production volumes at the company’s Bentley Prince Street segment.
For 2009, our selling, general and administrative expenses decreased $39.9 million (15.4%) versus 2008. Fluctuations in currency exchange rates accounted for approximately 6% ($12 million) of this decrease. The primary components of the $39.9 million decrease were (1) a $19.7 million decrease in selling costs associated with the lower sales volume in 2009; (2) a $15.0 million decrease in marketing expenses as programs were cut or reduced in 2009 to better match anticipated demand; and (3) a $3.9 million decrease in general administrative costs, directly related to our 2008 and 2009 restructuring plans discussed above. Due to our lower sales volume in 2009, as a percentage of net sales, selling, general and administrative expenses increased to 25.4%, versus 23.9% in 2008.
For 2008, our selling, general and administrative expenses increased $11.9 million (4.8%) versus 2007. The primary components of this increase were: (1) a $7.2 million increase in expenses due to the translation of euros into U.S. dollars; (2) $6.3 million of increased marketing expenditures, primarily related to our continued focus on market diversification in Europe; (3) $3.5 million of increased selling costs associated with the increase in sales volume for the first nine months of the year versus the same period in 2007 (in the first nine months of 2008, selling expenses increased approximately $8.8 million and were offset by a $5.3 million decline in selling expenses in the fourth quarter of 2008 due to lower sales versus the year ago fourth quarter period); and (4) $2.4 million associated with the decline in cash surrender value of company-owned life insurance. These increases were somewhat offset by a $10.9 million decrease in incentive compensation in 2008 versus 2007 as performance targets were not achieved in 2008 to the same degree as in 2007. As a percentage of net sales, selling, general and administrative expenses increased to 23.9% for 2008, versus 22.8% for 2007, due to these same factors.
25
Cost and Expenses by Segment. The following table presents the combined cost of sales and selling, general and administrative expenses for each of our operating segments during the past three years:
|
Fiscal Year
|
Percentage Change
|
|||||||||||||||||||
|
Cost of Sales and Selling, General and Administrative Expenses (Combined)
|
2009
|
2008
|
2007
|
2009 compared
with 2008
|
2008 compared
with 2007
|
|||||||||||||||
|
(in thousands)
|
||||||||||||||||||||
|
Modular Carpet
|
$ | 690,265 | $ | 826,807 | $ | 797,060 | (16.5 | %) | 3.7 | % | ||||||||||
|
Bentley Prince Street
|
101,580 | 135,574 | 142,771 | (25.1 | %) | (5.0 | %) | |||||||||||||
|
Specialty Products
|
-- | -- | 2,052 | -- | (100.0 | %) | ||||||||||||||
|
Corporate Expenses
|
3,348 | 6,116 | 8,126 | (45.3 | %) | (24.7 | %) | |||||||||||||
|
Total
|
$ | 795,193 | $ | 968,497 | $ | 950,009 | (17.9 | %) | 1.9 | % | ||||||||||
Interest and Other Expense
For 2009, interest expense increased by $2.8 million versus 2008, primarily due to the issuance of our $150 million aggregate principal amount of 11 3/8% Senior Secured Notes in June of 2009. These notes, which were issued at a discount to their face value, carry a higher principal balance and rate of interest than the $127.2 million aggregate principal amount of 10.375% Senior Notes that were repaid with the issuance net proceeds. Other factors in the increase were the amortization of deferred debt costs related to the new Senior Secured Notes, and the fees we pay for our lines of credit.
For 2008, interest expense decreased by $2.6 million versus 2007, due to the lower average debt balance in 2008 versus 2007. The lower balance was primarily the result of the paydown of $79.0 million of our 7.3% Senior Notes in the third quarter of 2007 and the repurchase of $22.4 million of our 10.375% Senior Notes in the fourth quarter of 2008.
Tax
Our effective tax rate in 2009 was 42.5%, compared with an effective rate of 504.7% in 2008. This difference in effective rate was primarily attributable to (1) a non-deductible goodwill impairment charge in 2008 related to our Bentley Prince Street business, (2) a 2008 provision for taxes related to undistributed earnings from foreign subsidiaries no longer deemed to be indefinitely reinvested outside of the U.S., and (3) an increase in 2008 non-deductible business expenses related to a decrease in the cash surrender value of life insurance policies associated with the funding of our nonqualified savings plans and salary continuation plan. For additional information on taxes and a reconciliation of effective tax rates to statutory tax rates, see the Note entitled “Taxes on Income” in Item 8 of this Report.
Our effective tax rate in 2008 was 504.7%, compared with an effective rate of 37.6% in 2007. This increase in rate is primarily attributable to (1) a non-deductible goodwill impairment charge in 2008 related to our Bentley Prince Street business, (2) a 2008 provision for taxes related to undistributed earnings from foreign subsidiaries no longer deemed to be indefinitely reinvested outside of the U.S., (3) an increase in non-deductible business expenses related to the decrease in the cash surrender value of life insurance policies associated with the funding of our nonqualified savings plans and salary continuation plan, (4) an increase in the U.S. tax effects attributable to foreign operations related to Subpart F income, and (5) an increase in valuation allowances related to state net operating loss carryforwards. For additional information on taxes, see the Note entitled “Taxes on Income” in Item 8 of this Report.
Liquidity and Capital Resources
General
In our business, we require cash and other liquid assets primarily to purchase raw materials and to pay other manufacturing costs, in addition to funding normal course selling, general and administrative expenses, anticipated capital expenditures, interest expense and potential special projects. We generate our cash and other liquidity requirements primarily from our operations and from borrowings or letters of credit under our domestic revolving credit facility with a banking syndicate. We believe that we will be able to continue to enhance the generation of free cash flow through the following initiatives:
26
|
·
|
Improving our inventory turns by continuing to implement a made-to-order model throughout our organization;
|
|
|
·
|
Reducing our average days sales outstanding through improved credit and collection practices; and
|
|
|
·
|
Limiting the amount of our capital expenditures generally to those projects that have a short-term payback period.
|
Historically, we use more cash in the first half of the fiscal year, as we fund insurance premiums, tax payments, incentive compensation and inventory build-up in preparation for the holiday/vacation season of our international operations.
In addition, we have a high contribution margin business with low capital expenditure requirements. Contribution margin represents variable gross profit margin less the variable component of selling, general and administrative expenses, and for us is an indicator of profit on incremental sales after the fixed components of cost of goods sold and selling, general and administrative expenses have been recovered. While contribution margin should not be construed as a substitute for gross margin, which is determined in accordance with GAAP, it is included herein to provide additional information with respect to our potential for profitability. In addition, we believe that investors find contribution margin to be a useful tool for measuring our profitability on an operating basis.
Our ability to generate cash from operating activities is uncertain because we are subject to, and in the past have experienced, fluctuations in our level of net sales. In this regard, the worldwide financial and credit crisis that developed in the latter part of 2008 has resulted in a reduction in our net sales, as customers have delayed or reduced the number of renovation and construction projects where our carpet products are used. As a result, we cannot assure you that our business will generate cash flow from operations in an amount sufficient to enable us to pay the interest and principal on our debt, or to fund our other liquidity needs, over the long-term.
At January 3, 2010, we had $115.4 million in cash. At that date, we had no borrowings and $8.1 million in letters of credit outstanding under our domestic revolving credit facility, and no borrowings outstanding under our European credit facility. As of January 3, 2010, we could have incurred $54.2 million of additional borrowings under our domestic revolving credit facility and €26 million (approximately $37.3 million) of additional borrowings under our European credit facility. In addition, we could have incurred the equivalent of $10.5 million of borrowings under our other credit facilities in place at other non-U.S. subsidiaries.
We have approximately $82.5 million in contractual cash obligations due by the end of fiscal year 2010, which includes, among other things, pension cash contributions, interest payments on our debt and capital expenditure commitments. Based on current interest rate and debt levels, we expect our aggregate interest expense for 2010 to be between $31 million and $34 million. We estimate aggregate capital expenditures in 2010 to be between $25 million and $30 million, although we are not committed to these amounts.
In June 2009, we issued $150 million aggregate principal amount of our 11 3/8% Senior Secured Notes due 2013. After deducting the initial purchasers’ discount and other fees and expenses associated with the sale, net proceeds were $139.5 million. We used $137.4 million of those net proceeds to repurchase $127.2 million aggregate principal amount of our 10.375% Senior Notes due 2010 pursuant to a tender offer we conducted. (Included in the $137.4 million used to repurchase the $127.2 million aggregate principal amount of 10.375% Senior Notes were a purchase price premium of $5.7 million and accrued interest of $4.5 million). The remaining $2.1 million of the net proceeds was used to repay a portion of the $14.6 million of 10.375% Senior Notes that remained outstanding following the tender offer. (The balance of the 10.375% Senior Notes was then repaid at maturity on February 1, 2010.)
In July 2007, we sold our Fabrics Group business segment, and we received $60.7 million in cash at the closing of the transaction. In September 2007, we completed the redemption of all of our outstanding 7.3% Senior Notes due 2008.
It is important for you to consider that we have a significant amount of indebtedness. Our domestic revolving credit facility matures in December 2012, our outstanding 11 3/8% Senior Secured Notes mature in November 2013, and our outstanding 9.5% Senior Subordinated Notes mature in February 2014. We cannot assure you that we will be able to renegotiate or refinance any of our debt on commercially reasonable terms, or at all, especially given the unprecedented worldwide financial and credit crisis that developed in the second half of 2008 and its continuing impact on the availability of credit. If we are unable to refinance our debt or obtain new financing, we would have to consider other options, such as selling assets to meet our debt service obligations and other liquidity needs, or using cash, if available, that would have been used for other business purposes.
27
Domestic Revolving Credit Facility
We have a domestic revolving credit facility that provides for a maximum aggregate amount of loans and letters of credit of up to $100 million (with the option to increase it to a maximum of $150 million upon the satisfaction of certain conditions) at any one time, subject to the borrowing base described below. The key features of the domestic revolving credit facility are as follows:
|
·
|
The revolving credit facility currently matures on December 31, 2012;
|
|
·
|
The revolving credit facility includes a domestic U.S. dollar syndicated loan and letter of credit facility made available to Interface, Inc. up to the lesser of (1) $100 million, or (2) a borrowing base equal to the sum of specified percentages of eligible accounts receivable and inventory in the United States (the percentages and eligibility requirements for the borrowing base are specified in the credit facility), less certain reserves;
|
|
·
|
Advances under the facility are secured by a first-priority lien on substantially all of Interface, Inc.’s assets and the assets of each of its material domestic subsidiaries, which have guaranteed the revolving credit facility; and
|
|
·
|
The revolving credit facility contains a financial covenant (a fixed charge coverage ratio test) that becomes effective in the event that our excess borrowing availability falls below $20 million. In such event, we must comply with the financial covenant for a period commencing on the last day of the fiscal quarter immediately preceding such event (unless such event occurs on the last day of a fiscal quarter, in which case the compliance period commences on such date) and ending on the last day of the fiscal quarter immediately following the fiscal quarter in which such event occurred.
|
The revolving credit facility also includes various reporting, affirmative and negative covenants, and other provisions that restrict our ability to take certain actions, including provisions that restrict our ability to repay our long-term indebtedness unless we meet a specified minimum excess availability test.
Interest Rates and Fees. Interest on base rate loans is charged at varying rates computed by applying a margin ranging from 1.75% to 2.50% over the applicable base interest rate (which is defined as the greatest of the prime rate, a specified federal funds rate plus 0.50%, or the one-month LIBOR rate), depending on our average excess borrowing availability during the most recently completed fiscal quarter. Interest on LIBOR-based loans and fees for letters of credit are charged at varying rates computed by applying a margin ranging from 3.25% to 4.00% over the applicable LIBOR rate (but in no event less than the three-month LIBOR rate), depending on our average excess borrowing availability during the most recently completed fiscal quarter. In addition, we pay an unused line fee of 0.75% per annum on the facility.
Prepayments. The revolving credit facility requires prepayment from the proceeds of certain asset sales.
Covenants. The revolving credit facility also limits our ability, among other things, to:
|
|
•
|
repay our other indebtedness prior to maturity unless we meet a specified minimum excess availability test;
|
|
|
•
|
incur indebtedness or contingent obligations;
|
|
|
•
|
make acquisitions of or investments in businesses (in excess of certain specified amounts);
|
|
|
•
|
sell or dispose of assets (in excess of certain specified amounts);
|
|
|
•
|
create or incur liens on assets; and
|
|
|
•
|
enter into sale and leaseback transactions.
|
We are presently in compliance with all covenants under the revolving credit facility and anticipate that we will remain in compliance with the covenants for the foreseeable future.
28
Events of Default. If we breach or fail to perform any of the affirmative or negative covenants under the revolving credit facility, or if other specified events occur (such as a bankruptcy or similar event or a change of control of Interface, Inc. or certain subsidiaries, or if we breach or fail to perform any covenant or agreement contained in any instrument relating to any of our other indebtedness exceeding $10 million), after giving effect to any applicable notice and right to cure provisions, an event of default will exist. If an event of default exists and is continuing, the lenders’ agent may, and upon the written request of a specified percentage of the lender group, shall:
|
|
•
|
declare all commitments of the lenders under the facility terminated;
|
|
|
•
|
declare all amounts outstanding or accrued thereunder immediately due and payable; and
|
|
|
•
|
exercise other rights and remedies available to them under the agreement and applicable law.
|
Collateral. The facility is secured by substantially all of the assets of Interface, Inc. and its domestic subsidiaries (subject to exceptions for certain immaterial subsidiaries), including all of the stock of our domestic subsidiaries and up to 65% of the stock of our first-tier material foreign subsidiaries. If an event of default occurs under the revolving credit facility, the lenders’ collateral agent may, upon the request of a specified percentage of lenders, exercise remedies with respect to the collateral, including, in some instances, foreclosing mortgages on real estate assets, taking possession of or selling personal property assets, collecting accounts receivables, or exercising proxies to take control of the pledged stock of domestic and first-tier material foreign subsidiaries.
Foreign Credit Facilities
Our European subsidiary Interface Europe B.V. and certain of Interface Europe B.V.’s subsidiaries have a Credit Agreement with ABN AMRO Bank N.V. Under the Credit Agreement, ABN AMRO provides a credit facility, until further notice, for borrowings and bank guarantees in varying aggregate amounts over time as follows:
|
Period
|
Maximum Amount in Euros (in millions)
|
||||
|
October 1, 2009 – September 30, 2010
|
€
|
26
|
|||
|
October 1, 2010 –September 30, 2011
|
20
|
||||
|
October 1, 2011 –September 30, 2012
|
14
|
||||
|
From October 1, 2012
|
8
|
||||
Interest on borrowings under the facility is charged at varying rates computed by applying a margin of 1% over ABN AMRO’s euro base rate (consisting of the leading refinancing rate as determined from time to time by the European Central Bank plus a debit interest surcharge), which base rate is subject to a minimum of 3.5% per annum. Fees on bank guarantees and documentary letters of credit are charged at a rate of 1% per annum or part thereof on the maximum amount and for the maximum duration of each guarantee or documentary letter of credit issued. A facility fee of 0.5% per annum is payable with respect to the facility amount. The facility is secured by liens on certain real property, personal property and other assets of our principal European subsidiaries. The facility also includes certain financial covenants (which require the borrowers and their subsidiaries to maintain a minimum interest coverage ratio, total debt/EBITDA ratio and tangible net worth/total assets) and affirmative and negative covenants, and other provisions that restrict the borrowers’ ability (and the ability of certain of the borrowers’ subsidiaries) to take certain actions. As of January 3, 2010, there were no borrowings outstanding under this facility.
Some of our other non-U.S. subsidiaries have an aggregate of the equivalent of $10.5 million of lines of credit available. As of January 3, 2010, there were no borrowings outstanding under these lines of credit.
We are presently in compliance with all covenants under these foreign credit facilities and anticipate that we will remain in compliance with the covenants for the foreseeable future.
29
Senior and Senior Subordinated Notes
As of January 3, 2010, we had outstanding $14.6 million of our 10.375% Senior Notes due 2010 outstanding, $150 million of our 11 3/8% Senior Secured Notes due 2013, and $135 million of our 9.5% Senior Subordinated Notes due 2014. The indentures governing these notes, on a collective basis, contain covenants that limit or restrict our ability to:
|
|
•
|
incur additional indebtedness;
|
|
|
•
|
make dividend payments or other restricted payments;
|
|
|
•
|
create liens on our assets;
|
|
|
•
|
sell our assets;
|
|
|
•
|
sell securities of our subsidiaries;
|
|
|
•
|
enter into transactions with shareholders and affiliates; and
|
|
|
•
|
enter into mergers, consolidations or sales of all or substantially all of our assets.
|
In addition, the indentures governing each series of notes contains a covenant that requires us to make an offer to purchase the outstanding notes under such indenture in the event of a change of control of Interface, Inc. (as defined in each respective indenture).
Each series of notes is guaranteed, fully, unconditionally, and jointly and severally, on an unsecured basis by each of our material U.S. subsidiaries. In addition, the 11 3/8% Senior Secured Notes (but not the 10.375% Senior Notes or 9.5% Senior Subordinated Notes) are secured by a second-priority lien on substantially all of our and certain of our domestic subsidiaries’ assets that secure our domestic revolving credit facility (discussed above) on a first-priority basis.
If we breach or fail to perform any of the affirmative or negative covenants under one of these indentures, or if other specified events occur (such as a bankruptcy or similar event), after giving effect to any applicable notice and right to cure provisions, an event of default will exist. An event of default also will exist under each of the 11 3/8% Senior Secured Notes indenture and the 9.5% Senior Subordinated Notes indenture if we breach or fail to perform any covenant or agreement contained in any other instrument (including without limitation any other indenture) relating to any of our indebtedness exceeding $20 million and such default or failure results in the indebtedness becoming due and payable. If an event of default exists and is continuing, the trustee of the series of notes at issue (or the holders of at least 25% of the principal amount of such notes) may declare the principal amount of the notes and accrued interest thereon immediately due and payable (except in the case of bankruptcy, in which case such amounts are immediately due and payable even in the absence of such a declaration). Also the collateral agent for the 11 3/8% Senior Secured Notes may (subject to the rights of the first priority lien holders under the domestic revolving credit facility) exercise remedies with respect to the collateral securing those notes.
In 2008, we repurchased $22.4 million of our 10.375% Senior Notes. We repurchased $138.0 million of our 10.375% Senior Notes in 2009, and repaid the final $14.6 million of the 10.375% Senior Notes at their maturity on February 1, 2010.
Analysis of Cash Flows
Our primary sources of cash during 2009 were: (1) $144.5 million from the issuance of our $150 million aggregate principal amount of 11 3/8% Senior Secured Notes due 2013; (2) $21.0 million from a reduction of accounts receivable; (3) $20.8 million from a reduction of inventory; and (4) $16.0 million from settlements of litigation. The primary uses of cash during 2009 were (1) $138.0 million used to repurchase a portion of our 10.375% Senior Notes due 2010; (2) $27.1 million as a reduction in accounts payable and accruals; (3) $8.8 million for capital expenditures, (4) $6.3 million for debt issuance costs in connection with the 11 3/8% Senior Secured Notes; and (5) $5.3 million for premiums paid in connection with the repurchase of our 10.375% Senior Notes.
Our primary sources of cash during 2008 were: (1) $11.9 million from cash received as a reduction of accounts receivable; (2) $5.1 million associated with a reduction in other assets; and (3) $1.5 million from the exercise of employee stock options. The primary uses of cash during 2008 were: (1) $32.9 million of cash paid for interest; (2) $29.3 million for additions to property, plant and equipment, primarily at our manufacturing locations; (3) $22.4 million for repurchases of our 10.375% Senior Notes due 2010; and (4) $7.6 million for the payment of dividends.
30
Our primary sources of cash during 2007 were: (1) $60.7 million from the sale of our Fabrics Group business segment, (2) $4.6 million from the exercise of employee stock options, and (3) $1.4 million from the sale of our Pandel business. The primary uses of cash during 2007 were: (1) $101.4 million for repurchases and the redemption of our 7.3% Senior Notes due 2008, (2) $40.6 million for additions to property, plant and equipment, primarily at our manufacturing locations, and (3) $4.9 million for the payment of our dividends.
We believe that our liquidity position will provide sufficient funds to meet our current commitments and other cash requirements for the foreseeable future.
Funding Obligations
We have various contractual obligations that we must fund as part of our normal operations. The following table discloses aggregate information about our contractual obligations (including the remaining contractual obligations related to our discontinued operations) and the periods in which payments are due. The amounts and time periods are measured from January 3, 2010.
|
Payments Due by Period
|
||||||||||||||||||||
|
Total Payments Due
|
Less than 1 year
|
1-3 years
|
3-5 years
|
More than 5 years
|
||||||||||||||||
|
(in thousands)
|
||||||||||||||||||||
|
Long-Term Debt Obligations
|
$ | 299,586 | $ | 14,586 | $ | -- | $ | 285,000 | $ | -- | ||||||||||
|
Operating Lease Obligations(1)
|
84,450 | 25,846 | 37,706 | 18,540 | 2,358 | |||||||||||||||
|
Expected Interest Payments(2)
|
126,718 | 30,644 | 59,774 | 36,300 | -- | |||||||||||||||
|
Unconditional Purchase Obligations(3)
|
1,164 | 849 | 183 | 44 | 88 | |||||||||||||||
|
Pension Cash Obligations(4)
|
115,717 | 10,532 | 21,843 | 22,675 | 60,667 | |||||||||||||||
|
Total Contractual Cash Obligations(5)
|
$ | 627,635 | $ | 82,457 | $ | 119,506 | $ | 362,559 | $ | 63,113 | ||||||||||
______________________
|
|
(1)
|
Our capital lease obligations are insignificant.
|
|
|
(2)
|
Expected Interest Payments to be made in future periods reflect anticipated interest payments related to our $150 million of outstanding 11 3/8% Senior Secured Notes, $14.6 million of outstanding 10.375% Senior Notes (which were repaid on February 1, 2010) and our $135 million of outstanding 9.5% Senior Subordinated Notes. We have also assumed in the presentation above that these notes will remain outstanding until maturity. We have excluded from the presentation interest payments and fees related to our revolving credit facilities (discussed above), because of the variability and timing of advances and repayments thereunder.
|
|
|
(3)
|
Unconditional Purchase Obligations do not include unconditional purchase obligations that are included as liabilities in our Consolidated Balance Sheet. Our capital expenditure commitments are not significant.
|
|
|
(4)
|
We have two foreign defined benefit plans and a domestic salary continuation plan. We have presented above the estimated cash obligations that will be paid under these plans over the next ten years. Such amounts are based on several estimates and assumptions and could differ materially should the underlying estimates and assumptions change. Our domestic salary continuation plan is an unfunded plan, and we do not currently have any commitments to make contributions to this plan. However, we do use insurance instruments to hedge our exposure under the salary continuation plan. Contributions to our other employee benefit plans are at our discretion.
|
|
|
(5)
|
The above table does not reflect unrecognized tax benefits of $9.6 million, the timing of which payments are uncertain. See the Note entitled “Taxes on Income” in Item 8 of this Report for further information.
|
31
Critical Accounting Policies
The policies discussed below are considered by management to be critical to an understanding of our consolidated financial statements because their application places the most significant demands on management’s judgment, with financial reporting results relying on estimations about the effects of matters that are inherently uncertain. Specific risks for these critical accounting policies are described in the following paragraphs. For all of these policies, management cautions that future events may not develop as forecasted, and the best estimates routinely require adjustment.
Revenue Recognition. Revenue is recognized when the following criteria are met: persuasive evidence of an agreement exists, delivery has occurred or services have been rendered, price to the buyer is fixed and determinable, and collectability is reasonably assured. Delivery is not considered to have occurred until the customer takes title and assumes the risks and rewards of ownership, which is generally on the date of shipment. Provisions for discounts, sales returns and allowances are estimated using historical experience, current economic trends, and the company’s quality performance. The related provision is recorded as a reduction of sales and cost of sales in the same period that the revenue is recognized. Material differences may result in the amount and timing of net sales for any period if management makes different judgments or uses different estimates.
Shipping and handling fees billed to customers are classified in net sales in the consolidated statements of operations. Shipping and handling costs incurred are classified in cost of sales in the consolidated statements of operations. A portion of our revenues (approximately 6% of our consolidated net sales) is derived from long-term contracts that are accounted for under the provisions of the accounting standard governing construction type contracts. Long-term fixed-price contracts are recorded on the percentage of completion basis using the ratio of costs incurred to estimated total costs at completion as the measurement basis for progress toward completion and revenue recognition. Any losses identified on contracts are recognized immediately. Contract accounting requires significant judgment relative to assessing risks, estimating contract costs and making related assumptions for schedule and technical issues. With respect to contract change orders, claims or similar items, judgment must be used in estimating related amounts and assessing the potential for realization. These amounts are only included in contract value when they can be reliably estimated and realization is probable.
Impairment of Long-Lived Assets. Long-lived assets are reviewed for impairment at the asset group level whenever events or changes in circumstances indicate that the carrying value may not be recoverable. If the sum of the expected future undiscounted cash flow is less than the carrying amount of the asset, an impairment is indicated. A loss is then recognized for the difference, if any, between the fair value of the asset (as estimated by management using its best judgment) and the carrying value of the asset. If actual market value is less favorable than that estimated by management, additional write-downs may be required.
Deferred Income Tax Assets and Liabilities. The carrying values of deferred income tax assets and liabilities reflect the application of our income tax accounting policies in accordance with applicable accounting standards, and are based on management’s assumptions and estimates regarding future operating results and levels of taxable income, as well as management’s judgment regarding the interpretation of the provisions of applicable accounting standards. The carrying values of liabilities for income taxes currently payable are based on management’s interpretations of applicable tax laws, and incorporate management’s assumptions and judgments regarding the use of tax planning strategies in various taxing jurisdictions. The use of different estimates, assumptions and judgments in connection with accounting for income taxes may result in materially different carrying values of income tax assets and liabilities and results of operations.
We evaluate the recoverability of these deferred tax assets by assessing the adequacy of future expected taxable income from all sources, including reversal of taxable temporary differences, forecasted operating earnings and available tax planning strategies. These sources of income inherently rely heavily on estimates. We use our historical experience and our short and long-term business forecasts to provide insight. Further, our global business portfolio gives us the opportunity to employ various prudent and feasible tax planning strategies to facilitate the recoverability of future deductions. To the extent we do not consider it more likely than not that a deferred tax asset will be recovered, a valuation allowance is established. As of January 3, 2010, and December 28, 2008, we had approximately $99.3 million and $116.4 million of U.S. federal net operating loss carryforwards, respectively. In addition, as of January 3, 2010, and December 28, 2008, we had state net operating loss carryforwards of $95.0 million and $106.0 million, respectively. Certain of these carryforwards are reserved with a valuation allowance because, based on the available evidence, we believe it is more likely than not that we would not be able to utilize those deferred tax assets in the future. The remaining year-end 2009 amounts are expected to be fully recoverable within the applicable statutory expiration periods. If the actual amounts of taxable income differ from our estimates, the amount of our valuation allowance could be materially impacted.
32
Goodwill. Pursuant to applicable accounting standards, we test goodwill for impairment at least annually using a two step approach. In the first step of this approach, we prepare valuations of reporting units, using both a market comparable approach and an income approach, and those valuations are compared with the respective book values of the reporting units to determine whether any goodwill impairment exists. In preparing the valuations, past, present and expected future performance is considered. If impairment is indicated in this first step of the test, a step two valuation approach is performed. The step two valuation approach compares the implied fair value of goodwill to the book value of goodwill. The implied fair value of goodwill is determined by allocating the estimated fair value of the reporting unit to the assets and liabilities of the reporting unit, including both recognized and unrecognized intangible assets, in the same manner as goodwill is determined in a business combination under applicable accounting standards. After completion of this step two test, a loss is recognized for the difference, if any, between the fair value of the goodwill associated with the reporting unit and the book value of that goodwill. If the actual fair value of the goodwill is determined to be less than that estimated, an additional write-down may be required.
During the fourth quarters of 2009, 2008 and 2007, we performed the annual goodwill impairment test. We perform this test at the reporting unit level, which is one level below the segment level for the Modular Carpet segment and at the level of the Bentley Prince Street segment. For our reporting units which carried a goodwill balance as of January 3, 2010, no impairment of goodwill was indicated. As of January 3, 2010, if our estimates of the fair value of our reporting units were 10% lower, we believe no additional goodwill impairment would have existed.
In the fourth quarter of 2008, a goodwill impairment of $61.2 million related to the Bentley Prince Street reporting unit was identified due largely to the following factors:
|
·
|
There was a significant decline in Bentley Prince Street’s performance, primarily in the last three months of 2008. This decline also was reflected in the forward projections of Bentley Prince Street’s budgeting process. The projections showed a decline in both sales and operating income over Bentley Prince Street’s three-year budgeting process. These declines impacted the value of the business from an income valuation approach. The declines in projections were primarily related to the global economic crisis and its impact on the broadloom carpet market.
|
|
·
|
There was an increase in the discount rate used to create the present value of future expected cash flows. This increase from approximately 12% to 16% was more reflective of our market capitalization and risk premiums on a reporting unit level, which impacted the value of the business using an income valuation approach.
|
|
·
|
There was a decrease in the market multiple factors used for the market valuation approach. This decrease was reflective of the general market conditions regarding current market activities and market valuation guidelines.
|
In the first quarter of 2007, we recorded charges for impairment of goodwill of $44.5 million and impairment of other intangible assets of $3.8 million related to our former Fabrics Group business segment. We were exploring possible strategic options with respect to our fabrics business, and our analyses indicated that the carrying value of the assets of the fabrics business exceeded their fair value. When such an indication is present, we measure potential goodwill and other asset impairments based on an allocation of the estimated fair value of the reporting unit to its underlying assets and liabilities. An impairment loss is recognized to the extent that the reporting unit’s recorded goodwill exceeds the implied fair value of goodwill. In addition to the impairment of goodwill, we determined that other intangible assets of the business unit were impaired as well. As discussed above, in the second quarter of 2007, we entered into an agreement to sell our fabrics business segment for approximately $67.2 million (after working capital and certain other adjustments). As a result of this agreed-upon purchase price, we recorded an impairment of assets of approximately $13.6 million in the second quarter of 2007. This impairment was determined based upon the fair value of the business segment as compared to the fair value represented by the purchase price. Given the nature of our assets and liabilities, the impairment charge was a reduction of carrying value of property, plant and equipment, as it was determined that all other assets were carried at a value approximating fair value. These impairment charges have been included in discontinued operations in the Consolidated Statement of Operations for 2007.
Inventories. We determine the value of inventories using the lower of cost or market value. We write down inventories for the difference between the carrying value of the inventories and their estimated market value. If actual market conditions are less favorable than those projected by management, additional write-downs may be required.
33
We estimate our reserves for inventory obsolescence by continuously examining our inventories to determine if there are indicators that carrying values exceed net realizable values. Experience has shown that significant indicators that could require the need for additional inventory write-downs are the age of the inventory, the length of its product life cycles, anticipated demand for our products and current economic conditions. While we believe that adequate write-downs for inventory obsolescence have been made in the consolidated financial statements, consumer tastes and preferences will continue to change and we could experience additional inventory write-downs in the future. Our inventory reserve on January 3, 2010, and December 28, 2008, was $17.1 million and $10.9 million, respectively. To the extent that actual obsolescence of our inventory differs from our estimate by 10%, our 2009 net income would be higher or lower by approximately $1.1 million, on an after-tax basis.
Pension Benefits. Net pension expense recorded is based on, among other things, assumptions about the discount rate, estimated return on plan assets and salary increases. While management believes these assumptions are reasonable, changes in these and other factors and differences between actual and assumed changes in the present value of liabilities or assets of our plans above certain thresholds could cause net annual expense to increase or decrease materially from year to year. The actuarial assumptions used in our salary continuation plan and our foreign defined benefit plans reporting are reviewed periodically and compared with external benchmarks to ensure that they appropriately account for our future pension benefit obligation. The expected long-term rate of return on plan assets assumption is based on weighted average expected returns for each asset class. Expected returns reflect a combination of historical performance analysis and the forward-looking views of the financial markets, and include input from actuaries, investment service firms and investment managers. The table below represents the changes to the projected benefit obligation as a result of changes in discount rates assumptions:
|
Foreign Defined Benefit Plans
|
Increase (Decrease) in
Projected Benefit Obligation
|
||||
|
(in millions)
|
|||||
|
1% increase in actuarial assumption for discount rate
|
$ | (36.9 | ) | ||
|
1% decrease in actuarial assumption for discount rate
|
$ | 46.6 | |||
|
Domestic Salary Continuation Plan
|
Increase (Decrease) in
Projected Benefit Obligation
|
||||
|
(in millions)
|
|||||
|
1% increase in actuarial assumption for discount rate
|
$ | (1.9 | ) | ||
|
1% decrease in actuarial assumption for discount rate
|
$ | 2.3 | |||
Environmental Remediation. We provide for remediation costs and penalties when the responsibility to remediate is probable and the amount of associated costs is reasonably determinable. Remediation liabilities are accrued based on estimates of known environmental exposures and are discounted in certain instances. We regularly monitor the progress of environmental remediation. Should studies indicate that the cost of remediation is to be more than previously estimated, an additional accrual would be recorded in the period in which such determination is made. As of January 3, 2010 and December 28, 2008, no significant amounts were provided for remediation liabilities.
Allowances for Doubtful Accounts. We maintain allowances for doubtful accounts for estimated losses resulting from the inability of customers to make required payments. Estimating this amount requires us to analyze the financial strengths of our customers. If the financial condition of our customers were to deteriorate, resulting in an impairment of their ability to make payments, additional allowances may be required. By its nature, such an estimate is highly subjective, and it is possible that the amount of accounts receivable that we are unable to collect may be different than the amount initially estimated. Our allowance for doubtful accounts on January 3, 2010, and December 28, 2008, was $12.3 million and $11.1 million, respectively. To the extent the actual collectability of our accounts receivable differs from our estimates by 10%, our 2009 net income would be higher or lower by approximately $0.8 million, on an after-tax basis, depending on whether the actual collectability was better or worse, respectively, than the estimated allowance.
Product Warranties. We typically provide limited warranties with respect to certain attributes of our carpet products (for example, warranties regarding excessive surface wear, edge ravel and static electricity) for periods ranging from ten to twenty years, depending on the particular carpet product and the environment in which the product is to be installed. We typically warrant that any services performed will be free from defects in workmanship for a period of one year following completion. In the event of a breach of warranty, the remedy typically is limited to repair of the problem or replacement of the affected product. We record a provision related to warranty costs based on historical experience and periodically adjust these provisions to reflect changes in actual experience. Our warranty reserve on January 3, 2010, and December 28, 2008, was $1.3 million and $1.9 million, respectively. Actual warranty expense incurred could vary significantly from amounts that we estimate. To the extent the actual warranty expense differs from our estimates by 10%, our 2009 net income would be higher or lower by approximately $0.1 million, on an after-tax basis, depending on whether the actual expense is lower or higher, respectively, than the estimated provision.
34
Off-Balance Sheet Arrangements
We are not a party to any material off-balance sheet arrangements.
Recent Accounting Pronouncements
In December 2007, the Financial Accounting Standards Board (the “FASB”) issued an accounting standard which established standards of accounting and reporting of noncontrolling interests in subsidiaries, previously known as minority interests, in consolidated financial statements, provided guidance on accounting for changes in the parent’s ownership interest in a subsidiary and established standards of accounting of the deconsolidation of a subsidiary due to the loss of control. This new accounting standard requires an entity to present noncontrolling interests as a component of equity. Additionally, this new accounting standard requires an entity to present net income and consolidated comprehensive income attributable to the parent and the noncontrolling interests separately on the face of the consolidated financial statements. This standard became effective for our fiscal year 2009 and interim periods thereof. Amounts for all prior periods have been adjusted retrospectively to conform to this new standard. The adoption of this standard had the following impact on our previously issued financial statements for the following prior years:
|
As of and for the Year Ended
|
||||||||
|
|
12/28/08
|
12/30/07
|
||||||
|
(in thousands)
|
||||||||
|
Income (Loss) from Continuing Operations:
|
||||||||
|
As historically presented
|
$ | (35,719 | ) | $ | 57,848 | |||
|
Impact of new accounting standard
|
1,206 | 1,124 | ||||||
|
Adjusted for impact of new accounting standard
|
$ | (34,513 | ) | $ | 58,972 | |||
|
Net Income (Loss):
|
||||||||
|
As historically presented
|
$ | (40,873 | ) | $ | (10,812 | ) | ||
|
Impact of new accounting standard
|
1,206 | 1,124 | ||||||
|
Adjusted for impact of new accounting standard
|
$ | (39,667 | ) | $ | (9,688 | ) | ||
|
Shareholders’ Equity:
|
||||||||
|
As historically presented
|
$ | 209,496 | $ | 294,142 | ||||
|
Impact of new accounting standard
|
7,941 | 6,974 | ||||||
|
Adjusted for impact of new accounting standard
|
$ | 217,437 | $ | 301,116 | ||||
In addition to the above adjustments, our adoption of this new standard required the inclusion of the following two new line items in our consolidated statements of operations for the following prior years:
|
For the Year Ended
|
||||||||
|
|
12/28/08
|
12/30/07
|
||||||
|
(in thousands)
|
||||||||
|
Net income attributable to noncontrolling interest in subsidiary
|
$ | (1,206 | ) | $ | (1,124 | ) | ||
|
Net loss attributable to Interface, Inc.
|
$ | (40,873 | ) | $ | (10,812 | ) | ||
In June 2008, the FASB issued a new accounting standard governing the determination of earnings per share. The FASB declared that unvested share-based payout awards that contain non-forfeitable rights to dividends or dividend equivalents (whether paid or unpaid) are participating securities and shall be included in the computation of earnings per share pursuant to the two-class method under accounting standards, when dilutive. This standard became effective for us on December 29, 2008. Amounts for all prior periods have been adjusted retrospectively to conform to this new standard. The adoption of this standard had the following impact on earnings per share in our previously issued financial statements for the following prior years:
35
|
Fiscal Year
|
||||||||
|
2008
|
2007
|
|||||||
|
Basic Earnings (Loss) Per Share from Continuing Operations
attributable to Interface, Inc. Common Shareholders
|
||||||||
|
As historically presented
|
$ | (0.58 | ) | $ | 0.96 | |||
|
Impact of new accounting standard
|
-- | (0.02 | ) | |||||
|
Adjusted for impact of new accounting standard
|
$ | (0.58 | ) | $ | 0.94 | |||
|
Diluted Earnings (Loss) Per Share from Continuing Operations
attributable to Interface, Inc. Common Shareholders
|
||||||||
|
As historically presented
|
$ | (0.58 | ) | $ | 0.94 | |||
|
Impact of new accounting standard
|
-- | (0.01 | ) | |||||
|
Adjusted for impact of new accounting standard
|
$ | (0.58 | ) | $ | 0.93 | |||
|
Basic Earnings (Loss) Per Share attributable to Interface, Inc. Common Shareholders
|
||||||||
|
As historically presented
|
$ | (0.67 | ) | $ | (0.18 | ) | ||
|
Impact of new accounting standard
|
-- | -- | ||||||
|
Adjusted for impact of new accounting standard
|
$ | (0.67 | ) | $ | (0.18 | ) | ||
|
Diluted Earnings (Loss) Per Share attributable to Interface, Inc. Common Shareholders
|
||||||||
|
As historically presented
|
$ | (0.67 | ) | $ | (0.18 | ) | ||
|
Impact of new accounting standard
|
-- | -- | ||||||
|
Adjusted for impact of new accounting standard
|
$ | (0.67 | ) | $ | (0.18 | ) | ||
See the Note entitled “Income (Loss) Per Share” in Item 8 of this Report for further discussion of the adoption of this standard.
In June 2009, the FASB issued a new accounting standard which codifies the framework of accounting standards in the United States. The effective date for use of the FASB Codification is for interim and annual periods ending after September 15, 2009. Companies should account for the adoption of the guidance on a prospective basis. We adopted the FASB Codification in the third quarter of 2009 and its adoption did not have a material impact on our consolidated financial statements.
In June 2009, the FASB issued a new standard which changes the consolidation model for variable interest entities. This standard companies to qualitatively assess the determination of the primary beneficiary of a variable interest entity (“VIE”) based on whether the entity (1) has the power to direct matters that most significantly impact the activities of the VIE, and (2) has the obligation to absorb losses or the right to receive benefits of the VIE that could potentially be significant to the VIE. The standard is effective as of the beginning of each reporting entity’s first annual reporting period that begins after November 15, 2009, for interim periods within that first annual reporting period, and for interim and annual reporting periods thereafter. We are currently assessing the impact, if any, that the adoption of this new standard will have on our consolidated financial statements.
In December 2008, the FASB issued a new accounting standard regarding disclosures about postretirement benefit plan assets. The new standard requires new disclosures on investment policies and strategies, categories of plan assets, fair value measurements of plan assets, and significant concentrations of risk. The required disclosures are included in the Note entitled “Employee Benefit Plans” in Item 8 of this Report.
In March 2008, the FASB issued a new accounting standard regarding disclosures about derivative instruments. The new standard is intended to improve financial reporting about derivative instruments and hedging activities by requiring enhanced disclosures to enable better understanding of the effects on financial position, financial performance, and cash flows. The effective date is for fiscal years and interim periods beginning after November 15, 2008. The adoption of this pronouncement did not have any significant impact on our consolidated financial statements.
36
In December 2007, the FASB issued a new accounting standard governing business combinations. This standard requires the acquiring entity to recognize and measure at an acquisition date fair value all identifiable assets acquired, liabilities assumed and any noncontrolling interest in the acquiree. The statement recognizes and measures the goodwill acquired in the business combination or a gain from a bargain purchase. This standard requires disclosures about the nature and financial effect of the business combination and also changes the accounting for certain income tax assets recorded in purchase accounting. This standard is effective for the fiscal year beginning after December 15, 2008. The adoption of this pronouncement did not have any significant impact on our consolidated financial statements.
In September 2006, the FASB issued a standard which defines fair value, establishes a framework for measuring fair value in generally accepted accounting principles and expands disclosures about fair value measurements. For financial assets subject to fair value measurements, this standard is effective for fiscal years beginning after November 15, 2007. In November 2007, the FASB granted a deferral for the application of this standard with regard to non-financial assets until fiscal years beginning after November 15, 2008. The adoption of the pronouncement for financial assets did not have a material impact on our consolidated financial statements. Our annual fair value measurement of our reporting units under step 1 of the goodwill impairment test represents the only significant fair value measurement on a recurring basis. The adoption of this standard did not have any significant impact on our consolidated financial statements.
In September 2006, the Emerging Issues Task Force (“EITF”) of the FASB reached consensus on an issue regarding accounting for deferred compensation and postretirement benefit aspects of endorsement split-dollar life insurance arrangements. This standard is limited to the recognition of a liability and related compensation costs for endorsement split-dollar life insurance arrangements that provide a benefit to an employee that extends to postretirement periods. This standard was effective for fiscal years beginning after December 15, 2007. In accordance with the standard, we recorded the present value of the expected future policy premiums for one such insurance policy, an amount of approximately $2.0 million, as an adjustment to retained earnings in 2008.
ITEM 7A. QUANTITATIVE AND QUALITATIVE DISCLOSURES ABOUT MARKET RISK
Market Risk
As a result of the scope of our global operations, we are exposed to an element of market risk from changes in interest rates and foreign currency exchange rates. Our results of operations and financial condition could be impacted by this risk. We manage our exposure to market risk through our regular operating and financial activities and, to the extent we deem appropriate, through the use of derivative financial instruments.
We employ derivative financial instruments as risk management tools and not for speculative or trading purposes. We monitor the use of derivative financial instruments through objective measurable systems, well-defined market and credit risk limits, and timely reports to senior management according to prescribed guidelines. We have established strict counter-party credit guidelines and enter into transactions only with financial institutions with a rating of investment grade or better. As a result, we consider the risk of counter-party default to be minimal.
Interest Rate Market Risk Exposure
Changes in interest rates affect the interest paid on certain of our debt. To mitigate the impact of fluctuations in interest rates, our management has developed and implemented a policy to maintain the percentage of fixed and variable rate debt within certain parameters. From time to time, we maintain a fixed/variable rate mix within these parameters either by borrowing on a fixed rate basis or entering into interest rate swap transactions. In the interest rate swaps, we agree to exchange, at specified levels, the difference between fixed and variable interest amounts calculated by reference to an agreed-upon notional principal linked to LIBOR. As of January 3, 2010, no such interest rate swaps were in place.
37
Foreign Currency Exchange Market Risk Exposure
A significant portion of our operations consists of manufacturing and sales activities in foreign jurisdictions. We manufacture our products in the United States, England, Northern Ireland, the Netherlands, Australia and Thailand, and sell our products in more than 100 countries. (In 2009, we ceased manufacturing operations at our facility in Canada.) As a result, our financial results could be significantly affected by factors such as changes in foreign currency exchange rates or weak economic conditions in the foreign markets in which we distribute our products. Our operating results are exposed to changes in exchange rates between the U.S. dollar and many other currencies, including the euro, British pound sterling, Canadian dollar, Australian dollar, Thai baht and Japanese yen. When the U.S. dollar strengthens against a foreign currency, the value of anticipated sales in those currencies decreases, and vice versa. Additionally, to the extent our foreign operations with functional currencies other than the U.S. dollar transact business in countries other than the United States, exchange rate changes between two foreign currencies could ultimately impact us. Finally, because we report in U.S. dollars on a consolidated basis, foreign currency exchange fluctuations could have a translation impact on our financial position.
At January 3, 2010, we recognized an $18.2 million increase in our foreign currency translation adjustment account compared with December 28, 2008, because of the strengthening of certain currencies against the U.S. dollar as of year-end 2009. The increase was associated primarily with certain foreign subsidiaries located within the United Kingdom, Australia and Europe.
Sensitivity Analysis
For purposes of specific risk analysis, we use sensitivity analysis to measure the impact that market risk may have on the fair values of our market-sensitive instruments.
To perform sensitivity analysis, we assess the risk of loss in fair values associated with the impact of hypothetical changes in interest rates and foreign currency exchange rates on market-sensitive instruments. The market value of instruments affected by interest rate and foreign currency exchange rate risk is computed based on the present value of future cash flows as impacted by the changes in the rates attributable to the market risk being measured. The discount rates used for the present value computations were selected based on market interest and foreign currency exchange rates in effect at January 3, 2010. The values that result from these computations are then compared with the market values of the financial instruments. The differences are the hypothetical gains or losses associated with each type of risk.
Interest Rate Risk
Based on a hypothetical immediate 150 basis point increase in interest rates, with all other variables held constant, the fair value of our fixed rate long-term debt would be impacted by a net decrease of $14.0 million. Conversely, a 150 basis point decrease in interest rates would result in a net increase in the fair value of our fixed rate long-term debt of $14.8 million.
Foreign Currency Exchange Rate Risk
As of January 3, 2010, a 10% decrease or increase in the levels of foreign currency exchange rates against the U.S. dollar, with all other variables held constant, would result in a decrease in the fair value of our short-term financial instruments (primarily cash, accounts receivable and accounts payable) of $9.2 million or an increase in the fair value of our financial instruments of $7.5 million, respectively. As the impact of offsetting changes in the fair market value of our net foreign investments is not included in the sensitivity model, these results are not indicative of our actual exposure to foreign currency exchange risk.
38
ITEM 8. FINANCIAL STATEMENTS AND SUPPLEMENTARY DATA
CONSOLIDATED STATEMENTS OF OPERATIONS AND COMPREHENSIVE INCOME (LOSS)
INTERFACE, INC. AND SUBSIDIARIES
CONSOLIDATED STATEMENTS OF OPERATIONS
|
FISCAL YEAR
|
||||||||||||
|
2009
|
2008
|
2007
|
||||||||||
|
(in thousands, except per share data)
|
||||||||||||
|
Net sales
|
$ | 859,888 | $ | 1,082,344 | $ | 1,081,273 | ||||||
|
Cost of sales
|
576,871 | 710,299 | 703,751 | |||||||||
|
Gross profit on sales
|
283,017 | 372,045 | 377,522 | |||||||||
|
Selling, general and administrative expenses
|
218,322 | 258,198 | 246,258 | |||||||||
|
Loss on disposal – Pandel, Inc.
|
-- | -- | 1,873 | |||||||||
|
Impairment of goodwill
|
-- | 61,213 | -- | |||||||||
|
Restructuring charges
|
7,627 | 10,975 | -- | |||||||||
|
Income from litigation settlements
|
(5,926 | ) | -- | -- | ||||||||
|
Operating income
|
62,994 | 41,659 | 129,391 | |||||||||
|
Interest expense
|
34,297 | 31,480 | 34,110 | |||||||||
|
Bond retirement expenses
|
6,096 | -- | -- | |||||||||
|
Other expense
|
576 | 1,652 | 727 | |||||||||
|
Income from continuing operations before tax expense
|
22,025 | 8,527 | 94,554 | |||||||||
|
Income tax expense
|
9,352 | 43,040 | 35,582 | |||||||||
|
Income (loss) from continuing operations
|
12,673 | (34,513 | ) | 58,972 | ||||||||
|
Loss from discontinued operations, net of tax
|
(909 | ) | (5,154 | ) | (68,660 | ) | ||||||
|
Net income (loss)
|
11,764 | (39,667 | ) | (9,688 | ) | |||||||
|
Net income attributable to noncontrolling interest in subsidiary
|
(846 | ) | (1,206 | ) | (1,124 | ) | ||||||
|
Net income (loss) attributable to Interface, Inc.
|
$ | 10,918 | $ | (40,873 | ) | $ | (10,812 | ) | ||||
|
Income (loss) per share attributable to Interface, Inc. common shareholders – basic
|
||||||||||||
|
Continuing operations
|
$ | 0.19 | $ | (0.58 | ) | $ | 0.94 | |||||
|
Discontinued operations
|
(0.01 | ) | (0.08 | ) | (1.12 | ) | ||||||
|
Net income (loss) per share attributable to Interface, Inc. common shareholders – basic
|
$ | 0.17 | $ | (0.67 | ) | $ | (0.18 | ) | ||||
|
Income (loss) per share attributable to Interface, Inc. common shareholders – diluted
|
||||||||||||
|
Continuing operations
|
$ | 0.19 | $ | (0.58 | ) | $ | 0.93 | |||||
|
Discontinued operations
|
(0.01 | ) | (0.08 | ) | (1.11 | ) | ||||||
|
Net income (loss) per share attributable to Interface, Inc. common shareholders – diluted
|
$ | 0.17 | $ | (0.67 | ) | $ | (0.18 | ) | ||||
|
Basic weighted average shares outstanding
|
63,213 | 61,439 | 61,425 | |||||||||
|
Diluted weighted average shares outstanding
|
63,308 | 61,439 | 61,938 | |||||||||
See accompanying notes to consolidated financial statements.
39
INTERFACE, INC. AND SUBSIDIARIES
CONSOLIDATED STATEMENTS OF COMPREHENSIVE INCOME (LOSS)
|
FISCAL YEAR
|
||||||||||||
|
2009
|
2008
|
2007
|
||||||||||
|
(in thousands)
|
||||||||||||
|
Net income (loss)
|
$ | 11,764 | $ | (39,667 | ) | $ | (9,688 | ) | ||||
|
Other comprehensive income (loss)
|
||||||||||||
|
Foreign currency translation adjustment
|
18,446 | (43,719 | ) | 14,462 | ||||||||
|
Pension liability adjustment
|
(4,416 | ) | 2,033 | 16,371 | ||||||||
|
Comprehensive income (loss)
|
25,794 | (81,353 | ) | 21,145 | ||||||||
|
Comprehensive income attributable to noncontrolling interest
|
(1,139 | ) | (967 | ) | (1,469 | ) | ||||||
|
Comprehensive income (loss) attributable to Interface, Inc.
|
$ | 24,655 | $ | (82,320 | ) | $ | 19,676 | |||||
See accompanying notes to consolidated financial statements.
40
INTERFACE, INC. AND SUBSIDIARIES
CONSOLIDATED BALANCE SHEETS
|
2009
|
2008
|
|||||||
|
(in thousands)
|
||||||||
|
ASSETS
|
||||||||
|
Current
|
||||||||
|
Cash and cash equivalents
|
$ | 115,363 | $ | 71,757 | ||||
|
Accounts receivable, net
|
129,833 | 144,783 | ||||||
|
Inventories
|
112,249 | 128,923 | ||||||
|
Prepaid expenses and other current assets
|
19,649 | 21,070 | ||||||
|
Deferred income taxes
|
9,379 | 6,272 | ||||||
|
Assets of businesses held for sale
|
1,500 | 3,150 | ||||||
|
Total current assets
|
387,973 | 375,955 | ||||||
|
Property and equipment, net
|
162,269 | 160,717 | ||||||
|
Deferred tax asset
|
44,210 | 42,999 | ||||||
|
Goodwill
|
80,519 | 78,489 | ||||||
|
Other assets
|
52,268 | 47,875 | ||||||
| $ | 727,239 | $ | 706,035 | |||||
|
LIABILITIES AND SHAREHOLDERS’ EQUITY
|
||||||||
|
Current liabilities
|
||||||||
|
Accounts payable
|
$ | 35,614 | $ | 52,040 | ||||
|
Accrued expenses
|
101,143 | 102,592 | ||||||
|
Current portion of long-term debt
|
14,586 | -- | ||||||
|
Total current liabilities
|
151,343 | 154,632 | ||||||
|
Senior notes
|
145,184 | 152,588 | ||||||
|
Senior subordinated notes
|
135,000 | 135,000 | ||||||
|
Deferred income taxes
|
7,029 | 7,506 | ||||||
|
Other
|
42,502 | 38,872 | ||||||
|
Total liabilities
|
481,058 | 488,598 | ||||||
|
Commitments and contingencies
|
||||||||
|
Shareholders’ equity
|
||||||||
|
Preferred stock
|
-- | -- | ||||||
|
Common stock
|
6,328 | 6,316 | ||||||
|
Additional paid-in capital
|
343,348 | 339,776 | ||||||
|
Retained earnings (deficit)
|
(55,332 | ) | (65,616 | ) | ||||
|
Accumulated other comprehensive income (loss) – foreign currency translation
|
(24,057 | ) | (42,210 | ) | ||||
|
Accumulated other comprehensive income (loss) – pension liability
|
(33,186 | ) | (28,770 | ) | ||||
|
Total shareholders’ equity – Interface, Inc.
|
237,101 | 209,496 | ||||||
|
Noncontrolling interest in subsidiary
|
9,080 | 7,941 | ||||||
|
Total shareholders’ equity
|
246,181 | 217,437 | ||||||
| $ | 727,239 | $ | 706,035 | |||||
See accompanying notes to consolidated financial statements.
41
INTERFACE, INC. AND SUBSIDIARIES
CONSOLIDATED STATEMENTS OF CASH FLOWS
|
FISCAL YEAR
|
||||||||||||
|
2009
|
2008
|
2007
|
||||||||||
|
OPERATING ACTIVITIES:
|
(in thousands)
|
|||||||||||
|
Net income (loss)
|
$ | 11,764 | $ | (39,667 | ) | $ | (9,688 | ) | ||||
|
Impairment of goodwill and intangible assets related to discontinued operations
|
-- | -- | 48,322 | |||||||||
|
Loss on discontinued operations
|
909 | 5,154 | 20,338 | |||||||||
|
Income from continuing operations
|
12,673 | (34,513 | ) | 58,972 | ||||||||
|
Adjustments to reconcile income (loss) to cash provided by (used in) operating activities
|
||||||||||||
|
Impairment of goodwill
|
-- | 61,213 | -- | |||||||||
|
Depreciation and amortization
|
25,189 | 23,664 | 22,487 | |||||||||
|
Premium paid to repurchase Senior Notes
|
5,264 | -- | -- | |||||||||
|
Bad debt expense
|
2,214 | 4,180 | 1,917 | |||||||||
|
Deferred income taxes and other
|
(5,634 | ) | 13,480 | 3,818 | ||||||||
|
Working capital changes:
|
||||||||||||
|
Accounts receivable
|
20,978 | 11,891 | (32,114 | ) | ||||||||
|
Inventories
|
20,831 | (11,351 | ) | (11,855 | ) | |||||||
|
Prepaid expenses and other current assets
|
78 | 5,072 | 5,967 | |||||||||
|
Accounts payable and accrued expenses
|
(27,143 | ) | (18,540 | ) | 19,312 | |||||||
|
Cash provided by continuing operations
|
54,450 | 55,096 | 68,504 | |||||||||
|
Cash used in discontinued operations
|
-- | -- | (2,796 | ) | ||||||||
|
Cash provided by operating activities
|
54,450 | 55,096 | 65,708 | |||||||||
|
INVESTING ACTIVITIES:
|
||||||||||||
|
Capital expenditures
|
(8,753 | ) | (29,300 | ) | (40,592 | ) | ||||||
|
Proceeds from sale of discontinued operations
|
-- | -- | 60,732 | |||||||||
|
Other
|
1,399 | (4,158 | ) | (7,014 | ) | |||||||
|
Cash used in discontinued operations
|
-- | -- | (6,950 | ) | ||||||||
|
Cash provided by (used in) investing activities
|
(7,354 | ) | (33,458 | ) | 6,176 | |||||||
|
FINANCING ACTIVITIES:
|
||||||||||||
|
Borrowing of long-term debt
|
144,452 | -- | -- | |||||||||
|
Dividends paid
|
(634 | ) | (7,562 | ) | (4,919 | ) | ||||||
|
Debt issuance costs
|
(6,301 | ) | -- | -- | ||||||||
|
Repurchase of senior notes
|
(138,002 | ) | (22,412 | ) | (101,365 | ) | ||||||
|
Premium paid to repurchase senior notes
|
(5,264 | ) | -- | -- | ||||||||
|
Proceeds from issuance of common stock
|
499 | 1,479 | 4,569 | |||||||||
|
Cash used in financing activities
|
(5,250 | ) | (28,495 | ) | (101,715 | ) | ||||||
|
Net cash provided by (used in) operating, investing and financing activities
|
41,846 | (6,857 | ) | (29,831 | ) | |||||||
|
Effect of exchange rate changes on cash
|
1,760 | (3,761 | ) | 3,049 | ||||||||
|
CASH AND CASH EQUIVALENTS:
|
||||||||||||
|
Net increase (decrease)
|
43,606 | (10,618 | ) | (26,782 | ) | |||||||
|
Balance, beginning of year
|
71,757 | 82,375 | 109,157 | |||||||||
|
Balance, end of year
|
$ | 115,363 | $ | 71,757 | $ | 82,375 | ||||||
See accompanying notes to consolidated financial statements.
42
INTERFACE, INC. AND SUBSIDIARIES -- NOTES TO CONSOLIDATED FINANCIAL STATEMENTS
SUMMARY OF SIGNIFICANT ACCOUNTING POLICIES
Nature of Operations
The Company is a recognized leader in the worldwide commercial interiors market, offering modular and broadloom floorcoverings. The Company manufactures modular and broadloom carpet focusing on the high quality, designer-oriented sector of the market, and provides specialized carpet replacement, installation and maintenance services. Additionally, the Company offers Intersept, a proprietary antimicrobial used in a number of interior finishes.
In the third quarter of 2007, the Company sold its Fabrics Group business segment to a third party. The Fabrics Group designed, manufactured and marketed fabrics for open plan office furniture systems and commercial interiors. The results of operations and related disposal costs, gains and losses for the Fabrics Group segment are classified as discontinued operations for all periods presented.
Principles of Consolidation
The consolidated financial statements include the accounts of the Company and its subsidiaries. All material intercompany accounts and transactions are eliminated. Investments in which the Company does not have the ability to exercise significant influence are carried at the lower of cost or estimated realizable value. The Company monitors investments for other than temporary declines in value and makes reductions in carrying values when appropriate. As of January 3, 2010, and December 28, 2008, the Company does not hold significant instruments of this nature.
Use of Estimates
The preparation of financial statements in conformity with accounting principles generally accepted in the U.S. requires management to make estimates and assumptions that affect the reported amounts of assets and liabilities, the disclosure of contingent assets and liabilities at the date of the financial statements, and the reported amounts of revenues and expenses during the reporting periods. Examples include provisions for returns, bad debts, product claims reserves, rebates, estimates of costs to complete performance contracts, inventory obsolescence and the length of product life cycles, accruals associated with restructuring activities, income tax exposures and valuation allowances, environmental liabilities, and the carrying value of goodwill and property and equipment. Actual results could vary from these estimates.
Revenue Recognition
Revenue is recognized when the following criteria are met: persuasive evidence of an agreement exists, delivery has occurred or services have been rendered, price to the buyer is fixed and determinable, and collectability is reasonably assured. Delivery is not considered to have occurred until the customer takes title and assumes the risks and rewards of ownership, which is generally on the date of shipment. Provisions for discounts, sales returns and allowances are estimated using historical experience, current economic trends, and the Company’s quality performance. The related provision is recorded as a reduction of sales and cost of sales in the same period that the revenue is recognized. Material differences may result in the amount and timing of net sales for any period if management makes different judgments or uses different estimates.
Shipping and handling fees billed to customers are classified in net sales in the consolidated statements of operations. Shipping and handling costs incurred are classified in cost of sales in the consolidated statements of operations.
Research and Development
Research and development costs are expensed as incurred and are included in the selling, general and administrative expense caption in the consolidated statements of operations. Research and development expense was $12.7 million, $15.3 million and $15.8 million for the years 2009, 2008 and 2007, respectively.
43
INTERFACE, INC. AND SUBSIDIARIES -- NOTES TO CONSOLIDATED FINANCIAL STATEMENTS
Cash, Cash Equivalents and Short-Term Investments
Highly liquid investments with insignificant interest rate risk and with original maturities of three months or less are classified as cash and cash equivalents. Investments with maturities greater than three months and less than one year are classified as short-term investments. The Company did not hold any significant amounts of short-term investments at January 3, 2010, or December 28, 2008.
Cash payments for interest amounted to approximately $35.1 million, $32.9 million and $38.9 million for the years 2009, 2008 and 2007, respectively. Income tax payments amounted to approximately $18.6 million, $23.1 million and $16.8 million for the years 2009, 2008 and 2007, respectively. During the years 2009, 2008 and 2007, the Company received income tax refunds of $0.5 million, $0.1 million and $0.6 million, respectively.
Inventories
Inventories are valued at the lower of cost (standards approximating the first-in, first-out method) or market. Costs included in inventories are based on invoiced costs and/or production costs, as applicable. Included in production costs are material, direct labor and allocated overhead. The Company writes down inventories for the difference between the carrying value of the inventories and their estimated net realizable value. If actual market conditions are less favorable than those projected by management, additional write-downs may be required.
Management estimates its reserves for inventory obsolescence by continuously examining its inventories to determine if there are indicators that carrying values exceed net realizable values. Experience has shown that significant indicators that could require the need for additional inventory write-downs are the age of the inventory, the length of its product life cycles, anticipated demand for the Company’s products, and current economic conditions. While management believes that adequate write-downs for inventory obsolescence have been made in the consolidated financial statements, consumer tastes and preferences will continue to change and the Company could experience additional inventory write-downs in the future.
Rebates
The Company has agreements to receive cash consideration from certain of its vendors, including rebates and cooperative marketing reimbursements. The amounts received from its vendors are generally presumed to be a reduction of the prices the Company pays for their products and, therefore, such amounts are reflected as either a reduction of cost of sales on the accompanying consolidated statements of operations, or, if the product inventory is still on hand at the reporting date, it is reflected as a reduction of “Inventories” on the accompanying consolidated balance sheets. Vendor rebates are typically dependent upon reaching minimum purchase thresholds. The Company evaluates the likelihood of reaching purchase thresholds using past experience and current year forecasts. When rebates can be reasonably estimated and receipt becomes probable, the Company records a portion of the rebate as the Company makes progress towards the purchase threshold.
When the Company receives direct reimbursements for costs incurred in marketing the vendor’s product or service, the amount received is recorded as an offset to selling, general and administrative expenses on the accompanying consolidated statements of operations.
Assets and Liabilities of Businesses Held for Sale
The Company considers businesses to be held for sale when management approves and commits to a formal plan to actively market a business for sale and the sale is considered probable. Upon designation as held for sale, the carrying value of the assets of the business are recorded at the lower of their carrying value or their estimated fair value, less costs to sell. The Company ceases to record depreciation expense at that time.
44
INTERFACE, INC. AND SUBSIDIARIES -- NOTES TO CONSOLIDATED FINANCIAL STATEMENTS
Property and Equipment and Long-Lived Assets
Property and equipment are carried at cost. Depreciation is computed using the straight-line method over the following estimated useful lives: buildings and improvements – ten to forty years; and furniture and equipment – three to twelve years. Interest costs for the construction/development of certain long-term assets are capitalized and amortized over the related assets’ estimated useful lives. The Company capitalized net interest costs of approximately $0.3 million, $1.0 million and $0.9 million for the fiscal years 2009, 2008 and 2007, respectively. Depreciation expense amounted to approximately $20.2 million, $18.8 million and $17.2 million for the years 2009, 2008 and 2007, respectively. These amounts exclude depreciation expense of approximately $4.2 million for 2007, now reported as discontinued operations, related to the Fabrics Group business segment.
Long-lived assets are reviewed for impairment whenever events or changes in circumstances indicate that the carrying amount may not be recoverable. If the sum of the expected future undiscounted cash flow is less than the carrying amount of the asset, a loss is recognized for the difference between the fair value and carrying value of the asset. Repair and maintenance costs are charged to operating expense as incurred.
Goodwill and Other Intangible Assets
Goodwill is the excess of the purchase price over the fair value of net assets acquired in business combinations accounted for as purchases. Prior to the adoption of the applicable goodwill accounting standards in December 2001, goodwill was amortized on a straight-line basis over the periods benefited, principally twenty-five to forty years. Accumulated amortization amounted to approximately $77.3 million at both January 3, 2010, and December 28, 2008, and cumulative impairment losses recognized were $212.6 million as of both January 3, 2010, and December 28, 2008.
As of January 3, 2010, and December 28, 2008, the net carrying amount of goodwill was $80.5 million and $78.5 million, respectively. Other intangible assets were $2.8 million and $9.7 million as of January 3, 2010, and December 28, 2008, respectively. The Company capitalizes patent defense costs when it determines that a successful defense is probable. The Company has capitalized $1.7 million and $3.2 million of such costs in 2008 and 2007, respectively. In 2009, the Company received settlements related to patent litigation, and as a result has reduced the carrying value of these patents by the settlement amounts. Any patent defense costs are amortized over the remaining useful life of the patent. Amortization expense during the years 2009, 2008 and 2007 was $0.6 million, $0.9 million, and $0.7 million, respectively.
During the fourth quarters of 2009, 2008 and 2007, the Company performed the annual goodwill impairment test required by certain accounting standards. The Company performs this test at the reporting unit level, which is one level below the segment level for the Modular Carpet segment and at the level of the Bentley Prince Street segment. In effecting the impairment testing, the Company prepared valuations of reporting units on both a market comparable methodology and an income methodology in accordance with the applicable standards, and those valuations were compared with the respective book values of the reporting units to determine whether any goodwill impairment existed. In preparing the valuations, past, present and future expectations of performance were considered. In the fourth quarter of 2008, a goodwill impairment of $61.2 million related to the Bentley Prince Street reporting unit was identified due largely to the following factors:
|
·
|
The significant decline in the reporting unit’s performance, primarily in the last three months of 2008. This decline also was reflected in the forward projections of the reporting unit’s budgeting process. The projections showed a decline in both sales and operating income over the reporting unit’s three-year budgeting process. These declines impacted the value of the reporting unit from an income valuation approach. The declines in projections were primarily related to the global economic crisis and its impact on the broadloom carpet market.
|
|
·
|
An increase in the discount rate used to create the present value of future expected cash flows. This increase from approximately 12% to 16% was more reflective of the Company’s market capitalization and risk premiums on a reporting unit level, which impacted the value of the reporting unit using an income valuation approach.
|
|
·
|
A decrease in the market multiple factors used for the market valuation approach. This decrease was reflective of the general market conditions regarding merger and acquisition activities.
|
Each of the Company’s reporting units maintained fair values in excess of their respective carrying values as of the fourth quarter of 2009, and therefore no impairment was indicated during the impairment testing. As of January 3, 2010, if the Company’s estimates of the fair values of its reporting units which carry a goodwill balance were 10% lower, the Company believes no additional goodwill impairment would have existed.
45
INTERFACE, INC. AND SUBSIDIARIES -- NOTES TO CONSOLIDATED FINANCIAL STATEMENTS
The Company recorded a goodwill impairment charge of $44.5 million related to the sale of its Fabrics Group business segment in 2007, which charge is included as part of the loss from discontinued operations during that period. The Company also recorded a charge of $3.8 million for other impaired intangible assets in connection with the Fabrics Group sale in 2007.
The changes in the carrying amounts of goodwill for the year ended January 3, 2010, by operating segment are as follows:
|
BALANCE DECEMBER 28, 2008
|
ACQUISITIONS
|
IMPAIRMENT
|
FOREIGN CURRENCY TRANSLATION
|
BALANCE JANUARY 3, 2010
|
||||||||||||||||
|
(in thousands)
|
||||||||||||||||||||
|
Modular Carpet
|
$ | 78,489 | $ | -- | $ | -- | $ | 2,030 | $ | 80,519 | ||||||||||
|
Bentley Prince Street
|
-- | -- | -- | -- | -- | |||||||||||||||
|
Specialty Products
|
-- | -- | -- | -- | -- | |||||||||||||||
|
Total
|
$ | 78,489 | $ | -- | $ | -- | $ | 2,030 | $ | 80,519 | ||||||||||
Product Warranties
The Company typically provides limited warranties with respect to certain attributes of its carpet products (for example, warranties regarding excessive surface wear, edge ravel and static electricity) for periods ranging from ten to twenty years, depending on the particular carpet product and the environment in which it is to be installed. The Company typically warrants that services performed will be free from defects in workmanship for a period of one year following completion. In the event of a breach of warranty, the remedy typically is limited to repair of the problem or replacement of the affected product.
The Company records a provision related to warranty costs based on historical experience and periodically adjusts these provisions to reflect changes in actual experience. Warranty reserves amounted to $1.3 million and $1.9 million as of January 3, 2010, and December 28, 2008, respectively, and are included in “Accrued Expenses” in the accompanying consolidated balance sheets.
Taxes on Income
The Company accounts for income taxes under an asset and liability approach that requires the recognition of deferred tax assets and liabilities for the expected future tax consequences of events that have been recognized in the Company’s financial statements or tax returns. In estimating future tax consequences, the Company generally considers all expected future events other than enactments of changes in tax laws or rates. The effect on deferred tax assets and liabilities of a change in tax rates will be recognized as income or expense in the period that includes the enactment date.
The Company records a valuation allowance to reduce its deferred tax assets when it is more likely than not that some portion or all of the deferred tax assets will expire before realization of the benefit or that future deductibility is not probable. The ultimate realization of the deferred tax assets depends on the ability to generate sufficient taxable income of the appropriate character in the future. This requires us to use estimates and make assumptions regarding significant future events such as the taxability of entities operating in the various taxing jurisdictions.
The Company does not record taxes collected from customers and remitted to governmental authorities on a gross basis.
Fair Values of Financial Instruments
Fair values of cash and cash equivalents and short-term debt approximate cost due to the short period of time to maturity. Fair values of debt are based on quoted market prices or pricing models using current market rates.
46
INTERFACE, INC. AND SUBSIDIARIES -- NOTES TO CONSOLIDATED FINANCIAL STATEMENTS
Translation of Foreign Currencies
The financial position and results of operations of the Company’s foreign subsidiaries are measured generally using local currencies as the functional currency. Assets and liabilities of these subsidiaries are translated into U.S. dollars at the exchange rate in effect at each year-end. Income and expense items are translated at average exchange rates for the year. The resulting translation adjustments are recorded in the foreign currency translation adjustment account. In the event of a divestiture of a foreign subsidiary, the related foreign currency translation results are reversed from equity to income. Foreign currency exchange gains and losses are included in net income (loss). Foreign exchange translation gains (losses) were $18.2 million, ($43.5 million) and $14.1 million for the years 2009, 2008 and 2007, respectively.
Income (Loss) Per Share
Basic income (loss) per share is computed based on the average number of common shares outstanding. Diluted income (loss) per share reflects the increase in average common shares outstanding that would result from the assumed exercise of outstanding stock options, calculated using the treasury stock method.
Stock-Based Compensation
As of fiscal year 2009, the Company has stock-based employee compensation plans, which are described more fully in the “Shareholders’ Equity” note below.
The fair value of each option grant is estimated on the date of grant using the Black-Scholes option pricing model, with the following weighted average assumptions used for grants issued in fiscal years 2009, 2008 and 2007:
|
FISCAL YEAR
|
||||||||||||
|
2009
|
2008
|
2007
|
||||||||||
|
Risk free interest rate
|
1.6 | % | 3.9 | % | 4.73 | % | ||||||
|
Expected option life
|
5.5 years
|
3.25 years
|
3.25 years
|
|||||||||
|
Expected volatility
|
61 | % | 61 | % | 60 | % | ||||||
|
Expected dividend yield
|
2.6 | % | 0.57 | % | 0.51 | % | ||||||
The weighted average fair value of stock options (as of grant date) granted during the years 2009, 2008 and 2007 was $1.91, $6.21 and $6.99, respectively, per share.
Derivative Financial Instruments
Accounting standards require a company to recognize all derivatives on the balance sheet at fair value. Derivatives that are not hedges must be adjusted to fair value through income. If the derivative is a fair value hedge, changes in the fair value of the hedged assets, liabilities or firm commitments are recognized through earnings. If the derivative is a cash flow hedge, the effective portion of changes in the fair value of the derivative are recognized in other comprehensive income until the hedged item is recognized in earnings. The ineffective portion of a derivative’s change in fair value is immediately recognized in earnings. As of January 3, 2010, and December 28, 2008, the Company was not party to any significant derivative instruments.
Pension Benefits
Net pension expense recorded is based on, among other things, assumptions about the discount rate, estimated return on plan assets and salary increases. While the Company believes these assumptions are reasonable, changes in these and other factors and differences between actual and assumed changes in the present value of liabilities or assets of the Company’s plans above certain thresholds could cause net annual expense to increase or decrease materially from year to year. The actuarial assumptions used in our salary continuation plan and the Company’s foreign defined benefit plans reporting are reviewed periodically and compared with external benchmarks to ensure that they appropriately account for our future pension benefit obligation. The expected long-term rate of return on plan assets assumption is based on weighted average expected returns for each asset class. Expected returns reflect a combination of historical performance analysis and the forward-looking views of the financial markets, and include input from actuaries, investment service firms and investment managers.
47
INTERFACE, INC. AND SUBSIDIARIES -- NOTES TO CONSOLIDATED FINANCIAL STATEMENTS
Environmental Remediation
The Company provides for remediation costs and penalties when the responsibility to remediate is probable and the amount of associated costs is reasonably determinable. Remediation liabilities are accrued based on estimates of known environmental exposures and are discounted in certain instances. The Company regularly monitors the progress of environmental remediation. Should studies indicate that the cost of remediation is to be more than previously estimated, an additional accrual would be recorded in the period in which such determination is made. As of January 3, 2010, and December 28, 2008, no significant amounts were provided for remediation liabilities.
Allowances for Doubtful Accounts
The Company maintains allowances for doubtful accounts for estimated losses resulting from the inability of customers to make required payments. Estimating this amount requires the Company to analyze the financial strengths of its customers. If the financial condition of the Company’s customers were to deteriorate, resulting in an impairment of their ability to make payments, additional allowances may be required. By its nature, such an estimate is highly subjective, and it is possible that the amount of accounts receivable that the Company is unable to collect may be different than the amount initially estimated. The Company’s allowance for doubtful accounts on January 3, 2010, and December 28, 2008, was $12.3 million and $11.1 million, respectively.
Reclassifications
Certain prior period amounts have been reclassified to conform to current year financial statement presentation.
Fiscal Year
The Company’s fiscal year is the 52 or 53 week period ending on the Sunday nearest December 31. All references herein to “2009,” “2008,” and “2007,” mean the fiscal years ended January 3, 2010, December 28, 2008 and December 30, 2007, respectively. Fiscal year 2009 was comprised of 53 weeks. Fiscal years 2008 and 2007 were each comprised of 52 weeks.
48
INTERFACE, INC. AND SUBSIDIARIES -- NOTES TO CONSOLIDATED FINANCIAL STATEMENTS
RECENT ACCOUNTING PRONOUNCEMENTS
In December 2007, the FASB issued an accounting standard which established standards of accounting and reporting of noncontrolling interests in subsidiaries, currently known as minority interests, in consolidated financial statements, provided guidance on accounting for changes in the parent’s ownership interest in a subsidiary and established standards of accounting of the deconsolidation of a subsidiary due to the loss of control. This standard requires an entity to present noncontrolling interests as a component of equity. Additionally, this standard requires an entity to present net income and consolidated comprehensive income attributable to the parent and the noncontrolling interest separately on the face of the consolidated financial statements. This standard became effective for the Company’s fiscal year 2009 and interim periods thereof. Amounts for all prior periods have been adjusted retrospectively to conform to this new standard. The adoption of this standard had the following impact on the Company’s previously issued financial statements for the following prior years:
|
As of and for the Year Ended
|
||||||||
|
|
12/28/08
|
12/30/07
|
||||||
|
(in thousands)
|
||||||||
|
Income (Loss) from Continuing Operations:
|
||||||||
|
As historically presented
|
$ | (35,719 | ) | $ | 57,848 | |||
|
Impact of new accounting standard
|
1,206 | 1,124 | ||||||
|
Adjusted for impact of new accounting standard
|
$ | (34,513 | ) | $ | 58,972 | |||
|
Net Income (Loss):
|
||||||||
|
As historically presented
|
$ | (40,873 | ) | $ | (10,812 | ) | ||
|
Impact of new accounting standard
|
1,206 | 1,124 | ||||||
|
Adjusted for impact of new accounting standard
|
$ | (39,667 | ) | $ | (9,688 | ) | ||
|
Shareholders’ Equity:
|
||||||||
|
As historically presented
|
$ | 209,496 | $ | 294,142 | ||||
|
Impact of new accounting standard
|
7,941 | 6,974 | ||||||
|
Adjusted for impact of new accounting standard
|
$ | 217,437 | $ | 301,116 | ||||
In addition to the above adjustments, our adoption of this new standard required the inclusion of the following two new line items in the Company’s consolidated statements of operations for the following prior years:
|
Fiscal Year
|
||||||||
|
|
2008
|
2007
|
||||||
|
(in thousands)
|
||||||||
|
Net income attributable to noncontrolling interest in subsidiary
|
$ | (1,206 | ) | $ | (1,124 | ) | ||
|
Net income (loss) attributable to Interface, Inc.
|
$ | (40,873 | ) | $ | (10,812 | ) | ||
In June 2008, the FASB issued a new accounting standard governing the determination of earnings per share. The FASB declared that unvested share-based payout awards that contain non-forfeitable rights to dividends or dividend equivalents (whether paid or unpaid) are participating securities and shall be included in the computation of earnings per share pursuant to the two-class method under accounting standards, when dilutive. This standard became effective for the Company on December 29, 2008. Amounts for all prior periods have been adjusted retrospectively to conform to this new standard. The adoption of this standard had the following impact on earnings per share in the Company’s previously issued financial statements for the following prior years:
49
INTERFACE, INC. AND SUBSIDIARIES -- NOTES TO CONSOLIDATED FINANCIAL STATEMENTS
|
Fiscal Year
|
||||||||
|
2008
|
2007
|
|||||||
|
Basic Earnings (Loss) Per Share from Continuing Operations attributable to Interface, Inc. common shareholders
|
||||||||
|
As historically presented
|
$ | (0.58 | ) | $ | 0.96 | |||
|
Impact of new accounting standard
|
-- | (0.02 | ) | |||||
|
Adjusted for impact of new accounting standard
|
$ | (0.58 | ) | $ | 0.94 | |||
|
Diluted Earnings (Loss) Per Share from Continuing Operations attributable to Interface, Inc. common shareholders
|
||||||||
|
As historically presented
|
$ | (0.58 | ) | $ | 0.94 | |||
|
Impact of new accounting standard
|
-- | (0.01 | ) | |||||
|
Adjusted for impact of new accounting standard
|
$ | (0.58 | ) | $ | 0.93 | |||
|
Basic Earnings (Loss) Per Share attributable to Interface, Inc. common shareholders
|
||||||||
|
As historically presented
|
$ | (0.67 | ) | $ | (0.18 | ) | ||
|
Impact of new accounting standard
|
-- | -- | ||||||
|
Adjusted for impact of new accounting standard
|
$ | (0.67 | ) | $ | (0.18 | ) | ||
|
Diluted Earnings (Loss) Per Share attributable to Interface, Inc. common shareholders
|
||||||||
|
As historically presented
|
$ | (0.67 | ) | $ | (0.18 | ) | ||
|
Impact of new accounting standard
|
-- | -- | ||||||
|
Adjusted for impact of new accounting standard
|
$ | (0.67 | ) | $ | (0.18 | ) | ||
See the Note below entitled “Income (Loss) Per Share” for further discussion of the adoption of this standard.
In June 2009, the FASB issued a new accounting standard which codified the framework of accounting standards in the United States. The effective date for use of the FASB Codification is for interim and annual periods ending after September 15, 2009. Companies should account for the adoption of the guidance on a prospective basis. The Company adopted the FASB Codification in the third quarter of 2009 and its adoption did not have a material impact on its consolidated financial statements.
In June 2009, the FASB issued a new standard which changes the consolidation model for variable interest entities. This standard requires companies to qualitatively assess the determination of the primary beneficiary of a variable interest entity (“VIE”) based on whether the entity (1) has the power to direct matters that most significantly impact the activities of the VIE, and (2) has the obligation to absorb losses or the right to receive benefits of the VIE that could potentially be significant to the VIE. The standard is effective as of the beginning of each reporting entity’s first annual reporting period that begins after November 15, 2009, for interim periods within that first annual reporting period, and for interim and annual reporting periods thereafter. The Company is currently assessing the impact, if any, that the adoption of this new standard will have on its consolidated financial statements.
In December 2008, the FASB issued a new accounting standard regarding disclosures about postretirement benefit plan assets. The new standard requires new disclosures on investment policies and strategies, categories of plan assets, fair value measurements of plan assets, and significant concentrations of risk. The required disclosures are included in the Note entitled “Employee Benefit Plans.”
In March 2008, the FASB issued a new standard regarding disclosures about derivative instruments. The new standard is intended to improve financial reporting about derivative instruments and hedging activities by requiring enhanced disclosures to enable better understanding of the effects on financial position, financial performance and cash flows. The effective date is for fiscal years and interim periods beginning after November 15, 2008. The adoption of this pronouncement did not have any significant impact on the Company’s consolidated financial statements.
50
INTERFACE, INC. AND SUBSIDIARIES -- NOTES TO CONSOLIDATED FINANCIAL STATEMENTS
In December 2007, the FASB issued a new standard governing business combinations. This standard requires the acquiring entity to recognize and measure at an acquisition date fair value all identifiable assets acquired, liabilities assumed and any noncontrolling interest in the acquiree. The statement recognizes and measures the goodwill acquired in the business combination or a gain from a bargain purchase. This standard requires disclosures about the nature and financial effect of the business combination and also changes the accounting for certain income tax assets recorded in purchase accounting. This standard is effective for the fiscal year beginning after December 15, 2008. The adoption of this pronouncement did not have any significant impact on the Company’s consolidated financial statements.
In September 2006, the FASB issued a standard which defines fair value, establishes a framework for measuring fair value in generally accepted accounting principles and expands disclosures about fair value measurements. For financial assets subject to fair value measurements, this standard is effective for fiscal years beginning after November 15, 2007. In November 2007, the FASB granted a deferral for the application of this standard with regard to non-financial assets until fiscal years beginning after November 15, 2008. The adoption of the pronouncement for financial assets did not have a material impact on the Company’s consolidated financial statements. The Company’s annual fair value measurement of its reporting units under step 1 of the goodwill impairment test represents the only significant fair value measurement on a recurring basis. The adoption of this standard did not have any significant impact on the Company’s consolidated financial statements.
In September 2006, the Emerging Issues Task Force of the FASB reached consensus on an issue regarding the Accounting for Deferred Compensation and Postretirement Benefit Aspects of Endorsement Split-Dollar Life Insurance Arrangements. The scope of this standard is limited to the recognition of a liability and related compensation costs for endorsement split-dollar life insurance arrangements that provide a benefit to an employee that extends to postretirement periods. This standard is effective for fiscal years beginning after December 15, 2007. In accordance with the standard, the Company recorded the present value of the expected future policy premiums for one such insurance policy, an amount of approximately $2.0 million, as an adjustment to retained earnings in 2008.
RECEIVABLES
The Company has adopted credit policies and standards intended to reduce the inherent risk associated with potential increases in its concentration of credit risk due to increasing trade receivables from sales to owners and users of commercial office facilities and with specifiers such as architects, engineers and contracting firms. Management believes that credit risks are further moderated by the diversity of its end customers and geographic sales areas. The Company performs ongoing credit evaluations of its customers’ financial condition and requires collateral as deemed necessary. The Company maintains allowances for doubtful accounts for estimated losses resulting from the inability of customers to make required payments. If the financial condition of its customers were to deteriorate, resulting in an impairment of their ability to make payments, additional allowances may be required. As of January 3, 2010, and December 28, 2008, the allowance for bad debts amounted to approximately $12.3 million and $11.1 million, respectively, for all accounts receivable of the Company. Reserves for sales returns and allowances amounted to $3.3 million and $2.7 million as of January 3, 2010, and December 28, 2008, respectively.
FAIR VALUE OF FINANCIAL INSTRUMENTS
The Company does not have significant assets and liabilities measured at fair value on a recurring basis under applicable accounting standards. The Company does have approximately $16.0 million of Company-owned life insurance which is measured on readily determinable cash surrender value on a recurring basis. Due to the short maturity of cash and cash equivalents, accounts receivable, accounts payable and accrued expenses, their carrying values approximate fair value. The fair value of long term debt represented by the Company’s 10.375% Senior Notes, 11 3/8% Senior Secured Notes and 9.5% Senior Subordinated Notes, based on quoted market prices, was $14.5 million, $167.1 million and $132.3 million, respectively, at January 3, 2010.
51
INTERFACE, INC. AND SUBSIDIARIES -- NOTES TO CONSOLIDATED FINANCIAL STATEMENTS
INVENTORIES
Inventories are summarized as follows:
|
2009
|
2008
|
|||||||
|
(in thousands)
|
||||||||
|
Finished goods
|
$ | 65,478 | $ | 72,495 | ||||
|
Work-in-process
|
15,764 | 21,610 | ||||||
|
Raw materials
|
31,007 | 34,818 | ||||||
| $ | 112,249 | $ | 128,923 | |||||
Reserves for inventory obsolescence amounted to $17.1 million and $10.9 million as of January 3, 2010, and December 28, 2008, respectively, and have been netted against amounts presented above.
PROPERTY AND EQUIPMENT
Property and equipment consisted of the following:
|
2009
|
2008
|
|||||||
|
(in thousands)
|
||||||||
|
Land
|
$ | 7,636 | $ | 9,381 | ||||
|
Buildings
|
110,984 | 103,860 | ||||||
|
Equipment
|
310,134 | 296,328 | ||||||
| 428,754 | 409,569 | |||||||
|
Accumulated depreciation
|
(266,485 | ) | (248,852 | ) | ||||
| $ | 162,269 | $ | 160,717 | |||||
The estimated cost to complete construction-in-progress for which the Company was committed at January 3, 2010, was approximately $10.0 million.
ACCRUED EXPENSES
Accrued expenses are summarized as follows:
|
2009
|
2008
|
|||||||
|
(in thousands)
|
||||||||
|
Compensation
|
$ | 44,385 | $ | 39,716 | ||||
|
Interest
|
9,169 | 12,255 | ||||||
|
Restructuring
|
1,953 | 6,952 | ||||||
|
Taxes
|
4,096 | 9,918 | ||||||
|
Accrued purchases
|
6,594 | 8,173 | ||||||
|
Other
|
34,946 | 25,578 | ||||||
| $ | 101,143 | $ | 102,592 | |||||
Other non-current liabilities include pension liability of $28.5 million and $24.7 million as of January 3, 2010, and December 28, 2008, respectively (see the discussion below in the Note entitled “Employee Benefit Plans”).
52
INTERFACE, INC. AND SUBSIDIARIES -- NOTES TO CONSOLIDATED FINANCIAL STATEMENTS
BORROWINGS
Domestic Revolving Credit Facility
The Company has a domestic revolving credit facility that provides for a maximum aggregate amount of loans and letters of credit of up to $100 million (with the option to increase it to a maximum of $150 million upon the satisfaction of certain conditions) at any one time, subject to the borrowing base described below. The key features of the domestic revolving credit facility are as follows:
|
•
|
The revolving credit facility currently matures on December 31, 2012;
|
|
•
|
The revolving credit facility includes a domestic U.S. dollar syndicated loan and letter of credit facility made available to Interface, Inc. up to the lesser of (1) $100 million, or (2) a borrowing base equal to the sum of specified percentages of eligible accounts receivable and inventory in the United States (the percentages and eligibility requirements for the borrowing base are specified in the credit facility), less certain reserves;
|
|
•
|
Advances under the facility are secured by a first-priority lien on substantially all of Interface, Inc.’s assets and the assets of each of its material domestic subsidiaries, which have guaranteed the revolving credit facility; and
|
|
•
|
The revolving credit facility contains a financial covenant (a fixed charge coverage ratio test) that becomes effective in the event that the Company’s excess borrowing availability falls below $20 million. In such event, the Company must comply with the financial covenant for a period commencing on the last day of the fiscal quarter immediately preceding such event (unless such event occurs on the last day of a fiscal quarter, in which case the compliance period commences on such date) and ending on the last day of the fiscal quarter immediately following the fiscal quarter in which such event occurred.
|
The revolving credit facility also includes various reporting, affirmative and negative covenants, and other provisions that restrict the Company’s ability to take certain actions, including provisions that restrict the Company’s ability to repay its long-term indebtedness unless it meets a specified minimum excess availability test.
Interest Rates and Fees. Interest on base rate loans is charged at varying rates computed by applying a margin ranging from 1.75% to 2.50% over the applicable base interest rate (which is defined as the greatest of the prime rate, a specified federal funds rate plus 0.50%, or the one-month LIBOR rate), depending on the Company’s average excess borrowing availability during the most recently completed fiscal quarter. Interest on LIBOR-based loans and fees for letters of credit are charged at varying rates computed by applying a margin ranging from 3.25% to 4.00% over the applicable LIBOR rate (but in no event less than the three-month LIBOR rate), depending on the Company’s average excess borrowing availability during the most recently completed fiscal quarter. In addition, the Company pays an unused line fee of 0.75% per annum on the facility.
Prepayments. The revolving credit facility requires prepayment from the proceeds of certain asset sales.
Covenants. The revolving credit facility also limits the Company’s ability, among other things, to:
|
|
•
|
repay the Company’s other indebtedness prior to maturity unless the Company meets a specified minimum excess availability test;
|
|
|
•
|
incur indebtedness or contingent obligations;
|
|
|
•
|
make acquisitions of or investments in businesses (in excess of certain specified amounts);
|
|
|
•
|
sell or dispose of assets (in excess of certain specified amounts);
|
|
|
•
|
create or incur liens on assets; and
|
|
|
•
|
enter into sale and leaseback transactions.
|
The Company is presently in compliance with all covenants under the domestic revolving credit facility and anticipates that it will remain in compliance with the covenants for the foreseeable future.
53
INTERFACE, INC. AND SUBSIDIARIES -- NOTES TO CONSOLIDATED FINANCIAL STATEMENTS
Events of Default. If the Company breaches or fails to perform any of the affirmative or negative covenants under the revolving credit facility, or if other specified events occur (such as a bankruptcy or similar event or a change of control of Interface, Inc. or certain subsidiaries, or if the Company breaches or fails to perform any covenant or agreement contained in any instrument relating to any of the Company’s other indebtedness exceeding $10 million), after giving effect to any applicable notice and right to cure provisions, an event of default will exist. If an event of default exists and is continuing, the lenders’ agent may, and upon the written request of a specified percentage of the lender group, shall:
|
|
•
|
declare all commitments of the lenders under the facility terminated;
|
|
|
•
|
declare all amounts outstanding or accrued thereunder immediately due and payable; and
|
|
|
•
|
exercise other rights and remedies available to them under the agreement and applicable law.
|
Collateral. The facility is secured by substantially all of the assets of Interface, Inc. and its domestic subsidiaries (subject to exceptions for certain immaterial subsidiaries), including all of the stock of the Company’s domestic subsidiaries and up to 65% of the stock of its first-tier material foreign subsidiaries. If an event of default occurs under the revolving credit facility, the lenders’ collateral agent may, upon the request of a specified percentage of lenders, exercise remedies with respect to the collateral, including, in some instances, foreclosing mortgages on real estate assets, taking possession of or selling personal property assets, collecting accounts receivables, or exercising proxies to take control of the pledged stock of domestic and first-tier material foreign subsidiaries.
As of January 3, 2010, the Company had no borrowings outstanding under this facility. At January 3, 2010, the Company had $8.1 million outstanding in letters of credit under this facility. As of January 3, 2010, the Company could have incurred $54.2 million of additional borrowings under this facility.
Credit Agreement with ABN AMRO Bank N.V.
The Company’s European subsidiary Interface Europe B.V. and certain of Interface Europe B.V.’s subsidiaries have a Credit Agreement with ABN AMRO Bank N.V. Under the Credit Agreement, ABN AMRO provides a credit facility, until further notice, for borrowings and bank guarantees in varying aggregate amounts over time as follows:
|
Period
|
Maximum Amount in Euros (in millions)
|
||||
|
October 1, 2009 – September 30, 2010
|
€
|
26
|
|||
|
October 1, 2010 –September 30, 2011
|
20
|
||||
|
October 1, 2011 –September 30, 2012
|
14
|
||||
|
From October 1, 2012
|
8
|
||||
Interest on borrowings under the facility is charged at varying rates computed by applying a margin of 1% over ABN AMRO’s euro base rate (consisting of the leading refinancing rate as determined from time to time by the European Central Bank plus a debit interest surcharge), which base rate is subject to a minimum of 3.5% per annum. Fees on bank guarantees and documentary letters of credit are charged at a rate of 1% per annum or part thereof on the maximum amount and for the maximum duration of each guarantee or documentary letter of credit issued. A facility fee of 0.5% per annum is payable with respect to the facility amount. The facility is secured by liens on certain real property, personal property and other assets of the Company’s principal European subsidiaries. The facility also includes certain financial covenants (which require the borrowers and their subsidiaries to maintain a minimum interest coverage ratio, total debt/EBITDA ratio and tangible net worth/total assets) and affirmative and negative covenants, and other provisions that restrict the borrowers’ ability (and the ability of certain of the borrowers’ subsidiaries) to take certain actions. As of January 3, 2010, there were no borrowings outstanding under this facility.
The Company is presently in compliance with all covenants under this facility and anticipates that it will remain in compliance with the covenants for the foreseeable future.
54
INTERFACE, INC. AND SUBSIDIARIES -- NOTES TO CONSOLIDATED FINANCIAL STATEMENTS
11 3/8% Senior Secured Notes
On June 5, 2009, the Company completed a private offering of $150 million aggregate principal amount of 11 3/8% Senior Secured Notes due 2013 (the “Senior Secured Notes”). Interest on the Senior Secured Notes is payable semi-annually on May 1 and November 1 beginning November 1, 2009. The Senior Secured Notes are guaranteed, jointly and severally, on a senior secured basis by certain of the Company’s domestic subsidiaries. The Senior Secured Notes are secured by a second-priority lien on substantially all of the Company’s and certain of the Company’s domestic subsidiaries’ assets that secure the Company’s domestic revolving credit facility on a first-priority basis.
The Senior Secured Notes were sold at a price of 96.301% of their face value, resulting in $144.5 million of gross proceeds. The $5.5 million original issue discount will be amortized over the life of the notes through interest expense. After deducting the initial purchasers’ discount and other fees and expenses associated with the sale, net proceeds were $139.5 million. The Company used $137.4 million of those net proceeds to repurchase $127.2 million aggregate principal amount of its 10.375% Senior Notes due 2010 pursuant to a tender offer conducted by the Company. (Included in the $137.4 million used to repurchase the $127.2 million aggregate principal amount of 10.375% Senior Notes were a purchase price premium of $5.7 million and accrued interest of $4.5 million). The remaining $2.1 million of the net proceeds was subsequently used to repay a portion of the $14.6 million of the 10.375% Senior Notes due 2010 that remained outstanding following the tender offer. The balance of the 10.375% Senior Notes was repaid at maturity on February 1, 2010.
The Company may redeem all or a part of the Senior Secured Notes from time to time at a price equal to 100% of the principal amount plus a make-whole premium. Prior to May 1, 2012, the Company may redeem up to 35% of the Senior Secured Notes with cash proceeds from specified equity offerings at a price equal to 111.375% of the principal amount, plus accrued and unpaid interest, if any, to the date of redemption. As of January 3, 2010, the balance of the Senior Secured Notes outstanding, net of the remaining unamortized original issue discount, was approximately $145.2 million. The estimated fair value of the Senior Secured Notes as of January 3, 2010, based on then current market prices, was $167.1 million.
10.375% Senior Notes
On January 17, 2002, the Company completed a private offering of $175 million in 10.375% Senior Notes due 2010. Interest is payable semi-annually on February 1 and August 1 beginning August 1, 2002. Proceeds from the issuance of these Notes were used to pay down the revolving credit facility.
The notes (which have now been repaid, as described below) were guaranteed, fully, unconditionally, and jointly and severally, on an unsecured senior basis by certain of the Company’s domestic subsidiaries. During 2009, the Company repurchased $138.0 million aggregate principal amount of these notes. As of January 3, 2010, and December 28, 2008, the Company had outstanding $14.6 million and $152.6 million in 10.375% Senior Notes, respectively. At January 3, 2010, and December 28, 2008, the estimated fair value of these notes based on then current market prices was approximately $14.5 million and $150.3 million, respectively. On February 1, 2010, subsequent to the end of 2009, the Company repaid the remaining balance of these notes.
9.5% Senior Subordinated Notes
On February 4, 2004, the Company completed a private offering of $135 million in 9.5% Senior Subordinated Notes due 2014. Interest on these notes is payable semi-annually on February 1 and August 1 beginning August 1, 2004. Proceeds from the issuance of these notes were used to redeem in full the Company’s previously outstanding 9.5% Senior Subordinated Notes due 2005 and to reduce borrowings under the Company’s revolving credit facility.
These notes are guaranteed, fully, unconditionally, and jointly and severally, on an unsecured senior subordinated basis by certain of the Company’s domestic subsidiaries. The notes are redeemable for cash after February 1, 2009, at the Company’s option, in whole or in part, initially at a redemption price equal to 104.75% of the principal amount, declining to 100% of the principal amount on February 1, 2012, plus accrued interest thereon to the date fixed for redemption. As of both January 3, 2010, and December 28, 2008, the Company had outstanding $135 million of 9.5% Senior Subordinated Notes due 2014. At January 3, 2010, and December 28, 2008, the estimated fair value of these notes, based on then current market prices, was approximately $132.3 million and $107.3 million, respectively.
55
INTERFACE, INC. AND SUBSIDIARIES -- NOTES TO CONSOLIDATED FINANCIAL STATEMENTS
Other Lines of Credit
Subsidiaries of the Company have an aggregate of the equivalent of $10.5 million of other lines of credit available at interest rates ranging from 1% to 9%. As of January 3, 2010, and December 28, 2008, there were no borrowings outstanding under these lines of credit.
Borrowing Costs
Deferred borrowing costs, which include underwriting, legal and other direct costs related to the issuance of debt, were $7.9 million and $3.8 million, as of January 3, 2010, and December 28, 2008, respectively. The Company amortizes these costs over the life of the related debt. Expenses related to such costs for the years 2009, 2008 and 2007 amounted to $1.9 million, $1.4 million and $1.2 million, respectively. Included in the expenses for 2009 is a write-down of approximately $0.2 million of debt costs associated with the repurchase of $138 million of 10.375% Senior Notes.
Future Maturities
The aggregate maturities of borrowings for each of the five fiscal years subsequent to 2009, are as follows:
|
FISCAL YEAR
|
AMOUNT
|
||||
|
(in thousands)
|
|||||
|
2010
|
$ | 14,586 | |||
|
2011
|
-- | ||||
|
2012
|
-- | ||||
|
2013
|
150,000 | ||||
|
2014
|
135,000 | ||||
|
Thereafter
|
-- | ||||
| $ | 299,586 | ||||
PREFERRED STOCK
The Company is authorized to designate and issue up to 5,000,000 shares of $1.00 par value preferred stock in one or more series and to determine the rights and preferences of each series, to the extent permitted by the Articles of Incorporation, and to fix the terms of such preferred stock without any vote or action by the shareholders. The issuance of any series of preferred stock may have an adverse effect on the rights of holders of common stock and could decrease the amount of earnings and assets available for distribution to holders of common stock. In addition, any issuance of preferred stock could have the effect of delaying, deferring or preventing a change in control of the Company. As of January 3, 2010, and December 28, 2008, there were no shares of preferred stock issued.
Preferred Share Purchase Rights
The Company has previously issued one purchase right (a “Right”) in respect of each outstanding share of Common Stock pursuant to a Rights Agreement it entered into in March 2008. Each Right entitles the registered holder of the Common Stock to purchase from the Company one one-hundredth of a share (a “Unit”) of Series B Participating Cumulative Preferred Stock (the “Series B Preferred Stock”).
The Rights may have certain anti-takeover effects. The Rights will cause substantial dilution to a person or group that acquires (without the consent of the Company’s Board of Directors) 15% or more of the outstanding shares of Common Stock or if other specified events occur without the Rights having been redeemed or in the event of an exchange of the Rights for Common Stock as permitted under the Shareholder Rights Plan.
56
INTERFACE, INC. AND SUBSIDIARIES -- NOTES TO CONSOLIDATED FINANCIAL STATEMENTS
The dividend and liquidation rights of the Series B Preferred Stock are designed so that the value of one Unit of Series B Preferred Stock issuable upon exercise of each Right will approximate the same economic value as one share of Common Stock, including voting rights. The exercise price per Right is $90, subject to adjustment. Shares of Series B Preferred Stock will entitle the holder to a minimum preferential dividend of $1.00 per share, but will entitle the holder to an aggregate dividend payment of 100 times the dividend declared on each share of Common Stock. In the event of liquidation, each share of Series B Preferred Stock will be entitled to a minimum preferential liquidation payment of $1.00, plus accrued and unpaid dividends and distributions thereon, but will be entitled to an aggregate payment of 100 times the payment made per share of Common Stock. In the event of any merger, consolidation or other transaction in which Common Stock is exchanged for or changed into other stock or securities, cash or other property, each share of Series B Preferred Stock will be entitled to receive 100 times the amount received per share of Common Stock. Series B Preferred Stock is not convertible into Common Stock.
Each share of Series B Preferred Stock will be entitled to 100 votes on all matters submitted to a vote of the shareholders of the Company, and shares of Series B Preferred Stock will generally vote together as one class with the Common Stock and any other voting capital stock of the Company on all matters submitted to a vote of the Company’s shareholders. While the Company’s Class B Common Stock remains outstanding, holders of Series B Preferred Stock will vote as a single class with the Class A Common Stockholders for election of directors.
Further, whenever dividends on the Series B Preferred Stock are in arrears in an amount equal to six quarterly payments, the Series B Preferred Stock, together with any other shares of preferred stock then entitled to elect directors, shall have the right, as a single class, to elect one director until the default has been cured.
Prior to entering into the March 2008 Rights Agreement, the Company maintained a substantially similar Rights Agreement that was entered into in 1998.
SHAREHOLDERS’ EQUITY
The Company is authorized to issue 80 million shares of $0.10 par value Class A Common Stock and 40 million shares of $0.10 par value Class B Common Stock. Class A and Class B Common Stock have identical voting rights except for the election or removal of directors. Holders of Class B Common Stock are entitled as a class to elect a majority of the Board of Directors. Under the terms of the Class B Common Stock, its special voting rights to elect a majority of the Board members would terminate irrevocably if the total outstanding shares of Class B Common Stock ever comprises less than ten percent of the Company’s total issued and outstanding shares of Class A and Class B Common Stock. On January 3, 2010, the outstanding Class B shares constituted approximately 10.7% of the total outstanding shares of Class A and Class B Common Stock.
The Company’s Class A Common Stock is traded on the Nasdaq Global Select Market under the symbol IFSIA. The Company’s Class B Common Stock is not publicly traded. Class B Common Stock is convertible into Class A Common Stock on a one-for-one basis.
Both classes of Common Stock share equally in dividends available to common shareholders. The Company paid dividends totaling $0.01 per share during 2009, $0.12 per share during 2008 and $0.08 per share during 2007 to each class of Common Stock. The future declaration and payment of dividends is at the discretion of the Company’s Board, and depends upon, among other things, the Company’s investment policy and opportunities, results of operations, financial condition, cash requirements, future prospects, and other factors that may be considered relevant at the time of the Board’s determination. Such other factors include limitations contained in the agreement for its primary revolving credit facility and in the indentures for our public indebtedness, each of which specify conditions as to when any dividend payments may be made. As such, the Company may discontinue its dividend payments in the future if its Board determines that a cessation of dividend payments is proper in light of the factors indicated above.
All treasury stock is accounted for using the cost method.
57
INTERFACE, INC. AND SUBSIDIARIES -- NOTES TO CONSOLIDATED FINANCIAL STATEMENTS
|
CLASS A SHARES
|
CLASS A AMOUNT
|
CLASS B SHARES
|
CLASS B AMOUNT
|
ADDITIONAL PAID-IN CAPITAL
|
RETAINED EARNINGS
(DEFICIT)
|
PENSION LIABILITY
|
FOREIGN CURRENCY TRANSLATION ADJUSTMENT
|
NON-CONTROLLING INTEREST IN SUBSIDIARY
|
||||||||||||||||||||||||||||
|
(in thousands)
|
||||||||||||||||||||||||||||||||||||
|
Balance, at December 31,
2006
|
53,932 | $ | 5,391 | 6,739 | $ | 675 | $ | 323,132 | $ | 5,217 | $ | (47,174 | ) | $ | (12,847 | ) | $ | 5,506 | ||||||||||||||||||
|
Net income (loss)
|
-- | -- | -- | -- | -- | (10,812 | ) | -- | -- | 1,124 | ||||||||||||||||||||||||||
|
Adoption of new accounting standard
|
-- | -- | -- | -- | -- | (4,645 | ) | -- | -- | -- | ||||||||||||||||||||||||||
|
Conversion of common stock
|
564 | 56 | (564 | ) | (56 | ) | -- | -- | -- | -- | -- | |||||||||||||||||||||||||
|
Stock issuances under employee plans
|
873 | 87 | -- | -- | 4,482 | -- | -- | -- | -- | |||||||||||||||||||||||||||
|
Other issuances of common stock
|
-- | -- | 307 | 31 | 4,601 | -- | -- | -- | -- | |||||||||||||||||||||||||||
|
Unamortized stock compensation expense related to restricted stock awards
|
-- | -- | -- | -- | (4,639 | ) | -- | -- | -- | -- | ||||||||||||||||||||||||||
|
Cash dividends paid
|
-- | -- | -- | -- | -- | (4,919 | ) | -- | -- | -- | ||||||||||||||||||||||||||
|
Forfeitures and compensation expense related to stock awards
|
-- | -- | -- | -- | 5,074 | -- | -- | -- | -- | |||||||||||||||||||||||||||
|
Pension liability adjustment
|
-- | -- | -- | -- | -- | -- | 16,371 | -- | -- | |||||||||||||||||||||||||||
|
Foreign currency translation adjustment
|
-- | -- | -- | -- | -- | -- | -- | 14,117 | 344 | |||||||||||||||||||||||||||
|
Balance, at December 30, 2007
|
55,369 | $ | 5,534 | 6,482 | $ | 650 | $ | 332,650 | $ | (15,159 | ) | $ | (30,803 | ) | $ | 1,270 | $ | 6,974 | ||||||||||||||||||
58
INTERFACE, INC. AND SUBSIDIARIES -- NOTES TO CONSOLIDATED FINANCIAL STATEMENTS
|
CLASS A SHARES
|
CLASS A AMOUNT
|
CLASS B SHARES
|
CLASS B AMOUNT
|
ADDITIONAL PAID-IN CAPITAL
|
RETAINED EARNINGS
(DEFICIT)
|
PENSION LIABILITY
|
FOREIGN CURRENCY TRANSLATION ADJUSTMENT
|
NON-CONTROLLING INTEREST IN SUBSIDIARY
|
||||||||||||||||||||||||||||
| (in thousands) | ||||||||||||||||||||||||||||||||||||
|
Balance, at December 30, 2007
|
55,369 | $ | 5,534 | 6,482 | $ | 650 | $ | 332,650 | $ | (15,159 | ) | $ | (30,803 | ) | $ | 1,270 | $ | 6,974 | ||||||||||||||||||
|
Net income (loss)
|
-- | -- | -- | -- | -- | (40,873 | ) | -- | -- | 1,206 | ||||||||||||||||||||||||||
|
Adoption of new accounting standard
|
-- | -- | -- | -- | -- | (2,022 | ) | -- | -- | -- | ||||||||||||||||||||||||||
|
Conversion of common stock
|
777 | 78 | (777 | ) | (78 | ) | -- | -- | -- | -- | -- | |||||||||||||||||||||||||
|
Stock issuances under employee plans
|
233 | 23 | -- | -- | 1,413 | -- | -- | -- | -- | |||||||||||||||||||||||||||
|
Other issuances of common stock
|
-- | -- | 1,090 | 109 | 15,251 | -- | -- | -- | -- | |||||||||||||||||||||||||||
|
Unamortized stock compensation expense related to restricted stock awards
|
-- | -- | -- | -- | (15,289 | ) | -- | -- | -- | -- | ||||||||||||||||||||||||||
|
Forfeitures and compensation expense related to stock awards
|
-- | -- | -- | -- | 5,751 | -- | -- | -- | -- | |||||||||||||||||||||||||||
|
Dividends paid
|
-- | -- | -- | -- | -- | (7,562 | ) | -- | -- | -- | ||||||||||||||||||||||||||
|
Pension liability adjustment
|
-- | -- | -- | -- | -- | -- | 2,033 | -- | -- | |||||||||||||||||||||||||||
|
Foreign currency translation adjustment
|
-- | -- | -- | -- | -- | -- | -- | (43,480 | ) | (239 | ) | |||||||||||||||||||||||||
|
Balance, at December 28, 2008
|
56,379 | $ | 5,635 | 6,795 | $ | 681 | $ | 339,776 | $ | (65,616 | ) | $ | (28,770 | ) | $ | (42,210 | ) | $ | 7,941 | |||||||||||||||||
59
INTERFACE, INC. AND SUBSIDIARIES -- NOTES TO CONSOLIDATED FINANCIAL STATEMENTS
|
CLASS A SHARES
|
CLASS A AMOUNT
|
CLASS B SHARES
|
CLASS B AMOUNT
|
ADDITIONAL PAID-IN CAPITAL
|
RETAINED EARNINGS
(DEFICIT)
|
PENSION LIABILITY
|
FOREIGN CURRENCY TRANSLATION ADJUSTMENT
|
NON-CONTROLLING INTEREST IN SUBSIDIARY
|
||||||||||||||||||||||||||||
|
(in thousands)
|
||||||||||||||||||||||||||||||||||||
|
Balance, at December 28, 2008
|
56,379 | $ | 5,635 | 6,795 | $ | 681 | $ | 339,776 | $ | (65,616 | ) | $ | (28,770 | ) | $ | (42,210 | ) | $ | 7,941 | |||||||||||||||||
|
Net income (loss)
|
-- | -- | -- | -- | -- | 10,918 | -- | -- | 846 | |||||||||||||||||||||||||||
|
Conversion of common stock
|
29 | 3 | (29 | ) | (3 | ) | -- | -- | -- | -- | -- | |||||||||||||||||||||||||
|
Stock issuances under employee plans
|
113 | 11 | -- | -- | 490 | -- | -- | -- | -- | |||||||||||||||||||||||||||
|
Other issuances of common stock
|
-- | -- | 8 | 1 | 114 | -- | -- | -- | -- | |||||||||||||||||||||||||||
|
Unamortized stock compensation expense related to restricted stock awards
|
-- | -- | -- | -- | (116 | ) | -- | -- | -- | -- | ||||||||||||||||||||||||||
|
Cash dividends paid
|
-- | -- | -- | -- | -- | (634 | ) | -- | -- | -- | ||||||||||||||||||||||||||
|
Forfeitures and compensation expense related to stock awards
|
-- | -- | -- | -- | 3,084 | -- | -- | -- | -- | |||||||||||||||||||||||||||
|
Pension liability adjustment
|
-- | -- | -- | -- | -- | -- | (4,416 | ) | -- | -- | ||||||||||||||||||||||||||
|
Foreign currency translation adjustment
|
-- | -- | -- | -- | -- | -- | -- | 18,153 | 293 | |||||||||||||||||||||||||||
|
Balance, at January 3, 2010
|
56,521 | $ | 5,649 | 6,774 | $ | 679 | $ | 343,348 | $ | (55,332 | ) | $ | (33,186 | ) | $ | (24,057 | ) | $ | 9,080 | |||||||||||||||||
Stock Options
The Company has an Omnibus Stock Incentive Plan (“Omnibus Plan”) under which a committee of independent directors is authorized to grant directors and key employees, including officers, options to purchase the Company’s Common Stock. Options are exercisable for shares of Class A or Class B Common Stock at a price not less than 100% of the fair market value on the date of grant. The options become exercisable either immediately upon the grant date or ratably over a time period ranging from one to five years from the date of the grant. The Company’s options expire at the end of time periods ranging from three to ten years from the date of the grant. Initially, in 1997, an aggregate of 3,600,000 shares of Common Stock not previously authorized for issuance under any plan, plus the number of shares subject to outstanding stock options granted under certain predecessor plans minus the number of shares issued on or after the effective date pursuant to the exercise of such outstanding stock options granted under predecessor plans, were available to be issued under the Omnibus Plan. In May 2001, the shareholders approved an amendment to the Omnibus Plan which increased by 2,000,000 the number of shares of Common Stock authorized for issuance under the Omnibus Plan. In May 2006, the shareholders approved an amendment and restatement of the Omnibus Plan. The amendment extended the term of the Omnibus Plan until February 2016, and set the number of shares authorized for issuance or transfer on or after the effective date of the amendment and restatement at 4,250,000 shares, except that each share issued pursuant to an award other than a stock option reduces the number of such authorized shares by two shares.
60
INTERFACE, INC. AND SUBSIDIARIES -- NOTES TO CONSOLIDATED FINANCIAL STATEMENTS
Accounting standards require that the Company measure the cost of employee services received in exchange for an award of equity instruments based on the grant date fair market value of the award. That cost will be recognized over the period in which the employee is required to provide the services – the requisite service period (usually the vesting period) – in exchange for the award. The grant date fair value for options and similar instruments will be estimated using option pricing models. Under accounting standards, the Company is required to select a valuation technique or option pricing model that meets the criteria as stated in the standard, which includes a binomial model and the Black-Scholes model. The Company is continuing to use the Black-Scholes model. Accounting standards require that the Company estimate forfeitures for stock options and reduce compensation expense accordingly. The Company has reduced its expense by the assumed forfeiture rate and will evaluate actual experience against the assumed forfeiture rate going forward. This expense reduction is not significant to the Company.
The Company recognized stock option compensation expense of $1.4 million in 2009, $0.6 million in 2008, and $0.3 million in 2007. The remaining unrecognized compensation cost related to unvested awards at January 3, 2010, approximated $1.1 million, and the weighted average period of time over which this cost will be recognized is approximately one year. The expense for stock options is included in selling, general and administrative expense on the Company’s consolidated statements of operations, as none of these stock options have been issued to production personnel.
The fair value of each option grant is estimated on the date of grant using the Black-Scholes option pricing model, with the following weighted average assumptions used for grants issued in the past three fiscal years:
|
FISCAL YEAR
|
||||||||||||
|
2009
|
2008
|
2007
|
||||||||||
|
Risk free interest rate
|
1.6 | % | 3.9 | % | 4.73 | % | ||||||
|
Expected option life
|
5.5 years
|
3.25 years
|
3.25 years
|
|||||||||
|
Expected volatility
|
61 | % | 61 | % | 60 | % | ||||||
|
Expected dividend yield
|
2.6 | % | 0.57 | % | 0.51 | % | ||||||
The weighted average fair value of stock options (as of grant date) granted during the years 2009, 2008 and 2007 was $1.91, $6.21 and $6.99, respectively, per share.
The following table summarizes stock options outstanding as of January 3, 2010, as well as activity during the previous fiscal year:
|
Shares
|
Weighted Average
Exercise Price
|
|||||||
|
Outstanding at December 38, 2008
|
679,000 | $ | 7.43 | |||||
|
Granted
|
1,060,000 | 4.30 | ||||||
|
Exercised
|
113,000 | 4.42 | ||||||
|
Forfeited or cancelled
|
50,000 | 6.68 | ||||||
|
Outstanding at January 3, 2010 (a)
|
1,576,000 | $ | 5.75 | |||||
|
Exercisable at January 3, 2010 (b)
|
446,000 | $ | 7.60 | |||||
(a) At January 3, 2010, the weighted-average remaining contractual life of options outstanding was 6.9 years.
(b) At January 3, 2010, the weighted-average remaining contractual life of options exercisable was 2.0 years.
At January 3, 2010, the aggregate intrinsic values of in-the-money options outstanding and options exercisable were $5.4 million and $1.1 million, respectively (the intrinsic value of a stock option is the amount by which the market value of the underlying stock exceeds the exercise price of the option).
The intrinsic value of stock options exercised in 2009, 2008 and 2007 was $0.4 million, $1.7 million and $10.6 million, respectively. The cash proceeds related to stock options exercised in 2009, 2008 and 2007 were $0.5 million, $1.5 million and $4.6 million, respectively.
61
INTERFACE, INC. AND SUBSIDIARIES -- NOTES TO CONSOLIDATED FINANCIAL STATEMENTS
|
Options Outstanding
|
Options Exercisable
|
|||||||||||||||||||||
|
Range of Exercise Prices
|
Number Outstanding at January 3, 2010
|
Weighted Average Remaining Contractual Life (years)
|
Weighted Average Exercise Price
|
Number Exercisable at January 3, 2010
|
Weighted Average Exercise Price
|
|||||||||||||||||
| $ | 1.49- 3.99 | 126,300 | 3.24 | $ | 2.88 | 106,300 | $ | 3.10 | ||||||||||||||
| 4.00- 5.99 | 1,187,200 | 8.27 | 4.38 | 147,200 | 4.92 | |||||||||||||||||
| 6.00- 8.99 | 37,500 | 0.88 | 8.29 | 37,500 | 8.29 | |||||||||||||||||
| 9.00-13.99 | 55,000 | 1.49 | 12.87 | 55,000 | 12.87 | |||||||||||||||||
| 14.00-16.42 | 170,000 | 2.90 | 14.57 | 100,000 | 14.84 | |||||||||||||||||
| 1,576,000 | 6.90 | $ | 5.75 | 446,000 | $ | 7.60 | ||||||||||||||||
Restricted Stock Awards
During fiscal years 2009, 2008 and 2007, the Company granted restricted stock awards totaling 27,000, 1,087,000 and 327,000 shares, respectively, of Class B common stock. These awards (or a portion thereof) vest with respect to each recipient over a one to five year period from the date of grant, provided the individual remains in the employment or service of the Company as of the vesting date. Additionally, these shares (or a portion thereof) could vest earlier upon the attainment of certain performance criteria, in the event of a change in control of the Company, or upon involuntary termination without cause.
Compensation expense related to the vesting of restricted stock was $1.8 million, $5.8 million and $5.0 million for 2009, 2008 and 2007, respectively. These grants are made primarily to executive-level personnel at the Company and, as a result, no compensation costs have been capitalized. Accounting standards require that the Company estimate forfeitures for restricted stock and reduce compensation expense accordingly. The Company has reduced its expense by the assumed forfeiture rate and will evaluate actual experience against the assumed forfeiture rate going forward. The forfeiture rate has been developed using historical data regarding actual forfeitures as well as an estimate of future expected forfeitures under our restricted stock grants.
The following table summarizes restricted stock activity as of January 3, 2010, and during the previous fiscal year:
|
Shares
|
Weighted Average
Grant Date
Fair Value
|
|||||||
|
Outstanding at December 28, 2008
|
1,550,000 | $ | 12.70 | |||||
|
Granted
|
27,000 | 4.31 | ||||||
|
Vested
|
163,000 | 8.62 | ||||||
|
Forfeited or cancelled
|
20,000 | 14.13 | ||||||
|
Outstanding at January 3, 2010
|
1,394,000 | $ | 13.04 | |||||
As of January 3, 2010, the unrecognized total compensation cost related to unvested restricted stock was $9.9 million. That cost is expected to be recognized by the end of 2013.
As stated above, accounting standards require the Company to estimate forfeitures in calculating the expense related to stock-based compensation, as opposed to only recognizing these forfeitures and the corresponding reduction in expense as they occur.
62
INTERFACE, INC. AND SUBSIDIARIES -- NOTES TO CONSOLIDATED FINANCIAL STATEMENTS
INCOME (LOSS) PER SHARE
The Company computes basic earnings (loss) per share (“EPS”) attributable to Interface, Inc. common shareholders by dividing income (loss) from continuing operations attributable to Interface, Inc. common shareholders, income (loss) from discontinued operations attributable to Interface, Inc. common shareholders and net income (loss) attributable to Interface, Inc. common shareholders, by the weighted average common shares outstanding, including participating securities outstanding, during the period as depicted below. Diluted EPS reflects the potential dilution beyond shares for basic EPS that could occur if securities or other contracts to issue common stock were exercised, converted into common stock or resulted in the issuance of common stock that would have shared in the Company’s earnings.
In the first quarter of 2009, the Company adopted a new accounting standard which requires the Company to include all unvested stock awards which contain non-forfeitable rights to dividends or dividend equivalents, whether paid or unpaid, in the number of shares outstanding in the Company’s basic and diluted EPS calculations when the inclusion of these shares would be dilutive. The table below depicts the application of this standard to fiscal years 2009, 2008 and 2007. As a result of the adoption of this standard, the Company has included all of its outstanding restricted stock awards in its calculation of basic and diluted EPS for the periods presented. Because the Company experienced a loss from continuing operations position for fiscal year 2008, these participating securities were not included in the determination of EPS because to do so would be anti-dilutive. This accounting standard also requires additional disclosure of EPS for common stock and unvested share-based payment awards, separately disclosing distributed and undistributed earnings. Distributed earnings represent common stock dividends and dividends earned on unvested share-based payment awards. Undistributed earnings represent earnings that were available for distribution but were not distributed. Common stock and unvested share-based payment awards earn dividends equally as shown in the table below:
|
Fiscal Year
|
||||||||||||
|
2009
|
2008
|
2007
|
||||||||||
|
Earnings (loss) per share from continuing operations:
|
||||||||||||
|
Basic earnings (loss) per share attributable to Interface, Inc. common shareholders
|
||||||||||||
|
Distributed earnings
|
$ | 0.01 | $ | (0.12 | ) | $ | 0.08 | |||||
|
Undistributed earnings
|
0.18 | (0.46 | ) | 0.86 | ||||||||
| $ | 0.19 | $ | (0.58 | ) | $ | 0.94 | ||||||
|
Diluted earnings (loss) per share attributable to Interface, Inc. common shareholders
|
||||||||||||
|
Distributed earnings
|
$ | 0.01 | $ | (0.12 | ) | $ | 0.08 | |||||
|
Undistributed earnings
|
0.18 | (0.46 | ) | 0.85 | ||||||||
| $ | 0.19 | $ | (0.58 | ) | $ | 0.93 | ||||||
|
Loss per share from discontinued operations:
|
||||||||||||
|
Basic earnings (loss) per share attributable to Interface, Inc. common shareholders
|
||||||||||||
|
Distributed earnings
|
$ | -- | $ | -- | $ | -- | ||||||
|
Undistributed earnings
|
(0.01 | ) | (0.08 | ) | (1.12 | ) | ||||||
|
Diluted earnings (loss) per share attributable to Interface, Inc. common shareholders
|
||||||||||||
|
Distributed earnings
|
$ | -- | $ | -- | $ | -- | ||||||
|
Undistributed earnings
|
(0.01 | ) | (0.08 | ) | (1.11 | ) | ||||||
|
Basic earnings (loss) per share attributable to Interface, Inc. common shareholders
|
$ | 0.17 | $ | (0.67 | ) | $ | (0.18 | ) | ||||
|
Diluted earnings (loss) per share attributable to Interface, Inc. common shareholders
|
$ | 0.17 | $ | (0.67 | ) | $ | (0.18 | ) | ||||
63
INTERFACE, INC. AND SUBSIDIARIES -- NOTES TO CONSOLIDATED FINANCIAL STATEMENTS
The following table presents income (loss) from continuing operations and net income (loss) attributable to Interface, Inc. that was attributable to participating securities:
|
Fiscal Year
|
||||||||||||
|
2009
|
2008
|
2007
|
||||||||||
|
(in millions)
|
||||||||||||
|
Income (Loss) from Continuing Operations
|
$ | 0.3 | $ | (0.9 | ) | $ | 0.8 | |||||
|
Net Income (Loss) Attributable to Interface, Inc.
|
0.2 | (1.0 | ) | (0.2 | ) | |||||||
As discussed above, participating securities were not included in the determination of EPS for 2008, as their inclusion would be anti-dilutive.
The weighted average shares for basic and diluted EPS were as follows:
|
Fiscal Year
|
||||||||||||
|
2009
|
2008
|
2007
|
||||||||||
|
(in thousands)
|
||||||||||||
|
Weighted Average Shares Outstanding
|
61,819 | 61,439 | 60,573 | |||||||||
|
Participating Securities
|
1,394 | -- | 852 | |||||||||
|
Shares for Basic Earnings (Loss) Per Share
|
63,213 | 61,439 | 61,425 | |||||||||
|
Dilutive Effect of Stock Options
|
95 | -- | 513 | |||||||||
|
Shares for Diluted Earnings (Loss) Per Share
|
63,308 | 61,439 | 61,938 | |||||||||
As the Company was in a loss from continuing operations position for 2008, any potential common shares and participating securities would have been anti-dilutive and therefore were not included in the calculation. As of the end of 2008, there were approximately 679,000 outstanding stock options and 1,550,000 shares of unvested restricted stock. For fiscal years 2009 and 2007, options to purchase 302,000 and 40,000 shares of common stock, respectively, were not included in the computation of diluted earnings per share as their impact would be anti-dilutive.
RESTRUCTURING CHARGES
2008 Restructuring Plan
In the fourth quarter of 2008, the Company committed to a restructuring plan intended to reduce costs across its worldwide operations, and more closely align the Company’s operations with demand levels. The reduction of the demand levels is primarily a result of the worldwide recession and the associated delays and reductions in the number of construction projects where the Company’s carpet products are used. The plan primarily consisted of ceasing manufacturing operations at its facility in Belleville, Canada, and reducing its worldwide employee base by a total of approximately 530 employees in the areas of manufacturing, sales and administration. In connection with the restructuring plan, the Company recorded a pre-tax restructuring charge in the fourth quarter of 2008 of $11.0 million. The Company records its restructuring accruals under the provisions of applicable accounting standards. The restructuring charge was comprised of employee severance expense of $7.8 million, impairment of assets of $2.6 million, and other exit costs of $0.7 million (primarily related to lease exit costs and other closure activities). Approximately $8.3 million of the restructuring charge resulted in cash expenditures, primarily severance expense.
A summary of these restructuring activities is presented below:
|
Total Restructuring Charge
|
Costs Incurred
During 2008
|
Costs Incurred
During 2009
|
Balance at 01/03/10
|
|||||||||||||
|
(in thousands)
|
||||||||||||||||
|
Facilities consolidation
|
$ | 2,559 | $ | 2,559 | $ | -- | $ | -- | ||||||||
|
Workforce reduction
|
7,751 | 1,464 | 6,287 | -- | ||||||||||||
|
Other charges
|
665 | -- | 665 | -- | ||||||||||||
| $ | 10,975 | $ | 4,023 | $ | 6,952 | $ | -- | |||||||||
64
INTERFACE, INC. AND SUBSIDIARIES -- NOTES TO CONSOLIDATED FINANCIAL STATEMENTS
The table below details these restructuring activities by segment:
|
Modular
Carpet
|
Bentley
Prince Street
|
Corporate
|
Total
|
|||||||||||||
|
(in thousands)
|
||||||||||||||||
|
Total amounts expected to be incurred
|
$ | 10,710 | $ | 120 | $ | 145 | $ | 10,975 | ||||||||
|
Cumulative amounts incurred to date
|
10,710 | 120 | 145 | 10,975 | ||||||||||||
|
Total amounts incurred in 2009
|
6,687 | 120 | 145 | 6,952 | ||||||||||||
2009 Restructuring Plan
In the first quarter of 2009, the Company adopted a new restructuring plan, primarily comprised of a further reduction in the Company’s worldwide employee base by a total of approximately 290 employees and continuing actions taken to better align fixed costs with demand for its products on a global level. In connection with the new plan, the Company recorded a pre-tax restructuring charge of $5.7 million, comprised of $4.0 million of employee severance expense and $1.7 million of other exit costs (primarily including costs to exit the Canadian manufacturing facilities, lease exit costs and other costs). Approximately $5.2 million of the restructuring charge will involve cash expenditures, primarily severance expense. In the second quarter of 2009, the Company recorded an additional $1.9 million restructuring charge as a continuation of this plan. The charge in the second quarter of 2009 is due to approximately 80 additional employee reductions, and relates entirely to employee severance expense.
A summary of these restructuring activities is presented below:
|
Total
Restructuring
Charges
|
Costs Incurred
in 2009
|
Balance at
Jan. 3, 2010
|
||||||||||
|
(in thousands)
|
||||||||||||
|
Facilities consolidation
|
$ | 970 | $ | 970 | $ | -- | ||||||
|
Workforce reduction
|
5,873 | 3,920 | 1,953 | |||||||||
|
Other charges
|
784 | 784 | -- | |||||||||
| $ | 7,627 | $ | 5,674 | $ | 1,953 | |||||||
The table below details these restructuring activities undertaken in 2009 by segment:
|
Modular
Carpet
|
Bentley
Prince Street
|
Corporate
|
Total
|
|||||||||||||
|
(in thousands)
|
||||||||||||||||
|
Total amounts expected to be incurred
|
$ | 6,865 | $ | 762 | $ | -- | $ | 7,627 | ||||||||
|
Cumulative amounts incurred to date
|
4,912 | 762 | -- | 5,674 | ||||||||||||
|
Total amounts incurred in 2009
|
4,912 | 762 | -- | 5,674 | ||||||||||||
65
INTERFACE, INC. AND SUBSIDIARIES -- NOTES TO CONSOLIDATED FINANCIAL STATEMENTS
TAXES ON INCOME
Provisions for federal, foreign and state income taxes in the consolidated statements of operations consisted of the following components:
|
FISCAL YEAR
|
||||||||||||
|
2009
|
2008
|
2007
|
||||||||||
|
(in thousands)
|
||||||||||||
|
Current expense/(benefit):
|
||||||||||||
|
Federal
|
$ | 394 | $ | 100 | $ | 190 | ||||||
|
Foreign
|
11,890 | 20,844 | 20,332 | |||||||||
|
State
|
542 | 456 | 770 | |||||||||
| 12,826 | 21,400 | 21,292 | ||||||||||
|
Deferred expense/(benefit):
|
||||||||||||
|
Federal
|
(3,403 | ) | 15,732 | (2,184 | ) | |||||||
|
Foreign
|
(875 | ) | 1,820 | 6,291 | ||||||||
|
State
|
315 | 1,386 | (982 | ) | ||||||||
| (3,963 | ) | 18,938 | 3,125 | |||||||||
| $ | 8,863 | $ | 40,338 | $ | 24,417 | |||||||
Income tax expense (benefit) is included in the accompanying consolidated statements of operations as follows:
|
FISCAL YEAR
|
||||||||||||
|
2009
|
2008
|
2007
|
||||||||||
|
(in thousands)
|
||||||||||||
|
Continuing operations
|
$ | 9,352 | $ | 43,040 | $ | 35,582 | ||||||
|
Loss from discontinued operations
|
(489 | ) | (2,702 | ) | (11,165 | ) | ||||||
| $ | 8,863 | $ | 40,338 | $ | 24,417 | |||||||
Income (loss) from continuing operations before taxes on income consisted of the following:
|
FISCAL YEAR
|
||||||||||||
|
2009
|
2008
|
2007
|
||||||||||
|
(in thousands)
|
||||||||||||
|
U.S. operations
|
$ | (8,809 | ) | $ | (59,400 | ) | $ | 10,462 | ||||
|
Foreign operations
|
30,834 | 67,927 | 84,092 | |||||||||
| $ | 22,025 | $ | 8,527 | $ | 94,554 | |||||||
Deferred income taxes for the years ended January 3, 2010, and December 28, 2008, reflect the net tax effects of temporary differences between the carrying amounts of assets and liabilities for financial reporting purposes and the amounts used for income tax purposes.
66
INTERFACE, INC. AND SUBSIDIARIES -- NOTES TO CONSOLIDATED FINANCIAL STATEMENTS
At January 3, 2010, the Company had approximately $117.9 million in federal net operating loss carryforwards from continuing operations, with expiration dates through 2027, of which $18.6 million is from share-based payment awards. In accordance with applicable accounting standards, a financial statement benefit has not been recorded for the net operating loss related to the share-based payment awards. The Company’s foreign subsidiaries had approximately $2.8 million in net operating losses available for an unlimited carryforward period. The Company expects to utilize all of its federal and foreign carryforwards prior to their expiration. The Company had approximately $95 million in state net operating loss carryforwards relating to continuing operations with expiration dates through 2029. The Company had provided a valuation allowance against $37 million of such losses, which the Company does not expect to utilize. In addition, the Company has approximately $165 million in state net operating loss carryforwards relating to discontinued operations against which a full valuation allowance has been provided.
The sources of the temporary differences and their effect on the net deferred tax asset are as follows:
|
2009
|
2008
|
|||||||||||||||
|
ASSETS
|
LIABILITIES
|
ASSETS
|
LIABILITIES
|
|||||||||||||
|
(in thousands)
|
||||||||||||||||
|
Basis differences of property and equipment
|
$ | -- | $ | 9,089 | $ | -- | $ | 8,260 | ||||||||
|
Basis difference of intangible assets
|
-- | 568 | -- | 617 | ||||||||||||
|
Foreign currency loss
|
-- | 2,671 | -- | 2,172 | ||||||||||||
|
Net operating loss carryforwards
|
41,332 | -- | 46,792 | -- | ||||||||||||
|
Valuation allowances on net operation loss carryforwards
|
(2,758 | ) | -- | (2,590 | ) | -- | ||||||||||
|
Deferred compensation
|
15,978 | -- | 14,307 | -- | ||||||||||||
|
Nondeductible reserves and accruals
|
8,187 | -- | 5,050 | -- | ||||||||||||
|
Pensions
|
3,498 | -- | 2,533 | -- | ||||||||||||
|
Tax effects of undistributed earnings from foreign subsidiaries not deemed to be indefinitely reinvested
|
-- | 7,388 | -- | 13,262 | ||||||||||||
|
Other differences in basis of assets and liabilities
|
38 | -- | -- | 16 | ||||||||||||
| $ | 66,275 | $ | 19,716 | $ | 66,092 | $ | 24,327 | |||||||||
Deferred tax assets and liabilities are included in the accompanying balance sheets as follows:
|
FISCAL YEAR
|
||||||||
|
2009
|
2008
|
|||||||
|
(in thousands)
|
||||||||
|
Deferred income taxes (current asset)
|
$ | 9,379 | $ | 6,272 | ||||
|
Deferred tax asset (non-current asset)
|
44,210 | 42,999 | ||||||
|
Deferred income taxes (non-current liabilities)
|
(7,029 | ) | (7,506 | ) | ||||
| $ | 46,558 | $ | 41,765 | |||||
Management believes, based on the Company’s history of taxable income and expectations for the future, that it is more likely than not that future taxable income will be sufficient to fully utilize the deferred tax assets at January 3, 2010.
The Company’s effective tax rate from continuing operations was 42.5%, 504.7% and 37.6% for fiscal years 2009, 2008 and 2007, respectively. The following summary reconciles income taxes at the U.S. federal statutory rate of 35% to the Company’s actual income tax expense:
67
INTERFACE, INC. AND SUBSIDIARIES -- NOTES TO CONSOLIDATED FINANCIAL STATEMENTS
|
FISCAL YEAR
|
||||||||||||
|
2009
|
2008
|
2007
|
||||||||||
|
(in thousands)
|
||||||||||||
|
Income taxes at U.S federal statutory rate
|
$ | 7,709 | $ | 2,984 | $ | 33,094 | ||||||
|
Increase (decrease) in taxes resulting from:
|
||||||||||||
|
State income taxes, net of federal tax benefit
|
438 | 194 | 288 | |||||||||
|
Non-deductible goodwill impairment
|
-- | 21,415 | -- | |||||||||
|
Non-deductible business expenses
|
315 | 385 | 442 | |||||||||
|
Non-deductible employee compensation
|
399 | 763 | 1,198 | |||||||||
|
Tax effects of Company owned life insurance
|
(1,380 | ) | 1,982 | (84 | ) | |||||||
|
Tax effects of undistributed earnings from foreign subsidiaries not deemed to be indefinitely reinvested
|
1,075 | 13,262 | -- | |||||||||
|
Foreign and U.S. tax effects attributable to foreign operations
|
1,058 | 1,318 | (395 | ) | ||||||||
|
Nondeductible loss on sale of subsidiary
|
-- | 82 | 643 | |||||||||
|
Valuation allowance additions – State NOL
|
109 | 942 | 62 | |||||||||
|
Income attributable to noncontrolling interest in subsidiary
|
(296 | ) | (422 | ) | (393 | ) | ||||||
|
Other
|
(75 | ) | 135 | 727 | ||||||||
|
Income tax expense
|
$ | 9,352 | $ | 43,040 | $ | 35,582 | ||||||
The Company does not provide for U.S. income taxes on the undistributed earnings of its foreign subsidiaries that are considered to be indefinitely reinvested outside of the U.S. as determination of the amount of unrecognized deferred U.S. income tax liability related to the indefinitely reinvested earnings is not practicable because of the complexities associated with its hypothetical calculation. During 2008 and 2009, the Company provided for approximately $13.4 million in U.S. federal and state income taxes and approximately $0.9 million in foreign withholding taxes on approximately $39.3 million of undistributed earnings from foreign subsidiaries that were no longer deemed to be indefinitely reinvested outside of the U.S. During 2009, the Company repatriated $20.2 million of these undistributed earnings on which the Company had provided $6.8 million in U.S. federal and state income taxes and $0.6 million in foreign withholding taxes. At January 3, 2010, the Company has provided for approximately $6.6 million in U.S. federal and state income taxes and approximately $0.3 million in foreign withholding taxes on approximately $19.1 million of the remaining undistributed earnings that it anticipates repatriating in the foreseeable future. At January 3, 2010, approximately $161 million of undistributed earnings of the Company’s foreign subsidiaries are deemed to be indefinitely reinvested outside of the U.S., on which withholding taxes of approximately $3.1 million would be payable upon remittance.
On January 1, 2007, the Company, in accordance with applicable accounting standards, recognized a $4.6 million increase in its liability for unrecognized tax benefits with a corresponding decrease to the opening balance of retained earnings.
As of December 28, 2008, the Company had unrecognized tax benefits of $7.4 million, which if recognized would be recorded as a benefit to income taxes and, therefore, result in a favorable impact on the Company’s effective tax rate in future periods. For the year ended January 3, 2010, the Company increased its unrecognized tax benefits by $2.1 million due to the following changes in its tax positions. The Company increased its unrecognized tax benefits by approximately $1.7 million primarily related to its foreign tax positions taken in the current year and by $0.4 million primarily related to its foreign tax positions taken in prior years.
As of January 3, 2010, the Company had unrecognized tax benefits of $9.6 million, included in other liabilities in the Company’s consolidated balance sheet, which if recognized would have an impact on the Company’s effective tax rate in future periods. If these benefits are not favorably settled, $9.3 million of the total amount of unrecognized tax benefits would require the use of cash in future periods.
The Company recognizes accrued interest and income tax penalties related to unrecognized tax benefits as a component of income tax expense. As of January 3, 2010, the Company had accrued interest and penalties of $1.5 million, which is included in the total unrecognized tax benefit noted above.
68
INTERFACE, INC. AND SUBSIDIARIES -- NOTES TO CONSOLIDATED FINANCIAL STATEMENTS
The Company’s federal income tax returns are subject to examination for the years 2003 to the present. The Company files returns in numerous state and local jurisdictions and in general it is subject to examination by the state tax authorities for the years 2004 to the present. The Company files returns in numerous foreign jurisdictions and in general it is subject to examination by the foreign tax authorities for the years 2003 to the present.
In August 2006, the Canadian tax authorities (“CRA”) proposed a reassessment of taxable income for transfer pricing related adjustments for the years 2001 and 2002. In November 2006, the Company filed a submission with the CRA to set aside the reassessment of taxable income. In September 2008, the CRA issued a final notice of reassessment of tax, including interest, of approximately $0.9 million for the years 2001 and 2002. In December 2008, the Company filed an objection to the notice of reassessment of tax with the CRA. In May 2009, the Company filed a Joint Request for Competent Authority Assistance Pursuant to the Mutual Agreement Procedure (“MAP”) under the Canada-U.S. 1980 Tax Convention. The Company has included in its liability for unrecognized tax benefits an amount it estimates will more likely than not result from the conclusion of the MAP. However, due to the nature of the MAP process, the timing and outcome of the MAP is subject to considerable variation and the ultimate outcome of this process could result in an amount significantly different from the Company’s estimate.
In late February 2008, the Company filed with the CRA and the Internal Revenue Service (“IRS”) an application for a Canada – U.S. bilateral advanced pricing agreement (“BAPA”) with respect to certain intercompany transactions (“Covered Transactions”) between Interface, Inc (including its U.S. subsidiaries) and its Canadian subsidiary. Some of the Covered Transactions are the same types of transactions that are the subject of dispute in the reassessment for tax years 2001 and 2002 described above. The BAPA request covers, at minimum, tax years 2006 through 2010, with a possibility of appending additional prospective years or qualifying rollback years for earlier periods. During 2008, the Company was accepted into the BAPA program by both the CRA and the IRS. In late December 2008, the Company made the decision to discontinue manufacturing at its facility in Canada, thus affecting the majority of the Covered Transactions. During 2009, the CRA and the IRS substantially completed their due diligence and the Company is anticipating a negotiated resolution from those agencies in the near future. The Company has included in its liability for unrecognized tax benefits an amount it estimates will more likely than not result from the conclusion of the BAPA. However, due to the nature of the BAPA process, the timing and outcome of the BAPA is subject to considerable variation and the ultimate outcome of this process could result in an amount significantly different from the Company’s estimate.
Management believes changes to our unrecognized tax benefits that are reasonably possible in the next 12 months, other than the Canadian tax matters noted above, will not have a significant impact on our financial positions or results of operations. The timing of the ultimate resolution of the Company’s tax matters and the payment and receipt of related cash is dependent on a number of factors, many of which are outside the Company’s control.
A reconciliation of the beginning and ending amounts of unrecognized tax benefits is as follows:
|
Fiscal Year
|
||||||||||||
|
2009
|
2008
|
2007
|
||||||||||
| (in thousands) | ||||||||||||
|
Balance at beginning of year
|
$ | 7,455 | $ | 7,713 | $ | 7,297 | ||||||
|
Increases related to tax positions taken during the current year
|
1,685 | 595 | 65 | |||||||||
|
Decreases related to tax positions taken during prior years
|
(1,049 | ) | (1,479 | ) | (454 | ) | ||||||
|
Increases related to tax positions taken during the prior years
|
1,118 | 1,106 | 389 | |||||||||
|
Changes due to foreign currency translation
|
342 | (480 | ) | 416 | ||||||||
|
Balance at end of year
|
$ | 9,551 | $ | 7,455 | $ | 7,713 | ||||||
69
INTERFACE, INC. AND SUBSIDIARIES -- NOTES TO CONSOLIDATED FINANCIAL STATEMENTS
DISCONTINUED OPERATIONS
As discussed below in the Note entitled “Sale of Fabrics Business,” in 2007, the Company sold its Fabrics Group business segment. Therefore, the results for the Fabrics Group business segment have been reported as discontinued operations. In connection with this action, the Company also recorded write-downs for the impairment of assets and goodwill of $17.4 million and $44.5 million, respectively, in 2007. In connection with the sale, the Company recorded the aforementioned impairments to reduce the carrying value of the business segment to its fair value. In 2007, the Company recorded approximately $12.4 million of direct costs to sell the Fabrics Group business segment.
Summary operating results for the discontinued operations are as follows:
|
FISCAL YEAR
|
||||||||||||
|
2009
|
2008
|
2007
|
||||||||||
|
(in thousands)
|
||||||||||||
|
Net sales
|
$ | -- | $ | -- | $ | 82,003 | ||||||
|
Loss on operations before taxes
|
(1,398 | ) | (7,856 | ) | (79,825 | ) | ||||||
|
Taxes on income (benefit)
|
(489 | ) | (2,702 | ) | (11,165 | ) | ||||||
|
Loss on operations, net of tax
|
(909 | ) | (5,154 | ) | (68,660 | ) | ||||||
Assets and liabilities, including reserves, related to discontinued businesses that were held for sale consist of the following:
|
FISCAL YEAR
|
||||||||
|
2009
|
2008
|
|||||||
|
(in thousands)
|
||||||||
|
Current assets
|
$ | -- | $ | -- | ||||
|
Property and equipment
|
1,500 | 3,150 | ||||||
|
Other assets
|
-- | -- | ||||||
|
Current liabilities
|
-- | -- | ||||||
|
Other liabilities
|
-- | -- | ||||||
HEDGING TRANSACTIONS AND DERIVATIVE FINANCIAL INSTRUMENTS
The Company has used derivative financial instruments for the purpose of reducing its exposure to adverse fluctuations in interest rates. While these hedging instruments are subject to fluctuations in value, such fluctuations are offset by the fluctuations in values of the underlying exposures being hedged. The Company has not held or issued derivative financial instruments for trading purposes. The Company has historically monitored the use of derivative financial instruments through the use of objective measurable systems, well-defined market and credit risk limits, and timely reports to senior management according to prescribed guidelines. The Company has established strict counter-party credit guidelines and has entered into transactions only with financial institutions of investment grade or better. As a result, the Company has historically considered the risk of counter-party default to be minimal. As of January 3, 2010, and December 28, 2008, the Company was not a party to any significant hedging transactions or derivative financial instruments.
70
INTERFACE, INC. AND SUBSIDIARIES -- NOTES TO CONSOLIDATED FINANCIAL STATEMENTS
COMMITMENTS AND CONTINGENCIES
The Company leases certain production, distribution and marketing facilities and equipment. At January 3, 2010, aggregate minimum rent commitments under operating leases with initial or remaining terms of one year or more consisted of the following:
|
FISCAL YEAR
|
AMOUNT
|
|||
|
(in thousands)
|
||||
|
2010
|
$ | 25,511 | ||
|
2011
|
21,077 | |||
|
2012
|
16,629 | |||
|
2013
|
11,935 | |||
|
2014
|
6,605 | |||
|
Thereafter
|
2,359 | |||
| $ | 84,116 | |||
The totals above exclude minimum lease payments of $0.4 million in 2010 related to discontinued operations.
Rental expense amounted to approximately $28.8 million, $28.1 million and $23.1 million, for the years 2009, 2008 and 2007, respectively. This excludes rental expenses of approximately $0.5 million, $0.7 million and $3.0 million for 2009, 2008 and 2007, respectively, related to discontinued operations.
The Company is from time to time a party to routine litigation incidental to its business. Management does not believe that the resolution of any or all of such litigation will have a material adverse effect on the Company’s financial condition or results of operations.
EMPLOYEE BENEFIT PLANS
Defined Contribution and Deferred Compensation Plans
The Company has a 401(k) retirement investment plan (“401(k) Plan”), which is open to all otherwise eligible U.S. employees with at least six months of service. The 401(k) Plan calls for Company matching contributions on a sliding scale based on the level of the employee’s contribution. The Company may, at its discretion, make additional contributions to the 401(k) Plan based on the attainment of certain performance targets by its subsidiaries. The Company’s matching contributions are funded bi-monthly and totaled approximately $0.9 million, $2.5 million and $2.4 million for the years 2009, 2008 and 2007, respectively, for continuing operations. These totals exclude $0.4 million of matching contributions for 2007, related to discontinued operations. No discretionary contributions were made in 2009, 2008 or 2007.
Under the Company’s nonqualified savings plans (“NSPs”), the Company provides eligible employees the opportunity to enter into agreements for the deferral of a specified percentage of their compensation, as defined in the NSPs. The NSPs call for Company matching contributions on a sliding scale based on the level of the employee’s contribution. The obligations of the Company under such agreements to pay the deferred compensation in the future in accordance with the terms of the NSPs are unsecured general obligations of the Company. Participants have no right, interest or claim in the assets of the Company, except as unsecured general creditors. The Company has established a Rabbi Trust to hold, invest and reinvest deferrals and contributions under the NSPs. If a change in control of the Company occurs, as defined in the NSPs, the Company will contribute an amount to the Rabbi Trust sufficient to pay the obligation owed to each participant. Deferred compensation in connection with the NSPs totaled $16.8 million at January 3, 2010. The Company invested the deferrals in insurance instruments with readily determinable cash surrender values.
71
INTERFACE, INC. AND SUBSIDIARIES -- NOTES TO CONSOLIDATED FINANCIAL STATEMENTS
Foreign Defined Benefit Plans
The Company has trusteed defined benefit retirement plans which cover many of its European employees. The benefits are generally based on years of service and the employee’s average monthly compensation. Pension expense was $4.2 million, $3.4 million and $5.1 million for the years 2009, 2008 and 2007, respectively. Plan assets are primarily invested in equity and fixed income securities. The Company uses a year-end measurement date for the plans. As of January 3, 2010, for the European plans, the Company had a net liability recorded of $12.0 million, an amount equal to their unfunded status, and has recorded in Other Comprehensive Income an amount equal to $30.0 million (net of taxes) related to the future amounts to be recorded in net post-retirement benefit costs.
The tables presented below set forth the funded status of the Company’s significant foreign defined benefit plans and required disclosures in accordance with applicable accounting standards
|
FISCAL YEAR
|
||||||||
|
2009
|
2008
|
|||||||
|
(in thousands)
|
||||||||
|
Change in benefit obligation
|
||||||||
|
Benefit obligation, beginning of year
|
$ | 171,247 | $ | 239,111 | ||||
|
Service cost
|
2,760 | 3,104 | ||||||
|
Interest cost
|
10,456 | 12,593 | ||||||
|
Benefits paid
|
(9,698 | ) | (10,747 | ) | ||||
|
Actuarial loss (gain)
|
24,490 | (29,728 | ) | |||||
|
Member contributions
|
552 | 685 | ||||||
|
Currency translation adjustment
|
12,532 | (43,771 | ) | |||||
|
Benefit obligation, end of year
|
$ | 212,339 | $ | 171,247 | ||||
|
Change in plan assets
|
||||||||
|
Plan assets, beginning of year
|
$ | 162,604 | $ | 230,414 | ||||
|
Actual return on assets
|
29,165 | (25,532 | ) | |||||
|
Company contributions
|
5,794 | 6,977 | ||||||
|
Member contributions
|
1,096 | 1,249 | ||||||
|
Benefits paid
|
(9,836 | ) | (10,747 | ) | ||||
|
Currency translation adjustment
|
11,479 | (39,757 | ) | |||||
|
Plan assets, end of year
|
$ | 200,302 | $ | 162,604 | ||||
|
Reconciliation to balance sheet
|
||||||||
|
Funded status (benefit liability)
|
$ | (12,037 | ) | $ | (8,643 | ) | ||
|
Unrecognized actuarial loss
|
-- | -- | ||||||
|
Unrecognized prior service cost
|
-- | -- | ||||||
|
Unrecognized transition adjustment
|
-- | -- | ||||||
|
Net amount recognized
|
$ | (12,037 | ) | $ | (8,643 | ) | ||
|
Amounts recognized in accumulated other comprehensive income (after tax)
|
||||||||
|
Unrecognized actuarial loss
|
$ | 28,965 | $ | 24,354 | ||||
|
Unamortized prior service costs
|
1,006 | 861 | ||||||
|
Total amount recognized
|
$ | 29,971 | $ | 25,215 | ||||
72
INTERFACE, INC. AND SUBSIDIARIES -- NOTES TO CONSOLIDATED FINANCIAL STATEMENTS
The above disclosure represents the aggregation of information related to the Company’s two defined benefit plans which cover many of its European employees. As of January 3, 2010, and December 28, 2008, one of these plans, which primarily covers certain employees in the United Kingdom (the “UK Plan”), had an accumulated benefit obligation in excess of the plan assets. The other plan, which covers certain employees in Europe (the “Europe Plan”), had assets in excess of the accumulated benefit obligation. The following table summarizes this information as of January 3, 2010, and December 28, 2008.
|
2009
|
2008
|
|||||||
|
UK Plan
|
(in thousands)
|
|||||||
|
Projected Benefit Obligation
|
$ | 153,020 | $ | 118,834 | ||||
|
Accumulated Benefit Obligation
|
153,020 | 116,757 | ||||||
|
Plan Assets
|
136,166 | 106,141 | ||||||
|
Europe Plan
|
||||||||
|
Projected Benefit Obligation
|
$ | 59,320 | $ | 52,413 | ||||
|
Accumulated Benefit Obligation
|
51,741 | 50,323 | ||||||
|
Plan Assets
|
64,136 | 56,463 | ||||||
|
FISCAL YEAR
|
||||||||||||
|
2009
|
2008
|
2007
|
||||||||||
|
(in thousands)
|
||||||||||||
|
Components of net periodic benefit cost
|
||||||||||||
|
Service cost
|
$ | 2,841 | $ | 3,190 | $ | 3,453 | ||||||
|
Interest cost
|
10,456 | 12,593 | 12,531 | |||||||||
|
Expected return on plan assets
|
(10,809 | ) | (13,640 | ) | (13,766 | ) | ||||||
|
Amortization of prior service cost
|
93 | 46 | 42 | |||||||||
|
Recognized net actuarial (gains)/losses
|
1,626 | 1,250 | 2,834 | |||||||||
|
Amortization of transition asset
|
-- | -- | -- | |||||||||
|
Net periodic benefit cost
|
$ | 4,207 | $ | 3,439 | $ | 5,094 | ||||||
For 2010, it is estimated that approximately $1.6 million of expenses related to the amortization of unrecognized items will be included in the net periodic benefit cost. During 2009, other comprehensive income was impacted by approximately $2.5 million, after tax, comprised of actuarial loss of approximately $4.1 million and amortization loss of $1.6 million. These two factors would have led to a decrease in accumulated other comprehensive income of $2.5 million, net of tax; however, the actual net change in accumulated other comprehensive income related to this plan, after tax, was a $4.8 million decrease in accumulated other comprehensive income. The primary reason for the overall net decrease is the strengthening of the British pound and the euro versus the U.S. dollar as of the end of 2009 versus 2008.
|
FISCAL YEAR
|
||||||||||||
|
2009
|
2008
|
2007
|
||||||||||
|
Weighted average assumptions used to determine net periodic benefit cost
|
||||||||||||
|
Discount rate
|
6.2 | % | 5.8 | % | 5.0 | % | ||||||
|
Expected return on plan assets
|
6.2 | % | 6.2 | % | 6.2 | % | ||||||
|
Rate of compensation
|
3.6 | % | 4.3 | % | 3.4 | % | ||||||
|
Weighted average assumptions used to determine benefit obligations
|
||||||||||||
|
Discount rate
|
5.4 | % | 6.0 | % | 5.6 | % | ||||||
|
Rate of compensation
|
2.0 | % | 3.1 | % | 3.3 | % | ||||||
73
INTERFACE, INC. AND SUBSIDIARIES -- NOTES TO CONSOLIDATED FINANCIAL STATEMENTS
The expected long-term rate of return on plan assets assumption is based on weighted average expected returns for each asset class. Expected returns reflect a combination of historical performance analysis and the forward-looking views of the financial markets, and include input from actuaries, investment service firms and investment managers.
The Company’s foreign defined benefit plans’ accumulated benefit obligations were in excess of the fair value of the plans’ assets. The projected benefit obligations, accumulated benefit obligations and fair value of these plan assets are as follows:
|
FISCAL YEAR
|
||||||||
|
2009
|
2008
|
|||||||
|
(in thousands)
|
||||||||
|
Projected benefit obligation
|
$ | 212,339 | $ | 171,247 | ||||
|
Accumulated benefit obligations
|
204,761 | 167,080 | ||||||
|
Fair value of plan assets
|
200,302 | 162,604 | ||||||
The investment objectives of the foreign defined benefit plans are to maximize the return on the investments without exceeding the limits of the prudent pension fund investment, to ensure that the assets would be sufficient to exceed minimum funding requirements, and to achieve a favorable return against the performance expectation based on historic and projected rates of return over the short term. The goal is to optimize the long-term return on plan assets at a moderate level of risk, by balancing higher-returning assets, such as equity securities, with less volatile assets, such as fixed income securities. The assets are managed by professional investment firms and performance is evaluated periodically against specific benchmarks. The plans’ net assets did not include the Company’s own stock at January 3, 2010, or December 28, 2008.
The Company’s actual weighted average asset allocations for 2009 and 2008, and the targeted asset allocation for 2010, of the foreign defined benefit plans by asset category, are as follows:
|
FISCAL YEAR
|
||||||||||||
|
2010
|
2009
|
2008
|
||||||||||
|
Target Allocation
|
Percentage of Plan Assets at Year End
|
|||||||||||
|
Asset Category:
|
||||||||||||
|
Equity Securities
|
70-85 | % | 71 | % | 69 | % | ||||||
|
Debt Securities
|
25-35 | % | 25 | % | 26 | % | ||||||
|
Other
|
0-5 | % | 4 | % | 5 | % | ||||||
| 100 | % | 100 | % | 100 | % | |||||||
Fair Value Measurements of Plan Assets
Accounting standards establish a fair value hierarchy that prioritizes the inputs to valuation techniques used to measure estimated fair value. The hierarchy gives the highest priority to unadjusted quoted prices in active markets for identical assets or liabilities (level 1 measurements) and the lowest priority to unobservable inputs (level 3 measurements). The three levels of the fair value hierarchy under applicable accounting standards are described below:
|
Level 1
|
Unadjusted quoted prices in active markets that are accessible at the measurement date for identical, unrestricted assets or liabilities.
|
|
|
Level 2
|
Inputs to the valuation methodology include:
|
|
|
· quoted prices for similar assets in active markets;
|
||
|
· quoted prices for identical or similar assets in inactive markets;
|
||
|
· inputs other than quoted prices that are observable for the asset; and
|
||
|
· inputs that are derived principally or corroborated by observable data by correlation or other means.
|
||
|
Level 3
|
Prices or valuations that require inputs that are both significant to the fair value measurement and unobservable.
|
74
INTERFACE, INC. AND SUBSIDIARIES -- NOTES TO CONSOLIDATED FINANCIAL STATEMENTS
A financial instrument’s level within the fair value hierarchy is based on the lowest level of any input that is significant to the fair value measurement.
The following table sets forth by level within the fair value hierarchy the Plan assets at fair value, as of January 3, 2010. As required by accounting standards, assets are classified in their entirety based on the lowest level of input that is significant to the fair value measurement.
|
Pension Plan Assets by Category as of January 3, 2010
|
||||||||||||
|
Europe Plan
|
UK Plan
|
Total
|
||||||||||
|
(in thousands)
|
||||||||||||
|
Level 1
|
$ | 64,136 | $ | 128,423 | $ | 192,559 | ||||||
|
Level 2
|
-- | -- | -- | |||||||||
|
Level 3
|
-- | 7,743 | 7,743 | |||||||||
|
Total
|
$ | 64,136 | $ | 136,166 | $ | 200,302 | ||||||
The assets identified as level 3 above relate to insured annuities held by the UK Plan. The fair value of these assets was calculated using the present value of the future pension payments due. The table below indicates the change in value related to these level 3 assets during 2009:
|
(in thousands)
|
||||
|
Balance of level 3 assets, beginning of year
|
$ | 7,897 | ||
|
Interest cost
|
480 | |||
|
Benefits paid
|
(1,019 | ) | ||
|
Actuarial loss
|
(248 | ) | ||
|
Translation adjustment
|
633 | |||
|
Ending Balance of level 3 assets
|
$ | 7,743 | ||
During 2010, the Company expects to contribute $5.2 million to the plan trust and $9.5 million in the form of direct benefit payments for its foreign defined benefit plans. It is anticipated that future benefit payments for the foreign defined benefit plans will be as follows:
|
FISCAL YEAR
|
EXPECTED PAYMENTS
|
|||
|
(in thousands)
|
||||
|
2010
|
$ | 9,508 | ||
|
2011
|
9,752 | |||
|
2012
|
10,043 | |||
|
2013
|
10,227 | |||
|
2014
|
10,400 | |||
|
2015-2019
|
55,277 | |||
75
INTERFACE, INC. AND SUBSIDIARIES -- NOTES TO CONSOLIDATED FINANCIAL STATEMENTS
Domestic Defined Benefit Plan
The Company maintains a domestic nonqualified salary continuation plan (“SCP”), which is designed to induce selected officers of the Company to remain in the employ of the Company by providing them with retirement, disability and death benefits in addition to those which they may receive under the Company’s other retirement plans and benefit programs. The SCP entitles participants to: (i) retirement benefits upon normal retirement at age 65 (or early retirement as early as age 55) after completing at least 15 years of service with the Company (unless otherwise provided in the SCP), payable for the remainder of their lives (or, if elected by a participant, a reduced benefit is payable for the remainder of the participant’s life and any surviving spouse’s life) and in no event less than 10 years under the death benefit feature; (ii) disability benefits payable for the period of any total disability; and (iii) death benefits payable to the designated beneficiary of the participant for a period of up to 10 years. Benefits are determined according to one of three formulas contained in the SCP, and the SCP is administered by the Compensation Committee of the Company’s Board of Directors, which has full discretion in choosing participants and the benefit formula applicable to each. The Company’s obligations under the SCP are currently unfunded (although the Company uses insurance instruments to hedge its exposure thereunder). The Company is required to contribute the present value of its obligations thereunder to an irrevocable grantor trust in the event of a change in control as defined in the SCP. The Company uses a year-end measurement date for the domestic SCP.
The tables presented below set forth the required disclosures in accordance with applicable accounting standards, and amounts recognized in the consolidated financial statements related to the domestic SCP.
|
FISCAL YEAR
|
||||||||
|
2009
|
2008
|
|||||||
|
(in thousands)
|
||||||||
|
Change in benefit obligation
|
||||||||
|
Benefit obligation, beginning of year
|
$ | 17,108 | $ | 16,347 | ||||
|
Service cost
|
324 | 269 | ||||||
|
Interest cost
|
1,083 | 950 | ||||||
|
Benefits paid
|
(1,024 | ) | (1,024 | ) | ||||
|
Actuarial loss (gain)
|
(17 | ) | 566 | |||||
|
Benefit obligation, end of year
|
$ | 17,474 | $ | 17,108 | ||||
The amounts recognized in the consolidated balance sheets are as follows:
|
2009
|
2008
|
|||||||
|
(in thousands)
|
||||||||
|
Current liabilities
|
$ | 1,024 | $ | 1,024 | ||||
|
Non-current liabilities
|
16,450 | 16,084 | ||||||
| $ | 17,474 | $ | 17,108 | |||||
The components of the amounts in accumulated other comprehensive income, after tax, are as follows:
|
2009
|
2008
|
|||||||
|
(in thousands)
|
||||||||
|
Unrecognized actuarial loss
|
$ | 2,823 | $ | 3,001 | ||||
|
Unrecognized transition asset
|
262 | 395 | ||||||
|
Unamortized prior service cost
|
130 | 159 | ||||||
| $ | 3,215 | $ | 3,555 | |||||
76
INTERFACE, INC. AND SUBSIDIARIES -- NOTES TO CONSOLIDATED FINANCIAL STATEMENTS
The accumulated benefit obligation related to the SCP was $14.9 million and $14.6 million as of January 3, 2010, and December 28, 2008, respectively. The SCP is currently unfunded; as such, the benefit obligations disclosed are also the benefit obligations in excess of the plan assets. The Company uses insurance instruments to help limit its exposure under the SCP.
|
2009
|
2008
|
2007
|
||||||||||
|
(in thousands, except for weighted average assumptions)
|
||||||||||||
|
Weighted average assumptions used to determine net periodic benefit cost
|
||||||||||||
|
Discount rate
|
6.0 | % | 6.0 | % | 5.75 | % | ||||||
|
Rate of compensation
|
4.0 | % | 4.0 | % | 4.0 | % | ||||||
|
Weighted average assumptions used to determine benefit obligations
|
||||||||||||
|
Discount rate
|
6.0 | % | 6.0 | % | 6.0 | % | ||||||
|
Rate of compensation
|
4.0 | % | 4.0 | % | 4.0 | % | ||||||
|
Components of net periodic benefit cost
|
||||||||||||
|
Service cost
|
$ | 324 | $ | 268 | $ | 262 | ||||||
|
Interest cost
|
1,083 | 950 | 896 | |||||||||
|
Amortizations
|
545 | 563 | 554 | |||||||||
|
Net periodic benefit cost
|
$ | 1,952 | $ | 1,781 | $ | 1,712 | ||||||
The changes in other comprehensive income during 2009 related to this Plan were approximately $0.3 million, after tax, comprised of amortization of loss of $0.2 million and amortization of transition obligation of $0.1 million.
For 2010, the Company estimates that approximately $0.5 million of expenses related to the amortization of unrecognized items will be included in net periodic benefit cost for the SCP.
During 2009, the Company contributed $1.0 million in the form of direct benefit payments for its domestic SCP. It is anticipated that future benefit payments for the SCP will be as follows:
|
FISCAL YEAR
|
EXPECTED PAYMENTS
|
|||
|
(in thousands)
|
||||
|
2010
|
$ | 1,024 | ||
|
2011
|
1,024 | |||
|
2012
|
1,024 | |||
|
2013
|
1,024 | |||
|
2014
|
1,024 | |||
|
2015-2019
|
5,390 | |||
SALE OF FABRICS BUSINESS
In the second quarter of 2007, the Company entered into an agreement to sell its Fabrics Group business segment to a third party. The sale was completed in the third quarter of 2007. The purchase price for the business segment was $67.2 million, after working capital and certain other adjustments. Of this $67.2 million, $6.5 million represented deferred compensation which would be remitted to the Company upon the achievement of certain performance criteria by the disposed segment over the 18 months following the sale. In the third quarter of 2008, the Company determined that the receipt of the deferred amount was less than probable and therefore incurred an after-tax charge of $4.2 million related to a full reserve against the deferred amount. As described in the Notes entitled “Discontinued Operations” and “Impairment of Goodwill,” the Company incurred impairment charges of approximately $61.9 million during the first six months of 2007 to reduce the carrying value of the business segment to fair value as represented by the purchase price. In the second and third quarters of 2007, the Company incurred approximately $12.4 million of direct costs to sell the business segment. The major classes of assets and liabilities related to the business segment at disposition were accounts receivable of $15.2 million, inventory of $32.7 million, property, plant and equipment of $36.5 million, and accounts payable and accruals of $11.4 million.
77
INTERFACE, INC. AND SUBSIDIARIES -- NOTES TO CONSOLIDATED FINANCIAL STATEMENTS
Current and prior periods have been restated to include the results of operations and related disposal costs, gains and losses for these fabrics businesses as discontinued operations. In addition, assets and liabilities of these businesses have been reported in assets and liabilities held for sale for all periods presented.
SALE OF PANDEL
In 2007, the Company sold its subsidiary Pandel, Inc. for $1.4 million to an entity formed by the general manager of Pandel. The operations of Pandel represented the Company’s Specialty Products segment. Pandel primarily produced vinyl carpet tile backing and specialty mat and foam products. As a result of this sale, the Company recorded a loss on disposition of $1.9 million in 2007. The total assets of this business were $3.3 million, comprised primarily of inventory and accounts receivable. Total liabilities related to this business were $0.4 million. Prior to the sale, certain of Pandel’s production assets were conveyed to another subsidiary of the Company.
IMPAIRMENT OF GOODWILL
During the fourth quarters of 2009, 2008 and 2007, the Company performed the annual goodwill impairment test required by accounting standards. The Company performs this test at the reporting unit level, which is one level below the segment level for the Modular Carpet segment and at the level of the Bentley Prince Street segment. In effecting the impairment testing, the Company prepared valuations of reporting units on both a market comparable methodology and an income methodology in accordance with the applicable standards, and those valuations were compared with the respective book values of the reporting units to determine whether any goodwill impairment existed. In preparing the valuations, past, present and future expectations of performance were considered. For the Company’s reporting units which carried a goodwill balance as of January 3, 2010, no impairment of goodwill was indicated. In the fourth quarter of 2008, a goodwill impairment of $61.2 million related to the Bentley Prince Street reporting unit was identified due largely to the following factors:
|
·
|
The significant decline in the reporting unit performance, primarily in the last three months of 2008. This decline also was reflected in the forward projections of the reporting unit’s budgeting process. The projections showed a decline in both sales and operating income over the reporting unit’s three-year budgeting process. These declines impacted the value of the reporting unit from an income valuation approach. The declines in projections were primarily related to the global economic crisis and its impact on the broadloom carpet market.
|
|
·
|
An increase in the discount rate used to create the present value of future expected cash flows. This increase from approximately 12% to 16% was more reflective of the Company’s market capitalization and risk premiums on a reporting unit level, which impacted the value of the reporting unit using an income valuation approach.
|
|
·
|
A decrease in the market multiple factors used for the market valuation approach. This decrease was reflective of the general market conditions regarding current market activities and market valuation guidelines.
|
Each of the Company’s reporting units which carry goodwill balances maintained fair values in excess of their respective carrying values as of the fourth quarter of 2009, and therefore no impairment was indicated during their testing. As of January 3, 2010, if the Company’s estimates of the fair values of its reporting units were 10% lower, the Company believes no additional goodwill impairment would have existed.
In the first quarter of 2007, the Company recorded charges for impairment of goodwill of $44.5 million and impairment of other intangible assets of $3.8 million related to its Fabrics Group business segment. The Company was exploring possible strategic options with respect to its fabrics business, and its analyses indicated that the carrying value of the assets of the fabrics business exceeded their fair value. When such an indication is present, the Company measures potential goodwill and other asset impairments based on an allocation of the estimated fair value of the reporting unit to its underlying assets and liabilities. An impairment loss is recognized to the extent that the reporting unit’s recorded goodwill exceeds the implied fair value of goodwill. In addition to the impairment of goodwill, the Company determined that other intangible assets of the business unit were impaired as well. As discussed above in the Note entitled “Sale of Fabrics Business,” in the second quarter of 2007, the Company entered into an agreement to sell its fabrics business segment for approximately $67.2 million (after working capital and certain other adjustments). As a result of this agreed-upon purchase price, the Company recorded an impairment of assets of approximately $13.6 million in the second quarter of 2007. This impairment was determined based upon the fair value of the business segment as compared to the fair value represented by the purchase price. Given the nature of the Company’s assets and liabilities, the impairment charge was a reduction of carrying value of property, plant and equipment, as it was determined that all other assets were carried at a value approximating fair value. These impairment charges have been included in discontinued operations in the Consolidated Statement of Operations for 2007.
78
INTERFACE, INC. AND SUBSIDIARIES -- NOTES TO CONSOLIDATED FINANCIAL STATEMENTS
SEGMENT INFORMATION
Based on the quantitative thresholds specified by accounting standards, the Company has determined that it has three reportable segments: (1) the Modular Carpet segment, which includes its InterfaceFLOR, Heuga and FLOR modular carpet businesses, as well as its Intersept antimicrobial sales and licensing program, (2) the Bentley Prince Street segment, which includes its Bentley Prince Street broadloom, modular carpet and area rug businesses, and (3) the Specialty Products segment, which includes Pandel, Inc., a producer of vinyl carpet tile backing and specialty mat and foam products. The majority of the operations of the Specialty Products segment were sold in March 2007. In July 2007, the Company completed the sale of its former Fabrics Group business segment. Accordingly, the Company has included the operations of the former Fabrics Group business segment in discontinued operations. The former segment known as the Re:Source Network, which primarily encompassed the Company’s owned Re:Source dealers that provided carpet installation and maintenance services in the United States, is also reported as discontinued operations in the accompanying Consolidated Statements of Operations. The Company’s InterfaceServices business continues to provide “turnkey” project management solutions to its customers. The Company aggregates the InterfaceServices business into the Modular Carpet segment based on the similar class of customer and the similar methods used to provide the products and services. InterfaceServices does not meet the quantitative thresholds to be presented as a separate operating segment.
The accounting policies of the operating segments are the same as those described in the Note entitled “Summary of Significant Accounting Policies.” Segment amounts disclosed are prior to any elimination entries made in consolidation, except in the case of net sales, where intercompany sales have been eliminated. Intersegment sales are accounted for at fair value as if sales were to third parties. Intersegment sales are not material. The chief operating decision maker evaluates performance of the segments based on operating income. Costs excluded from this profit measure primarily consist of allocated corporate expenses, interest/other expense and income taxes. Corporate expenses are primarily comprised of corporate overhead expenses. Thus, operating income includes only the costs that are directly attributable to the operations of the individual segment. Fiscal year 2009 includes $5.9 million of income at the corporate level from litigation settlements. Assets not identifiable to an individual segment are corporate assets, which are primarily comprised of cash and cash equivalents, intangible assets and intercompany amounts, which are eliminated in consolidation.
SEGMENT DISCLOSURES
Summary information by segment follows:
|
MODULAR
CARPET
|
BENTLEY PRINCE STREET
|
SPECIALTY
PRODUCTS
|
TOTAL
|
|||||||||||||
|
(in thousands)
|
||||||||||||||||
|
2009
|
||||||||||||||||
|
Net sales
|
$ | 765,264 | $ | 94,624 | -- | $ | 859,888 | |||||||||
|
Depreciation and amortization
|
17,429 | 2,435 | -- | 19,864 | ||||||||||||
|
Operating income
|
68,134 | (7,718 | ) | -- | 60,416 | |||||||||||
|
Total assets
|
508,119 | 53,829 | -- | 561,948 | ||||||||||||
|
2008
|
||||||||||||||||
|
Net sales
|
$ | 946,816 | $ | 135,528 | $ | -- | $ | 1,082,344 | ||||||||
|
Depreciation and amortization
|
15,591 | 2,396 | -- | 17,987 | ||||||||||||
|
Operating income
|
109,299 | (61,379 | ) | -- | 47,920 | |||||||||||
|
Total assets
|
501,524 | 68,389 | -- | 569,913 | ||||||||||||
|
2007
|
||||||||||||||||
|
Net sales
|
$ | 930,717 | $ | 148,364 | $ | 2,192 | $ | 1,081,273 | ||||||||
|
Depreciation and amortization
|
14,597 | 1,891 | 12 | 16,500 | ||||||||||||
|
Operating income
|
133,657 | 5,593 | (1,733 | ) | 137,517 | |||||||||||
|
Total assets
|
541,254 | 129,261 | -- | 670,515 | ||||||||||||
79
INTERFACE, INC. AND SUBSIDIARIES -- NOTES TO CONSOLIDATED FINANCIAL STATEMENTS
A reconciliation of the Company’s total segment operating income, depreciation and amortization, and assets to the corresponding consolidated amounts are as follows:
|
FISCAL YEAR
|
||||||||||||
|
2009
|
2008
|
2007
|
||||||||||
|
(in thousands)
|
||||||||||||
|
DEPRECIATION AND AMORTIZATION
|
||||||||||||
|
Total segment depreciation and amortization
|
$ | 19,864 | $ | 17,987 | $ | 16,500 | ||||||
|
Corporate depreciation and amortization
|
5,325 | 5,677 | 5,987 | |||||||||
|
Reported depreciation and amortization
|
$ | 25,189 | $ | 23,664 | $ | 22,487 | ||||||
|
OPERATING INCOME
|
||||||||||||
|
Total segment operating income
|
$ | 60,416 | $ | 47,920 | $ | 137,517 | ||||||
|
Corporate expenses, income and eliminations
|
2,578 | (6,261 | ) | (8,126 | ) | |||||||
|
Reported operating income
|
$ | 62,994 | $ | 41,659 | $ | 129,391 | ||||||
|
ASSETS
|
||||||||||||
|
Total segment assets
|
$ | 561,948 | $ | 569,913 | ||||||||
|
Discontinued operations
|
1,500 | 3,150 | ||||||||||
|
Corporate assets and eliminations
|
163,791 | 132,972 | ||||||||||
|
Reported total assets
|
$ | 727,239 | $ | 706,035 | ||||||||
ENTERPRISE-WIDE DISCLOSURES
The Company has a large and diverse customer base, which includes numerous customers located in foreign countries. No single unaffiliated customer accounted for more than 10% of total sales in any year during the past three years. Sales in foreign markets in 2009, 2008 and 2007 were 49.5%, 52.5% and 51.5%, respectively, of total net sales. These sales were primarily to customers in Europe, Canada, Asia, Australia and Latin America. With the exception of the United States and the United Kingdom, no one country represented more than 10% of the Company’s net sales. Revenue and long-lived assets related to operations in the United States and other countries are as follows:
|
FISCAL YEAR
|
||||||||||||
|
2009
|
2008
|
2007
|
||||||||||
|
(in thousands)
|
||||||||||||
|
SALES TO UNAFFILIATED CUSTOMERS(1)
|
||||||||||||
|
United States
|
$ | 434,305 | $ | 506,994 | $ | 524,542 | ||||||
|
United Kingdom
|
105,370 | 146,959 | 159,061 | |||||||||
|
Other foreign countries
|
320,213 | 428,391 | 397,670 | |||||||||
|
Net sales
|
$ | 859,888 | $ | 1,082,344 | $ | 1,081,273 | ||||||
|
LONG-LIVED ASSETS(2)
|
||||||||||||
|
United States
|
$ | 80,422 | $ | 85,482 | ||||||||
|
United Kingdom
|
21,346 | 21,487 | ||||||||||
|
Netherlands
|
20,354 | 19,832 | ||||||||||
|
Australia
|
21,980 | 14,072 | ||||||||||
|
Other foreign countries
|
18,167 | 19,844 | ||||||||||
|
Total long-lived assets
|
$ | 162,269 | $ | 160,717 | ||||||||
(1) Revenue attributed to geographic areas is based on the location of the customer.
(2) Long-lived assets include tangible assets physically located in foreign countries.
80
INTERFACE, INC. AND SUBSIDIARIES -- NOTES TO CONSOLIDATED FINANCIAL STATEMENTS
QUARTERLY DATA AND SHARE INFORMATION (UNAUDITED)
The following tables set forth, for the fiscal periods indicated, selected consolidated financial data and information regarding the market price per share of the Company’s Class A Common Stock. The prices represent the reported high and low sale prices during the period presented.
|
FISCAL YEAR 2009
|
||||||||||||||||
|
FIRST
QUARTER(1)
|
SECOND
QUARTER(2)
|
THIRD
QUARTER
|
FOURTH
QUARTER
|
|||||||||||||
|
(in thousands, except per share data)
|
||||||||||||||||
|
Net sales
|
$ | 199,308 | $ | 211,297 | $ | 218,364 | $ | 230,919 | ||||||||
|
Gross profit
|
63,169 | 69,106 | 72,412 | 78,330 | ||||||||||||
|
Income (loss) from continuing operations
|
(3,373 | ) | 3,799 | 5,690 | 6,558 | |||||||||||
|
Loss from discontinued operations
|
(650 | ) | -- | -- | (259 | ) | ||||||||||
|
Net income (loss) attributable to Interface, Inc.
|
(4,152 | ) | 3,666 | 5,457 | 5,948 | |||||||||||
|
Basic income (loss) per share attributable to Interface, Inc. common shareholders:
|
||||||||||||||||
|
Income (loss) from continuing operations
|
$ | (0.06 | ) | $ | 0.06 | $ | 0.09 | $ | 0.10 | |||||||
|
Loss from discontinued operations
|
(0.01 | ) | -- | -- | (0.01 | ) | ||||||||||
|
Net income (loss) attributable to Interface, Inc.
|
(0.07 | ) | 0.06 | 0.09 | 0.09 | |||||||||||
|
Diluted income (loss) per share attributable to Interface, Inc. common shareholders:
|
||||||||||||||||
|
Income (loss) from continuing operations
|
$ | (0.06 | ) | $ | 0.06 | $ | 0.09 | $ | 0.10 | |||||||
|
Loss from discontinued operations
|
(0.01 | ) | -- | -- | (0.01 | ) | ||||||||||
|
Net income (loss) attributable to Interface, Inc.
|
(0.07 | ) | 0.06 | 0.09 | 0.09 | |||||||||||
|
Share prices
|
||||||||||||||||
|
High
|
$ | 5.12 | $ | 7.02 | $ | 9.01 | $ | 8.99 | ||||||||
|
Low
|
1.45 | 3.08 | 5.22 | 6.90 | ||||||||||||
|
(1)
|
Results for the first quarter of 2009 include restructuring charges of $5.7 million.
|
|
(2)
|
Results for the second quarter of 2009 include (i) income from litigation settlements of $5.9 million, (ii) restructuring charges of $1.9 million, and (iii) bond retirement expenses of $6.1 million.
|
81
INTERFACE, INC. AND SUBSIDIARIES -- NOTES TO CONSOLIDATED FINANCIAL STATEMENTS
|
FISCAL YEAR 2008
|
||||||||||||||||
|
FIRST
QUARTER
|
SECOND
QUARTER
|
THIRD
QUARTER(1)
|
FOURTH
QUARTER(2)
|
|||||||||||||
|
(in thousands, except per share data)
|
||||||||||||||||
|
Net sales
|
$ | 261,736 | $ | 295,005 | $ | 278,423 | $ | 247,180 | ||||||||
|
Gross profit
|
94,266 | 105,293 | 94,917 | 77,569 | ||||||||||||
|
Income (loss) from continuing operations
|
14,297 | 16,292 | 13,844 | (78,946 | ) | |||||||||||
|
Loss from discontinued operations
|
-- | -- | (5,154 | ) | -- | |||||||||||
|
Net income (loss) attributable to Interface, Inc.
|
14,122 | 15,876 | 8,430 | (79,301 | ) | |||||||||||
|
Basic income (loss) per share attributable to Interface, Inc. common shareholders:
|
||||||||||||||||
|
Income (loss) from continuing operations
|
$ | 0.23 | $ | 0.25 | $ | 0.22 | $ | (1.29 | ) | |||||||
|
Loss from discontinued operations
|
-- | -- | (0.08 | ) | -- | |||||||||||
|
Net income (loss) attributable to Interface, Inc.
|
0.23 | 0.25 | 0.13 | (1.29 | ) | |||||||||||
|
Diluted income (loss) per share attributable to Interface, Inc. common shareholders:
|
||||||||||||||||
|
Income (loss) from continuing operations
|
$ | 0.22 | $ | 0.25 | $ | 0.21 | $ | (1.29 | ) | |||||||
|
Loss from discontinued operations
|
-- | -- | (0.08 | ) | -- | |||||||||||
|
Net income (loss) attributable to Interface, Inc.
|
0.22 | 0.25 | 0.13 | (1.29 | ) | |||||||||||
|
Share prices
|
||||||||||||||||
|
High
|
$ | 18.00 | $ | 15.00 | $ | 13.85 | $ | 11.80 | ||||||||
|
Low
|
13.11 | 12.10 | 11.04 | 3.63 | ||||||||||||
|
(1)
|
In the third quarter of 2008, the Company recorded an after-tax write-off of $4.2 million for the deferred purchase price related to the 2007 sale of its Fabrics Group business segment, as well as $1.0 million of after-tax write-downs of other assets related to discontinued operations.
|
|
(2)
|
In the fourth quarter of 2008, the Company recorded a charge for impairment of goodwill of $61.2 million related to its Bentley Prince Street business segment, and a restructuring charge of approximately $11 million.
|
82
INTERFACE, INC. AND SUBSIDIARIES -- NOTES TO CONSOLIDATED FINANCIAL STATEMENTS
SUPPLEMENTAL GUARANTOR CONDENSED CONSOLIDATING FINANCIAL STATEMENTS
The “guarantor subsidiaries,” which consist of the Company’s principal domestic subsidiaries, are guarantors of the Company’s 10.375% Senior Notes due 2010 (which have now been repaid), its 11 3/8% Senior Secured Notes due 2013, and its 9.5% Senior Subordinated Notes due 2014. The Supplemental Guarantor Financial Statements are presented herein pursuant to requirements of the Commission.
STATEMENT OF OPERATIONS FOR YEAR 2009
|
GUARANTOR
SUBSIDIARIES
|
NON-
GUARANTOR
SUBSIDIARIES
|
INTERFACE, INC.
(PARENT
CORPORATION)
|
CONSOLIDATION
AND
ELIMINATION
ENTRIES
|
CONSOLIDATED
TOTALS
|
||||||||||||||||
|
(in thousands)
|
||||||||||||||||||||
|
Net sales
|
$ | 542,871 | $ | 428,090 | $ | -- | $ | (111,073 | ) | $ | 859,888 | |||||||||
|
Cost of sales
|
405,313 | 282,631 | -- | (111,073 | ) | 576,871 | ||||||||||||||
|
Gross profit on sales
|
137,558 | 145,459 | -- | -- | 283,017 | |||||||||||||||
|
Selling, general and administrative expenses
|
90,105 | 108,911 | 19,306 | -- | 218,322 | |||||||||||||||
|
Income from litigation settlements
|
-- | -- | (5,926 | ) | -- | (5,926 | ) | |||||||||||||
|
Restructuring charges
|
3,960 | 3,667 | -- | -- | 7,627 | |||||||||||||||
|
Operating income (loss)
|
43,493 | 32,881 | (13,380 | ) | -- | 62,994 | ||||||||||||||
|
Interest/Other expense
|
20,804 | 7,498 | 6,571 | -- | 34,873 | |||||||||||||||
|
Bond retirement expenses
|
-- | -- | 6,096 | -- | 6,096 | |||||||||||||||
|
Income (loss) before taxes on income and equity in income of subsidiaries
|
22,689 | 25,383 | (26,047 | ) | -- | 22,025 | ||||||||||||||
|
Income tax expense (benefit)
|
8,738 | 9,030 | (8,416 | ) | -- | 9,352 | ||||||||||||||
|
Equity in income (loss) of subsidiaries
|
-- | -- | 28,549 | (28,549 | ) | -- | ||||||||||||||
|
Income (loss) from continuing operations
|
13,951 | 16,353 | 10,918 | (28,549 | ) | 12,673 | ||||||||||||||
|
Income (loss) on discontinued operations, net of tax
|
(259 | ) | (650 | ) | -- | -- | (909 | ) | ||||||||||||
|
Net income (loss)
|
13,692 | 15,703 | 10,918 | (28,549 | ) | 11,764 | ||||||||||||||
|
Income attributable to non-controlling interest in subsidiary
|
-- | (846 | ) | -- | -- | (846 | ) | |||||||||||||
|
Net income (loss) attributable to Interface, Inc.
|
$ | 13,692 | $ | 14,857 | $ | 10,918 | $ | (28,549 | ) | $ | 10,918 | |||||||||
83
INTERFACE, INC. AND SUBSIDIARIES -- NOTES TO CONSOLIDATED FINANCIAL STATEMENTS
STATEMENT OF OPERATIONS FOR YEAR 2008
|
GUARANTOR SUBSIDIARIES
|
NONGUARANTOR SUBSIDIARIES
|
INTERFACE, INC. (PARENT CORPORATION)
|
CONSOLIDATION & ELIMINATION ENTRIES
|
CONSOLIDATED TOTALS
|
||||||||||||||||
|
(in thousands)
|
||||||||||||||||||||
|
Net sales
|
$ | 632,566 | $ | 564,008 | $ | -- | $ | (114,230 | ) | $ | 1,082,344 | |||||||||
|
Cost of sales
|
464,450 | 360,079 | -- | (114,230 | ) | 710,299 | ||||||||||||||
|
Gross profit on sales
|
168,116 | 203,929 | -- | -- | 372,045 | |||||||||||||||
|
Selling, general and administrative expenses
|
107,696 | 121,561 | 28,941 | -- | 258,198 | |||||||||||||||
|
Impairment of goodwill
|
61,213 | -- | -- | -- | 61,213 | |||||||||||||||
|
Restructuring charge
|
7,482 | 3,348 | 145 | -- | 10,975 | |||||||||||||||
|
Operating income (loss)
|
(8,275 | ) | 79,020 | (29,086 | ) | -- | 41,659 | |||||||||||||
|
Interest/Other expense
|
16,406 | 15,418 | 1,308 | -- | 33,132 | |||||||||||||||
|
Income (loss) before taxes on income and equity in income of subsidiaries
|
(24,681 | ) | 63,602 | (30,394 | ) | -- | 8,527 | |||||||||||||
|
Income tax expense (benefit)
|
12,594 | 21,386 | 9,060 | -- | 43,040 | |||||||||||||||
|
Equity in income (loss) of subsidiaries
|
-- | -- | (1,419 | ) | 1,419 | -- | ||||||||||||||
|
Income (loss) from continuing operations
|
(37,275 | ) | 42,216 | (40,873 | ) | 1,419 | (34,513 | ) | ||||||||||||
|
Income (loss) on discontinued operations, net of tax
|
(5,154 | ) | -- | -- | -- | (5,154 | ) | |||||||||||||
|
Net income (loss)
|
(42,429 | ) | 42,216 | (40,873 | ) | 1,419 | (39,667 | ) | ||||||||||||
|
Net income attributable to noncontrolling interest in subsidiary
|
-- | (1,206 | ) | -- | -- | (1,206 | ) | |||||||||||||
|
Net income (loss) attributable to Interface, Inc.
|
$ | (42,429 | ) | $ | 41,010 | $ | (40,873 | ) | $ | 1,419 | $ | (40,873 | ) | |||||||
84
INTERFACE, INC. AND SUBSIDIARIES -- NOTES TO CONSOLIDATED FINANCIAL STATEMENTS
STATEMENT OF OPERATIONS FOR YEAR 2007
|
GUARANTOR SUBSIDIARIES
|
NONGUARANTOR SUBSIDIARIES
|
INTERFACE, INC. (PARENT CORPORATION)
|
CONSOLIDATION & ELIMINATION ENTRIES
|
CONSOLIDATED TOTALS
|
||||||||||||||||
|
(in thousands)
|
||||||||||||||||||||
|
Net sales
|
$ | 643,887 | $ | 549,795 | $ | -- | $ | (112,409 | ) | $ | 1,081,273 | |||||||||
|
Cost of sales
|
471,738 | 344,422 | -- | (112,409 | ) | 703,751 | ||||||||||||||
|
Gross profit on sales
|
172,149 | 205,373 | -- | -- | 377,522 | |||||||||||||||
|
Selling, general and administrative expenses
|
101,594 | 115,254 | 29,410 | -- | 246,258 | |||||||||||||||
|
Loss on disposal – Pandel, Inc.
|
1,873 | -- | -- | -- | 1,873 | |||||||||||||||
|
Operating income (loss)
|
68,682 | 90,119 | (29,410 | ) | -- | 129,391 | ||||||||||||||
|
Interest/Other expense
|
11,603 | 9,693 | 13,541 | -- | 34,837 | |||||||||||||||
|
Income (loss) before taxes on income and equity in income of subsidiaries
|
57,079 | 80,426 | (42,951 | ) | -- | 94,554 | ||||||||||||||
|
Income tax expense (benefit)
|
26,534 | 25,364 | (16,316 | ) | -- | 35,582 | ||||||||||||||
|
Equity in income (loss) of subsidiaries
|
-- | -- | 15,823 | (15,823 | ) | -- | ||||||||||||||
|
Income (loss) from continuing operations
|
30,545 | 55,062 | (10,812 | ) | (15,823 | ) | 58,972 | |||||||||||||
|
Income (loss) on discontinued operations, net of tax
|
(68,660 | ) | -- | -- | -- | (68,660 | ) | |||||||||||||
|
Net income (loss)
|
(38,115 | ) | 55,062 | (10,812 | ) | (15,823 | ) | (9,688 | ) | |||||||||||
|
Net income attributable to noncontrolling interest in subsidiary
|
-- | (1,124 | ) | -- | -- | (1,124 | ) | |||||||||||||
|
Net income (loss) attributable to Interface, Inc.
|
$ | (38,115 | ) | $ | 53,938 | $ | (10,812 | ) | $ | (15,823 | ) | $ | (10,812 | ) | ||||||
85
INTERFACE, INC. AND SUBSIDIARIES -- NOTES TO CONSOLIDATED FINANCIAL STATEMENTS
BALANCE SHEET AS OF JANUARY 3, 2010
|
GUARANTOR SUBSIDIARIES
|
NON-GUARANTOR SUBSIDIARIES
|
INTERFACE, INC.
(PARENT CORPORATION)
|
CONSOLIDATION AND ELIMINATION ENTRIES
|
CONSOLIDATED TOTALS
|
||||||||||||||||
|
(in thousands)
|
||||||||||||||||||||
|
ASSETS
|
||||||||||||||||||||
|
Current Assets:
|
||||||||||||||||||||
|
Cash and cash equivalents
|
$ | 545 | $ | 41,072 | $ | 73,746 | $ | -- | $ | 115,363 | ||||||||||
|
Accounts receivable
|
58,290 | 70,072 | 1,471 | -- | 129,833 | |||||||||||||||
|
Inventories
|
60,490 | 51,759 | -- | -- | 112,249 | |||||||||||||||
|
Prepaids and deferred income taxes
|
6,909 | 14,840 | 7,279 | -- | 29,028 | |||||||||||||||
|
Assets of business held for sale
|
-- | 1,500 | -- | -- | 1,500 | |||||||||||||||
|
Total current assets
|
126,234 | 179,243 | 82,496 | -- | 387,973 | |||||||||||||||
|
Property and equipment less accumulated depreciation
|
76,011 | 81,752 | 4,506 | -- | 162,269 | |||||||||||||||
|
Investment in subsidiaries
|
281,750 | 209,071 | 6,652 | (497,473 | ) | -- | ||||||||||||||
|
Goodwill
|
6,954 | 73,565 | -- | -- | 80,519 | |||||||||||||||
|
Other assets
|
7,756 | 13,805 | 74,917 | -- | 96,478 | |||||||||||||||
| Total assets | $ | 498,705 | $ | 557,436 | $ | 168,571 | $ | (497,473 | ) | $ | 727,239 | |||||||||
|
LIABILITIES AND SHAREHOLDERS’ EQUITY
|
||||||||||||||||||||
|
Current Liabilities:
|
$ | 45,545 | $ | 84,341 | $ | 21,457 | $ | -- | $ | 151,343 | ||||||||||
|
Senior secured notes and senior subordinated notes
|
-- | -- | 280,184 | -- | 280,184 | |||||||||||||||
|
Deferred income taxes
|
1,614 | 10,507 | (5,092 | ) | -- | 7,029 | ||||||||||||||
|
Other
|
2,429 | 11,489 | 28,584 | -- | 42,502 | |||||||||||||||
|
Total liabilities
|
49,588 | 106,337 | 325,133 | -- | 481,058 | |||||||||||||||
| Shareholders' equity | ||||||||||||||||||||
|
Common stock
|
94,145 | 102,199 | 6,328 | (196,344 | ) | 6,328 | ||||||||||||||
|
Additional paid-in capital
|
249,302 | 12,525 | 343,348 | (261,827 | ) | 343,348 | ||||||||||||||
|
Retained earnings (deficit)
|
107,150 | 372,898 | (496,078 | ) | (39,302 | ) | (55,332 | ) | ||||||||||||
|
Foreign currency translation adjustment
|
(1,480 | ) | (15,632 | ) | (6,945 | ) | -- | (24,057 | ) | |||||||||||
|
Pension liability
|
-- | (29,971 | ) | (3,215 | ) | -- | (33,186 | ) | ||||||||||||
|
Non-controlling interest in subsidiary
|
-- | 9,080 | -- | -- | 9,080 | |||||||||||||||
| Total shareholders' equity | 449,117 | 451,099 | (156,562 | ) | 497,473 | 246,181 | ||||||||||||||
| $ | 498,705 | $ | 557,436 | $ | 168,571 | $ | (497,473 | ) | $ | 727,239 | ||||||||||
86
INTERFACE, INC. AND SUBSIDIARIES -- NOTES TO CONSOLIDATED FINANCIAL STATEMENTS
BALANCE SHEET AS OF DECEMBER 28, 2008
|
GUARANTOR SUBSIDIARIES
|
NONGUARANTOR SUBSIDIARIES
|
INTERFACE, INC. (PARENT CORPORATION)
|
CONSOLIDATION & ELIMINATION ENTRIES
|
CONSOLIDATED TOTALS
|
||||||||||||||||
|
(in thousands)
|
||||||||||||||||||||
|
ASSETS
|
||||||||||||||||||||
|
Current Assets:
|
||||||||||||||||||||
|
Cash and cash equivalents
|
$ | 782 | $ | 26,465 | $ | 44,510 | $ | -- | $ | 71,757 | ||||||||||
|
Accounts receivable
|
59,997 | 83,177 | 1,609 | -- | 144,783 | |||||||||||||||
|
Inventories
|
73,475 | 55,448 | -- | -- | 128,923 | |||||||||||||||
|
Prepaids and deferred income taxes
|
6,637 | 14,537 | 6,168 | -- | 27,342 | |||||||||||||||
|
Assets of business held for sale
|
-- | 3,150 | -- | -- | 3,150 | |||||||||||||||
|
Total current assets
|
140,891 | 182,777 | 52,287 | -- | 375,955 | |||||||||||||||
|
Property and equipment, less accumulated depreciation
|
79,328 | 75,878 | 5,511 | -- | 160,717 | |||||||||||||||
|
Investments in subsidiaries
|
259,049 | 177,992 | 31,247 | (468,288 | ) | -- | ||||||||||||||
|
Goodwill
|
6,954 | 71,535 | -- | -- | 78,489 | |||||||||||||||
|
Other assets
|
7,614 | 11,607 | 71,653 | -- | 90,874 | |||||||||||||||
|
Total assets
|
$ | 493,836 | $ | 519,789 | $ | 160,698 | $ | (468,288 | ) | $ | 706,035 | |||||||||
|
LIABILITIES AND
SHAREHOLDERS’ EQUITY
|
||||||||||||||||||||
|
Current Liabilities:
|
$ | 53,939 | $ | 81,330 | $ | 19,363 | $ | -- | $ | 154,632 | ||||||||||
|
Long-term debt, less current maturities
|
-- | -- | -- | -- | -- | |||||||||||||||
|
Senior notes and senior subordinated notes
|
-- | -- | 287,588 | -- | 287,588 | |||||||||||||||
|
Deferred income taxes
|
1,615 | 9,813 | (3,922 | ) | -- | 7,506 | ||||||||||||||
|
Other
|
2,751 | 8,821 | 27,300 | -- | 38,872 | |||||||||||||||
|
Total liabilities
|
58,305 | 99,964 | 330,329 | -- | 488,598 | |||||||||||||||
|
Shareholders’ equity
|
||||||||||||||||||||
|
Redeemable preferred stock
|
57,891 | -- | -- | (57,891 | ) | -- | ||||||||||||||
|
Common stock
|
94,145 | 102,199 | 6,316 | (196,344 | ) | 6,316 | ||||||||||||||
|
Additional paid-in capital
|
191,411 | 12,525 | 339,776 | (203,936 | ) | 339,776 | ||||||||||||||
|
Retained earnings (deficit)
|
93,458 | 357,031 | (505,988 | ) | (10,117 | ) | (65,616 | ) | ||||||||||||
|
Foreign currency translation adjustment
|
(1,374 | ) | (34,656 | ) | (6,180 | ) | -- | (42,210 | ) | |||||||||||
|
Pension liability
|
-- | (25,215 | ) | (3,555 | ) | -- | (28,770 | ) | ||||||||||||
|
Noncontrolling interest in subsidiary
|
-- | 7,941 | -- | -- | 7,941 | |||||||||||||||
|
Total shareholders’ equity
|
435,531 | 419,825 | (169,631 | ) | (468,288 | ) | 217,437 | |||||||||||||
| $ | 493,836 | $ | 519,789 | $ | 160,698 | $ | (468,288 | ) | $ | 706,035 | ||||||||||
87
INTERFACE, INC. AND SUBSIDIARIES -- NOTES TO CONSOLIDATED FINANCIAL STATEMENTS
STATEMENT OF CASH FLOWS FOR YEAR ENDED 2009
|
GUARANTOR SUBSIDIARIES
|
NON-GUARANTOR SUBSIDIARIES
|
INTERFACE, INC.
(PARENT CORPORATION)
|
CONSOLIDATION AND ELIMINATION ENTRIES
|
CONSOLIDATED TOTALS
|
||||||||||||||||
|
(in thousands)
|
||||||||||||||||||||
|
Net cash provided by (used for) operating activities
|
$ | 23,919 | $ | 34,234 | $ | (6,655 | ) | $ | 2,952 | $ | 54,450 | |||||||||
|
Cash flows from investing activities:
|
||||||||||||||||||||
|
Purchase of plant and equipment
|
(6,586 | ) | (1,860 | ) | (307 | ) | -- | (8,753 | ) | |||||||||||
|
Other
|
(372 | ) | 1,993 | (222 | ) | -- | 1,399 | |||||||||||||
|
Net cash provided by (used for) investing activities
|
(6,958 | ) | 133 | (529 | ) | -- | (7,354 | ) | ||||||||||||
|
Cash flows from financing activities:
|
||||||||||||||||||||
|
Issuance of Senior Secured Notes
|
-- | -- | 144,452 | -- | 144,452 | |||||||||||||||
|
Repurchase of Senior Notes
|
-- | -- | (138,002 | ) | -- | (138,002 | ) | |||||||||||||
|
Debt issuance costs
|
-- | -- | (6,301 | ) | -- | (6,301 | ) | |||||||||||||
|
Premiums paid to repurchase Senior Notes
|
-- | -- | (5,264 | ) | -- | (5,264 | ) | |||||||||||||
|
Other
|
(17,198 | ) | (21,520 | ) | 41,670 | (2,952 | ) | -- | ||||||||||||
|
Proceeds from issuance of common stock
|
-- | -- | 499 | -- | 499 | |||||||||||||||
|
Dividends paid
|
-- | -- | (634 | ) | -- | (634 | ) | |||||||||||||
|
Net cash provided by (used for) financing activities
|
(17,198 | ) | (21,520 | ) | 36,420 | (2,952 | ) | (5,250 | ) | |||||||||||
|
Effect of exchange rate change on cash
|
-- | 1,760 | -- | -- | 1,760 | |||||||||||||||
|
Net increase (decrease) in cash
|
(237 | ) | 14,607 | 29,236 | -- | 43,606 | ||||||||||||||
|
Cash, at beginning of period
|
782 | 26,465 | 44,510 | -- | 71,757 | |||||||||||||||
|
Cash, at end of period
|
$ | 545 | $ | 41,072 | $ | 73,746 | $ | -- | $ | 115,363 | ||||||||||
88
INTERFACE, INC. AND SUBSIDIARIES -- NOTES TO CONSOLIDATED FINANCIAL STATEMENTS
STATEMENT OF CASH FLOWS FOR YEAR 2008
|
GUARANTOR SUBSIDIARIES
|
NONGUARANTOR SUBSIDIARIES
|
INTERFACE, INC. (PARENT CORPORATION)
|
CONSOLIDATION & ELIMINATION ENTRIES
|
CONSOLIDATED TOTALS
|
||||||||||||||||
|
(in thousands)
|
||||||||||||||||||||
|
Net cash provided by (used for) operating activities
|
$ | 20,961 | $ | 49,982 | $ | (15,847 | ) | $ | -- | $ | 55,096 | |||||||||
|
Cash flows from investing activities:
|
||||||||||||||||||||
|
Purchase of plant and equipment
|
(14,172 | ) | (17,113 | ) | (575 | ) | 2,560 | (29,300 | ) | |||||||||||
|
Other
|
(1,673 | ) | (366 | ) | (2,119 | ) | -- | (4,158 | ) | |||||||||||
|
Cash used in discontinued operations
|
-- | -- | -- | -- | -- | |||||||||||||||
|
Net cash provided by (used for) investing activities
|
(15,845 | ) | (17,479 | ) | (2,694 | ) | 2,560 | (33,458 | ) | |||||||||||
|
Cash flows from financing activities:
|
||||||||||||||||||||
|
Repurchase of senior notes
|
-- | -- | (22,412 | ) | -- | (22,412 | ) | |||||||||||||
|
Proceeds from issuance of common stock
|
-- | -- | 1,479 | -- | 1,479 | |||||||||||||||
|
Dividends paid
|
-- | -- | (7,562 | ) | -- | (7,562 | ) | |||||||||||||
|
Other
|
(5,528 | ) | (37,275 | ) | 45,363 | (2,560 | ) | -- | ||||||||||||
|
Net cash provided by (used for) financing activities
|
(5,528 | ) | (37,275 | ) | 16,868 | (2,560 | ) | (28,495 | ) | |||||||||||
|
Effect of exchange rate changes on cash
|
-- | (3,761 | ) | -- | -- | (3,761 | ) | |||||||||||||
|
Net increase (decrease) in cash
|
(412 | ) | (8,533 | ) | (1,673 | ) | -- | (10,618 | ) | |||||||||||
|
Cash, at beginning of year
|
1,194 | 34,998 | 46,183 | -- | 82,375 | |||||||||||||||
|
Cash, at end of year
|
$ | 782 | $ | 26,465 | $ | 44,510 | $ | -- | $ | 71,757 | ||||||||||
89
INTERFACE, INC. AND SUBSIDIARIES -- NOTES TO CONSOLIDATED FINANCIAL STATEMENTS
STATEMENT OF CASH FLOWS FOR YEAR 2007
|
GUARANTOR SUBSIDIARIES
|
NONGUARANTOR SUBSIDIARIES
|
INTERFACE, INC. (PARENT CORPORATION)
|
CONSOLIDATION & ELIMINATION ENTRIES
|
CONSOLIDATED TOTALS
|
||||||||||||||||
|
(in thousands)
|
||||||||||||||||||||
|
Net cash provided by (used for) operating activities
|
$ | (26,396 | ) | $ | 11,882 | $ | 80,222 | $ | -- | $ | 65,708 | |||||||||
|
Cash flows from investing activities:
|
||||||||||||||||||||
|
Purchase of plant and equipment
|
(26,848 | ) | (13,064 | ) | (680 | ) | -- | (40,592 | ) | |||||||||||
|
Cash proceeds from sale of Fabrics business segment
|
60,732 | -- | -- | -- | 60,732 | |||||||||||||||
|
Other
|
-- | -- | (7,014 | ) | -- | (7,014 | ) | |||||||||||||
|
Cash used in discontinued operations
|
(6,950 | ) | -- | -- | -- | (6,950 | ) | |||||||||||||
|
Net cash provided by (used for) investing activities
|
26,934 | (13,064 | ) | (7,694 | ) | -- | 6,176 | |||||||||||||
|
Cash flows from financing activities:
|
||||||||||||||||||||
|
Repurchase of senior notes
|
-- | -- | (101,365 | ) | -- | (101,365 | ) | |||||||||||||
|
Proceeds from issuance of common stock
|
-- | -- | 4,569 | -- | 4,569 | |||||||||||||||
|
Dividends paid
|
-- | -- | (4,919 | ) | -- | (4,919 | ) | |||||||||||||
|
Other
|
-- | -- | -- | -- | -- | |||||||||||||||
|
Net cash provided by (used for) financing activities
|
-- | -- | (101,715 | ) | -- | (101,715 | ) | |||||||||||||
|
Effect of exchange rate changes on cash
|
-- | 3,049 | -- | -- | 3,049 | |||||||||||||||
|
Net increase (decrease) in cash
|
538 | 1,867 | (29,187 | ) | -- | (26,782 | ) | |||||||||||||
|
Cash, at beginning of year
|
656 | 33,131 | 75,370 | -- | 109,157 | |||||||||||||||
|
Cash, at end of year
|
$ | 1,194 | $ | 34,998 | $ | 46,183 | $ | -- | $ | 82,375 | ||||||||||
90
Report of Independent Registered Public Accounting Firm
Board of Directors and Shareholders of Interface, Inc.
Atlanta, Georgia
We have audited the accompanying consolidated balance sheets of Interface, Inc. as of January 3, 2010 and December 28, 2008 and the related consolidated statements of operations and comprehensive income (loss) and cash flows for each of the three years in the period ended January 3, 2010. These financial statements are the responsibility of the Company’s management. Our responsibility is to express an opinion on these financial statements based on our audits.
We conducted our audits in accordance with the standards of the Public Company Accounting Oversight Board (United States). Those standards require that we plan and perform the audit to obtain reasonable assurance about whether the financial statements are free of material misstatement. An audit includes examining, on a test basis, evidence supporting the amounts and disclosures in the financial statements, assessing the accounting principles used and significant estimates made by management, as well as evaluating the overall presentation of the financial statements. We believe that our audits provide a reasonable basis for our opinion.
In our opinion, the consolidated financial statements referred to above present fairly, in all material respects, the financial position of Interface, Inc. at January 3, 2010 and December 28, 2008, and the results of its operations and its cash flows for each of the three years in the period ended January 3, 2010, in conformity with accounting principles generally accepted in the United States of America.
As discussed in the footnote entitled “Recent Accounting Pronouncements”, the Company changed its method of accounting for deferred compensation aspects of endorsement split-dollar life insurance arrangements in 2008 due to the adoption of a new accounting standard. As discussed in the footnote entitled "Taxes on Income," the Company changed its method of accounting for uncertain tax positions in 2007 due to the adoption of a new accounting standard.
The consolidated financial statements include the retrospective adjustments associated with new accounting pronouncements that became effective for the Company on December 29, 2008, regarding noncontrolling interests in consolidated financial statements, which resulted in the reclassification of the Company’s prior liability for minority interests to a new noncontrolling interests component of total equity. The consolidated financial statements also reflect the Company’s adoption of a new accounting standard governing the determination of earnings per share, which effective December 29, 2008 required the Company to adjust the number of share included in its weighted average share calculations when determining both basic and diluted net income attributable to controlling interests per common share to include unvested share-based payment awards. “Recent Accounting Pronouncements” in the notes to consolidated financial statements describes the retrospective application of these new accounting methods in greater detail.
We also have audited, in accordance with the standards of the Public Company Accounting Oversight Board (United States), Interface, Inc.'s internal control over financial reporting as of January 3, 2010, based on criteria established in Internal Control – Integrated Framework issued by the Committee of Sponsoring Organizations of the Treadway Commission (COSO) and our report dated March 15, 2010 expressed an unqualified opinion thereon.
/s/ BDO SEIDMAN, LLP
Atlanta, Georgia
March 15, 2010
91
Report of Independent Registered Public Accounting Firm
Board of Directors and Shareholders of Interface, Inc.
Atlanta, Georgia
We have audited Interface, Inc.’s internal control over financial reporting as of January 3, 2010, based on criteria established in Internal Control – Integrated Framework issued by the Committee of Sponsoring Organizations of the Treadway Commission (the COSO criteria). The Company’s management is responsible for maintaining effective internal control over financial reporting and for its assessment of the effectiveness of internal control over financial reporting, included in the accompanying “Item 9A, Management’s Report on Internal Control Over Financial Reporting.” Our responsibility is to express an opinion on the Company’s internal control over financial reporting based on our audit.
We conducted our audit in accordance with the standards of the Public Company Accounting Oversight Board (United States). Those standards require that we plan and perform the audit to obtain reasonable assurance about whether effective internal control over financial reporting was maintained in all material respects. Our audit included obtaining an understanding of internal control over financial reporting, assessing the risk that a material weakness exists, and testing and evaluating the design and operating effectiveness of internal control based on the assessed risk. Our audit also included performing such other procedures as we considered necessary in the circumstances. We believe that our audit provides a reasonable basis for our opinion.
A company’s internal control over financial reporting is a process designed to provide reasonable assurance regarding the reliability of financial reporting and the preparation of financial statements for external purposes in accordance with generally accepted accounting principles. A company’s internal control over financial reporting includes those policies and procedures that (1) pertain to the maintenance of records that, in reasonable detail, accurately and fairly reflect the transactions and dispositions of the assets of the company; (2) provide reasonable assurance that transactions are recorded as necessary to permit preparation of financial statements in accordance with generally accepted accounting principles, and that receipts and expenditures of the company are being made only in accordance with authorizations of management and directors of the company; and (3) provide reasonable assurance regarding prevention or timely detection of unauthorized acquisition, use, or disposition of the company’s assets that could have a material effect on the financial statements.
Because of its inherent limitations, internal control over financial reporting may not prevent or detect misstatements. Also, projections of any evaluation of effectiveness to future periods are subject to the risk that controls may become inadequate because of changes in conditions, or that the degree of compliance with the policies or procedures may deteriorate.
In our opinion, Interface, Inc. maintained, in all material respects, effective internal control over financial reporting as of January 3, 2010, based on the COSO criteria.
We also have audited, in accordance with the standards of the Public Company Accounting Oversight Board (United States), consolidated balance sheets of Interface, Inc. as of January 3, 2010 and December 28, 2008 and the related consolidated statements of operations and comprehensive income (loss) and cash flows for each of the three years in the period ended January 3, 2010 and our report dated March 15, 2010 expressed an unqualified opinion thereon.
/s/ BDO SEIDMAN, LLP
Atlanta, Georgia
March 15, 2010
92
|
ITEM 9.
|
CHANGES IN AND DISAGREEMENTS WITH ACCOUNTANTS ON ACCOUNTING AND FINANCIAL DISCLOSURE
|
Not applicable.
ITEM 9A. CONTROLS AND PROCEDURES
Disclosure Controls and Procedures. As of the end of the period covered by this Annual Report on Form 10-K, an evaluation was performed under the supervision and with the participation of our management, including our President and Chief Executive Officer and our Senior Vice President and Chief Financial Officer, of the effectiveness of the design and operation of our disclosure controls and procedures as defined in Rule 13a-15(e) under the Securities Exchange Act of 1934, pursuant to Rule 13a-14(c) under the Act. Based on that evaluation, our President and Chief Executive Officer and our Senior Vice President and Chief Financial Officer concluded that our disclosure controls and procedures were effective as of the end of the period covered by this Annual Report.
Changes in Internal Control over Financial Reporting. There were no changes in our internal control over financial reporting that occurred during our last fiscal quarter that have materially affected, or are reasonably likely to materially affect, our internal control over financial reporting.
Management’s Annual Report on Internal Control over Financial Reporting. The management of the Company is responsible for establishing and maintaining adequate internal control over financial reporting as defined in Rule 13a-15(f) or 15d-15(f) promulgated under the Securities Exchange Act of 1934. Because of its inherent limitations, internal control over financial reporting may not prevent or detect misstatements. Therefore, even those systems determined to be effective can provide only reasonable assurance with respect to financial statement preparation and presentation.
Our management assessed the effectiveness of our internal control over financial reporting as of January 3, 2010 based on the criteria set forth by the Committee of Sponsoring Organizations of the Treadway Commission (COSO) in “Internal Control – Integrated Framework.” Based on that assessment, management concluded that, as of January 3, 2010, our internal control over financial reporting was effective based on those criteria.
Our independent auditors have issued an audit report on the effectiveness of our internal control over financial reporting. This report immediately precedes Item 9 of this Report.
ITEM 9B. OTHER INFORMATION
None
PART III
ITEM 10. DIRECTORS, EXECUTIVE OFFICERS AND CORPORATE GOVERNANCE
The information contained under the captions “Nomination and Election of Directors,” “Section 16(a) Beneficial Ownership Reporting Compliance” and “Meetings and Committees of the Board of Directors” in our definitive Proxy Statement for our 2010 Annual Meeting of Shareholders, to be filed with the Securities and Exchange Commission pursuant to Regulation 14A not later than 120 days after the end of our 2009 fiscal year, is incorporated herein by reference. Pursuant to Instruction 3 to Paragraph (b) of Item 401 of Regulation S-K, information relating to our executive officers is included in Item 1 of this Report.
We have adopted the “Interface Code of Business Conduct and Ethics” (the “Code”) which applies to all of our employees, officers and directors, including the Chief Executive Officer and Chief Financial Officer. The Code may be viewed on our website at www.interfaceglobal.com. Changes to the Code will be posted on our website. Any waiver of the Code for executive officers or directors may be made only by our Board of Directors and will be disclosed to the extent required by law or Nasdaq rules on our website or in a filing on Form 8-K.
93
ITEM 11. EXECUTIVE COMPENSATION
The information contained under the captions “Executive Compensation and Related Items,” “Compensation Discussion and Analysis,” “Compensation Committee Report,” “Compensation Committee Interlocks and Insider Participation,” and “Potential Payments upon Termination or Change in Control” in our definitive Proxy Statement for our 2010 Annual Meeting of Shareholders, to be filed with the Securities and Exchange Commission pursuant to Regulation 14A not later than 120 days after the end of our 2009 fiscal year, is incorporated herein by reference.
|
ITEM 12.
|
SECURITY OWNERSHIP OF CERTAIN BENEFICIAL OWNERS AND MANAGEMENT AND RELATED STOCKHOLDER MATTERS
|
The information contained under the captions “Principal Shareholders and Management Stock Ownership” and “Equity Compensation Plan Information” in our definitive Proxy Statement for our 2010 Annual Meeting of Shareholders, to be filed with the Securities and Exchange Commission pursuant to Regulation 14A not later than 120 days after the end of our 2009 fiscal year, is incorporated herein by reference.
For purposes of determining the aggregate market value of our voting and non-voting stock held by non-affiliates, shares held by our directors and executive officers have been excluded. The exclusion of such shares is not intended to, and shall not, constitute a determination as to which persons or entities may be “affiliates” as that term is defined under federal securities laws.
ITEM 13. CERTAIN RELATIONSHIPS AND RELATED TRANSACTIONS, AND DIRECTOR INDEPENDENCE
The information contained under the captions “Certain Relationships and Related Transactions” and “Director Independence” in our definitive Proxy Statement for our 2010 Annual Meeting of Shareholders, to be filed with the Securities and Exchange Commission pursuant to Regulation 14A not later than 120 days after the end of our 2009 fiscal year, is incorporated herein by reference.
ITEM 14. PRINCIPAL ACCOUNTANT FEES AND SERVICES
The information contained under the captions “Audit and Non-Audit Fees” and “Policy on Audit Committee Pre-Approval of Audit and Permissible Non-Audit Services of Independent Auditors” in our definitive Proxy Statement for our 2010 Annual Meeting of Shareholders, to be filed with the Securities and Exchange Commission pursuant to Regulation 14A not later than 120 days after the end of our 2009 fiscal year, is incorporated herein by reference.
PART IV
ITEM 15. EXHIBITS AND FINANCIAL STATEMENT SCHEDULES
|
|
1. Financial Statements
|
The following Consolidated Financial Statements and Notes thereto of Interface, Inc. and subsidiaries and related Reports of Independent Registered Public Accounting Firm are contained in Item 8 of this Report:
Consolidated Statements of Operations and Comprehensive Income (Loss) — years ended January 3, 2010, December 28, 2008 and December 30, 2007.
Consolidated Balance Sheets — January 3, 2010 and December 28, 2008.
Consolidated Statements of Cash Flows — years ended January 3, 2010, December 28, 2008 and December 30, 2007.
94
Notes to Consolidated Financial Statements
Report of Independent Registered Public Accounting Firm
Report of Independent Registered Public Accounting Firm on Internal Control over Financial Reporting
|
|
2. Financial Statement Schedule
|
The following Consolidated Financial Statement Schedule of Interface, Inc. and subsidiaries and related Report of Independent Registered Public Accounting Firm are included as part of this Report (see the pages immediately preceding the signatures in this Report.
Report of Independent Registered Public Accounting Firm
Schedule II — Valuation and Qualifying Accounts and Reserves
|
|
3. Exhibits
|
The following exhibits are included as part of this Report:
|
Exhibit
Number
|
|
Description of Exhibit
|
|
3.1
|
—
|
Restated Articles of Incorporation dated as of March 17, 2008 (included as Exhibit 3.1 to the Company’s current report on Form 8-K dated March 17, 2008 and filed on March 17, 2008, previously filed with the Commission and incorporated herein by reference).
|
|
3.2
|
—
|
Bylaws, as amended and restated (included as Exhibit 3.1 to the Company’s quarterly report on Form 10-Q for the quarter ended September 30, 2007, previously filed with the Commission and incorporated herein by reference).
|
|
4.1
|
—
|
See Exhibits 3.1 and 3.2 for provisions in the Company’s Articles of Incorporation and Bylaws defining the rights of holders of Common Stock of the Company.
|
|
4.2
|
—
|
Rights Agreement dated March 7, 2008 and effective as of March 17, 2008 between the Company and Computershare Trust Company, N.A. (included as Exhibit 4.1 to the Company’s current report on Form 8-K dated March 7, 2008 and filed on March 7, 2008, previously filed with the Commission and incorporated herein by reference).
|
|
4.3
|
—
|
Indenture governing the Company’s 9.5% Senior Subordinated Notes due 2014, dated as of February 4, 2004, among the Company, certain subsidiaries of the Company, as guarantors, and SunTrust Bank, as Trustee (the “2004 Indenture”) (included as Exhibit 4.6 to the Company’s annual report on Form 10-K for the year ended December 28, 2003 (the “2003 10-K”), previously filed with the Commission and incorporated herein by reference); and First Supplemental Indenture related to the 2004 Indenture, dated as of January 10, 2005 (included as Exhibit 99.3 to the Company’s current report on Form 8-K dated February 15, 2005 and filed on February 16, 2005, previously filed with the Commission and incorporated herein by reference).
|
|
4.4
|
—
|
Indenture governing the Company’s 11 3/8% Senior Secured Notes due 2013, among the Company, certain subsidiaries of the Company, as guarantors, and U.S. Bank National Association, as Trustee (the “2009 Indenture”) (included as Exhibit 4.1 to the Company’s current report on Form 8-K dated June 5, 2009 and filed on June 11, 2009, previously filed with the Commission and incorporated herein by reference); Intercreditor Agreement, dated June 5, 2009, by and among the Company, certain subsidiaries of the Company, as guarantors, Wachovia Bank, National Association, in its capacity as domestic agent and collateral agent under the Company’s domestic revolving credit facility, and U.S. Bank National Association, as collateral agent under the 2009 Indenture (included as Exhibit 4.2 to the Company’s current report on Form 8-K dated June 5, 2009 and filed on June 11, 2009, previously filed with the Commission and incorporated herein by reference); and Pledge and Security Agreement, dated June 5, 2009, by and among the Company, certain subsidiaries of the Company, and U.S. Bank National Association, in its capacity as collateral agent for the holders of the 11 3/8% Senior Secured Notes.
|
|
10.1
|
—
|
Salary Continuation Plan, dated May 7, 1982 (included as Exhibit 10.20 to the Company’s registration statement on Form S-1, File No. 2-82188, previously filed with the Commission and incorporated herein by reference).*
|
95
|
10.2
|
—
|
Salary Continuation Agreement, dated as of October 1, 2002, between the Company and Ray C. Anderson (included as Exhibit 10.3 to the Company’s quarterly report on Form 10-Q for the quarter ended September 29, 2002 (the “2002 Third Quarter 10-Q”), previously filed with the Commission and incorporated herein by reference); and Amendment thereto dated September 29, 2006 (included as Exhibit 99.1 to the Company’s current report on Form 8-K dated September 29, 2006 and filed on October 2, 2006, previously filed with the Commission and incorporated herein by reference).*
|
|
10.3
|
—
|
Form of Salary Continuation Agreement, dated as of January 1, 2008 (as used for Daniel T. Hendrix, Raymond S. Willoch and John R. Wells) (included as Exhibit 99.5 to the Company’s current report on Form 8-K dated January 2, 2008 and filed on January 7, 2008, previously filed with the Commission and incorporated herein by reference).*
|
|
10.4
|
—
|
Interface, Inc. Omnibus Stock Incentive Plan (as amended and restated effective February 22, 2006) (included as Exhibit 99.1 to the Company’s current report on Form 8-K dated May 18, 2006 and filed on May 23, 2006, previously filed with the Commission and incorporated herein by reference); Forms of Restricted Stock Agreement, as used for directors, executive officers and other key employees/consultants (included as Exhibits 99.1, 99.2 and 99.3, respectively, to the Company’s current report on Form 8-K dated January 10, 2005 and filed on January 14, 2005, previously filed with the Commission and incorporated herein by reference); and Form of Restricted Stock Agreement, as used for executive officers (included as Exhibit 10.5 to the Company’s annual report on Form 10-K for the year ended December 30, 2007, previously filed with the Commission and incorporated herein by reference).*
|
|
10.5
|
—
|
Interface, Inc. Executive Bonus Plan, adopted on February 18, 2004 (included as Exhibit 99.1 to the Company’s current report on Form 8-K dated December 15, 2004 and filed on March 2, 2005, previously filed with the Commission and incorporated herein by reference).*
|
|
10.6
|
—
|
Interface, Inc. Executive Bonus Plan, adopted on February 25, 2009 (included as Exhibit 99.1 to the Company’s current report on Form 8-K dated May 21, 2009 and filed on May 28, 2009, previously filed with the Commission and incorporated herein by reference).*
|
|
10.7
|
—
|
Interface, Inc. Nonqualified Savings Plan (as amended and restated effective January 1, 2002) (included as Exhibit 10.4 to the 2001 10-K, previously filed with the Commission and incorporated herein by reference); First Amendment thereto, dated as of December 20, 2002 (included as Exhibit 10.2 to the 2003 Second Quarter 10-Q, previously filed with the Commission and incorporated herein by reference); Second Amendment thereto, dated as of December 30, 2002 (included as Exhibit 10.3 to the 2003 Second Quarter 10-Q, previously filed with the Commission and incorporated herein by reference); Third Amendment thereto, dated as of May 8, 2003 (included as Exhibit 10.6 to the 2003 10-K, previously filed with the Commission and incorporated herein by reference); and Fourth Amendment thereto, dated as of December 31, 2003 (included as Exhibit 10.7 to the 2003 10-K, previously filed with the Commission and incorporated herein by reference).*
|
|
10.8
|
—
|
Interface, Inc. Nonqualified Savings Plan II, dated as of January 1, 2005 (included as Exhibit 4 to the Company’s registration statement on Form S-8 dated November 29, 2004, File No. 333-120813, previously filed with the Commission and incorporated herein by reference); First Amendment thereto, dated as of December 28, 2005 (included as Exhibit 10.9 to the Company’s annual report on Form 10-K for the year ended January 1, 2006 (the “2005 10-K”), previously filed with the Commission and incorporated herein by reference); Second Amendment thereto, dated as of December 20, 2006 (included as Exhibit 99.2 to the Company’s current report on Form 8-K dated January 8, 2008 and filed on January 14, 2008, previously filed with the Commission and incorporated herein by reference); and Third Amendment thereto, dated January 8, 2008 (included as Exhibit 99.1 to the Company’s current report on Form 8-K dated January 8, 2008 and filed on January 14, 2008, previously filed with the Commission and incorporated herein by reference).*
|
|
10.9
|
—
|
Amended and Restated Employment and Change in Control Agreement of Ray C. Anderson dated July 23, 2008 (included as Exhibit 99.1 to the Company current report on Form 8-K dated July 23, 2008 and filed on July 29, 2008, previously filed with the Commission and incorporated herein by reference).*
|
|
10.10
|
—
|
Amended and Restated Employment and Change in Control Agreement of Daniel T. Hendrix dated January 1, 2008 (included as Exhibit 99.2 to the Company’s current report on Form 8-K dated January 2, 2008 and filed on January 7, 2008, previously filed with the Commission and incorporated herein by reference).*
|
|
10.11
|
—
|
Amended and Restated Employment and Change in Control Agreement of Patrick C. Lynch dated January 1, 2008 (included as Exhibit 99.1 to the Company’s current report on Form 8-K dated January 2, 2008 and filed on January 7, 2008, previously filed with the Commission and incorporated herein by reference).*
|
96
|
10.12
|
—
|
Amended and Restated Employment and Change in Control Agreement of John R. Wells dated January 1, 2008 (included as Exhibit 99.3 to the Company’s current report on Form 8-K dated January 2, 2008 and filed on January 7, 2008, previously filed with the Commission and incorporated herein by reference).*
|
|
10.13
|
—
|
Amended and Restated Employment and Change in Control Agreement of Raymond S. Willoch dated January 1, 2008 (included as Exhibit 99.4 to the Company’s current report on Form 8-K dated January 2, 2008 and filed on January 7, 2008, previously filed with the Commission and incorporated herein by reference).*
|
|
10.14
|
—
|
UK Service Agreement between Interface Europe, Ltd. and Lindsey Kenneth Parnell dated March 13, 2007 (included as Exhibit 10.12 to the Company’s annual report on Form 10-K for the year ended December 31, 2006 (the “2006 10-K”), previously filed with the Commission and incorporated herein by reference).*
|
|
10.15
|
—
|
Overseas Service Agreement between Interface Europe, Ltd. and Lindsey Kenneth Parnell dated March 13, 2007 (included as Exhibit 10.13 to the 2006 10-K, previously filed with the Commission and incorporated herein by reference).*
|
|
10.16
|
—
|
Sixth Amended and Restated Credit Agreement, dated as of June 30, 2006, among the Company (and certain direct and indirect subsidiaries), the lenders listed therein, Wachovia Bank, National Association, Bank of America, N.A. and General Electric Capital Corporation (included as Exhibit 99.1 to the Company’s current report on Form 8-K dated June 30, 2006 and filed on July 7, 2006, previously filed with the Commission and incorporated herein by reference); First Amendment thereto, dated January 1, 2008 (included as Exhibit 99.1 to the Company’s current report Form 8-K dated January 1, 2008 and filed on January 4, 2008, previously filed with the Commission and incorporated herein by reference); and Second Amendment thereto, dated May 14, 2009 (included as Exhibit 10.2 to the Company’s quarterly report on Form 10-Q for the quarter ended April 5, 2009, previously filed with the Commission and incorporated herein by reference).
|
|
10.17
|
—
|
Split Dollar Agreement, dated September 11, 2006, between the Company, Ray C. Anderson and Mary Anne Anderson Lanier, as Trustee of the Ray C. Anderson Family Trust (included as Exhibit 99.1 to the Company’s current report on Form 8-K dated September 11, 2006 and filed on September 15, 2006, previously filed with the Commission and incorporated herein by reference); and Amendment and Partial Assignment of Split Dollar Agreement (included as Exhibit 99.1 to the Company’s current report on Form 8-K dated September 3, 2009 and filed on September 9, 2009, previously filed with the Commission and incorporated herein by reference).*
|
|
10.18
|
—
|
Split Dollar Insurance Agreement, dated February 21, 1997, between the Company and Daniel T. Hendrix (included as Exhibit 10.2 to the Company’s quarterly report on Form 10-Q for the quarter ended October 4, 1998, previously filed with the Commission and incorporated herein by reference); and Amendment thereto, dated December 29, 2008 (included as Exhibit 99.1 to the Company’s current report on Form 8-K dated December 29, 2008 and filed on January 2, 2009, previously filed with the Commission and incorporated herein by reference).*
|
|
10.19
|
—
|
Form of Indemnity Agreement of Director (as used for directors of the Company) (included as Exhibit 99.1 to the Company’s current report on Form 8-K dated November 29, 2005 and filed on November 30, 2005, previously filed with the Commission and incorporated herein by reference).*
|
|
10.20
|
—
|
Form of Indemnity Agreement of Officer (as used for certain officers of the Company, including Daniel T. Hendrix, John R. Wells, Patrick C. Lynch, Raymond S. Willoch and Lindsey K. Parnell) (included as Exhibit 99.2 to the Company’s current report on Form 8-K dated November 29, 2005 and filed on November 30, 2005, previously filed with the Commission and incorporated herein by reference).*
|
|
10.21
|
—
|
Interface, Inc. Long-Term Care Insurance Plan and related Summary Plan Description (included as Exhibit 99.2 to the Company’s current report on Form 8-K dated December 14, 2005 and filed on December 20, 2005, previously filed with the Commission and incorporated herein by reference).*
|
|
10.22
|
—
|
Credit Agreement, executed on April 24, 2009, among Interface Europe B.V. (and certain of its subsidiaries) and ABN AMRO Bank N.V. (included as Exhibit 99.1 to the Company’s current report on Form 8-K dated April 24, 2009 and filed on April 29, 2009, previously filed with the Commission and incorporated herein by reference); and Amendment Agreement thereto, executed on January 21, 2010 (included as Exhibit 99.1 to the Company’s current report on Form 8-K dated January 21, 2010 and filed on January 22, 2010, previously filed with the Commission and incorporated herein by reference).
|
|
21
|
—
|
Subsidiaries of the Company.
|
97
|
23
|
—
|
Consent of BDO Seidman, LLP.
|
|
24
|
—
|
Power of Attorney (see signature page of this Report).
|
|
31.1
|
—
|
Certification of Chief Executive Officer with respect to the Company’s Annual Report on Form 10-K for the fiscal year ended January 3, 2010.
|
|
31.2
|
—
|
Certification of Chief Financial Officer with respect to the Company’s Annual Report on Form 10-K for the fiscal year ended January 3, 2010.
|
|
32.1
|
—
|
Certification Pursuant to Section 1350 of Chapter 63 of Title 18 of United States Code by Chief Executive Officer with respect to the Company’s Annual Report on Form 10-K for the fiscal year ended January 3, 2010.
|
|
32.2
|
—
|
Certification Pursuant to Section 1350 of Chapter 63 of Title 18 of United States Code by Chief Financial Officer with respect to the Company’s Annual Report on Form 10-K for the fiscal year ended January 3, 2010.
|
__________
|
|
* Management contract or compensatory plan or agreement required to be filed pursuant to Item 15(b) of this Report.
|
98
Report of Independent Registered Public Accounting Firm
Interface, Inc.
Atlanta, Georgia
The audits referred to in our report dated March 15, 2010, relating to the consolidated financial statements of Interface, Inc., which is contained in Item 8 of this Form 10-K, also included the audit of the Financial Statement Schedule II (Valuation and Qualifying Accounts and Reserves) listed in the accompanying index. This financial statement schedule is the responsibility of the Company's management. Our responsibility is to express an opinion on this financial statement schedule based on our audits.
In our opinion, such financial statement schedule, when considered in relation to the basic consolidated financial statements taken as a whole, presents fairly, in all material respects, the information set forth therein.
/s/ BDO SEIDMAN, LLP
Atlanta, Georgia
March 15, 2010
99
INTERFACE, INC. AND SUBSIDIARIES
SCHEDULE II – VALUATION AND QUALIFYING ACCOUNTS AND RESERVES
|
COLUMN A
BALANCE, AT
BEGINNING OF YEAR
|
COLUMN B CHARGED TO COSTS AND EXPENSES (A)
|
COLUMN C
CHARGED TO OTHER ACCOUNTS
|
COLUMN D
DEDUCTIONS (DESCRIBE) (B)
|
COLUMN E
BALANCE, AT END OF YEAR
|
||||||||||||||||
|
|
(in thousands)
|
|||||||||||||||||||
|
Allowance for Doubtful Accounts:
|
||||||||||||||||||||
|
Year Ended:
|
||||||||||||||||||||
|
January 3, 2010
|
$ | 11,144 | $ | 2,719 | $ | -- | $ | 1,575 | $ | 12,288 | ||||||||||
|
December 28, 2008
|
8,640 | 3,710 | -- | 1,206 | 11,144 | |||||||||||||||
|
December 30, 2007
|
6,881 | 1,917 | -- | 158 | 8,640 | |||||||||||||||
______________
(A) Includes changes in foreign currency exchange rates.
(B) Write off of bad debt.
|
COLUMN A
BALANCE, AT
BEGINNING OF YEAR
|
COLUMN B CHARGED TO COSTS AND EXPENSES (A)
|
COLUMN C
CHARGED TO OTHER ACCOUNTS(B)
|
COLUMN D
DEDUCTIONS (DESCRIBE) (C)
|
COLUMN E
BALANCE, AT END OF YEAR
|
||||||||||||||||
|
|
(in thousands)
|
|||||||||||||||||||
|
Restructuring Reserve:
|
||||||||||||||||||||
|
Year Ended:
|
||||||||||||||||||||
|
January 3, 2010
|
$ | 6,952 | $ | 7,627 | $ | 508 | $ | 12,118 | $ | 1,953 | ||||||||||
|
December 28, 2008
|
-- | 10,975 | 2,559 | 1,464 | 6,952 | |||||||||||||||
|
December 30, 2007
|
267 | -- | -- | 267 | -- | |||||||||||||||
______________
(A) Includes changes in foreign currency exchange rates.
(B) Reduction of asset carrying value.
(C) Cash payments.
100
|
COLUMN A
BALANCE, AT
BEGINNING
OF YEAR
|
COLUMN B CHARGED TO COSTS AND EXPENSES (A)
|
COLUMN C
CHARGED TO OTHER ACCOUNTS
|
COLUMN D
DEDUCTIONS (DESCRIBE) (B)
|
COLUMN E
BALANCE, AT END OF YEAR
|
||||||||||||||||
|
(in thousands)
|
||||||||||||||||||||
|
Reserves for Sales Returns and Allowances:
|
||||||||||||||||||||
|
Year ended:
|
||||||||||||||||||||
|
January 3, 2010
|
$ | 2,737 | $ | 1,552 | $ | -- | $ | 955 | $ | 3,334 | ||||||||||
|
December 28, 2008
|
3,682 | 643 | -- | 1,588 | 2,737 | |||||||||||||||
|
December 30, 2007
|
2,209 | 3,018 | -- | 1,545 | 3,682 | |||||||||||||||
______________
(A) Includes changes in foreign currency exchange rates.
(B) Represents credits issued and adjustments to reflect actual exposure.
|
COLUMN A
BALANCE, AT
BEGINNING
OF YEAR
|
COLUMN B CHARGED TO COSTS AND EXPENSES (A)
|
COLUMN C
CHARGED TO OTHER ACCOUNTS
|
COLUMN D
DEDUCTIONS (DESCRIBE) (B)
|
COLUMN E
BALANCE, AT END OF YEAR
|
||||||||||||||||
|
(in thousands)
|
||||||||||||||||||||
|
Warranty Reserves:
|
||||||||||||||||||||
|
Year ended:
|
||||||||||||||||||||
|
January 3, 2010
|
$ | 1,859 | $ | 35 | $ | -- | $ | 545 | $ | 1,349 | ||||||||||
|
December 28, 2008
|
1,183 | 858 | -- | 182 | 1,859 | |||||||||||||||
|
December 30, 2007
|
1,502 | 778 | -- | 1,097 | 1,183 | |||||||||||||||
______________
(A) Includes changes in foreign currency exchange rates.
(B) Represents costs applied against reserve and adjustments to reflect actual exposure.
|
COLUMN A
BALANCE, AT
BEGINNING
OF YEAR
|
COLUMN B CHARGED TO COSTS AND EXPENSES (A)
|
COLUMN C
CHARGED TO OTHER ACCOUNTS
|
COLUMN D
DEDUCTIONS (DESCRIBE) (B)
|
COLUMN E
BALANCE, AT END OF YEAR
|
||||||||||||||||
|
(in thousands)
|
||||||||||||||||||||
|
Inventory Reserves:
|
||||||||||||||||||||
|
Year ended:
|
||||||||||||||||||||
|
January 3, 2010
|
$ | 10,885 | $ | 8,097 | $ | -- | $ | 1,838 | $ | 17,144 | ||||||||||
|
December 28, 2008
|
7,736 | 3,989 | -- | 840 | 10,885 | |||||||||||||||
|
December 30, 2007
|
6,625 | 3,321 | -- | 2,210 | 7,736 | |||||||||||||||
______________
(A) Includes changes in foreign currency exchange rates.
(B) Represents costs applied against reserve and adjustments to reflect actual exposure.
(All other Schedules for which provision is made in the applicable accounting requirements of the Securities and Exchange Commission are omitted because they are either not applicable or the required information is shown in the Company's Consolidated Financial Statements or the Notes thereto.)
101
SIGNATURES
Pursuant to the requirements of Section 13 or 15(d) of the Securities Exchange Act of 1934, the registrant has duly caused this Report to be signed on its behalf by the undersigned, thereunto duly authorized.
|
Date: March 15, 2010
|
INTERFACE, INC.
|
|
|
By:
|
/s/ DANIEL T. HENDRIX
|
|
|
Daniel T. Hendrix
|
||
|
President and Chief Executive Officer
|
POWER OF ATTORNEY
KNOW ALL PERSONS BY THESE PRESENTS, that each person whose signature appears below constitutes and appoints Daniel T. Hendrix as attorney-in-fact, with power of substitution, for him or her in any and all capacities, to sign any amendments to this Report on Form 10-K, and to file the same, with exhibits thereto, and other documents in connection therewith, with the Securities and Exchange Commission, hereby ratifying and confirming all that said attorney-in-fact may do or cause to be done by virtue hereof.
Pursuant to the requirements of the Securities Exchange Act of 1934, this Report has been signed below by the following persons on behalf of the registrant and in the capacities and on the dates indicated.
|
|
Signature
|
Capacity
|
Date
|
|
/s/ RAY C. ANDERSON
|
Chairman of the Board
|
March 15, 2010
|
|
|
Ray C. Anderson
|
|||
|
/s/ DANIEL T. HENDRIX
|
President, Chief Executive Officer and
|
March 15, 2010
|
|
|
Daniel T. Hendrix
|
Director (Principal Executive Officer)
|
||
|
/s/ PATRICK C. LYNCH
|
Senior Vice President and Chief Financial Officer
|
March 15, 2010
|
|
|
Patrick C. Lynch
|
(Principal Financial and Accounting Officer)
|
||
|
/s/ EDWARD C. CALLAWAY
|
Director
|
March 15, 2010
|
|
|
Edward C. Callaway
|
|||
|
/s/ DIANNE DILLON-RIDGLEY
|
Director
|
March 15, 2010
|
|
|
Dianne Dillon-Ridgley
|
|||
|
/s/ CARL I. GABLE
|
Director
|
March 15, 2010
|
|
|
Carl I. Gable
|
|||
|
/s/ JUNE M. HENTON
|
Director
|
March 15, 2010
|
|
|
June M. Henton
|
|||
|
/s/ CHRISTOPHER G. KENNEDY
|
Director
|
March 15, 2010
|
|
|
Christopher G. Kennedy
|
|||
|
/s/ K. DAVID KOHLER
|
Director
|
March 15, 2010
|
|
|
K. David Kohler
|
|||
|
/s/ JAMES B. MILLER, JR.
|
Director
|
March 15, 2010
|
|
|
James B. Miller, Jr.
|
|||
|
/s/ THOMAS R. OLIVER
|
Director
|
March 15, 2010
|
|
|
Thomas R. Oliver
|
|||
|
/s/ HAROLD M. PAISNER
|
Director
|
March 15, 2010
|
|
|
Harold M. Paisner
|
102
EXHIBIT INDEX
|
Exhibit Number
|
|
|
4.4
|
Pledge and Security Agreement, dated June 5, 2009, by and among the Company, certain subsidiaries of the Company, and U.S. Bank National Association, in its capacity as collateral agent for the holders of the 11 3/8% Senior Secured Notes.
|
|
21
|
Subsidiaries of the Company.
|
|
23
|
Consent of BDO Seidman, LLP.
|
|
24
|
Power of Attorney.
|
|
31.1
|
Certification of Chief Executive Officer with respect to the Company’s Annual Report on Form 10-K for the fiscal year ended January 3, 2010.
|
|
31.2
|
Certification of Chief Financial Officer with respect to the Company’s Annual Report on Form 10-K for the fiscal year ended January 3, 2010.
|
|
32.1
|
Certification Pursuant to Section 1350 of Chapter 63 of Title 18 of United States Code by Chief Executive Officer with respect to the Company’s Annual Report on Form 10-K for the fiscal year ended January 3, 2010.
|
|
32.2
|
Certification Pursuant to Section 1350 of Chapter 63 of Title 18 of United States Code by Chief Financial Officer with respect to the Company’s Annual Report on Form 10-K for the fiscal year ended January 3, 2010.
|
103
104