Attached files
| file | filename |
|---|---|
| EX-99.1 - PRESS RELEASE - BROCADE COMMUNICATIONS SYSTEMS INC | dex991.htm |
| 8-K - CURRENT REPORT ON FORM 8-K - BROCADE COMMUNICATIONS SYSTEMS INC | d8k.htm |
 Q1 FY 2010 Earnings Prepared Comments and Slides February 22, 2010 Peter Ausnit Senior Director, Investor Relations Phone: 408-333-4000 pausnit@brocade.com John Noh Senior Director, Public Relations Phone: 408-333-5108 jnoh@brocade.com NASDAQ: BRCD Exhibit 99.2 |
 Q1 FY 2010 EARNINGS February 22, 2010 |
| Prepared comments provided by Peter Ausnit, Sr. Director, Investor Relations
Thank you for your interest in Brocade’s Q1 Fiscal 2010 Earnings
Presentation, which includes prepared remarks, slides, and a press release
detailing fiscal first quarter 2010 financial results. The press release was issued shortly after 1:00 p.m. Pacific time on February 22, 2010, via Business Wire and First Call. The press release, along with
these prepared comments and slides, has been made available on
Brocade’s Investor Relations website at www.BRCD.com and has been furnished to the SEC on Form 8-K. © 2010 Brocade Communications Systems, Inc. Page 2 of 40 |
| Cautionary Statements and Disclosures This presentation includes forward-looking statements regarding Brocade’s
financial results, cash and debt positions, plans and business outlook,
which are only predictions and involve risks and uncertainties such that
actual results may vary significantly. These and other risks are set
forth in more detail in our Form 10-K for the fiscal year ended
October 31, 2009. These forward-looking statements reflect beliefs,
assumptions, outlook, estimates and predictions as of today, and Brocade
expressly assumes no obligation to update any such forward- looking
statements. In addition, this presentation includes various third party
estimates regarding the total available market and other measures, which
do not necessarily reflect the view of Brocade. Further, Brocade does
not guarantee the accuracy or reliability of any such information or
forecast. This presentation includes non-GAAP financial measures. The
most directly comparable GAAP information and a reconciliation between
the non-GAAP and GAAP figures are provided in our Q1 10 press
release, which has been furnished to the SEC on Form 8-K, and in
this slide presentation. Please see risk factors on Form 10-K for the
year ended 10/31/09 |
| The information in Brocade’s prepared comments includes
forward-looking statements, including without limitation, statements about Brocade's financial results, cash and debt positions, plans and business
outlook. These forward-looking statements are only predictions and
involve risks and uncertainties such that actual results may vary
significantly. These and other risks are set forth in more detail in
Brocade’s Form 10-K for the fiscal year ended October 31, 2009. These forward-looking statements reflect beliefs, assumptions, outlook, estimates and predictions as of today, and Brocade expressly assumes no obligation to update any such forward-looking statements. Certain financial information is presented on a non-GAAP basis. The most
directly comparable GAAP information and a reconciliation between the
non-GAAP and GAAP figures are provided in the accompanying press release, which has been furnished to the SEC on Form 8-K and posted on Brocade’s website, and is included in
the appendix to this presentation. © 2010 Brocade Communications Systems, Inc. Page 3 of 40 |
 Agenda Prepared comments followed by live Q&A call Richard Deranleau CFO Mike Klayko CEO |
| Today’s prepared comments include remarks by Mike Klayko, Brocade’s CEO,
regarding the company’s quarterly results, its strategy and a review
of operations, as well as industry trends and market/technology drivers related to its business; and by Richard Deranleau, Brocade’s CFO, who will provide a financial review. A live question-and-answer conference call will be web cast beginning at 2:30
p.m. Pacific time on February 22 nd at www.BRCD.com and will be archived on Brocade’s Investor Relations website for approximately
12 months. Participants are invited to submit questions via email at
ir@brocade.com up to 30 minutes prior
to the conference call and to ask live questions during the call. © 2010 Brocade Communications Systems, Inc. Page 4 of 40 |
 Fiscal 2010: Q1 Earnings Mike Klayko, CEO |
| CEO
Mike Klayko’s prepared comments © 2010 Brocade Communications Systems, Inc. Page 5 of 40 |
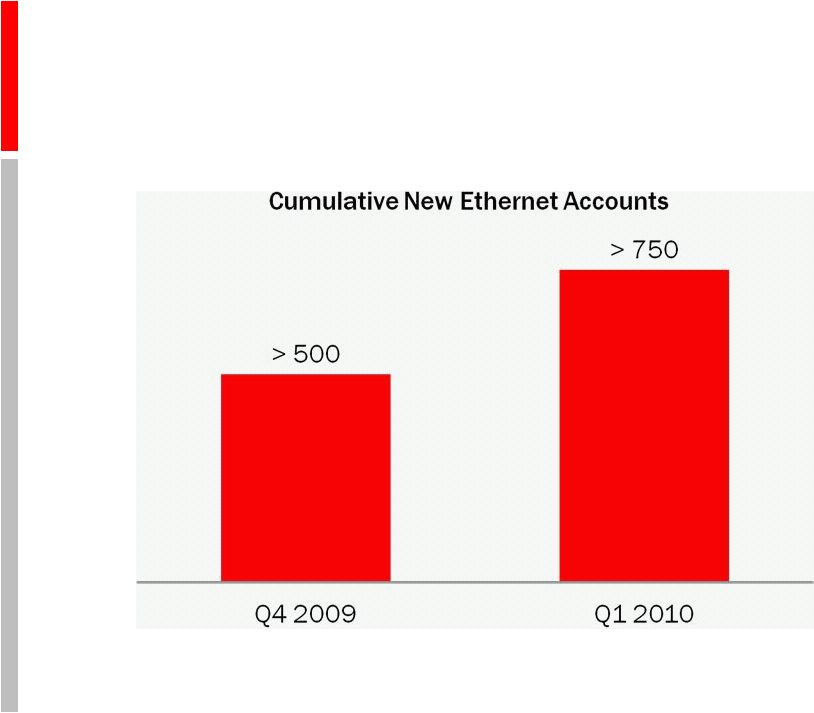
 Executive Overview Q1 results • $539.5M revenues • 59.3% non-GAAP gross margin* • $0.19 non-GAAP EPS* • $154.7M adjusted EBITDA Storage • Strong growth, increasing share • Strategic and financial platform Ethernet • Focus on direct account acquisition and penetration: over 750 new accounts to date Balanced business model enables continued execution ** Note: Q1 2010 is the fourth full quarter of combined operations post-Foundry acquisition ** * Note: Non-GAAP, please see GAAP reconciliation in appendix Quarterly Revenues $432M $506M $493M $522M $539M Q1 09 Q2 09 Q3 09 Q4 09 Q1 10 |
| © 2010 Brocade Communications Systems, Inc. Page 6 of 40 Brocade reported Q1 revenues of $539.5M, with non-GAAP EPS of $0.19, adjusted
EBITDA of $154.7M and non-GAAP gross margins of 59.3%. Q1 was the
18th consecutive quarter that Brocade exceeded non-GAAP EPS consensus expectations, demonstrating the successful execution of our strategy that leverages operational excellence and a diversified
business model across geographies, market segments and go-to-market routes. This business model is driven by our two key markets, namely our core Storage
Networking business and our newer Ethernet business, which we acquired in
Fiscal 2009. During the quarter our Storage Networking business grew a very healthy 16.3% sequentially. We believe our success in Storage Networking provides a robust strategic and financial platform
for our Ethernet business as we build upon our product portfolio and
account penetration in that market. The high level of customer satisfaction and our reputation in Storage Networking helps open doors to accounts at the highest levels and provides us with new
opportunities to sell our Ethernet product portfolio along with the
resources to build out our distribution model to increase share in this multi-billion dollar market. It is clear, however, that we have some work to do in growing our Ethernet business
to the levels we expect. In short, our Ethernet business did not meet
our revenue expectations, largely due to lower-than-expected revenues from Federal customers and slower-than-anticipated development in our go-to-market routes. However, we have focused on the
issues behind these results and have taken immediate steps to rectify
them. We faced and successfully overcame similar challenges when we entered the Fibre Channel business more than a decade ago. At that time, we recognized that product superiority and channel presence alone are
not sufficient to drive revenues. We needed and established customer
intimacy by evangelizing our technologies, solutions and expertise to customers and channel decision makers. Leveraging this experience, Brocade is accelerating its strategy and redeploying
resources to drive direct account acquisition and penetration in our
Ethernet business. Our stated strategy is to focus on new account penetration and to have 1000 new Ethernet accounts by the end of 2010. As we exited Q1, we are on track to exceed this goal. Building
share requires sustained effort; and we expect success to take time, but
we have planted flags throughout the Global 2000, and are confident in our resources, vision and commitment to succeed. I will discuss the lessons of the quarter and our go-forward strategies in more
depth but first I would like to provide more details about the quarter.
|
 Increasing Storage Networking Market Share Reputation, performance, 8 Gbps, and Fibre Channel drive results Source: Brocade estimates |
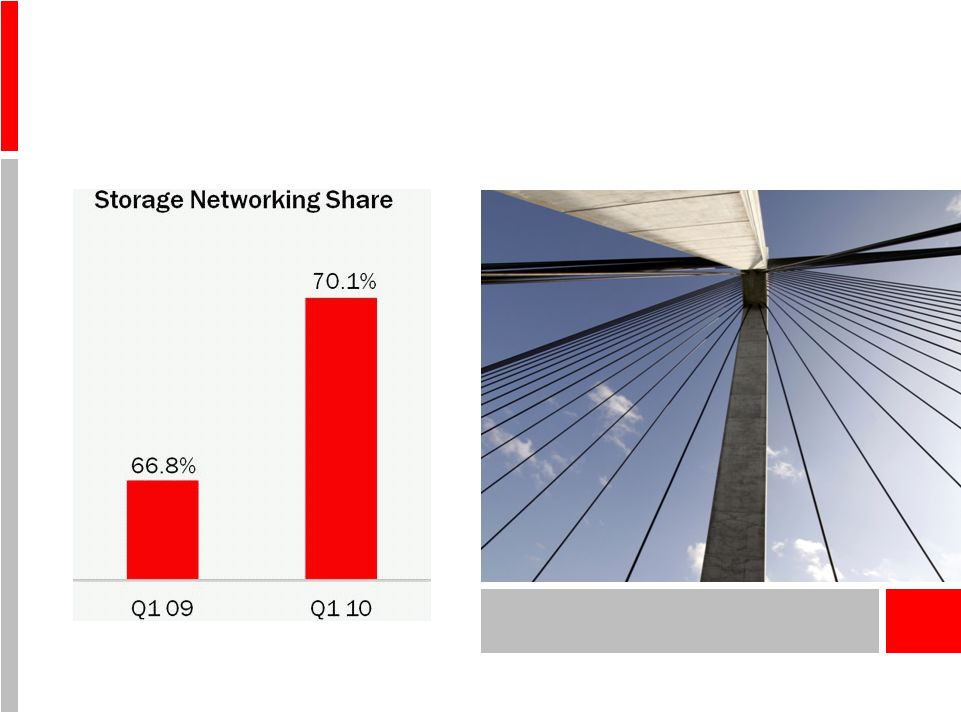
| Looking a bit deeper into our performance in Storage
Networking, it was clear that we continued to accelerate that business,
reaching an estimated 70.1% market share in Q1 FY 2010, up from 66.8% in
Q1 FY 2009. Market share tends to fluctuate, but our remarkably
consistent gains in the last dozen quarters reflect customer loyalty, earned by delivering the most reliable products in the data center—bar none. Customers regularly cite our reliability, which is
paramount to their success, as their key decision criteria. In addition,
they also value our openness, product density, speed, and power/cooling efficiency, and overall best value. Our success in Storage Networking aligns with increasing demand for Fibre Channel, which accounts for over 90% of current RFPs we are involved with and continues to grow because Fibre Channel is the solution of choice to manage ever-growing storage needs
thanks to proven reliability, superior scalability and significant
price/performance advantages. Brocade's strategy allows customers to
invest in our current Fibre Channel portfolio with confidence, knowing
that we have a well-developed, standards-based roadmap to
emerging technologies and architectures. These attributes enable customers to choose when and how to evolve their data center infrastructures. © 2010 Brocade Communications Systems, Inc. Page 7 of 40 |
 Increasing Storage Demand 8 Gbps Fibre Channel TAM $1.2B $2.0B 2009 2010 Accelerating in 2010 following introduction of native 8 Gbps arrays Percent of CIOs Stating When They Plan to Increase Storage Spending 2011 or Later, 9% 1H 2010, 10% 2H 2010, 62% Source: Dell’Oro Group Source: Morgan Stanley CIO Survey, January 2010, n=90-150 No Expectation, 18% |
| Accelerating Storage Networking demand aligns with our view of the
strengthening of the entire IT market, corroborated by Forrester
Research, which, in January, predicted that global IT spending will grow by an estimated to 8.1% in 2010, up from 4.9% previously. Looking at our Storage Networking mix, our strong performance is fueled by the continuing migration to 8 Gigabit Fibre Channel, reflected by the fact that our 8 Gig Fibre Channel revenues more than doubled on a sequential basis. Analysts agree that the
transition to 8 Gig Fibre Channel is in full ramp. For example, the Dell’Oro Group estimates that 8 Gig Fibre Channel spending will increase sharply in 2010, reaching $2.0B, up from $1.2B in 2009. Additionally, TheInfoPro recently surveyed Storage Networking end-users at Fortune 1000 firms who ranked 8 Gig Fibre Channel as one of the highest priority budget items in 2010, with 46% of these respondents indicating plans to increase spending on 8 Gig Fibre Channel this year. The good news for Brocade is that customers view us as the vendor-of-choice in 8 Gig Fibre Channel. Fibre Channel momentum also continues among our partners with the recent and planned introductions of native 8 Gig Fibre Channel arrays from major OEMs including EMC, HDS and IBM. As strong as Storage Networking was in Q1, we believe that the second half outlook
continues to improve based on indications from partners, feedback from
our field sales force, and from analysts covering the space. Morgan Stanley recently reported that storage utilization is unsustainably high. Additionally, their January survey of
CIOs indicated that over 60% expect to increase storage spending in the second half of 2010, in part driven by the resumption of
delayed projects. This is a sharp increase from the October survey
results. Similarly, The Enterprise Strategy Group (ESG) reported that enterprise customers expect to significantly increase spending on both storage and networking hardware in 2010
versus 2009. Specifically, ESG is predicting that customers will
increase network hardware spend by 17% and storage hardware spend by 16%. Lastly, the Federal government is looking to achieve IT productivity comparable to levels found in the
private sector, and has announced plans to consolidate a meaningful
number of its more than 1000 data centers in the coming year. These
spending trends bode well for Brocade and our partners. © 2010 Brocade Communications Systems, Inc. Page 8 of 40 |
 Data Center Convergence Enables access to Enterprise Data Center and Campus Ethernet Campus Data Center Ethernet Ethernet Fibre Channel Ethernet Fibre Channel over Ethernet Enterprise Future Converged Networks Today’s Dedicated Networks |
| © 2010 Brocade Communications Systems, Inc. Page 9 of 40 Looking forward, Brocade believes that converged architectures will assume a role in
the Next-Generation Data Center, supporting higher levels of
virtualization that will drive scale, efficiencies and performance. Interestingly, the Gartner Group supports Brocade's view that Fibre Channel will continue to play a significant role as a technology of choice in
Next-Generation Data Center architectures. In a survey of attendees
at Gartner’s December 2009 Data Center Conference, two-thirds cited Fibre Channel as the "most important" data center networking technology for virtualized data centers. Gartner attributed this to IT
professionals' preference for proven, high-performance technologies. When converged networking technologies mature and are widely considered proven, they
promise customers both capital and operating cost advantages that can be
leveraged to cost effectively meet higher Service Level Agreements. Achieving these efficiencies will require higher levels of virtualization, which will require higher bandwidth and higher
storage-attach rates. Today, Brocade is a leader in bringing
converged networking technologies to market and offers several interoperable convergence products, including the Brocade 8000 FCoE Switch, 10 Gigabit Ethernet converged network
adapters, and modular options for our DCX Backbones and MLX Series
Routers. Customers understand and appreciate our industry-leading, multi-year roadmap of converged data center storage products and regularly rely on Brocade to help future-proof their
networks. Data Center customers who are interested in our
converged networking products are having discussions around openness, availability, cost, performance, standards, interoperability and our roadmap. This opens
Next-Generation Data Center Networking discussions, which in turn, highlights their Enterprise LAN/Campus Ethernet needs. These discussions come with a
sense of urgency due to their aging Enterprise networks and rising data
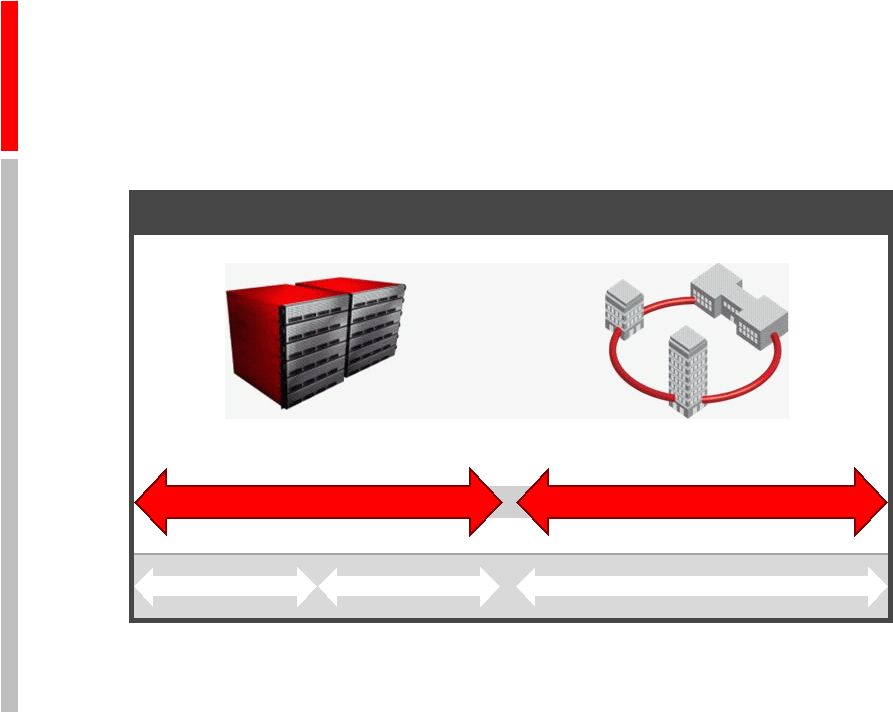
and network-traffic growth. Customers are seeking guidance from trusted sources to manage bandwidth, device, and virtual machine growth, which is taxing legacy architectures. Enterprise accounts, large and small, drive three-fourths of total campus
Ethernet spending and, as a leading Data Center Networking provider,
with the trust and confidence of Global 2000 Enterprise customers, Brocade is being invited to compete for both our share of Next- Generation Data Center Networking opportunities and an increasing share of
Enterprise Campus opportunities. Brocade expects to gain Ethernet
share in Next-Generation Data Centers based on our leadership position bringing open, converged networking solutions to the market. However, penetrating this segment will take
time. |
 New Ethernet Account Growth Securing footholds, moving from lab trials to applications
|
| As mentioned, new Enterprise Ethernet account penetration is a
cornerstone of our growth strategy. Discussions in Fiscal 2009 led to
over 500 new direct Ethernet accounts, many of which are engaged in proof-of-concepts and lab trials at deal sizes that have been smaller than initially expected. As of Q1, we have now opened over 750 such new accounts, many of which are conducting trials that we expect to move out of labs and into production, targeting a
single application as a first step. These migrations typically take 6 to
9 months per phase, again somewhat longer than initially expected. Our end goal is to be positioned as an approved vendor after 12 to 18 months. Once validated, we expect to
see strong traction in these accounts through choice and value in terms
of price, performance and feature sets. Some say “experience is the
greatest teacher” and Q1 highlighted several lessons that now shape
our go-forward Ethernet sales strategy: First, Brocade must drive demand via customer intimacy, whether that demand is
fulfilled directly, via the channel, or an OEM partner.
Second, OEM partners continue to ramp; however, more slowly than previously expected. Going forward, Brocade will prioritize driving end-customer demand for our OEM partners directly. Third, lengthy Enterprise sales cycles are a fact-of-life, and we must be
prepared to go the distance. We are. Fourth, Brocade must maintain
focus on traditional, “Classic Foundry” accounts, and is
investing in demand-generation and inside sales-programs
tailored to these accounts. Finally, executing a more direct sales
model will require additional direct sales resources which we have begun deploying. © 2010 Brocade Communications Systems, Inc. Page 10 of 40 |
 Ethernet Customer Announcements M Resort Las Vegas UMS-Wright Prep School BOK Center Province of Bergamo Grass Roots Group Royal College of Physicians Hostway Savannah College of Art & Design Innovative companies and organizations choose Brocade |
| Brocade’s Enterprise account acquisition and penetration
strategy is ongoing and has already translated into key wins in some of
the most innovative deployments of networking technology today, including the M Resort, which has positioned itself as the most technologically advanced resort in Las Vegas by having rolled out quad play
(video, voice, data, mobility) services over a Brocade network that
touches virtually every one of the resort's business operations. Another
example is the 10 Gigabit Ethernet deployment at the UMS-Wright
Preparatory School, which has leveraged Brocade networking technologies to become one of the most technologically ambitious educational institutions in the United States.
These are clear indications that smart, innovative companies and organizations are turning to Brocade to help transform and enhance their businesses and operations by leveraging the full potential of
cutting-edge networking technologies, which gives me great optimism
for our Ethernet business going forward. And with recent reports from
Goldman Sachs and TheInfoPro showing that an increasing percentage of
CIOs and other senior IT executives will be looking to refresh their aging network hardware some time in
2010, we believe we're well positioned to win many more deals that
demonstrate the value of Brocade's networking technologies and expertise. © 2010 Brocade Communications Systems, Inc. Page 11 of 40 |
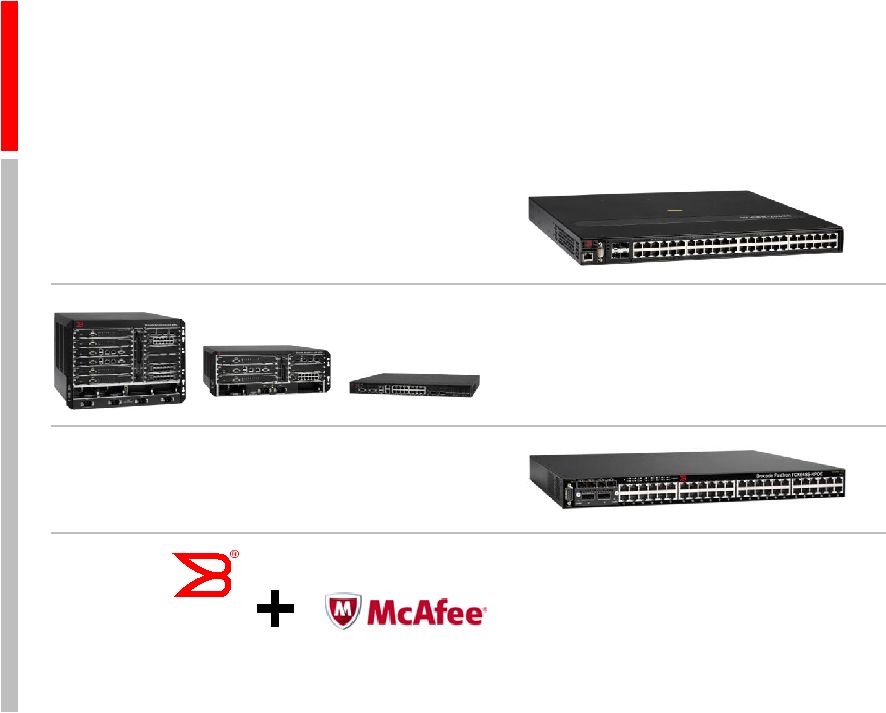 Ethernet Innovation Market-leading performance ServerIron ® ADX Series Application Delivery Controllers •Secure, high-performance e-commerce transactions FCX ® Series Switch •Price/performance leader in
category NetIron ® CER 2000 Series MPLS Router •Double the capacity of
competing products Brocade/McAfee Partnership •Fully interoperable
end-to-end network
security solution BROCADE |
| We continue to support our Ethernet growth plans through continuous
innovation and new product introductions. An example of this was our
introduction of the NetIron ® CER 2000 Series MPLS Router, which has double the routing capacity and triple the
performance capabilities of competing products. More recently, we
introduced the latest version of the ServerIron ® ADX Series application delivery controllers, which feature twice the performance of competing
products in a key application used in secure, high-speed
e-commerce transactions. In addition, recently, we announced a strategic partnership with McAfee, the worldwide leader in IT security, to deliver a broad set of fully interoperable
end-to-end network security solutions. Lastly, we introduced a data center version of the FCX Series Switches, which establishes it as the
price/performance leader in its category. © 2010 Brocade Communications Systems, Inc. Page 12 of 40 |
   Other Achievements • Restructured balance sheet • Optimizing capital structure • Increased operating flexibility • Cited as one of Fortune’s 100 Best Companies • Confidence, satisfaction, trust and pride • Retention, recruiting, and productivity benefits Executing towards long-term goals |
| Beyond innovations, customer wins and financial success,
Brocade also achieved two major milestones: First, we successfully
accessed the debt market, which diversified our funding sources and
significantly moved Brocade towards its optimal, long-term capital structure. Second, we were recognized as one of the “100 Best Companies to Work For”, ranking 61 st on Fortune Magazine’s list, which reflects our employees’ confidence, satisfaction, trust and pride in Brocade. Being nationally recognized by
Fortune Magazine comes after being recognized last May as the best
technology company to work for in Silicon Valley by the Silicon Valley
Business Journal. These and other data-points are measures of the
health of our ecosystem and our workforce, which is our most valuable asset and the critical determinant of the long-term success of any organization.
Developing talent and creating the conditions and resources to succeed
requires long-term vision and commitment. Year in and year out,
Brocade both anticipates and adapts to change while running its playbook. To do so, we have invested and continue to invest across the board: in innovation, distribution, brand building and our
employees, who operate within a pragmatic, disciplined culture that wins
against larger competitors who have more resources and larger customer-install bases. Brocade employees are justifiably proud of their achievements, but by no means complacent, and understand
that the quarter just ended demonstrated both our strengths as well as
areas where we need to step up to achieve the milestones ahead of us. © 2010 Brocade Communications Systems, Inc. Page 13 of 40 |
 CEO Summary • 1 of 2 end-to-end networking companies worldwide • Robust demand drives stronger-than-expected storage performance and outlook • Diversified, balanced business model • Executing towards long-term vision • Strong financial results Compelling opportunity |
| As one of only two end-to-end networking vendors,
Brocade’s growth opportunity is compelling. More than ever, Brocade moves forward focused on execution by meeting our customers’ needs, enabling choice and bringing innovation to networking markets worldwide. Brocade’s financial performance remains strong affording
opportunities to invest, both to maintain storage leadership, and to grow
our Ethernet business. Based on the last few quarters, Brocade is taking a
pragmatic view of the current year and now targets revenue growth of 8-12% in 2010 driven by (1) IT spending growth, especially in storage, (2) increasing our focus on Ethernet account acquisition, and (3) our ability to
innovate, all of which are expected to contribute to strong second half
results. Our outlook reflects healthy growth over fiscal year 2009 based on robust demand and our ability to execute our diversified, balanced business model and growth strategies. © 2010 Brocade Communications Systems, Inc. Page 14 of 40 |
 Q1 FY 2010 Financials Richard Deranleau, CFO |
| Prepared comments provided by Richard Deranleau, CFO © 2010 Brocade Communications Systems, Inc. Page 15 of 40 |
| Q1 Financial Highlights • Revenues • Storage networking grew 16.3% seq., partially offsetting lower Ethernet revenues • Sequential growth in EMEA and Americas • Strong performance from storage OEMs • Margins within or exceeding long-term model • Non-GAAP gross margins of 59.3%*, operating margin of 26%* • Strengthening balance sheet • Operating cash flows and adjusted EBITDA remain strong • Lower net debt • Restructured balance sheet with amended debt covenants that provide greater flexibility Balanced model, high margins, and highly variable cost structure * Note: Non-GAAP, please see GAAP reconciliation in appendix |
| In Q1 Brocade benefited from its diversified model, high
margins and highly-variable cost structure to turn in record Adjusted
EBITDA and strong EPS (both Non-GAAP and GAAP) ahead of consensus.
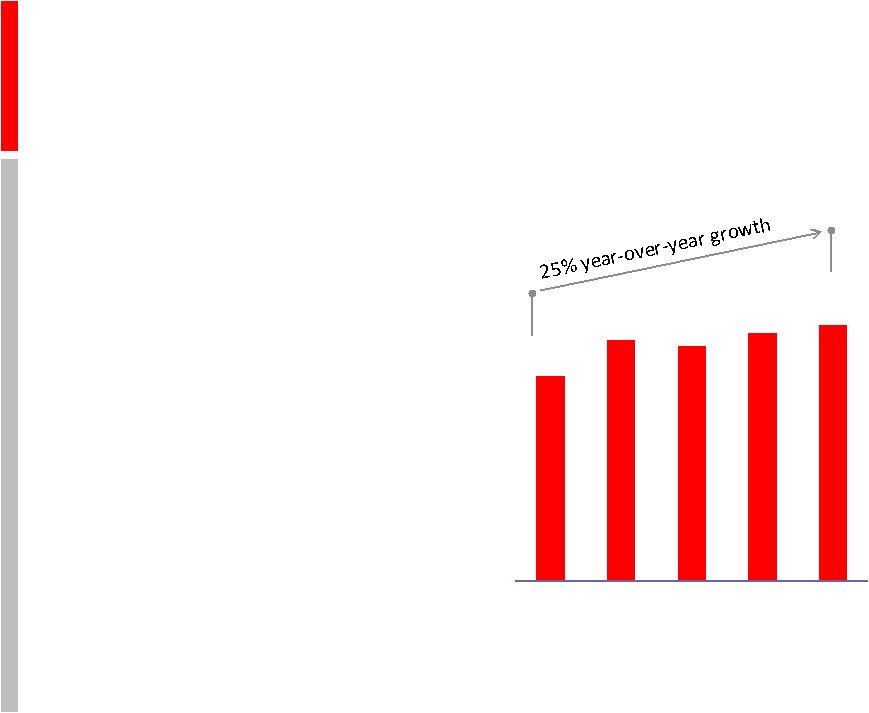
Turning first to revenues, Q1 revenues increased $17.7M sequentially, or
3.4%, reaching $539.5M, and were up 25% year to year. We saw
significant demand in our Storage Networking business, which grew 16.3% sequentially, and partially offset sequentially lower Ethernet revenues, which decreased 25.7% quarter to quarter. Non-GAAP Gross Margins of 59.3% were within our Long Term Model. The sequential decrease was driven by one-time charges in our Global Services supply chain. Non-GAAP Operating Margins of 26% exceeded our Long Term Model reflecting once
again the operating leverage in our model. Brocade’s balance
sheet continues to strengthen, thanks to continuing strong cash flows from operations and record Adjusted EBITDA. These cash flows, and the sale of our Skyport property, helped reduce net debt again in the quarter. In addition, Brocade
restructured its balance sheet and amended its Term Debt Covenants to provide
greater flexibility and lower our cost of capital. © 2010 Brocade Communications Systems, Inc. Page 16 of 40 |
 Key Financial Metrics Strong profitability * Note: Non-GAAP, please see GAAP reconciliation in appendix ** Note: Adjusted due to new accounting standards relating to convertible debt
instruments Q1 2009 Q2 2009 Q3 2009 Q4 2009 Q1 2010 Revenue $431.6M $506.3M $493.3M $521.8M $539.5M Non-GAAP gross margin* 59.7% 56.2% 58.2% 59.5% 59.3% Non-GAAP EPS*—diluted $0.15 $0.11 $0.12 $0.15 $0.19 GAAP EPS—diluted** ($0.06) ($0.17) ($0.06) $0.07 $0.11 |
| Our Key Financial Metrics show continued strong revenue, non-GAAP
gross margin, and non-GAAP and GAAP EPS performance. © 2010 Brocade Communications Systems, Inc. Page 17 of 40 |
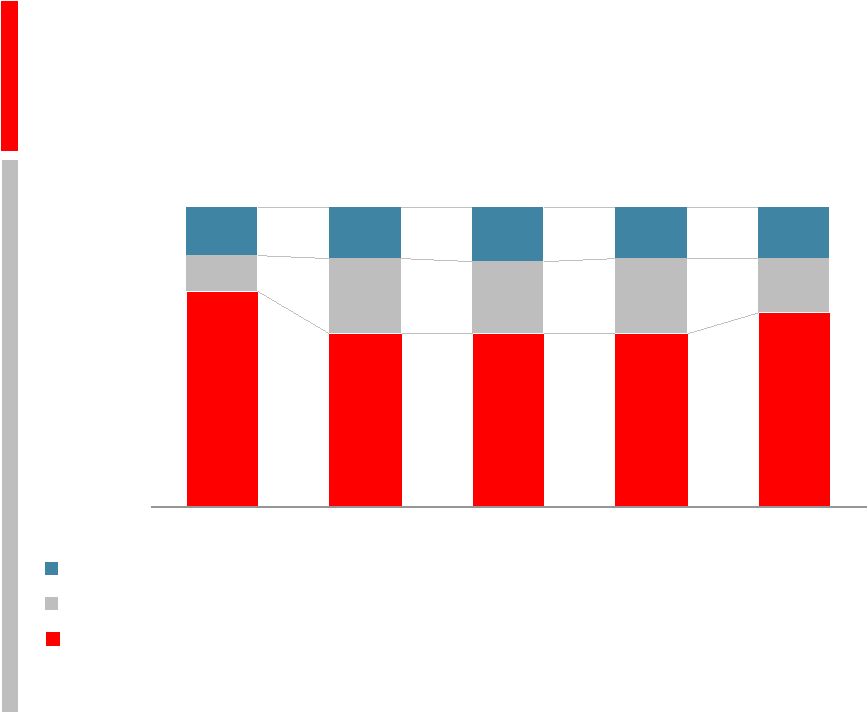 Revenue: Storage, Ethernet, and Services* Services 16% 17% 18% 17% 17% Ethernet 12% 25% 24% 25% 18% Storage 72% 58% 58% 58% 65% Q1 09 Q2 09 Q3 09 Q4 09 Q1 10 Storage increases to 65% of revenues * Note: Q1 2010 is the fourth full quarter of combined operations post-Foundry
acquisition * |
| Turning to revenues by business unit… Storage strengthened to 65% of revenues in Q1 versus 58% in Q4. The storage portfolio performed very well, both from a product and channel perspective with strength across the board. Migration to 8 Gig Fibre Channel continued to accelerate during the quarter, with identifiable 8 Gig Fibre Channel Director shipments increasing over 145% sequentially and now representing 77% of identifiable Director shipments. For Switches, identifiable 8 Gig shipments increased 82% and now represent 54% of total Identifiable Switch shipments. For reference, identifiable shipments are those shipments where Brocade ships Optics with the director/switch units. Data Storage ASP sequential declines were in the low single digits. Our server product group, consisting of CNA’s, Embedded Switches, HBA’s,
and Mezzanine Cards, grew strongly and generated over $45.7M in the quarter, up 22% sequentially from $37.5M in Q4, driven by strong performance in embedded switches, while HBA/CNA revenues where roughly flat. Our Ethernet business declined 25.7% sequentially and represented 18% of revenues in
the quarter, versus 25% in Q4. Ethernet Revenues performance was mixed.
On a positive note, US Enterprise (non-Government) revenues increased 8% quarter over quarter, including services, to $75 million. Also, our Stackable products, which are typically sold into LAN/Campus environments, were also up by 7% quarter over quarter, including services, to $48.3 million. However, our revenues from our US Federal business were significantly down
sequentially by $26.7 million quarter-over-quarter, including services. The Federal under performance was due in part to delays to the US Defense
appropriations bill, which was signed in mid-December instead
of late November as previously expected. Additionally, our Data Center Ethernet revenues did not grow as anticipated for the reasons noted by Mike earlier. Separately, our Services business represented 17% of revenues, versus 16% in the
prior year’s first quarter. On a sequential basis, Services grew 1%
and grew 31% year-over-year. © 2010 Brocade Communications Systems, Inc. Page 18 of 40 |
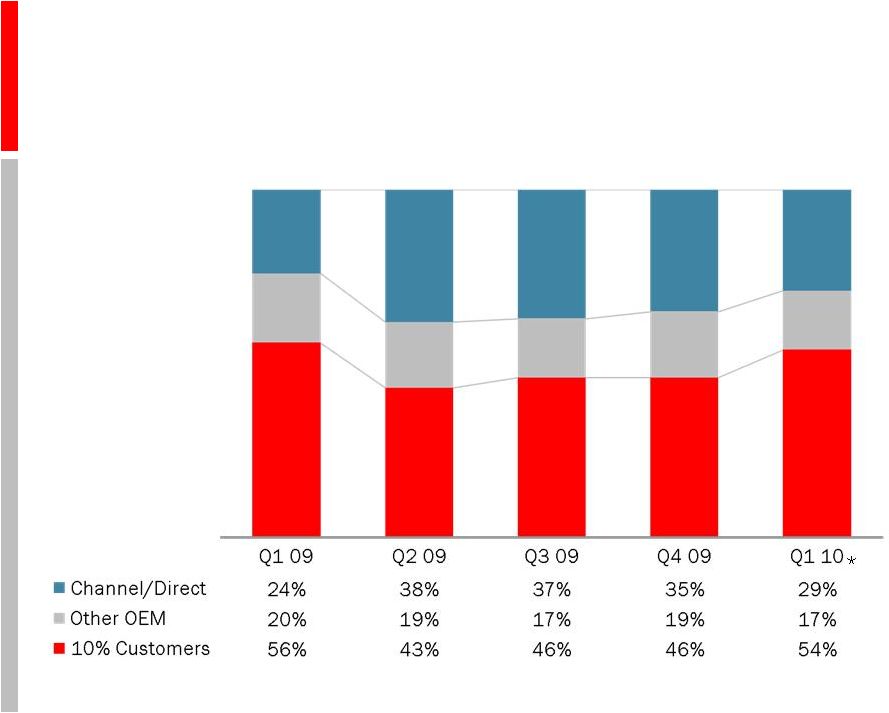 Revenue: 10% Customers, Other OEM, Channel/Direct Increasing share from large OEM partners * Note: Q1 2010 is the fourth full quarter of combined operations post-Foundry
acquisition * |
| 10% customers, in the aggregate, remained consistent with prior
quarters, with EMC, IBM and HP all contributing more than 10% of revenues
individually. Collectively, our top 3 OEMs contributed 54% of revenues in Q1 versus 46% in Q4. Other OEMs were 17% revenues in Q1 versus 19% in Q4. Channel and Direct were 29% of revenues in Q1 versus
35% in Q4. The primary driver of the mix shift towards OEM revenues was
higher Storage Networking revenues as a percentage of total revenues. © 2010 Brocade Communications Systems, Inc. Page 19 of 40 |
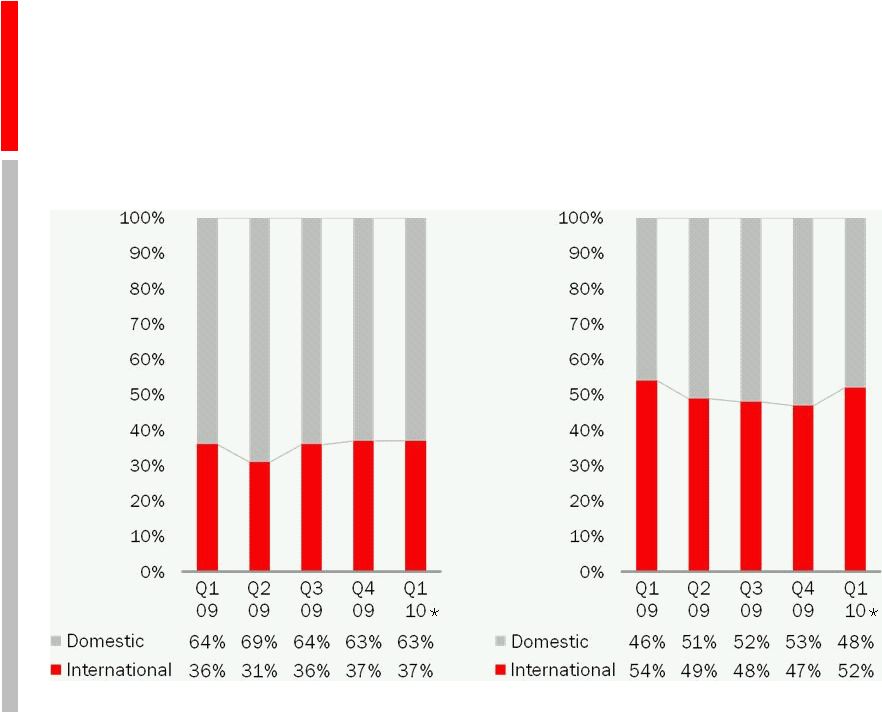 Domestic and International Reported Revenue vs. Demand Stronger non-US demand Reported Revenue on a Ship-to Basis Demand by Estimated End User Location * Note: Q1 2010 is the fourth full quarter of combined operations post-Foundry
acquisition |
| Turning to geography… As reported, on a ship-to basis, the US represented 63% of revenues in Q1 10,
consistent with 63% in Q4 09 and down slightly from 64% in Q1 09.
On an estimated end-user basis adjusting for those partners who take
delivery of internationally bound products in the US, the US declined to
48% of total revenues in Q1 10, down from 53% in Q4 09, and up from 46% in Q1 09. EMEA was in line with our expectations, showing a 6.1% sequential improvement, APAC
and Japan were slightly below our expectations, and in total, APAC/Japan
was down slightly on a sequential basis. © 2010 Brocade Communications Systems, Inc. Page 20 of 40 |
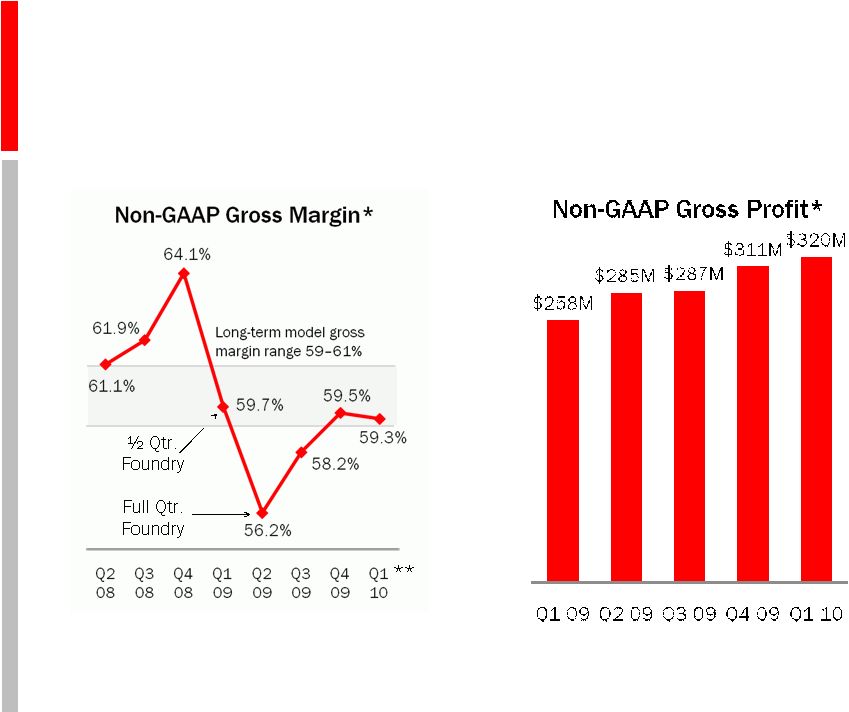 Non-GAAP Gross Margin and Gross Profit Strong margins and profitability * Note: Non-GAAP, please see GAAP reconciliation in appendix ** Note: Q1 10 is the fourth full quarter of combined operations
post-Foundry acquisition ** |
| Gross margin, on a non-GAAP basis, remained strong at 59.3% in Q1
10, consistent with 59.5% in Q4 09. Gross margin was positively impacted
by higher Storage Networking mix and negatively impacted by reduced Ethernet volumes. Global Services margins were 47.6% in Q1 10, down from 50.7% in Q4 09, mainly
reflecting a one-time charge in the Services supply chain.
Gross Profits continue to increase due to revenue growth and stable gross
margins. © 2010 Brocade Communications Systems, Inc. Page 21 of 40 |
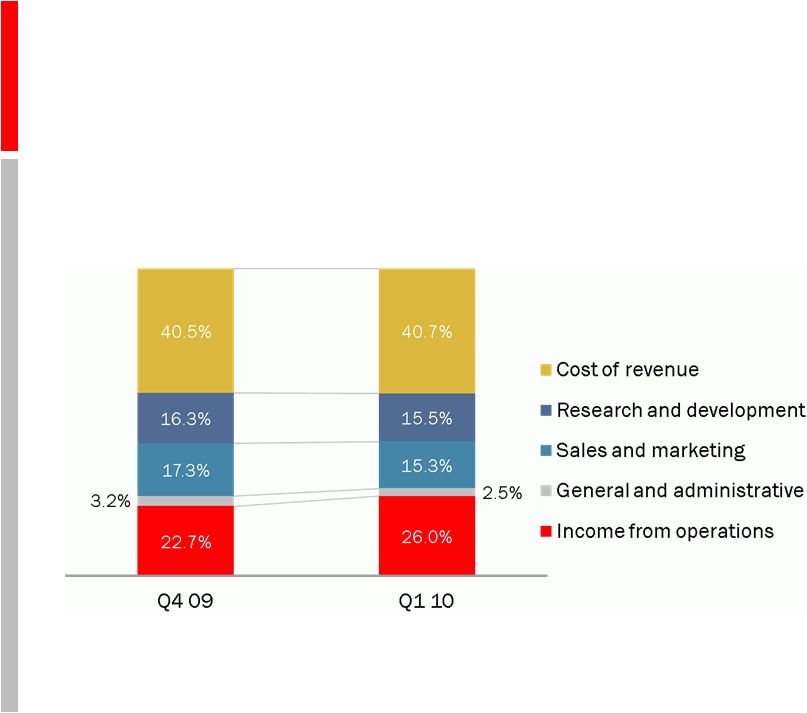
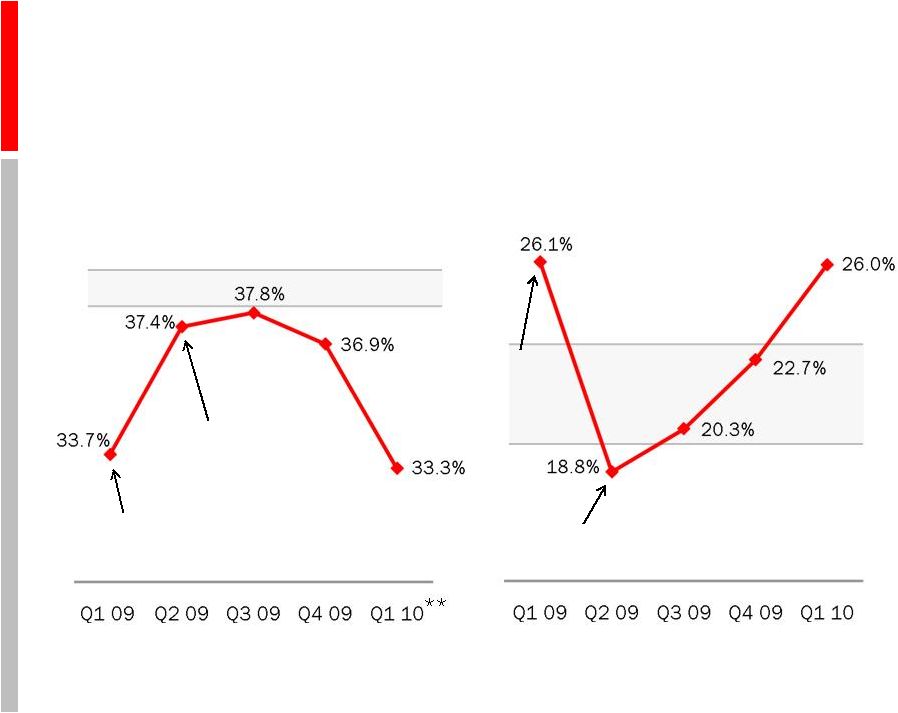 Operating Expenses and Margins Expense controls drive sequential margin expansion ½ Qtr. Foundry Full Qtr. Foundry Long-term model operating margin range: 20–23% Non-GAAP Operating Margins* Non-GAAP Operating Expenses* as a Percentage of Revenues ½ Qtr. Foundry Full Qtr. Foundry Long-term model operating expense range: 38–39% * Note: Non-GAAP, please see GAAP reconciliation in appendix ** Note: Q1 2010 is the fourth full quarter of combined operations post-Foundry
acquisition ** |
| Mindful of the current economic environment, we continue to
work to control operating expenses, which were 33.3% of revenues in Q1 10 versus 36.9% in Q4 09 on a non-GAAP basis. Operating expenses
were better than our Long Term Model of 38% to 39% of revenues. At the
same time, Brocade continues to selectively invest in its business and added 44 new employees during the quarter, primarily in R&D. Non-GAAP operating margins improved significantly on a sequential basis to 26% in
Q1 from 22.7% in Q4, thanks to top line growth, which generated
operating leverage, more than offsetting slight Gross Margin
contraction. Non-GAAP Operating Margins exceeded our Long Term Model
of 20-23% in the quarter. © 2010 Brocade Communications Systems, Inc. Page 22 of 40 |
 Balance Sheet and Cash Flow Highlights as of January 30, 2010 Cash flows enable de-leveraging and reinvestment * Note: As defined in the term debt credit agreement Q1 2009 Q2 2009 Q3 2009 Q4 2009 Q1 2010 Cash from operations ($163.8M) $107.3M $16.6M $155.3M $69.1M Campus capital expenditures $23M $22M $25M $28M $31M Operating capital expenditures $13M $16M $20M $17M $17M Free cash flow $(200M) $69M $(28M) $110M $22M Cash and equivalents $214M $237M $250M $339M $501M Debt payments $0M $75.0M $33.1M $57.9M $506.5M Senior secured debt $1.11B $1.04B $1.01B $0.95B $1.04B Adjusted EBITDA* $136.7M $119.9M $119.3M $130.0M $154.7M Senior secured leverage ratio 2.07x 1.96x 1.94x 1.87x 1.99x Covenant 2.3x 2.3x 2.3x 2.3x 2.5x |
| Cash from operations was $69.1M in Q1, which is quite strong from a
seasonal perspective, as Q1 and Q3 are typically weaker cash flow
quarters. This strength reflected strong profitability and strong working capital management, particularly in our receivable collection performance. Capital Expenditures in the quarter were $48M,
composed of $31M for the campus, which is expected to be completed and
occupied during Q3, and $17M for operations. Free Cash Flow was $21.8M in the quarter, which is again, a strong seasonal performance. As a reminder, the bulk of our San Jose leases will mature by October of 2010, at approximately the same time as we occupy the new campus. Once those leases mature,
our cash flow will increase by $4M/quarter from reduced lease
payments. Cash and equivalents reached $501M. Excluding the sale
of our Skyport property, and the recent notes offering, cash would
have been $377M, an increase of $38M sequentially. Debt payments
in the quarter totaled $506.5M. Net debt decreased by $69M in the quarter; however Senior Secured Debt increased to $1.04B due to the
issuance of new debt ahead of the repayment of the McDATA convert, which occurred on February 16th, 2010. Adjusted EBITDA in the quarter was a record $154.7M, again, reflecting continued
strength of the business. The Sr. Secured Leverage Ratio increased to
1.99x due to the refinancing of a portion of the term loan with longer term notes. The Sr. Secured Debt Coverage Ratio covenant relating to the coverage ratio was amended and relaxed
and is now 2.5x, leaving us comfortably in compliance with our term
credit agreement. © 2010 Brocade Communications Systems, Inc. Page 23 of 40 |
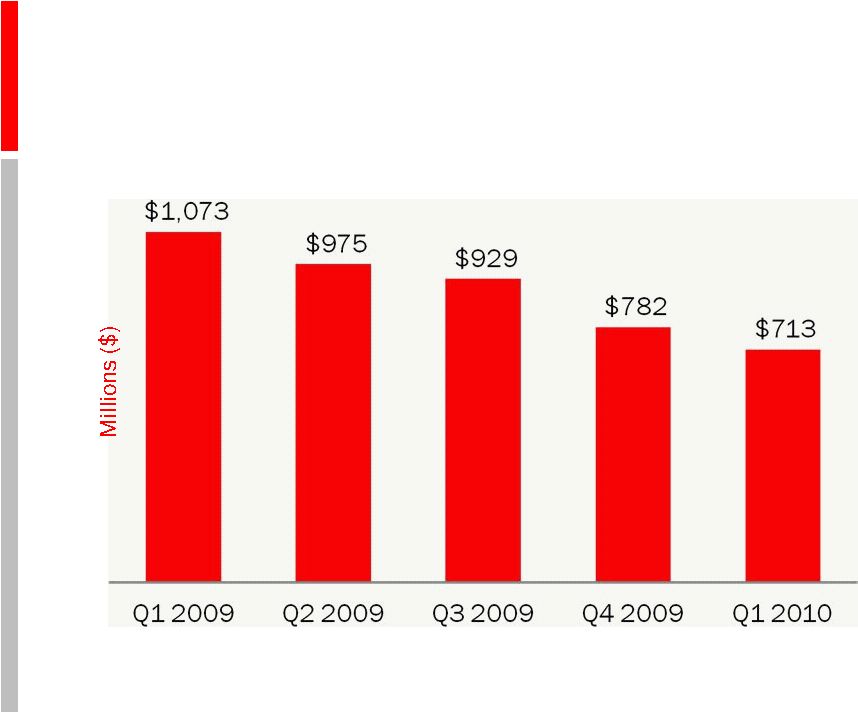 Net Debt: Defined as Total Debt Less Total Cash Net debt continues to decline steadily |
| Since acquiring Foundry last year, Brocade has steadily reduced net
debt, defined as Total Debt less Total Cash and Equivalents. Net Debt has
declined from $1.073B at the end of Q1 2009 to $713M at the end of Q1 2010, a $360M reduction. © 2010 Brocade Communications Systems, Inc. Page 24 of 40 |
 Repaid McDATA Convert on February 16, 2010 Post-quarter cash and debt update * Note: Estimates based on assumptions, including prepayments of term debt and line of credit ** Note: Non-GAAP, please see GAAP reconciliation in appendix ($ Millions, except as noted) Jan. 24, 2009 Jan. 31, 2010 April 30, 2010* Cash and short-term invest: 214 501 Approx. 300 Debt: McDATA convert 173 173 – Revolver 14 14 – Term debt 1,100 427 Approx. 335 8 yr. notes – 300 300 10 yr. notes – 300 300 Net debt: 1.1B 0.7B Approx. 0.6B Quarterly interest expense** 22.9 19.3 19.2 Note rating Ba2/BB+ Ba2/BBB- |
| As shown on Slide 24, post the McDATA convertible repayment, which occurred on February 16th, 2010, the balance sheet has
improved dramatically from January 2009, immediately after we financed
the Foundry acquisition, in terms of both amounts and timing of
maturities. This validates the strength of the Brocade business model to
generate cash. © 2010 Brocade Communications Systems, Inc. Page 25 of 40 |
| Restructured Balance Sheet • Closed $600M long-term notes on January 20, 2010 • 2 debt transaction, notes are investment-rated “BBB-” by S&P and “Ba2” by Moody’s • 10-year sr. notes yield 7%, 8-year sr. notes yield 6.75% • Brocade corporate and debt ratings upgraded by S&P • Flexible, balanced capital structure • Term debt remaining: $427M* • No pre-payment penalty • Target repaying entire term debt within 8–10 quarters • Fixed and floating rate debt with staggered maturities • Covenants loosened to allow subordinated debt, higher debt/EBITDA ratios,
and limited share buybacks • Sale/leaseback transaction • Monetized low-yielding non-strategic real estate asset located in San Jose,
generating $30M • Reduced higher-yield term debt while retaining operational flexibility
Continuing accelerated term debt repayments, which are accretive * Note: As of January 30, 2010 nd |
| Turning to the details of the Debt transaction… Brocade restructured its balance sheet, replacing approximately $150M of McDATA Convertible Debt due in February and $435M of Term Debt with $600M of long term fixed
notes, which were broken into two tranches with $300M maturing in 2018
and $300M maturing in 2020. The new notes were rated BBB- investment- grade by S&P and Ba2 by Moody’s, and yield 6.75% and 7%, respectively.
Thanks to this transaction, Brocade now has the balanced, flexible
capital structure initially targeted when planning the Foundry
acquisition. At that time Brocade targeted long term debt, composed of notes, totaling approximately 1x EBITDA with flexible term debt representing the remainder of the transaction. Now, thanks to
progress repaying term debt during the last year, along with the
restructured notes, Brocade moves forward with $427M remaining on the term as of January 30, 2010, and $600M of long term notes. The debt transaction and related Term Debt Amendment substantially reduce covenant
related risks, including an increase in the Sr. Secured Debt to Adjusted
EBITDA ratio, which increased from 2.3x to 2.5x through Q4 2011, 2.25 in FY 2012 and 2.0 in FY 2013, and also staggers debt maturities, allowing the company to build cash to
retire debt in manageable amounts over many years, and opens the door
for more strategic options for the company, such as greater investment in the business, increased pay down of debt, limited stock repurchases and other strategic uses.
© 2010 Brocade Communications Systems, Inc. Page 26 of 40 |
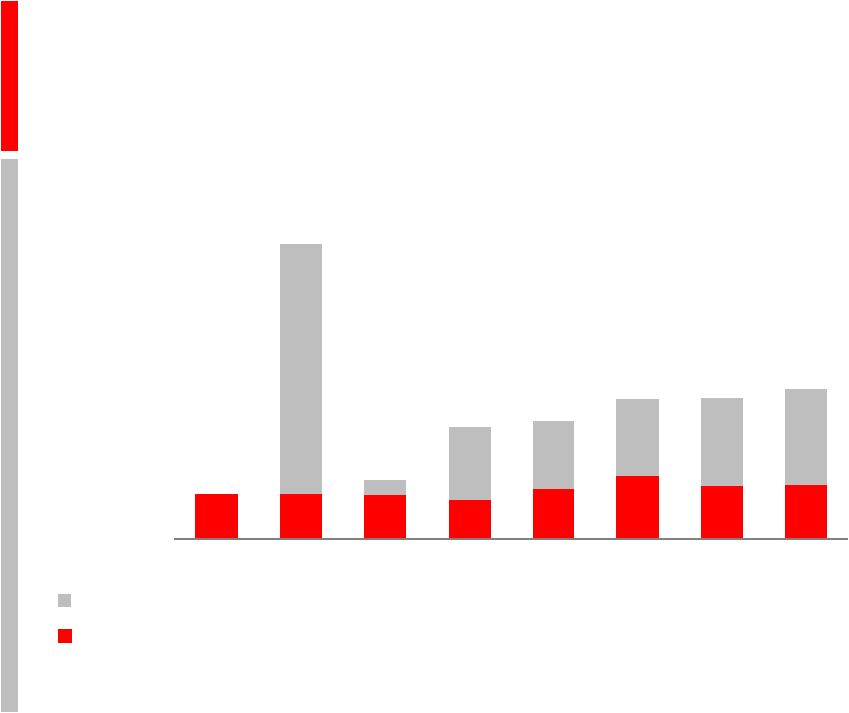
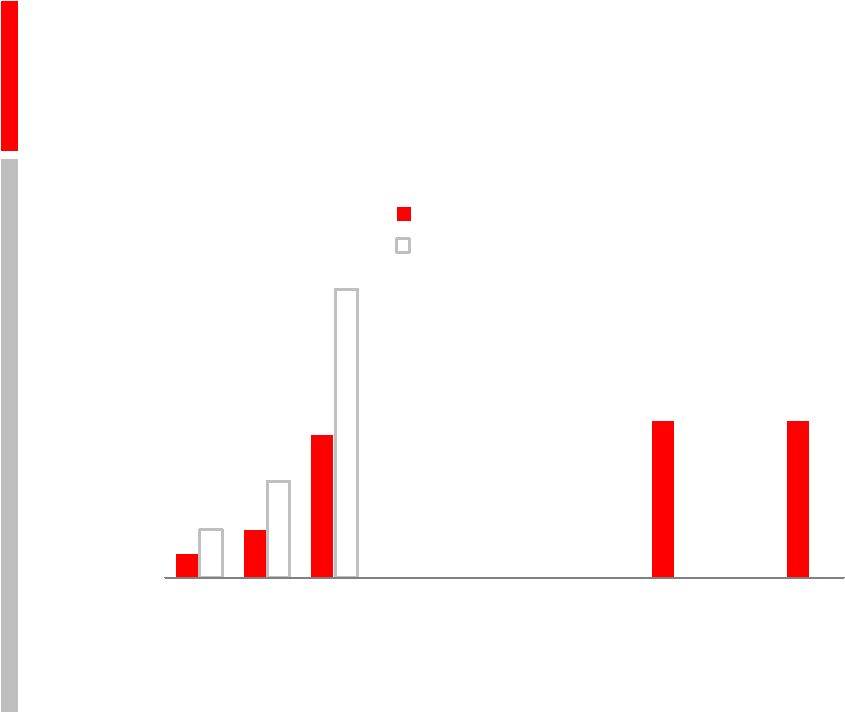 Restructured Balance Sheet Highly manageable repayment schedule $0M $100M $200M $300M $400M $500M $600M $700M 2011 2012 2013 2014 2015 2016 2017 2018 2019 2020 Current, post-January 20, 2010, Maturity Schedule Pre-January 20, 2010, Maturity Schedule
|
| The new debt maturity schedule is highly manageable over the next
decade with much lower near term required debt payments and two
relatively distant $300M payments. This compares favorably with the almost $600M maturing in October, 2013 under the prior structure. © 2010 Brocade Communications Systems, Inc. Page 27 of 40 |
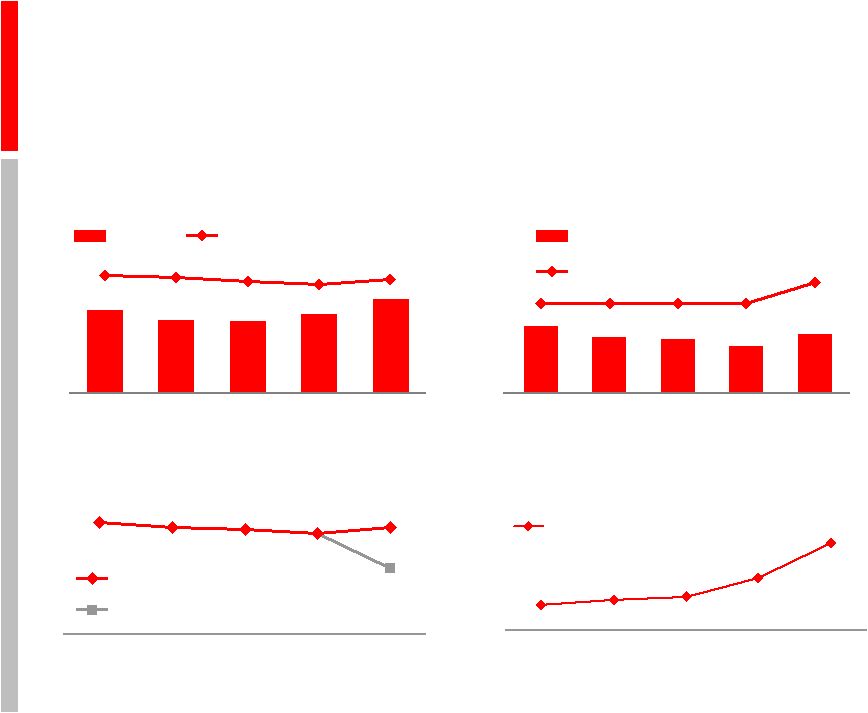
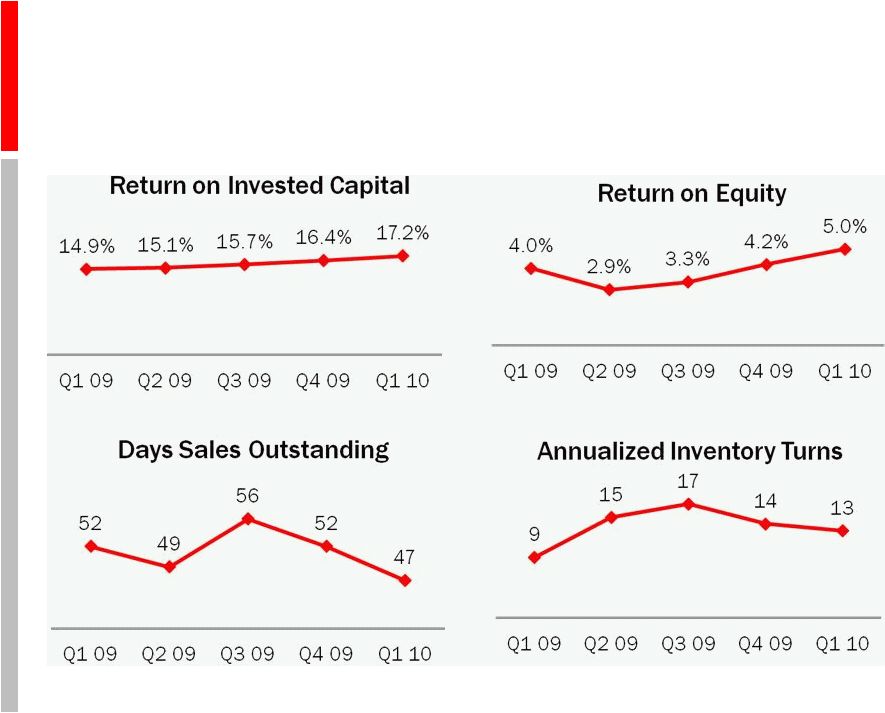 Selected Metrics Continuing ROIC, ROE, and DSO improvement |
| Return on Invested Capital continued to increase during the year, and
in the quarter reached 17.2%. Return on Equity also improved to 5.0%.
Days Sales Outstanding (DSO) were 47 days, down from 52 days in Q4, reflecting strong collections. DSO are now within our long term model of 45-50 days. Inventories turned 13 times versus
14 times in Q4. Lower turns are attributed to lower Ethernet product
revenues. © 2010 Brocade Communications Systems, Inc. Page 28 of 40 |
| FY 2010 Planning Assumptions • IT market conditions • Increasing IT spending, driving higher storage and Ethernet networking spending • Improving Enterprise spending throughout the year • ASP trends • Low-to-mid-single digit declines in Storage Networking • Mid-single digit declines in Ethernet • Taxes • Improved during the year due to discrete items in Q1, assuming no change to geographic or segment mix, and the extension of the investment tax credit Stronger-than-expected Storage Networking demand
|
| Now, as we look forward, here are some things to consider in
developing your financial models: Our primary planning assumption, which
appears solidly on track, is for global IT spending, and for Storage and
Ethernet Networking spending in particular, to continue to recover
during the first half of 2010 and to approach normalcy in the second half of 2010. We expect quarterly ASP declines on the Storage Networking side to remain in the
low- to mid-single digits. Declines on the Ethernet side are expected to be in the mid-single digits. Brocade benefited from discrete items in the quarter, which will positively impact our Non-GAAP tax rate for the rest of the year, assuming no change to either our geographic revenue mix or our Storage/Ethernet mix for the remainder of the Fiscal Year and an extension of the R&D Tax Credit. © 2010 Brocade Communications Systems, Inc. Page 29 of 40 |
 FY 2010 Financial Outlook As of February 22, 2010 * Note: Non-GAAP, please see GAAP reconciliation in appendix, ** Note: Equates to FY 2010 Revenues ranging from $2.1B to $2.2B Revenue growth 8–12% over FY 2009** Non-GAAP gross margin* 57–58% Non-GAAP operating expenses* Better than model Non-GAAP operating margin* In model Non-GAAP tax rate* 25–26% Fully diluted shares outstanding 495M–505M Non-GAAP EPS* $0.54–$0.58 Operating cash flow $375M–$400M Operating capital expenditures $80M–$85M Campus capital expenditures $120M–$125M Free cash flow $170M–$195M |
| © 2010 Brocade Communications Systems, Inc. Page 30 of 40 Given these considerations, we expect: • Full fiscal year 2010 revenue growth of 8-12%, year-over-year;
• Full fiscal year Non-GAAP gross margins for the full year to
be between 57% and 58%; • Full fiscal year Operating expenses to be
better than Model; • Full fiscal year Operating margins to be
in Model; • Full fiscal year non-GAAP tax rate ranging from
25-26%; • Full fiscal year diluted shares outstanding to be in a
range of 495M to 505M shares; • Full fiscal year Non-GAAP EPS to
be in a range from 54 cents to 58 cents; • Full fiscal year
Operating Cash Flow of $375M-$400M; • Full fiscal year
Operational Capital Expenditures of $80M to $85M; • Full fiscal year
Campus Capital Expenditures of $120M to $125M; • Full fiscal year
Free Cash Flow of $170M to $195M. |
 Financial Summary Richard Deranleau, CFO |
| So, to summarize from a financial perspective, we made progress
during the quarter which we expect will serve us well during the
remainder of the fiscal year. We saw better-than-anticipated strength across our Storage Networking business. We saw acceleration in the adoption of 8 Gig Fibre Channel. While we did see weakness in the
Ethernet business, we did see growth in US Commercial and our Stackable
products. In addition, we made significant improvements on our balance sheet and liquidity positions, as we continued to grow both Adjusted EBITDA and Cash Flows. Now, in closing, and as Mike has discussed, Brocade moves forward focused on growing
our Ethernet business and looks forward to your questions this
afternoon. © 2010 Brocade Communications Systems, Inc. Page 31 of 40 |
 Live Q&A Call February 22, 2010, 2:30PM Pacific Time Richard Deranleau CFO Marc Randall SVP Products & Offerings Ian Whiting SVP WW Sales & Marketing Dave Stevens CTO Mike Klayko CEO |
 Prepared comments provided by Peter Ausnit, Sr. Director, Investor Relations
That concludes Brocade’s prepared comments. At 2:30 p.m. Pacific Time on
February 22 Brocade will host a web cast conference call at www.BRCD.com primarily devoted to answering questions submitted via email to ir@brocade.com and taken live from participants via telephone. Thank you for your interest in Brocade. © 2010 Brocade Communications Systems, Inc. Page 32 of 40 nd |
 Appendix and Reconciliations |
 59–61% Long-Term Financial Model High margins, strong profitability * Note: Sources are Dell’Oro Group, Infonetics and Brocade estimates ** Note: Non-GAAP, please see GAAP reconciliation in appendix Storage Ethernet Services Brocade Non-GAAP 3-year TAM CAGR* 18.6% 11.7% 12–15% 12–17% Non-GAAP gross margin** 60–63% 55–60% 45–50% Non-GAAP operating expense** 37–39% 38–40% 20–25% 38–39% Non-GAAP operating margin** 21–26% 15–22% 20–30% 20–23% |
 Sequential Income Statement* Comparison Margin expansion from operating leverage * Note: Non-GAAP, please see GAAP reconciliation in appendix |
 Quarterly Net Income (Loss) GAAP/Non-GAAP Reconciliation * Adjusted as a result of adoption of new accounting standard relating to
convertible debt instruments (In Thousands) Q1 09 Q2 09 Q3 09 Q4 09 Q1 10 Net income (loss) on a GAAP basis* (23,898) (66,093) (23,494) 32,101 51,095 Adjustments: Legal fees associated with indemnification obligations and other related expenses, net 19,299 19,814 (561) (14,612) 301 Stock-based compensation expense 18,081 40,111 43,313 35,715 21,523 Amortization of intangible assets 25,197 39,372 35,002 34,950 34,902 Acquisition and integration costs 953 2,391 1,450 333 204 Loss on sale of property – – – – 8,783 Legal fees associated with certain pre-acquisition litigation – – – 546 299 Provision for certain pre-acquisition litigation – – – 14,335 – Interest due to adoption of new standard* 1,922 1,976 2,030 2,085 2,142 In-process research and development 26,900 – – – – Restructuring costs and facilities lease losses – 2,329 – – – Goodwill and acquisition related intangibles impairment – 53,306 – – – Acquisition related financing charges 4,366 – – – – Income tax effect of adjustments (9,265) (46,080) (2,364) (32,091) (25,239) Non-GAAP net income 63,555 47,126 55,376 73,362 94,010 |
 Capital Expenditures Cumulative campus spending: $214M to date out of $330M total $100M Campus - $80M $5M $23M $22M $25M $28M $31M Operating $14M $14M $14M $13M $16M $20M $17M $17M Q2 08 Q3 08 Q4 08 Q1 09 Q2 09 Q3 09 Q4 09 Q1 10 $10M $30M $50M $70M $90M - $20M $40M $60M $80M |
 EBITDA and Sr. Secured Leverage Ratio As defined in the term credit agreement Consolidated Senior Secured Leverage Ratio Q1 FY09 Q2 FY09 Q3 FY09 Q4 FY09 Q1 FY10 $ Thousand Consolidated Net Income ($26,031) ($63,118) ($21,034) $33,597 $51,095 plus (i) Consolidated Interest Charges $21,357 $26,398 $22,845 $20,681 $22,073 (ii) Provision for Federal, state, local and foreign income taxes payable $22,028 $20,021 $0 $1,277 (iii) Depreciation and amortization expense $39,754 $54,377 $50,956 $51,486 $51,012 (iv) Any cash restructuring charges and integration costs in connection with the
Acquisition, in an aggregate amount not to exceed $75,000,000 $5,319 $4,720 $1,450 $333 $204 (v) Non-cash restructuring charges incurred in connection with the Transaction, all
as approved by Arrangers $18,400 $19,972 $5,840 $2,097 $1,502 (vi) Other non-recurring expenses reducing such Consolidated Net Income which
do not represent a cash item in such period or any future period (in each case of or by the Borrower and its Subsidiaries for such Measurement
Period) $26,900 $53,304 $0 $0 $8,783 (vii) Any non-cash charges for stock compensation expense in compliance with
FAS 123R and amortization of the fair value of unvested options under the
Acquired Business’ employee stock option plan assumed by the Borrower $18,080 $40,111 $43,313 $35,714 $21,523 (viii) Legal fees and expenses relating to the Borrower’s indemnification obligations
for the benefit of its former officers and directors in connection with its
historical stock option litigation $13,740 $11,778 ($561) $0 $250 minus (i) Federal, state, local and foreign income tax credits $0 ($24,769) $0 ($6,707) $0 (ii) All non-cash items increasing Consolidated Net Income (in each case of or by
the Borrower and its Subsidiaries for such Measurement Period) ($2,877) ($2,899) ($3,511) ($7,216) ($3,036) Consolidated EBITDA $136,670 $119,874 $119,319 $129,985 $154,683 4 Quarter Trailing Consolidated EBITDA $537,081 $531,304 $518,002 $505,848 $523,861 Consolidated Senior Secured Debt $1,114,050 $1,039,050 $1,005,909 $948,028 $1,041,483 Consolidated Senior Secured Leverage Ratio 2.07 1.96 1.94 1.87 1.99 |
 Q1 FY10 Cash and Debt Covenant Continuing high adjusted EBITDA supports strong liquidity Strong Adj. EBITDA Performance… Improving Cash Balance… Stronger Capital Structure… Well Within Our Debt Covenant… $214M $237M $250M $339M $501M Q1 09 Q2 09 Q3 09 Q4 09 Q1 10 Ending Cash Balance $137M $120M $119M $130M $155M $537M $531M $518M $506M $524M Q1 09 Q2 09 Q3 09 Q4 09 Q1 10 Quarter Trailing 12 Months 2.07 1.96 1.94 1.87 1.99 2.3 2.3 2.3 2.3 2.5 Q1 09 Q2 09 Q3 09 Q4 09 Q1 10 Senior Debt Leverage Ratio Covenant $1,114M $1,039M $1,006M $948M $1,041M $441M Q2 09 Q3 09 Total Secured Debt Q1 09 Q4 09 Q1 10 Term Debt plus Revolver |
 Thank You www.BRCD.com |