Attached files
| file | filename |
|---|---|
| 8-K - FORM 8-K - Arlington Asset Investment Corp. | v174888_8k.htm |
 Investor Presentation
February 18, 2010
Investor Presentation
February 18, 2010
 Information Related to Forward-Looking Statements
This presentation contains “forward-looking statements” within the meaning
of the Private Securities Litigation
Information Related to Forward-Looking Statements
This presentation contains “forward-looking statements” within the meaning
of the Private Securities Litigation
Reform Act of 1995. These include statements regarding future results or expectations. Forward-looking
statements can be identified by forward-looking language, including words such as “believes,”
“anticipates,”
“expects,” “estimates,” “intends,” “may,” “plans,” “projects,” “potential,” “prospective,” “will” and similar
expressions, or the negative
of these words. Such forward-looking statements are based on facts and
conditions as they exist at the time such statements are made. Forward-looking statements are also based on
predictions as to future facts and conditions, the accurate
prediction of which may be difficult and involve the
assessment of events beyond our control. Forward-looking statements are further based on various operating
and return assumptions. Caution must be exercised in relying on forward-looking
statements. Due to known
and unknown risks, actual results may differ materially from expectations or projections.
You should carefully consider these risks when you make a decision concerning an investment
in our common
stock, along with the following factors, among others, that may cause our actual results to differ materially from
those described in any forward-looking statements: risks and uncertainties relating to the recent global
economic downturn;
changes in economic and market conditions; impacts of regulatory changes and changes
to Fannie Mae and Freddie Mac; availability of opportunities that meet or exceed our risk adjusted return
expectations, changes in interest rates; changes in anticipated
earnings and returns; our ability to maintain
adequate liquidity; increased costs of borrowing; decreased interest spreads; changes in mortgage pre-payment
speeds; risks associated with merchant banking investments; the realization of gains and losses
on principal
investments; our ability to maintain our exemption from registration as an investment company pursuant to the
Investment Company Act of 1940; our ability to generate earnings or gains and otherwise realize and protect
taxable benefits
associated with net operating loss carry-forwards and net capital loss carry-forwards; our ability
to realize continued cost savings; our ability and willingness to pay future dividends; available technologies;
competition for business and personnel;
changes in, and our ability to remain in compliance with, law,
regulations or government policies affecting our business; and the factors described in the sections entitled
“Risk Factors” in our annual report on Form 10-K for the year ended
December 31, 2008 and our other public
filings with the SEC. You should not place undue reliance on these forward-looking statements, which apply
only as of the date of this presentation. We undertake no obligation to update or
revise any forward-looking
statement, whether written or oral, relating to matters discussed in this presentation, except as may be required
by applicable securities laws.
 Arlington Asset Overview
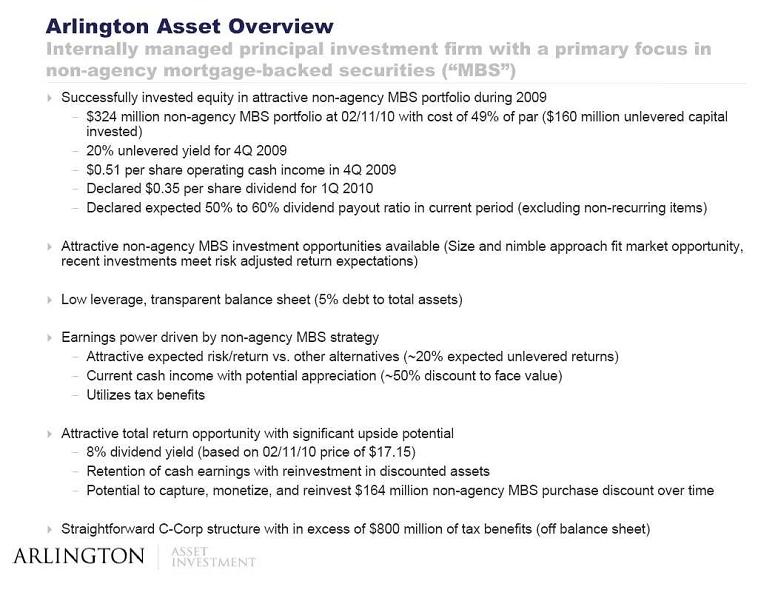
Internally managed principal
investment firm with a primary focus in
non-agency mortgage-backed securities (“MBS”)
Successfully invested equity in attractive non-agency MBS portfolio during 2009
$324 million non-agency MBS portfolio at 02/11/10 with cost of 49% of par ($160 million unlevered capital
invested)
20% unlevered yield for 4Q 2009
$0.51 per share operating cash income in 4Q 2009
Declared $0.35 per share dividend for 1Q 2010
Declared expected 50% to 60% dividend payout ratio in current period (excluding non-recurring items)
Attractive non-agency MBS investment opportunities available (Size and nimble approach fit market opportunity,
recent investments meet risk adjusted return expectations)
Low leverage, transparent balance sheet (5% debt to total assets)
Earnings power driven by non-agency MBS strategy
Attractive expected risk/return vs. other alternatives (~20% expected unlevered returns)
Current cash income with potential appreciation (~50% discount to face value)
Utilizes tax benefits
Attractive total return opportunity with significant upside potential
8% dividend yield (based on 02/11/10 price of $17.15)
Retention of cash earnings with reinvestment in discounted assets
Potential to capture, monetize, and reinvest $164 million non-agency MBS purchase discount over time
Straightforward C-Corp structure with in excess of $800 million of tax benefits (off balance sheet)
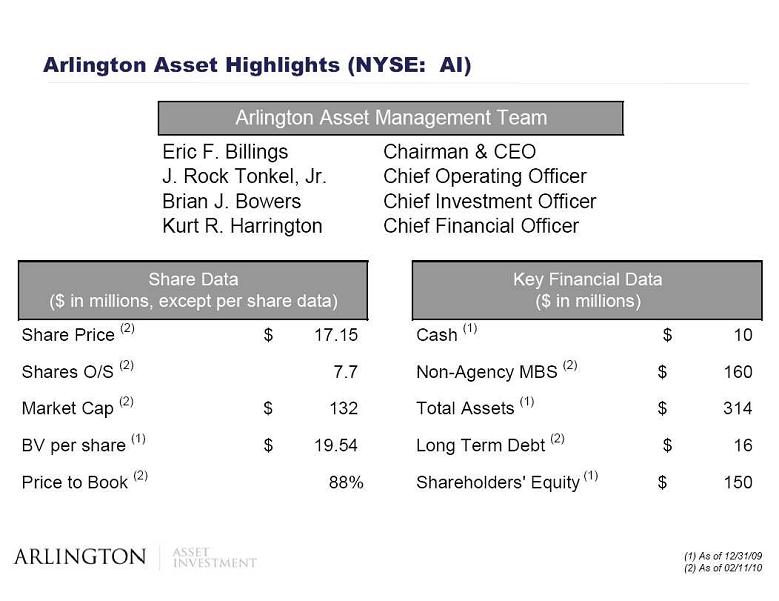 Arlington Asset Highlights (NYSE: AI)
Eric F. Billings
Chairman & CEO
J. Rock Tonkel, Jr.
Chief Operating Officer
Brian J. Bowers
Chief Investment Officer
Kurt R. Harrington
Chief Financial Officer
Arlington Asset Management Team
Share Price
(2)
17.15
$
Cash
(1)
10
$
Shares O/S
(2)
7.7
Non-Agency MBS
(2)
160
$
Market Cap
(2)
132
$
Total Assets
(1)
314
$
BV per share
(1)
19.54
$
Long Term Debt
(2)
16
$
Price to Book
(2)
88%
Shareholders' Equity
(1)
150
$
Share Data
($ in millions, except per share data)
Key Financial Data
($ in millions)
Arlington Asset Highlights (NYSE: AI)
Eric F. Billings
Chairman & CEO
J. Rock Tonkel, Jr.
Chief Operating Officer
Brian J. Bowers
Chief Investment Officer
Kurt R. Harrington
Chief Financial Officer
Arlington Asset Management Team
Share Price
(2)
17.15
$
Cash
(1)
10
$
Shares O/S
(2)
7.7
Non-Agency MBS
(2)
160
$
Market Cap
(2)
132
$
Total Assets
(1)
314
$
BV per share
(1)
19.54
$
Long Term Debt
(2)
16
$
Price to Book
(2)
88%
Shareholders' Equity
(1)
150
$
Share Data
($ in millions, except per share data)
Key Financial Data
($ in millions)
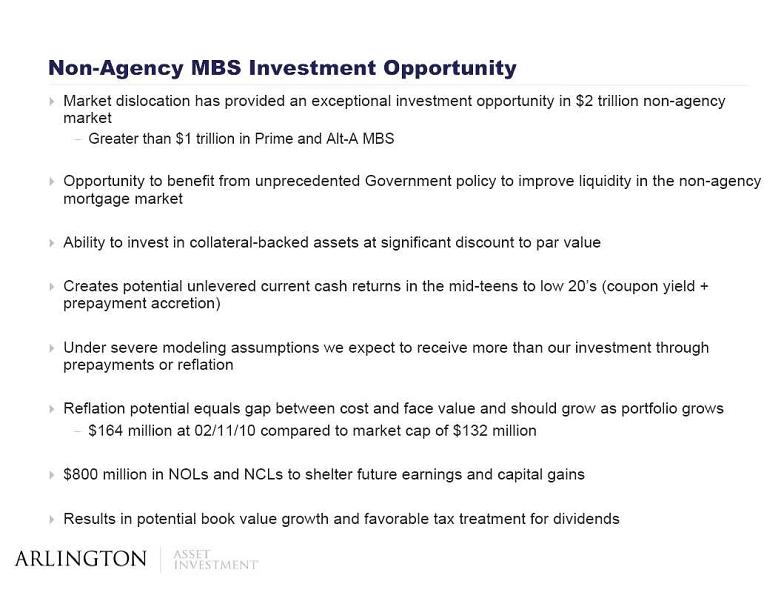 Non-Agency MBS Investment Opportunity
Market dislocation has provided an exceptional investment opportunity in $2 trillion non-agency
Non-Agency MBS Investment Opportunity
Market dislocation has provided an exceptional investment opportunity in $2 trillion non-agency
market
Greater than $1 trillion in Prime and Alt-A MBS
Opportunity to benefit from unprecedented Government policy to improve liquidity in the non-agency
mortgage market
Ability to invest in collateral-backed assets at significant discount to par value
Creates potential unlevered current cash returns in the mid-teens to low 20’s (coupon yield +
prepayment accretion)
Under severe modeling assumptions we expect to receive more than our investment through
prepayments or reflation
Reflation potential equals gap between cost and face value and should grow as portfolio grows
$164 million at 02/11/10 compared to market cap of $132 million
$800 million in NOLs and NCLs to shelter future earnings and capital gains
Results in potential book value growth and favorable tax treatment for dividends
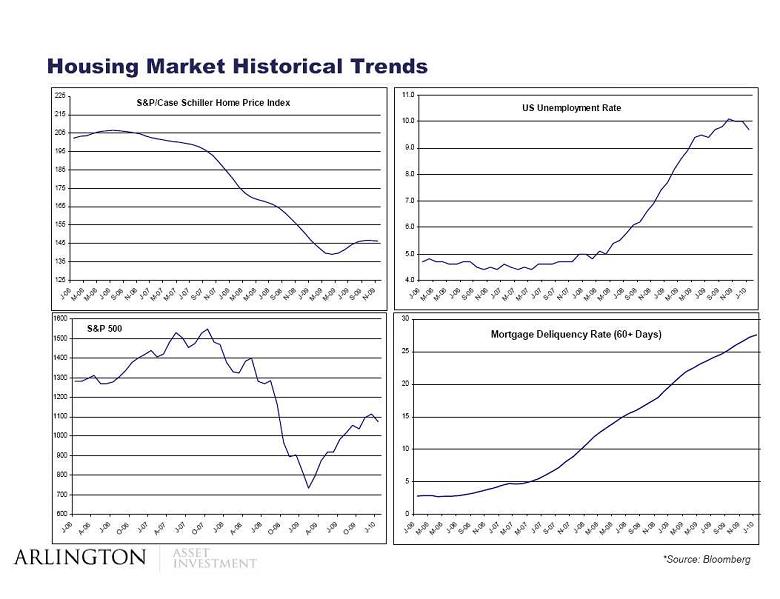 Housing Market Historical Trends
*Source: Bloomberg
S&P/Case Schiller Home Price Index
125
135
145
155
165
175
185
195
205
215
225
S&P 500
600
700
800
900
1000
1100
1200
1300
1400
1500
1600
US Unemployment Rate
4.0
5.0
6.0
7.0
8.0
9.0
10.0
11.0
Mortgage Deliquency Rate (60+ Days)
0
5
10
15
20
25
30
Housing Market Historical Trends
*Source: Bloomberg
S&P/Case Schiller Home Price Index
125
135
145
155
165
175
185
195
205
215
225
S&P 500
600
700
800
900
1000
1100
1200
1300
1400
1500
1600
US Unemployment Rate
4.0
5.0
6.0
7.0
8.0
9.0
10.0
11.0
Mortgage Deliquency Rate (60+ Days)
0
5
10
15
20
25
30
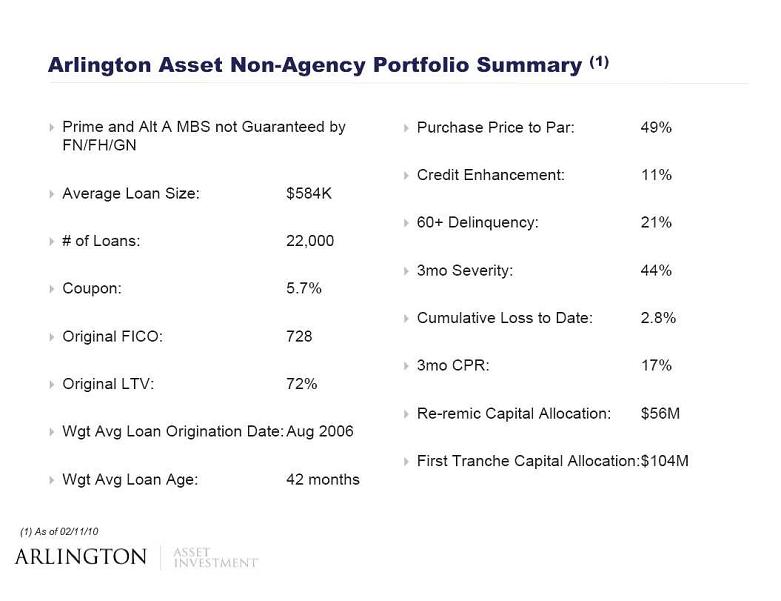 Arlington Asset Non-Agency Portfolio Summary (1)
Prime and Alt A MBS not Guaranteed by
Arlington Asset Non-Agency Portfolio Summary (1)
Prime and Alt A MBS not Guaranteed by
FN/FH/GN
Average Loan Size: $584K
# of Loans: 22,000
Coupon: 5.7%
Original FICO: 728
Original LTV: 72%
Wgt Avg Loan Origination Date: Aug 2006
Wgt Avg Loan Age: 42 months
Purchase Price to Par: 49%
Credit Enhancement: 11%
60+ Delinquency: 21%
3mo Severity: 44%
Cumulative Loss to Date: 2.8%
3mo CPR: 17%
Re-remic Capital Allocation: $56M
First Tranche Capital Allocation:$104M
(1) As of 02/11/10
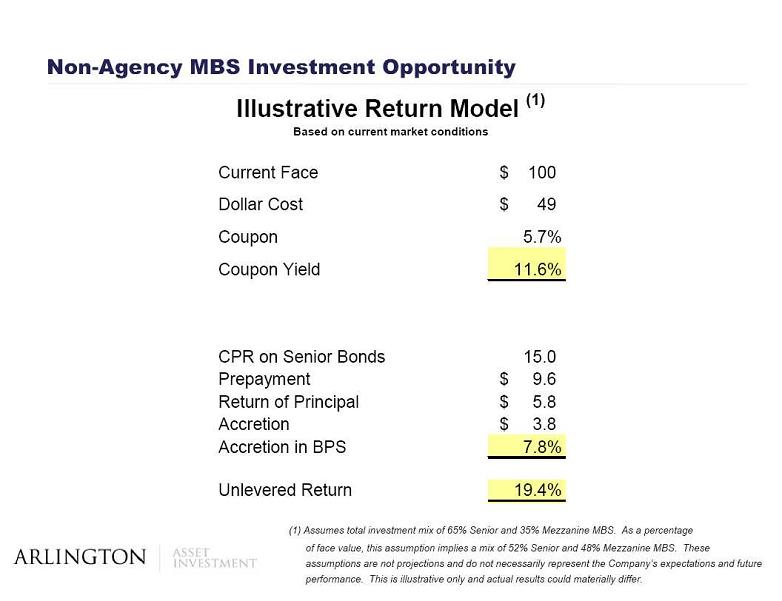 Non-Agency MBS Investment Opportunity
(1) Assumes total investment mix of 65% Senior and 35% Mezzanine MBS. As a percentage
of face value, this assumption implies a mix of 52% Senior and 48% Mezzanine
MBS. These
Non-Agency MBS Investment Opportunity
(1) Assumes total investment mix of 65% Senior and 35% Mezzanine MBS. As a percentage
of face value, this assumption implies a mix of 52% Senior and 48% Mezzanine
MBS. These
assumptions are not projections and do not necessarily represent the Company’s expectations and future
performance. This is illustrative only and actual results could materially differ.
Current Face
100
$
Dollar Cost
49
$
Coupon
5.7%
Coupon Yield
11.6%
CPR on Senior Bonds
15.0
Prepayment
9.6
$
Return of Principal
5.8
$
Accretion
3.8
$
Accretion in BPS
7.8%
Unlevered Return
19.4%
Illustrative Return Model
(1)
Based on current market conditions
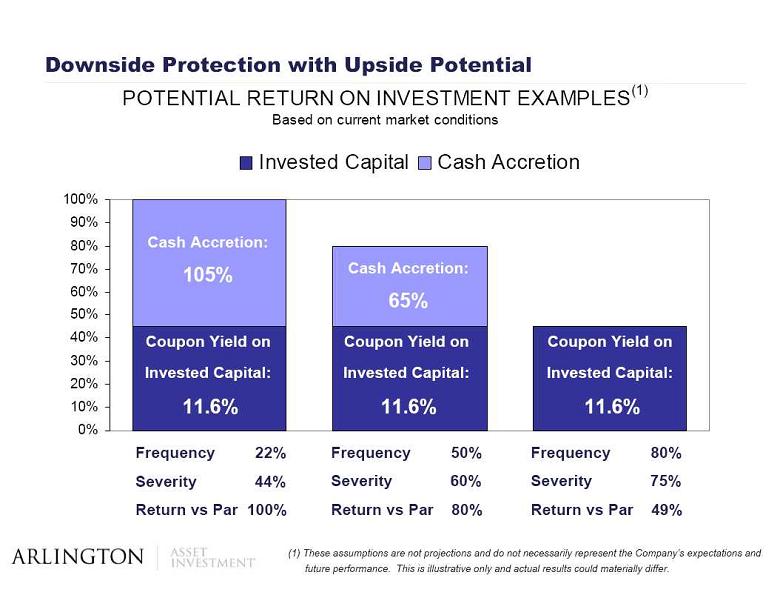 Downside Protection with Upside Potential
Frequency 22%
Severity 44%
Return vs Par 100%
Frequency 50%
Severity 60%
Return vs Par 80%
Frequency 80%
Severity 75%
Return vs Par 49%
Coupon Yield on
Invested Capital:
11.6%
Coupon Yield on
Invested Capital:
11.6%
Coupon Yield on
Invested Capital:
11.6%
Cash Accretion:
105%
Cash Accretion:
65%
(1) These assumptions are not projections and do not necessarily represent the Company’s expectations and
Downside Protection with Upside Potential
Frequency 22%
Severity 44%
Return vs Par 100%
Frequency 50%
Severity 60%
Return vs Par 80%
Frequency 80%
Severity 75%
Return vs Par 49%
Coupon Yield on
Invested Capital:
11.6%
Coupon Yield on
Invested Capital:
11.6%
Coupon Yield on
Invested Capital:
11.6%
Cash Accretion:
105%
Cash Accretion:
65%
(1) These assumptions are not projections and do not necessarily represent the Company’s expectations and
future performance. This is illustrative only and actual results could
materially differ.
POTENTIAL RETURN ON INVESTMENT EXAMPLES
(1)
Based on current market conditions
0%
10%
20%
30%
40%
50%
60%
70%
80%
90%
100%
Invested Capital
Cash Accretion
 Potential Cash Earnings Power
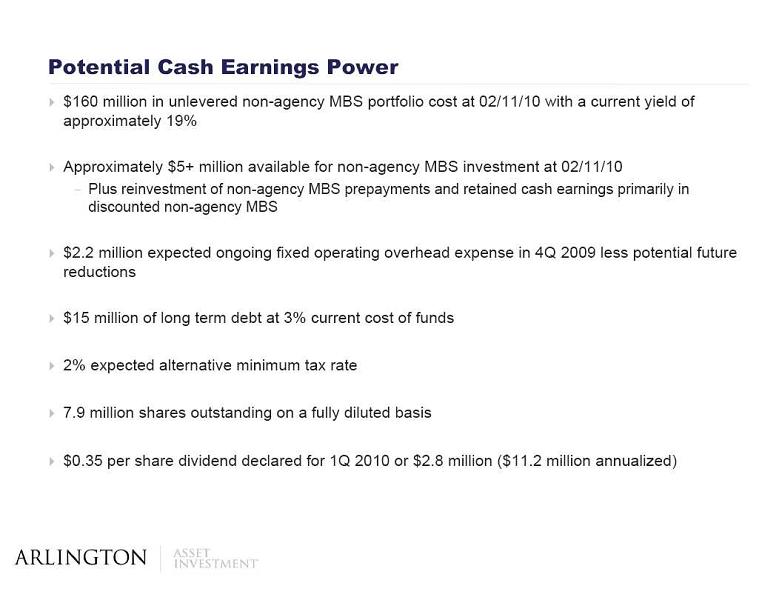
$160 million in unlevered non-agency MBS portfolio cost at 02/11/10 with a current yield of
Potential Cash Earnings Power
$160 million in unlevered non-agency MBS portfolio cost at 02/11/10 with a current yield of
approximately 19%
Approximately $5+ million available for non-agency MBS investment at 02/11/10
Plus reinvestment of non-agency MBS prepayments and retained cash earnings primarily in
discounted non-agency MBS
$2.2 million expected ongoing fixed operating overhead expense in 4Q 2009 less potential future
reductions
$15 million of long term debt at 3% current cost of funds
2% expected alternative minimum tax rate
7.9 million shares outstanding on a fully diluted basis
$0.35 per share dividend declared for 1Q 2010 or $2.8 million ($11.2 million annualized)
 Book Value Per Share with Potential Upside Opportunities
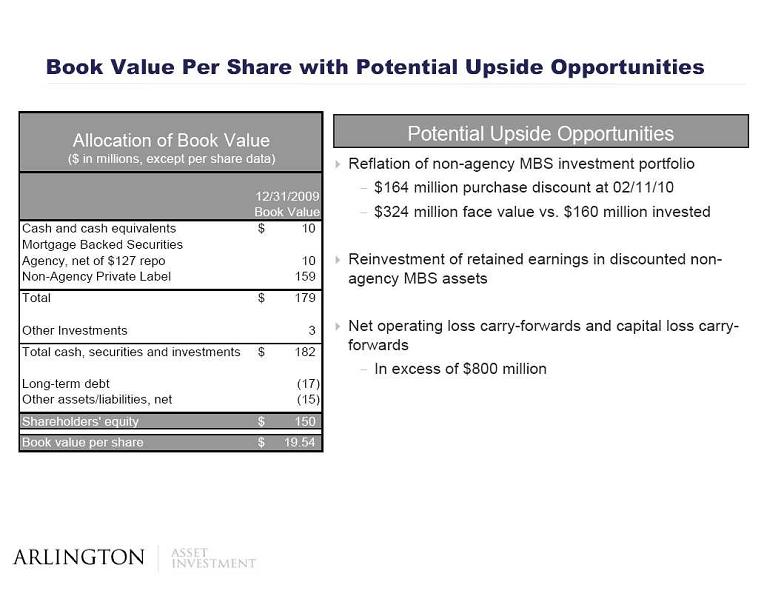
Reflation of non-agency MBS investment portfolio
$164 million purchase discount at 02/11/10
$324 million face value vs. $160 million invested
Reinvestment of retained earnings in discounted non-
Book Value Per Share with Potential Upside Opportunities
Reflation of non-agency MBS investment portfolio
$164 million purchase discount at 02/11/10
$324 million face value vs. $160 million invested
Reinvestment of retained earnings in discounted non-
agency MBS assets
Net operating loss carry-forwards and capital loss carry-
forwards
In excess of $800 million
Potential Upside Opportunities
12/31/2009
Book Value
Cash and cash equivalents
10
$
Mortgage Backed Securities
Agency, net of $127 repo
10
Non-Agency Private Label
159
Total
179
$
Other Investments
3
Total cash, securities and investments
182
$
Long-term debt
(17)
Other assets/liabilities, net
(15)
Shareholders' equity
150
$
Book value per share
19.54
$
Allocation of Book Value
($ in millions, except per share data)
 Conclusion
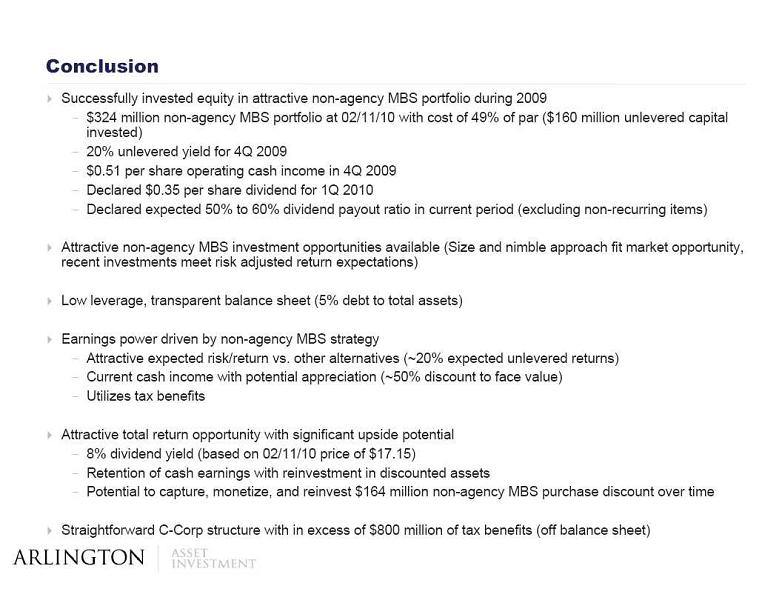
Successfully invested equity in attractive non-agency MBS portfolio during 2009
$324 million non-agency MBS portfolio at 02/11/10 with cost of 49% of par ($160 million unlevered capital
Conclusion
Successfully invested equity in attractive non-agency MBS portfolio during 2009
$324 million non-agency MBS portfolio at 02/11/10 with cost of 49% of par ($160 million unlevered capital
invested)
20% unlevered yield for 4Q 2009
$0.51 per share operating cash income in 4Q 2009
Declared $0.35 per share dividend for 1Q 2010
Declared expected 50% to 60% dividend payout ratio in current period (excluding non-recurring items)
Attractive non-agency MBS investment opportunities available (Size and nimble approach fit market opportunity,
recent investments meet risk adjusted return expectations)
Low leverage, transparent balance sheet (5% debt to total assets)
Earnings power driven by non-agency MBS strategy
Attractive expected risk/return vs. other alternatives (~20% expected unlevered returns)
Current cash income with potential appreciation (~50% discount to face value)
Utilizes tax benefits
Attractive total return opportunity with significant upside potential
8% dividend yield (based on 02/11/10 price of $17.15)
Retention of cash earnings with reinvestment in discounted assets
Potential to capture, monetize, and reinvest $164 million non-agency MBS purchase discount over time
Straightforward C-Corp structure with in excess of $800 million of tax benefits (off balance sheet)