Attached files
| file | filename |
|---|---|
| 8-K - 8-K FOR 2009 EARNINGS RELEASE - TEMPLE INLAND INC | tin8k2009earnings20100209.htm |
| EX-99.3 - INVESTOR PRESENTATION MATERIALS - TEMPLE INLAND INC | tinex99320100209.htm |
| EX-99.1 - 2009 EARNINGS RELEASE - TEMPLE INLAND INC | tinex99120100209.htm |

13
Our
job is to be the best

14
This
presentation contains “forward-looking statements” within the meaning of the
federal
securities laws. These statements reflect management’s current views with respect to future
events and are subject to risk and uncertainties. We note that a variety of factors and uncertainties
could cause our actual results to differ significantly from the results discussed in the forward-
looking statements. Factors and uncertainties that might cause such differences include, but are
not limited to: general economic, market, or business conditions; the opportunities (or lack
thereof) that may be presented to us and that we may pursue; fluctuations in costs and expenses
including the costs of raw materials, purchased energy, and freight; changes in interest rates;
demand for new housing; accuracy of accounting assumptions related to impaired assets,
pension and postretirement costs, and contingency reserves; competitive actions by other
companies; changes in laws or regulations; our ability to execute certain strategic and business
improvement initiatives; the accuracy of certain judgments and estimates concerning the
integration of acquired operations and other factors, many of which are beyond our control.
Except as required by law, we expressly disclaim any obligation to publicly revise any forward-
looking statements contained in this presentation to reflect the occurrence of events after the date
of this presentation.
This
presentation includes non-GAAP financial measures. The
required reconciliations to
GAAP financial measures are included on our website, www.templeinland.com.
GAAP financial measures are included on our website, www.templeinland.com.

15
Net
income (loss) per share
Special
items
Net
income per share
excluding
special items
special items
• Cash provided by
operations of $640 million in 2009
• Long-term debt
reduced by $482 million in 2009
|
2009 |
2008 |
|
$ 1.89
|
$ (0.08)
|
|
(1.19)
|
0.19
|
|
$ 0.70
|
$ 0.11
|
2009
Consolidated Results
16
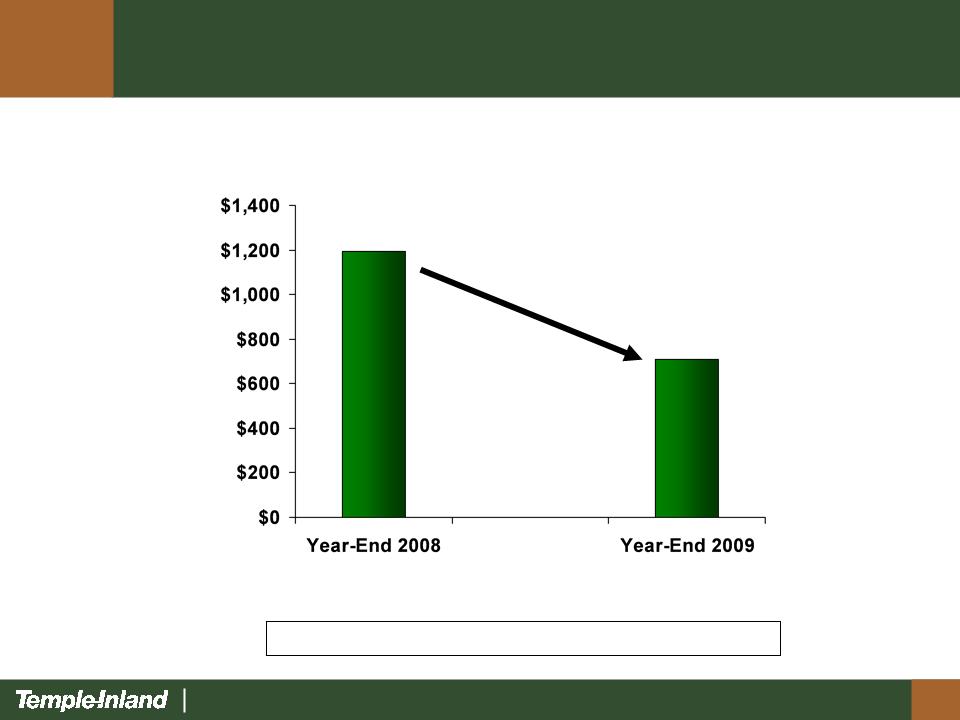
$482
$710
$1,192
Long-term
debt reduced by $482 million in 2009
2009
Long-Term Debt Reduction

17
|
|
2009
|
2008
|
|
Revenues
|
$
3,001
|
$
3,190
|
|
Costs and
expenses
|
2,654
|
2,965
|
|
Segment
operating income
|
$ 347
|
$ 225
|
($ in
Millions)
• Record annual
operating earnings
• 16.5% ROI - fourth
consecutive year of returns in excess of cost of capital
• Highest return in
peer group
Corrugated Packaging
Segment

18
($ in
Millions)
(Box
plant
transformation,
PBL and lower
mill costs)
transformation,
PBL and lower
mill costs)
(Lower
input
costs and lower
box pricing)
costs and lower
box pricing)
Corrugated Packaging
Segment Earnings

19
|
|
2009
|
2008
|
|
Revenues
|
$
576
|
$
694
|
|
Costs and
expenses
|
(603)
|
(734)
|
|
Segment
operating income (loss)
|
$ (27)
|
$ (40)
|
($ in
Millions)
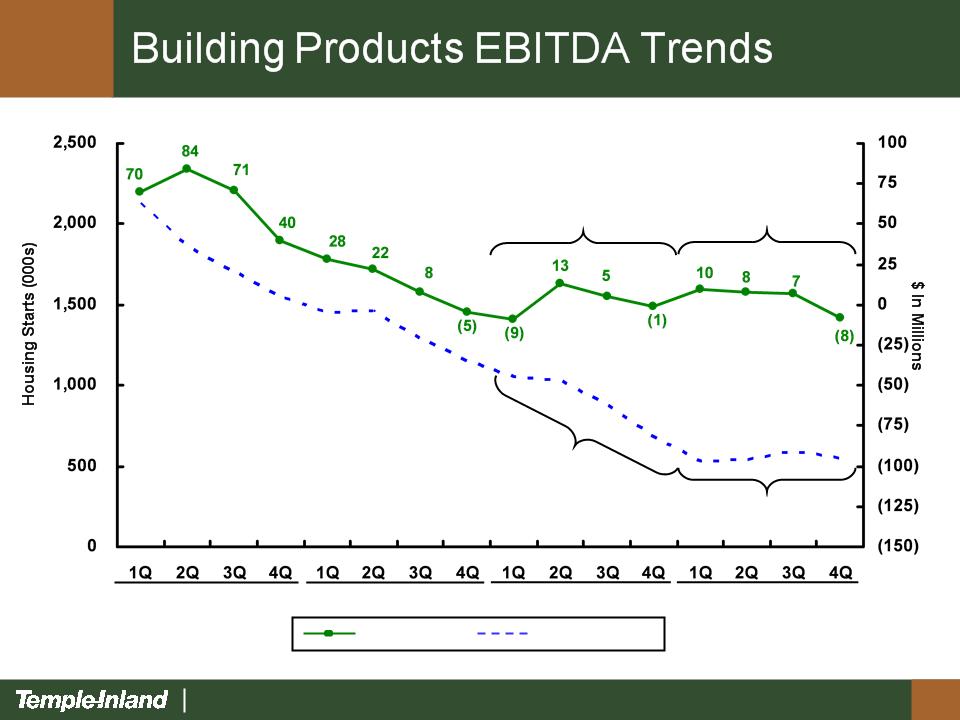
• Housing starts
declined 39% in 2009 vs. 2008
• 2009 EBITDA of $17
million, an improvement of $9 million vs. 2008
Building Products
Segment
20
Housing
Starts
TIN
EBITDA
2006
2007
2008
2,127
2009
906
554
$8
$17

21
Net
income (loss) per share
Special
items
Net
income (loss) per share
excluding
special items
special items
|
Q4
2009
|
Q4
2008
|
Q3
2009
|
|
$ 0.34
|
$
(0.06)
|
$ 0.61
|
|
(0.41)
|
0.17
|
(0.37)
|
|
$(0.07)
|
$ 0.11
|
$ 0.24
|
• Cash provided by
operations of $200 million
• Long-term debt down
$169 million
• Share-based
compensation expense increased $37 million vs. Q4 2008 and
$6 million vs. Q3 2009 due to increase in share price
$6 million vs. Q3 2009 due to increase in share price
Fourth
Quarter 2009 Consolidated Results

22
($ in
Millions)
|
|
Q4
2009
|
Q4
2008
|
Q3
2009
|
|
Revenues
|
$
715
|
$
819
|
$
734
|
|
Costs and
expenses
|
(658)
|
(751)
|
(640)
|
|
Segment
operating income
|
$ 57
|
$ 68
|
$ 94
|
• 10.8%
ROI
• Highest return in
peer group
Corrugated Packaging
Segment
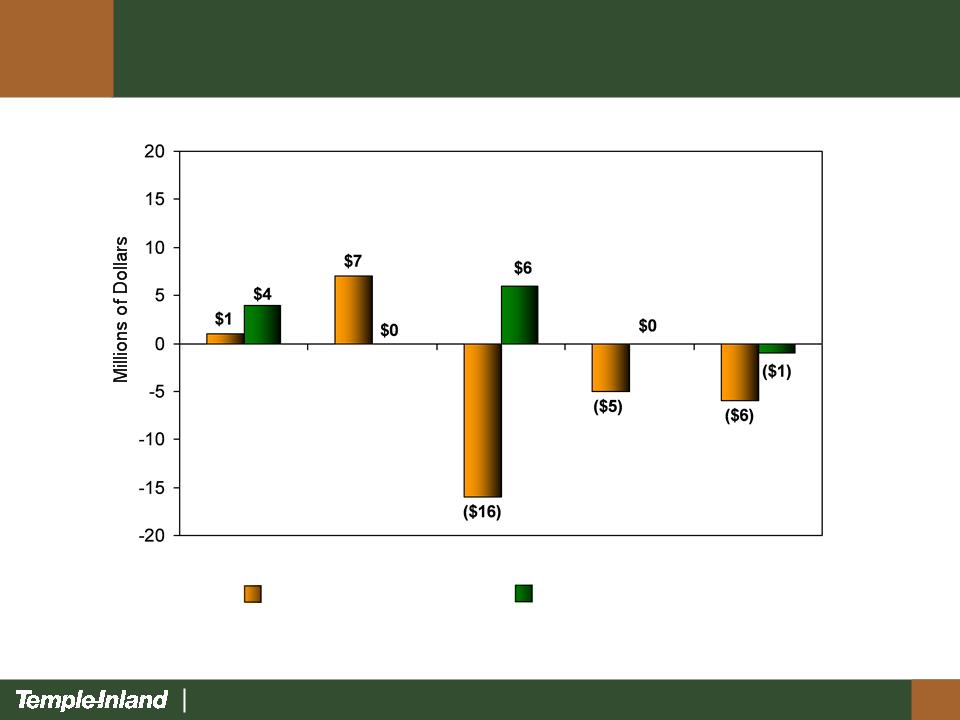
23
Q4 2009
vs. Q4 2008 Q4 2009
vs. Q3 2009
Virgin
Fiber OCC Energy Chemicals Freight
Key
Input Cost Changes

24
TIN
Average Box Price *
* Average
box price realization includes the impact of mix of business
2008
Q4 Q1 Q2 Q3 Q4
2009
Corrugated Packaging
Segment

25
Box
Shipments
*
Source: Fibre Box Association
2008
2009
Corrugated Packaging
Segment

26
Matching Production
to our Demand
• Q4 2009
downtime
– 23,000 tons
maintenance related
– 16,000 tons weather
related
• Q1 2010
– 27,000 tons
maintenance related

27
($ in
Millions)
|
|
Q4
2009
|
Q4
2008
|
Q3
2009
|
|
Revenues
|
$
130
|
$
154
|
$ 151
|
|
Costs and
expenses
|
(148)
|
(168)
|
(155)
|
|
Segment
operating income (loss)
|
$( 18)
|
$( 14)
|
$
( 4)
|
• Seasonally
adjusted
housing
starts declined 16% in Q4 2009 vs. Q4 2008
• Actual housing
starts declined 24% in Q4 2009 vs. Q3 2009
• Non-cash inventory
adjustment and asset write-offs of $4 million
Building Products
Segment

28
Lumber
Price
2008
2009
Q4 Q1 Q2 Q3 Q4
Volume
2008
2009
Q4 Q1 Q2 Q3 Q4
Building Products
Segment

29
Gypsum
Volume
2008
2009
Q4 Q1 Q2 Q3 Q4
Price
Q4 Q1
Q2 Q3 Q4
2008
2009
Building Products
Segment
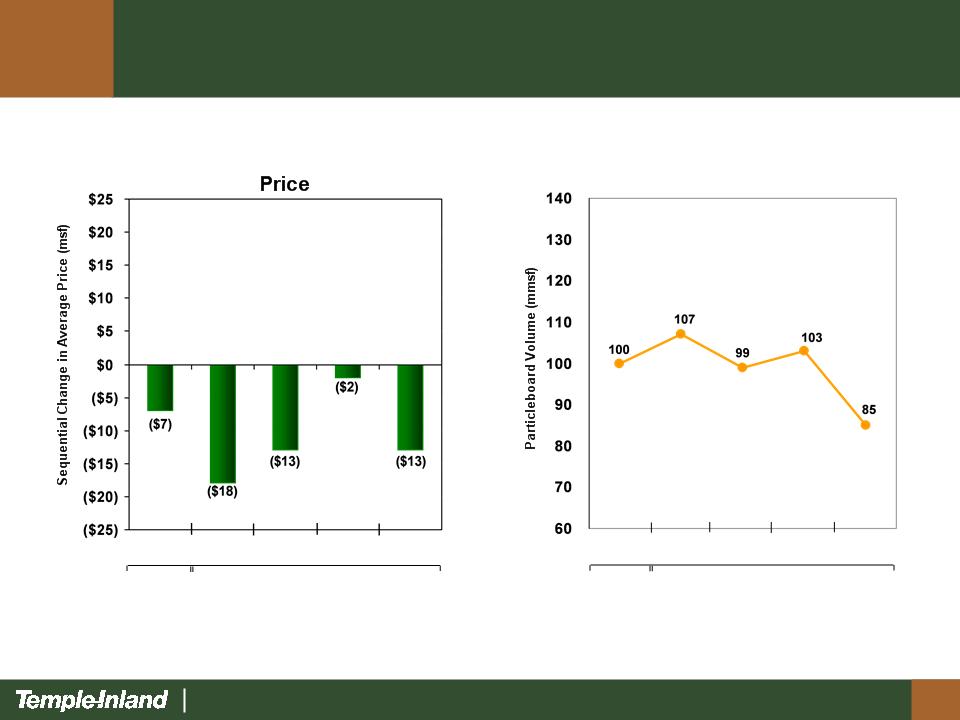
30
Particleboard
Volume
2008
2009
Q4 Q1 Q2 Q3 Q4
Q4 Q1
Q2 Q3 Q4
2008
2009
Building Products
Segment

31
2009
Fourth Quarter and Full Year
Financial Highlights
Financial Highlights
• Cash
Flow
- Cash
provided by operations $200 million in 4Q/2009 and
$640
million for the year
• Balance
Sheet
- Long-term
debt $710 million at year-end, down $482 million
vs.
year-end, 2008
• Liquidity
- Committed
credit facilities $1,075
- Unused
available borrowing capacity $890 million at
year-end
32
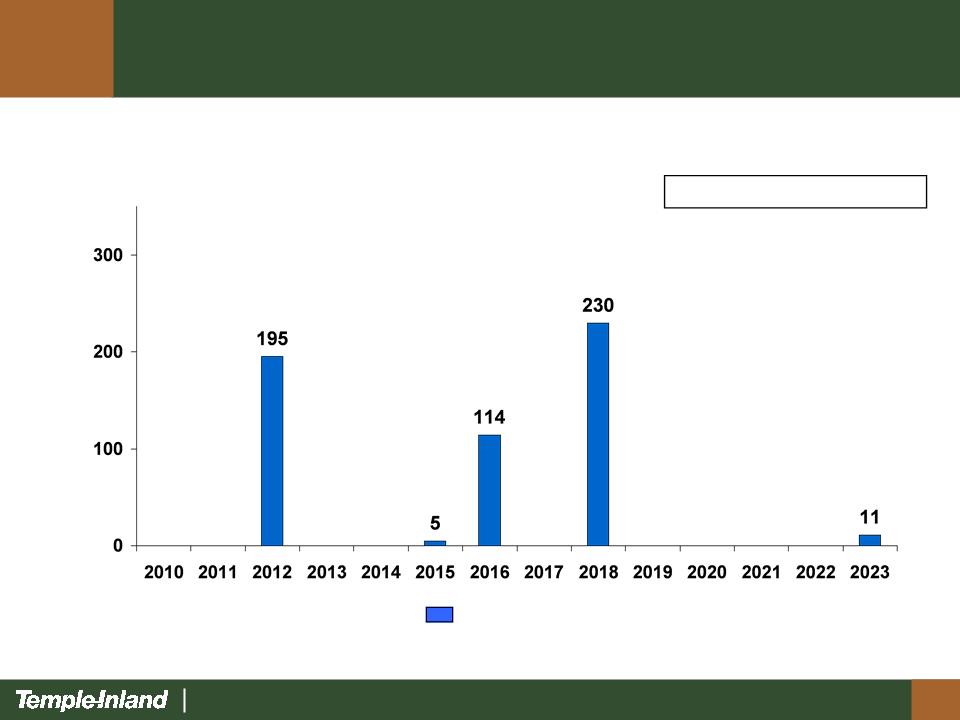
Term
debt
($ In
Millions)
Total
Term Debt = $555MM
Term
Debt Maturity Profile as of
Year-End 2009
Year-End 2009

33
($ In
Millions)
Year-End 2009
Liquidity Summary
Committed
facilities $1,075
Less: borrowings/commitments (185)
Unused
borrowing capacity $ 890
Covenants (as
specifically defined)
Debt/total
capital
43.0% 70%
max
Interest
coverage * 10.2x 3.0x
min
* Best
4 out of 5 trailing quarters

34
2009
Fourth Quarter and Full Year
Financial Highlights
Financial Highlights
• Expense related
items
– Interest expense $13
million in the fourth quarter,
down 43% vs. year ago
down 43% vs. year ago
– General &
administrative costs $70 million for 2009,
down 8% vs. year ago
down 8% vs. year ago

35
• Maintain high
integration level
• Drive for low
cost
• Improve mix and
margins
• Profitably grow
business
Corrugated Packaging
Strategic Initiatives

36
C
U
L
T
U
R
E
Lower
cost and higher margins
Corrugated Packaging
Strategic Initiatives
• Drive Low Cost and
Increase Asset
Utilization
Utilization
– Fewer
Plants
– Fewer
Machines
– Fewer
People
• Improve Mix &
Margins

37
Box
Plant Transformation I (2006-2010)
• EBIT (Lower
Costs)
$80MM/Year
– Fewer Plants
4
– Fewer Machines
88
– Fewer People
1,157
• Investment
$174MM
• ROI
46%

38
Box
Plant Transformation II (2010-2013)
• EBIT (Lower
Costs)
$100MM/Year
– Fewer Plants
12
– Fewer Machines
66
– Fewer People
917
• Investment
$250MM
• ROI
40%

39
2010
• Capital
Expenditures
- 2009 :
$130MM
- 2010 :
$200MM-$210MM
• Depreciation
- 2009 :
$200MM
- 2010 :
$198MM
• Pension
- No
required cash contribution in 2010
- Voluntary,
discretionary contribution in 2010 : $30MM
- Pension
expense in 2010 : $59MM

40
2010
• General and
administrative expenses
- 2009 :
$70MM
- 2010 :
$71 - $73MM
• Share-based and
long-term incentive compensation
- 2009 :
$58MM
- 2010 :
$32MM, $1 change in share price = $2.3 million
• Interest
expense
- 2009 :
$63MM
- 2010 :
$50 - $52 MM
• Income
tax
- 2010
effective tax rate = 39%
- 2010
remain a 20% cash tax payer

41
2010
Financial Priorities
• Return cash to
shareholders
– Maintained dividend
during 2009
– Q1 2010 dividend
increased 10% to annual
rate of $0.44 per share
rate of $0.44 per share
• Reduce
debt
• Invest in our
business
• Profitably
grow

42
Our
job is to be the best