Attached files
| file | filename |
|---|---|
| 8-K - FORM 8-K - US BANCORP \DE\ | c95649e8vk.htm |
Exhibit 99.1

| Richard K. Davis Chairman, President and CEO February 2, 2010 Morgan Stanley U.S. Financials 2010 Conference |

| 2 Forward-looking Statements and Additional Information The following information appears in accordance with the Private Securities Litigation Reform Act of 1995: This presentation contains forward-looking statements about U.S. Bancorp. Statements that are not historical or current facts, including statements about beliefs and expectations, are forward-looking statements and are based on the information available to, and assumptions and estimates made by, management as of the date made. These forward-looking statements cover, among other things, anticipated future revenue and expenses and the future plans and prospects of U.S. Bancorp. Forward-looking statements involve inherent risks and uncertainties, and important factors could cause actual results to differ materially from those anticipated. Global and domestic economies could fail to recover from the recent economic downturn or could experience another severe contraction, which could adversely affect our revenues and the values of our assets and liabilities. Global financial markets could experience a recurrence of significant turbulence, which could reduce the availability of funding to certain financial institutions and lead to a tightening of credit, a reduction of business activity, and increased market volatility. Stress in the commercial real estate markets, as well as a delay or failure of recovery in the residential real estate markets, could cause additional credit losses and deterioration in asset values. In addition, our business and financial performance could be impacted as the financial industry restructures in the current environment, by increased regulation of financial institutions or other effects of recently enacted legislation, and by changes in the competitive landscape. Our results could also be adversely affected by continued deterioration in general business and economic conditions; changes in interest rates; deterioration in the credit quality of our loan portfolios or in the value of the collateral securing those loans; deterioration in the value of securities held in our investment securities portfolio; legal and regulatory developments; increased competition from both banks and non-banks; changes in customer behavior and preferences; effects of mergers and acquisitions and related integration; effects of critical accounting policies and judgments; and management's ability to effectively manage credit risk, market risk, operational risk, legal risk, and regulatory and compliance risk. For discussion of these and other risks that may cause actual results to differ from expectations, refer to U.S. Bancorp's Annual Report on Form 10-K for the year ended December 31, 2008, on file with the Securities and Exchange Commission, including the sections entitled "Risk Factors" and "Corporate Risk Profile" contained in Exhibit 13, and all subsequent filings with the Securities and Exchange Commission under Sections 13(a), 13(c), 14 or 15(d) of the Securities Exchange Act of 1934. Forward-looking statements speak only as of the date they are made, and the Company undertakes no obligation to update them in light of new information or future events. This presentation includes non-GAAP financial measures to describe U.S. Bancorp's performance. The reconciliations of those measures to GAAP measures are provided within or in the appendix of the presentation. These disclosures should not be viewed as a substitute for operating results determined in accordance with GAAP, nor are they necessarily comparable to non-GAAP performance measures that may be presented by other companies. |

| 4Q09 Dimensions Regional Consumer and Business Banking Wealth Management National Wholesale Banking Trust Services Global Payments *As of January 29, 2010 U.S. Bancorp Businesses Asset Size $281 billion Deposits $183 billion Loans $195 billion Customers 15.8 million NYSE Traded USB Market Capitalization* $48 billion Founded 1863 Bank Branches* 3,015 ATMs 5,148 |

| U.S. Rank Company $Billions 1 Bank of America $2,223 2 J.P. Morgan 2,032 3 Citigroup 1,856 4 Wells Fargo 1,244 5 U.S. Bancorp 281 6 PNC 270 7 SunTrust 174 8 BB&T 166 9 Regions 142 10 Fifth Third 113 U.S. Rank Company $Billions 1 J.P. Morgan $154 2 Wells Fargo 147 3 Bank of America 131 4 Citigroup 95 5 U.S. Bancorp 48 6 PNC 26 7 BB&T 19 8 SunTrust 12 9 Fifth Third 10 10 M&T 9 Total Assets and Market Value Source: company reports & FactSet Assets as of 12/31/09, Market Value as of 1/29/10 Assets Market Value |

| Performance vs Peers Source: SNL, 1Q08 through 4Q09 Peer Banks: BAC, BBT, FITB, JPM, KEY, PNC, RF, STI, USB and WFC Since 1/1/08 USB Peer 1 Peer 2 Peer 3 Peer 4 Peer 5 Peer 6 Peer 7 Peer 8 Peer 9 ROA 0.0102 0.0082 0.0082 0.0079 0.0045 0.0024 USB Peer 1 Peer 2 Peer 3 Peer 4 Peer 5 Peer 6 Peer 7 Peer 8 Peer 9 ROE 0.104 0.09 0.081 0.072 0.057 0.025 USB Peer 1 Peer 2 Peer 3 Peer 4 Peer 5 Peer 6 Peer 7 Peer 8 Peer 9 EF 0.477 0.514 0.544 0.549 0.564 0.591 0.597 0.679 0.685 0.75 Return on Avg Assets Return on Avg Equity Efficiency Ratio |

| Consumer Wholesale PCTAM Payments Treas & Corp Support Revenue 44 20 10 26 0 Diversification Full year 2009, taxable-equivalent basis Excluding securities gains (losses) net 2004 2005 2006 2007 2008 2009 Fee Income 0.445 0.469 0.505 0.518 0.498 0.491 Core 0 0 0 0 0 0 Revenue Mix By Business Line Fee Income / Total Revenue Consumer 44% Payments 26% Wealth Mgmt 10% Wholesale 20% |

| Revenue Growth 4Q08 1Q09 2Q09 3Q09 4Q09 Reported 3624 3883 4159 4250 4376 Core 3839 3989 4178 4287 4534 2005 2006 2007 2008 2009 Reported 13239 13742 14060 14677 16668 $ in millions Taxable-equivalent basis Prior 5 Quarters Year-Over-Year Core Growth 4.4% 8.0% 8.2% 12.0% 18.1% Prior 5 Years Year-Over-Year Growth 3.8% 3.8% 2.3% 4.4% 13.6% USB Record Revenue 2009 Reported Core |
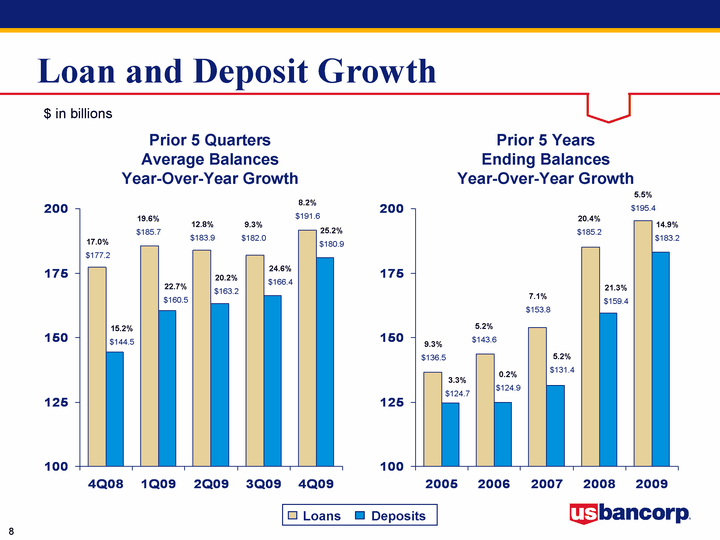
| Loan and Deposit Growth 4Q08 1Q09 2Q09 3Q09 4Q09 Loans 177.2 185.7 183.9 182 191.6 Deposits 144.5 160.5 163.2 166.4 180.9 2005 2006 2007 2008 2009 Loans 136.5 143.6 153.8 185.2 195.4 Deposits 124.7 124.9 131.4 159.4 183.2 $ in billions 8.2% $191.6 17.0% $177.2 19.6% $185.7 12.8% $183.9 9.3% $182.0 25.2% $180.9 15.2% $144.5 22.7% $160.5 20.2% $163.2 24.6% $166.4 5.5% $195.4 9.3% $136.5 5.2% $143.6 7.1% $153.8 20.4% $185.2 14.9% $183.2 3.3% $124.7 0.2% $124.9 5.2% $131.4 21.3% $159.4 Loans Deposits Prior 5 Quarters Average Balances Year-Over-Year Growth Prior 5 Years Ending Balances Year-Over-Year Growth |

| Capital Position $ in billions |

| 3Q07 4Q07 1Q08 2Q08 3Q08 4Q08 1Q09 2Q09 3Q09 4Q09 NPA $ Change 76 49 155 290 357 489 727 626 386 184 NPA % Change 0.13 0.08 0.22 0.34 0.31 0.33 0.37 0.23 0.12 0.05 3Q07 4Q07 1Q08 2Q08 3Q08 4Q08 1Q09 2Q09 3Q09 4Q09 NCO $ Change 8 26 68 103 102 134 156 141 112 69 NCO % Change 0.041884817 0.130653266 0.302222222 0.351535836 0.257575758 0.269076305 0.246835443 0.17893401 0.12056 0.07 Credit Quality $ in millions, linked quarter change * Excluding Covered Assets (assets subject to loss sharing agreements with FDIC) Change in Net Charge-offs Change in Nonperforming Assets* The Company continues to expect Net Charge-offs and Nonperforming Assets, excluding nonperforming acquired covered assets, to increase at a decreasing rate NCO $ Change (Left Scale) NCO % Change (Right Scale) NPA $ Change (Left Scale) NPA % Change (Right Scale) |

| Credit Quality - Reserves 4Q07 1Q08 2Q08 3Q08 4Q08 1Q09 2Q09 3Q09 4Q09 Allowance 2260 2243 2448 2648 3004 3575 4105 4571 4986 Provision Exceeding NCO's 0 192 200 250 635 530 466 415 278 Provision/NCO's 1 1.66 1.51 1.5 2 1.67 1.5 1.4 1.25 Allowance for Credit Losses Allowance Provision Exceeding NCO's Provision/NCO's $ in millions |
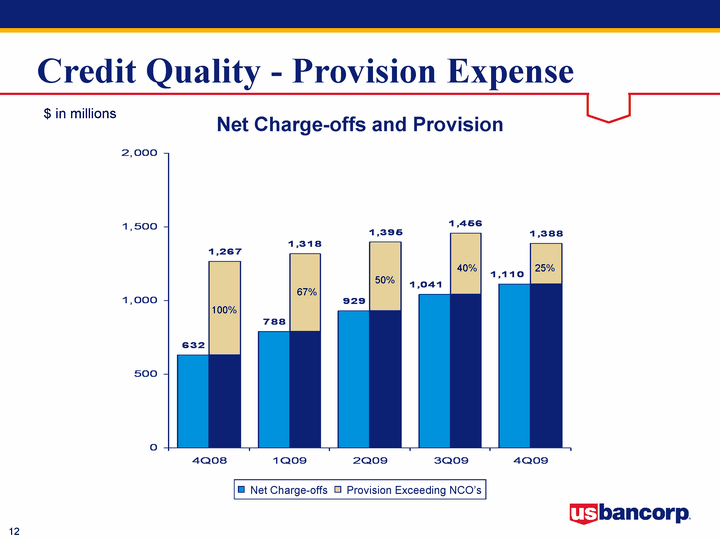
| Credit Quality - Provision Expense Net Charge-offs and Provision $ in millions 4Q08 1Q09 2Q09 3Q09 4Q09 Net Charge-offs 632 788 929 1041 1110 Reserve Build 1267 1318 1395 1456 1388 100% 67% 50% 40% 25% Net Charge-offs Provision Exceeding NCO's |

| Credit Quality - Total Loans 4Q08 1Q09 2Q09 3Q09 4Q09 Average Loans 177.2 185.7 183.9 182 191.6 Net Charge-offs Ratio 0.0142 0.0172 0.0203 0.0227 0.023 Average Loans and Net Charge-offs Ratios 4Q08 3Q09 4Q09 Allowance for credit losses as % of: Period-end loans 2.09% 2.88% 3.04% Nonperforming loans 206% 150% 153% Nonperforming assets 184% 134% 135% Nonperforming assets to loans plus ORE 1.14% 2.14% 2.25% Commercial CRE Res Mtg & Home Equity Credit Card Other Retail Covered Mix 49979 34044 45065 16399 27657 18504 Commercial $50.0 Covered $18.5 Retail Leasing & Other Retail $27.6 Credit Card $16.4 Commercial Real Estate $34.0 Residential Mortgage & Home Equity $45.1 $ in billions Key Statistics* * Excluding Covered Assets (assets subject to loss sharing agreements with FDIC) Average Loans by Type |
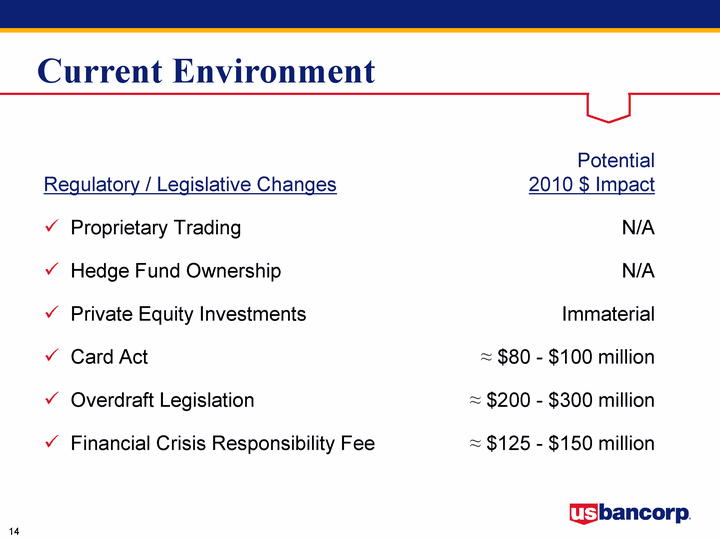
| Current Environment Potential Regulatory / Legislative Changes 2010 $ Impact Proprietary Trading N/A Hedge Fund Ownership N/A Private Equity Investments Immaterial Card Act ^ $80 - $100 million Overdraft Legislation ^ $200 - $300 million Financial Crisis Responsibility Fee ^ $125 - $150 million |

| 15 Strategic Evolution Conservative credit culture Low-cost operating model Efficient use of capital Fortress balance sheet Diversification of risk & revenue Enterprise Revenue Office PowerBank National Corporate Banking expansion Re-focused Wealth Management National Mortgage Banking expansion Brand Development / Advertising Employee engagement Deposit pricing parity Selective M&A & Joint Ventures (2001 - 2006) Strong Defense Investing for Growth (2007 - 2009) Good to Great (2010 - 2012) Conservative credit culture Low-cost operating model Efficient use of capital Fortress balance sheet Diversification of risk & revenue Enterprise Revenue Office PowerBank National Corporate Banking expansion Re-focused Wealth Management National Mortgage Banking expansion Brand Development / Advertising Employee engagement Deposit pricing parity Selective M&A & Joint Ventures Investing in infrastructure and talent Achieving relevant scale Differentiating on customer experience Conservative credit culture Low-cost operating model Efficient use of capital Fortress balance sheet Diversification of risk & revenue Expense Driven Flight-to-Quality Organic Market Share Gain |

| Acquisitions Since 2008 Consumer Wholesale PCTAM Payments Revenue 44 20 10 26 Payments Merchant processing portfolio of Citizens National Bank Credit card portfolios from Citi Merchant processing portfolio of MB Financial Bank Credit card portfolio of Town North Bank ATM-related services of Palm Desert National Bank Merchant processing portfolio of Capital City Bank Southern DataComm Numerous small portfolios Integration Bank / FDIC assisted Status Banking subsidiaries On Schedule of FBOP Corporation BB&T's Nevada Completed banking operations First Bank of Idaho Completed Downey Savings Competed & Loan Association PFF Bank & Trust Completed Mellon 1st Business Bank Completed Trust Businesses Bond trustee business of First Citizens bank Mutual fund servicing division of Fiduciary Management, Inc Corporate Trust business of AmeriServ Financial Consumer Wealth Mgmt Wholesale Payments |
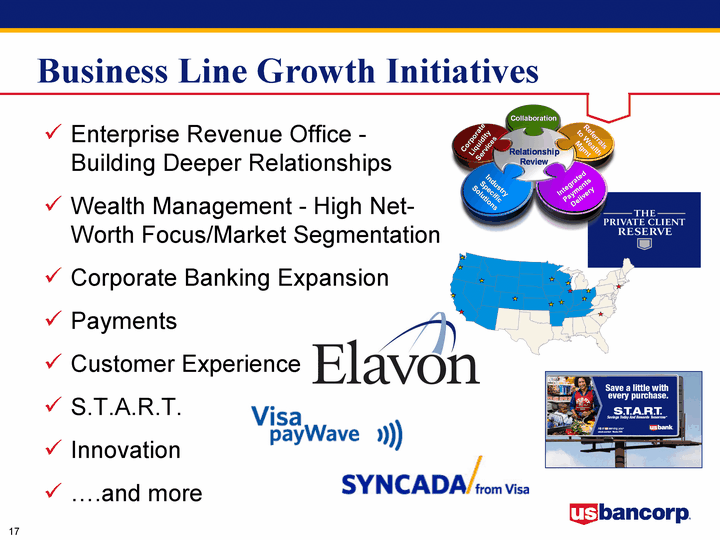
| Enterprise Revenue Office - Building Deeper Relationships Wealth Management - High Net- Worth Focus/Market Segmentation Corporate Banking Expansion Payments Customer Experience S.T.A.R.T. Innovation ....and more Business Line Growth Initiatives |
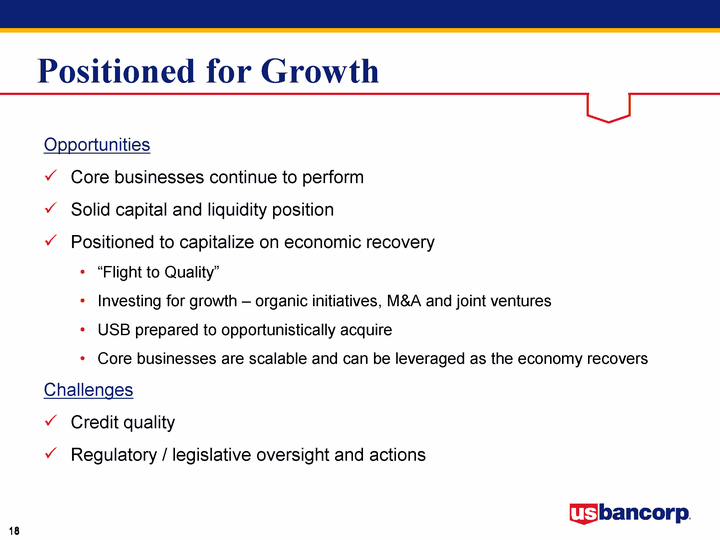
| 18 Positioned for Growth Opportunities Core businesses continue to perform Solid capital and liquidity position Positioned to capitalize on economic recovery "Flight to Quality" Investing for growth - organic initiatives, M&A and joint ventures USB prepared to opportunistically acquire Core businesses are scalable and can be leveraged as the economy recovers Challenges Credit quality Regulatory / legislative oversight and actions |

| 19 U.S. Bancorp |

| Richard K. Davis Chairman, President and CEO February 2, 2010 Morgan Stanley U.S. Financials 2010 Conference |

| Appendix |
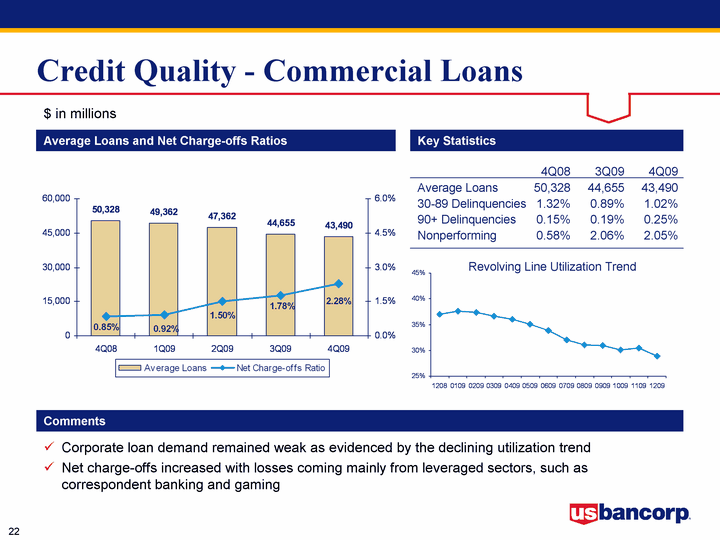
| Credit Quality - Commercial Loans 4Q08 1Q09 2Q09 3Q09 4Q09 Average Loans 50328 49362 47362 44655 43490 Net Charge-offs Ratio 0.0085 0.0092 0.015 0.0178 0.0228 Average Loans and Net Charge-offs Ratios Key Statistics Comments Corporate loan demand remained weak as evidenced by the declining utilization trend Net charge-offs increased with losses coming mainly from leveraged sectors, such as correspondent banking and gaming 4Q08 3Q09 4Q09 Average Loans 50,328 44,655 43,490 30-89 Delinquencies 1.32% 0.89% 1.02% 90+ Delinquencies 0.15% 0.19% 0.25% Nonperforming 0.58% 2.06% 2.05% 1208 0109 0209 0309 0409 0509 0609 0709 0809 0909 1009 1109 1209 Utilization 0.3705 0.3757 0.374 0.3662 0.3602 0.3507 0.3382 0.3201 0.311 0.3095 0.3007 0.3043 0.2883 Revolving Line Utilization Trend $ in millions |
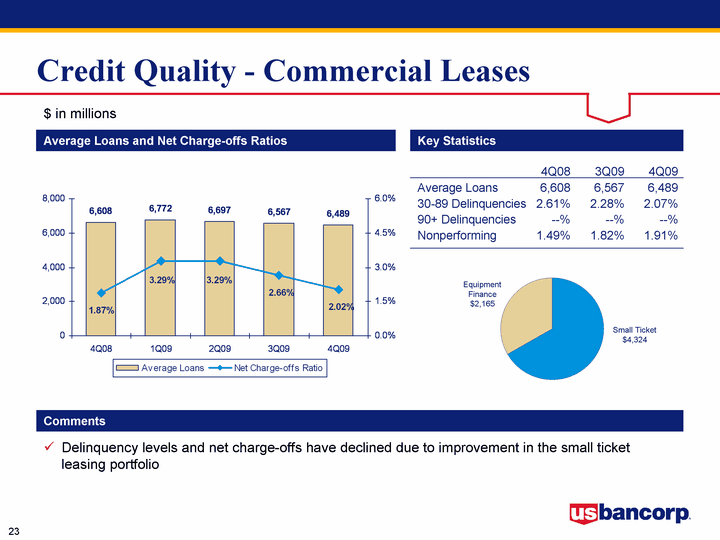
| Credit Quality - Commercial Leases 4Q08 1Q09 2Q09 3Q09 4Q09 Average Loans 6608 6772 6697 6567 6489 Net Charge-offs Ratio 0.0187 0.0329 0.0329 0.0266 0.0202 Average Loans and Net Charge-offs Ratios Key Statistics Comments Delinquency levels and net charge-offs have declined due to improvement in the small ticket leasing portfolio 4Q08 3Q09 4Q09 Average Loans 6,608 6,567 6,489 30-89 Delinquencies 2.61% 2.28% 2.07% 90+ Delinquencies --% --% --% Nonperforming 1.49% 1.82% 1.91% $ in millions EF ST Mix 2165 4324 Equipment Finance $2,165 Small Ticket $4,324 |

| Credit Quality - CRE Mortgages 4Q08 1Q09 2Q09 3Q09 4Q09 Average Loans 22967 23553 23875 24296 24895 Net Charge-offs Ratio 0.0024 0.0022 0.0047 0.0049 0.0048 Average Loans and Net Charge-offs Ratios Key Statistics Comments Average loans increased 2.5% on a linked quarter basis and increased 8.4% over 4Q08 due to the lack of permanent financing previously available in the CMBS market 4Q08 3Q09 4Q09 Average Loans 22,967 24,296 24,895 30-89 Delinquencies 0.83% 0.95% 1.08% 90+ Delinquencies --% 0.01% --% Nonperforming 1.25% 2.04% 2.30% Investor Owner Mix 13948 10947 Investor $13,948 Owner Occupied $10,947 $ in millions |

| Credit Quality - CRE Construction 4Q08 1Q09 2Q09 3Q09 4Q09 Average Loans 9691 9845 9852 9533 9149 Net Charge-offs Ratio 0.0259 0.0482 0.0379 0.0662 0.0624 Average Loans and Net Charge-offs Ratios Key Statistics Comments Residential construction has declined from $4.7 billion in 3Q07 to $2.3 billion in 4Q09, which includes $0.6 billion in condominium exposure Net charge-offs remain elevated at 6.24%, reflecting market value declines in both commercial and residential construction properties 4Q08 3Q09 4Q09 Average Loans 9,691 9,533 9,149 30-89 Delinquencies 4.33% 2.30% 2.67% 90+ Delinquencies 0.36% 0.39% 0.07% Nonperforming 7.98% 13.30% 13.57% Multi-family $2,126 Other $1,255 Office $986 A&D Construction $1,077 Retail $1,389 Condo Construction $627 Residential Construction $1,689 $ in millions Multi-Family Retial Res Construction Condo Construction A&D Commercial Office Other Mix 2126 1389 1689 627 1077 986 1255 |

| 4Q08 1Q09 2Q09 3Q09 4Q09 Restructured 813 1129 1289 1338 1354 Credit Quality - Residential Mortgage 4Q08 1Q09 2Q09 3Q09 4Q09 Average Loans 23430 23915 23964 24405 25621 Net Charge-offs Ratio 0.0143 0.0154 0.0194 0.021 0.0237 Average Loans and Net Charge-offs Ratios Key Statistics Comments Continue to actively work with customers to modify loans for borrowers who are having financial difficulties Began participating in HAMP program in September 2009, now at 26% of active trial modifications as a percent of eligible modifications 4Q08 3Q09 4Q09 Average Loans 23,430 24,405 25,621 30-89 Delinquencies 2.27% 2.39% 2.36% 90+ Delinquencies 1.55% 2.32% 2.80% Nonperforming 0.89% 1.54% 1.79% Residential Mortgage Restructured Loans $ in millions |

| Credit Quality - Home Equity 4Q08 1Q09 2Q09 3Q09 4Q09 Average Loans 18691 19215 19314 19368 19444 Net Charge-offs Ratio 0.0111 0.0148 0.0172 0.0182 0.0196 Average Loans and Net Charge-offs Ratios Key Statistics Comments Demand is weak for home equity products High quality traditional portfolio (branch and private client originated) has performed well in declining home value environment 4Q08 3Q09 4Q09 Average Loans 18,691 19,368 19,444 30-89 Delinquencies 0.89% 1.00% 0.93% 90+ Delinquencies 0.55% 0.78% 0.78% Nonperforming 0.07% 0.13% 0.17% Traditional Consumer Finance Mix 87 13 Traditional: 87% Wtd Avg LTV: 71% NCO: 1.29% Consumer Finance: 13% Wtd Avg LTV: 83% NCO: 6.56% $ in millions |

| 4Q08 3Q09 4Q09 Average Loans 12,976 15,387 16,399 30-89 Delinquencies 2.73% 2.58% 2.38% 90+ Delinquencies 2.20% 2.41% 2.59% Nonperforming 0.50% 0.77% 0.84% Credit Quality - Credit Card 4Q08 1Q09 2Q09 3Q09 4Q09 Average Loans 12976 13597 14329 15387 16399 Net Charge-offs Ratio 0.0518 0.0632 0.0736 0.0699 0.0689 Average Loans and Net Charge-offs Ratios Key Statistics Comments Excluding acquired portfolios, net charge-offs of 7.46% increased modestly from 7.30% in prior quarter Average loans have grown 6.6% on a linked quarter basis and 26.4% over 4Q08 due to new accounts, balance growth initiatives and portfolio acquisitions $ in millions Impact of Acquired Portfolios Net Charge-off Ratio 4Q08 3Q09 4Q09 As Reported 5.18% 6.99% 6.89% Excluding Acquired* 5.18% 7.30% 7.46% * Excluding portfolio purchases where the acquired loans were recorded at fair value at the purchase date |
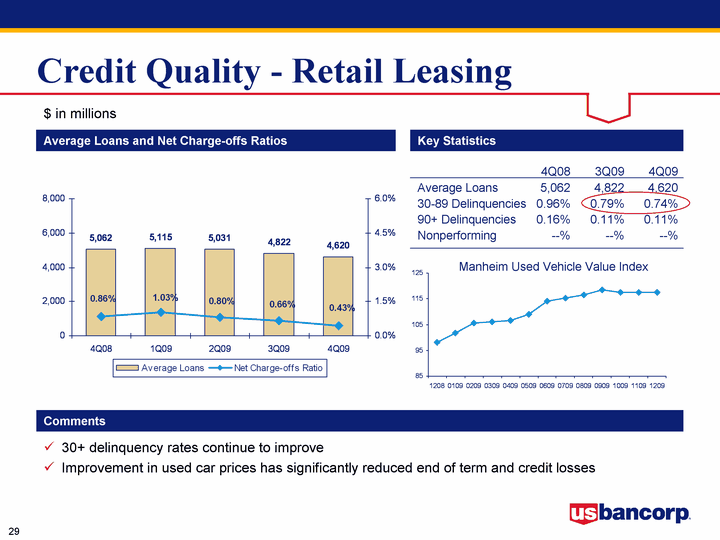
| Credit Quality - Retail Leasing 4Q08 1Q09 2Q09 3Q09 4Q09 Average Loans 5062 5115 5031 4822 4620 Net Charge-offs Ratio 0.0086 0.0103 0.008 0.0066 0.0043 Average Loans and Net Charge-offs Ratios Key Statistics Comments 30+ delinquency rates continue to improve Improvement in used car prices has significantly reduced end of term and credit losses 4Q08 3Q09 4Q09 Average Loans 5,062 4,822 4,620 30-89 Delinquencies 0.96% 0.79% 0.74% 90+ Delinquencies 0.16% 0.11% 0.11% Nonperforming --% --% --% $ in millions 1208 0109 0209 0309 0409 0509 0609 0709 0809 0909 1009 1109 1209 Index 98 101.7 105.5 106.1 106.6 109.1 114.1 115.4 116.4 118.5 117.4 117.4 117.5 Manheim Used Vehicle Value Index |

| Credit Quality - Other Retail 4Q08 1Q09 2Q09 3Q09 4Q09 Average Loans 22247 22987 22753 22647 23037 Net Charge-offs Ratio 0.017 0.0175 0.018 0.0194 0.0191 Average Loans and Net Charge-offs Ratios Key Statistics Comments Average loans have grown 1.7% linked quarter basis and 3.6% over 4Q08 on strong growth in revolving credit and student lending portfolios Auto loan portfolio loss rate declined to 1.17% in 4Q09, down from 1.28% in 3Q09 and 1.47% in 4Q08 4Q08 3Q09 4Q09 Average Loans 22,247 22,647 23,037 30-89 Delinquencies 1.13% 1.13% 1.10% 90+ Delinquencies 0.36% 0.37% 0.40% Nonperforming 0.05% 0.10% 0.13% Auto Install Studend Revolving Mix 9476 5506 4580 3475 Installment $5,506 Auto Loans $9,476 Revolving Credit $3,475 Student Lending $4,580 $ in millions |

| Non-Regulatory Capital Ratios $ in millions |

| Richard K. Davis Chairman, President and CEO February 2, 2010 Morgan Stanley U.S. Financials 2010 Conference |
