Attached files
| file | filename |
|---|---|
| 8-K - FORM 8-K - MEDIA GENERAL INC | d8k.htm |
| EX-99.1 - EXHIBIT 99.1 - MEDIA GENERAL INC | dex991.htm |
| EX-23.1 - EXHIBIT 23.1 - MEDIA GENERAL INC | dex231.htm |
| EX-23.2 - EXHIBIT 23.2 - MEDIA GENERAL INC | dex232.htm |
| EX-99.4 - EXHIBIT 99.4 - MEDIA GENERAL INC | dex994.htm |
| EX-99.8 - EXHIBIT 99.8 - MEDIA GENERAL INC | dex998.htm |
| EX-99.2 - EXHIBIT 99.2 - MEDIA GENERAL INC | dex992.htm |
| EX-99.3 - EXHIBIT 99.3 - MEDIA GENERAL INC | dex993.htm |
| EX-99.7 - EXHIBIT 99.7 - MEDIA GENERAL INC | dex997.htm |
| EX-99.5 - EXHIBIT 99.5 - MEDIA GENERAL INC | dex995.htm |
| EX-99.6 - EXHIBIT 99.6 - MEDIA GENERAL INC | dex996.htm |
| EX-99.10 - EXHIBIT 99.10 - MEDIA GENERAL INC | dex9910.htm |
Exhibit 99.9
MEDIA GENERAL, INC.
TABLE OF CONTENTS
June 28, 2009
| Page | ||||
| Part I. Financial Information |
||||
| Item 1. |
Financial Statements |
|||
| Consolidated Condensed Balance Sheets – June 28, 2009 and December 28, 2008 |
2 | |||
| Consolidated Condensed Statements of Operations – Three and six months ended June 28, 2009 and June 29, 2008 |
4 | |||
| Consolidated Condensed Statements of Cash Flows – Six months ended June 28, 2009 and June 29, 2008 |
5 | |||
| Notes to Consolidated Condensed Financial Statements |
6 | |||
| Item 2. |
Management’s Discussion and Analysis of Financial Condition and Results of Operations |
14 | ||
1
PART I - FINANCIAL INFORMATION
| Item 1. | Financial Statements |
MEDIA GENERAL, INC.
CONSOLIDATED CONDENSED BALANCE SHEETS
(Unaudited)
(000’s except shares)
| June 28, 2009 |
December 28, 2008 | |||||
| ASSETS |
||||||
| Current assets: |
||||||
| Cash and cash equivalents |
$ | 5,750 | $ | 7,142 | ||
| Accounts receivable - net |
85,464 | 102,174 | ||||
| Inventories |
7,650 | 12,035 | ||||
| Other |
26,258 | 38,849 | ||||
| Assets of discontinued operations |
214 | 12,402 | ||||
| Total current assets |
125,336 | 172,602 | ||||
| Other assets |
39,051 | 41,287 | ||||
| Property, plant and equipment - net |
435,536 | 453,627 | ||||
| FCC licenses and other intangibles - net |
241,680 | 245,266 | ||||
| Excess of cost over fair value of net identifiable assets of acquired businesses |
421,318 | 421,470 | ||||
| $ | 1,262,921 | $ | 1,334,252 | |||
See accompanying notes.
2
MEDIA GENERAL, INC.
CONSOLIDATED CONDENSED BALANCE SHEETS
(Unaudited)
(000’s except shares and per share data)
| June 28, 2009 |
December 28, 2008 |
|||||||
| LIABILITIES AND STOCKHOLDERS’ EQUITY |
||||||||
| Current liabilities: |
||||||||
| Accounts payable |
$ | 26,494 | $ | 41,365 | ||||
| Accrued expenses and other liabilities |
67,494 | 86,291 | ||||||
| Liabilities of discontinued operations |
82 | 3,053 | ||||||
| Total current liabilities |
94,070 | 130,709 | ||||||
| Long-term debt |
711,458 | 730,049 | ||||||
| Retirement, post-retirement and post-employment plans |
188,872 | 251,175 | ||||||
| Other liabilities and deferred credits |
56,111 | 67,092 | ||||||
| Stockholders’ equity: |
||||||||
| Preferred stock ($5 cumulative convertible), par value $5 per share, authorized 5,000,000 shares; none outstanding |
||||||||
| Common stock, par value $5 per share: |
||||||||
| Class A, authorized 75,000,000 shares; issued 22,282,393 and 22,250,130 shares |
111,412 | 111,251 | ||||||
| Class B, authorized 600,000 shares; issued 551,881 shares |
2,759 | 2,759 | ||||||
| Additional paid-in capital |
22,758 | 21,934 | ||||||
| Accumulated other comprehensive loss |
(131,276 | ) | (188,139 | ) | ||||
| Retained earnings |
206,757 | 207,422 | ||||||
| Total stockholders’ equity |
212,410 | 155,227 | ||||||
| $ | 1,262,921 | $ | 1,334,252 | |||||
See accompanying notes.
3
MEDIA GENERAL, INC.
CONSOLIDATED CONDENSED STATEMENTS OF OPERATIONS
(Unaudited)
(000’s except for per share data)
| Three Months Ended | Six Months Ended | |||||||||||||||
| June 28, 2009 |
June 29, 2008 |
June 28, 2009 |
June 29, 2008 |
|||||||||||||
| Revenues |
||||||||||||||||
| Publishing |
$ | 89,305 | $ | 111,924 | $ | 179,037 | $ | 224,136 | ||||||||
| Broadcasting |
64,124 | 81,851 | 123,977 | 156,068 | ||||||||||||
| Digital media and other |
9,958 | 10,477 | 19,506 | 18,034 | ||||||||||||
| Total revenues |
163,387 | 204,252 | 322,520 | 398,238 | ||||||||||||
| Operating costs: |
||||||||||||||||
| Employee compensation |
73,587 | 102,609 | 160,151 | 204,991 | ||||||||||||
| Production |
39,527 | 48,055 | 83,129 | 96,390 | ||||||||||||
| Selling, general and administrative |
21,559 | 27,259 | 46,770 | 56,483 | ||||||||||||
| Depreciation and amortization |
15,057 | 19,023 | 30,375 | 37,349 | ||||||||||||
| Goodwill and other assets impairment |
— | 778,318 | — | 778,318 | ||||||||||||
| Gain on insurance recovery |
— | (2,750 | ) | — | (2,750 | ) | ||||||||||
| Total operating costs |
149,730 | 972,514 | 320,425 | 1,170,781 | ||||||||||||
| Operating income (loss) |
13,657 | (768,262 | ) | 2,095 | (772,543 | ) | ||||||||||
| Other income (expense): |
||||||||||||||||
| Interest expense |
(11,257 | ) | (10,548 | ) | (21,229 | ) | (22,837 | ) | ||||||||
| Impairment of and loss on investments |
(209 | ) | (5,940 | ) | (209 | ) | (5,961 | ) | ||||||||
| Other, net |
166 | 305 | 409 | 513 | ||||||||||||
| Total other expense |
(11,300 | ) | (16,183 | ) | (21,029 | ) | (28,285 | ) | ||||||||
| Income (loss) from continuing operations before income taxes |
2,357 | (784,445 | ) | (18,934 | ) | (800,828 | ) | |||||||||
| Income tax benefit |
(10,955 | ) | (250,955 | ) | (10,955 | ) | (257,567 | ) | ||||||||
| Income (loss) from continuing operations |
13,312 | (533,490 | ) | (7,979 | ) | (543,261 | ) | |||||||||
| Discontinued operations |
||||||||||||||||
| Income from discontinued operations (net of taxes) |
156 | 1,278 | 194 | 2,094 | ||||||||||||
| Loss related to divestiture of operations (net of taxes) |
7,120 | — | 7,120 | (11,300 | ) | |||||||||||
| Net income (loss) |
$ | 20,588 | $ | (532,212 | ) | $ | (665 | ) | $ | (552,467 | ) | |||||
| Net Income (loss) per common share: |
||||||||||||||||
| Income (loss) from continuing operations |
$ | 0.57 | $ | (24.18 | ) | $ | (0.36 | ) | $ | (24.60 | ) | |||||
| Discontinued operations |
0.33 | 0.06 | 0.33 | (0.42 | ) | |||||||||||
| Net income (loss) |
$ | 0.90 | $ | (24.12 | ) | $ | (0.03 | ) | $ | (25.02 | ) | |||||
| Net Income (loss) per common share – assuming dilution: |
||||||||||||||||
| Income (loss) from continuing operations |
$ | 0.57 | $ | (24.18 | ) | $ | (0.36 | ) | $ | (24.60 | ) | |||||
| Discontinued operations |
0.33 | 0.06 | 0.33 | (0.42 | ) | |||||||||||
| Net income (loss) |
$ | 0.90 | $ | (24.12 | ) | $ | (0.03 | ) | $ | (25.02 | ) | |||||
| Dividends paid per common share |
$ | — | $ | 0.23 | $ | — | $ | 0.46 | ||||||||
See accompanying notes.
4
MEDIA GENERAL, INC.
CONSOLIDATED CONDENSED STATEMENTS OF CASH FLOWS
(Unaudited)
(000’s)
| Six Months Ended | ||||||||
| June 28, 2009 |
June 29, 2008 |
|||||||
| Operating activities: |
||||||||
| Net loss |
$ | (665 | ) | $ | (552,467 | ) | ||
| Adjustments to reconcile net loss: |
||||||||
| Depreciation and amortization |
30,383 | 37,735 | ||||||
| Deferred income taxes |
— | (262,301 | ) | |||||
| Impairment of and loss on investments |
209 | 5,961 | ||||||
| Goodwill and other asset impairment |
— | 778,318 | ||||||
| Net (gain) loss related to divestiture of operations |
(7,120 | ) | 11,300 | |||||
| Gain on insurance recovery |
— | (2,750 | ) | |||||
| Change in assets and liabilities: |
||||||||
| Accounts receivable and inventories |
21,354 | 23,472 | ||||||
| Accounts payable, accrued expenses, and other liabilities |
(23,621 | ) | (7,729 | ) | ||||
| Retirement plan contribution |
(5,000 | ) | — | |||||
| Intraperiod tax allocation |
(6,619 | ) | — | |||||
| Other |
(5,658 | ) | 6,349 | |||||
| Net cash provided by operating activities |
3,263 | 37,888 | ||||||
| Investing activities: |
||||||||
| Capital expenditures |
(7,978 | ) | (12,446 | ) | ||||
| Proceeds from sales of discontinued operations and investment |
16,942 | 76,665 | ||||||
| Collection (funding) of receivable note |
5,000 | (5,000 | ) | |||||
| Purchase of businesses |
— | (22,536 | ) | |||||
| Other, net |
(219 | ) | 555 | |||||
| Net cash provided by investing activities |
13,745 | 37,238 | ||||||
| Financing activities: |
||||||||
| Increase in debt |
137,800 | 206,500 | ||||||
| Payment of debt |
(156,392 | ) | (274,011 | ) | ||||
| Dividends paid |
— | (10,515 | ) | |||||
| Other, net |
192 | — | ||||||
| Net cash used by financing activities |
(18,400 | ) | (78,026 | ) | ||||
| Net decrease in cash and cash equivalents |
(1,392 | ) | (2,900 | ) | ||||
| Cash and cash equivalents at beginning of period |
7,142 | 14,214 | ||||||
| Cash and cash equivalents at end of period |
$ | 5,750 | $ | 11,314 | ||||
See accompanying notes.
5
MEDIA GENERAL, INC.
NOTES TO CONSOLIDATED CONDENSED FINANCIAL STATEMENTS
(Unaudited)
1. The accompanying unaudited consolidated condensed financial statements have been prepared in accordance with accounting principles generally accepted in the United States for interim financial reporting, and with applicable quarterly reporting regulations of the Securities and Exchange Commission. They do not include all of the information and footnotes required by generally accepted accounting principles for complete financial statements and, accordingly, should be read in conjunction with the consolidated financial statements and related footnotes included in the Company’s Annual Report on Form 10-K for the year ended December 28, 2008 and the company’s Financial Statements and Management’s Discussion and Analysis in Exhibits 99.6 and 99.7 of this Form 8-K. The Company has evaluated events occurring subsequent to June 28, 2009 and through August 5, 2009 for recognition and/or disclosure in this Form 10-Q. See Note 14 regarding certain reclassifications.
In the opinion of management, all adjustments (consisting of normal recurring adjustments) considered necessary for a fair presentation of interim financial information have been included.
2. Inventories are principally raw materials (primarily newsprint).
3. Due to the continuation of challenging business conditions and the market’s perception of the value of media company stocks, the Company performed two interim impairment tests in 2008 (in addition to its regular annual impairment test) which resulted in impairment being recorded in the second and fourth quarters of 2008. The Company’s long-lived assets include goodwill related to the Company’s reporting units, identifiable assets at individual television stations and newspapers (including FCC licenses and network affiliation agreements), fixed assets, and certain other investments and assets held for sale. The Company determined that certain of these long-lived assets were impaired by measuring the estimated discounted and undiscounted cash flows expected to be generated by the assets to determine their fair value and by comparing the result to their carrying value. The determination of fair value requires the use of significant judgment and estimates about assumptions that management believes were appropriate in the circumstances. These assumptions include those relating to revenue growth, compensation levels, newsprint prices, discount rates and market trading multiples for broadcast and newspaper assets. As a result of the testing as of June 29, 2008, the Company recorded non-cash impairment charges related to goodwill in the Publishing Division of $512 million, FCC licenses in the Broadcast Division of $198 million, network affiliation agreements in the Broadcast Division of $67 million, trade names in the Broadcast Division of $.5 million, and certain investments (whose impairment was other than temporary) and assets held for sale of $4.4 million. The pretax charge totaled $782 million ($532 million after-tax) and was included on the line items “Goodwill and other assets impairment” and “Impairment of and loss on investments” on the Consolidated Condensed Statements of Operations.
At June 29, 2009, when the Company changed its structure to one organized primarily by geographic market, the carrying amount of goodwill was allocated to the new segments. Impairment tests prior to that change were performed based on goodwill balances and cash flows under the previous segment structure. Therefore, the Company is unable to reflect the reallocation of the goodwill impairment charge taken during 2008 and the prior-year goodwill balances by the current geographic segment structure.
Due to the continuation of the recession-driven economy and the Company’s revised expectation that, in spite of signs of firming, meaningful recovery will not begin until 2010, the Company performed another impairment test in the second quarter of 2009. No impairment was indicated as a result of the test, using methods substantially similar to those described above. As discussed in Note 6, effective with the third quarter, the Company changed its management structure which resulted in a greater number of operating segments and reporting units for future impairment testing. As anticipated, the Company recorded an additional impairment charge in the third quarter of 2009; see Note 3 of the Company’s 2009 third-quarter Form10-Q for a complete discussion of the charge.
6
4. In the third quarter of 2009, the Company sold the assets of a small magazine and its related web site in Virginia and has reported it as a discontinued operation for all prior periods. In the first quarter of 2008, the Company had five held-for-sale television stations which were classified as discontinued operations. During 2008, the Company completed the sale of four of those TV stations in three transactions: WTVQ in Lexington, Kentucky; WMBB in Panama City, Florida, along with KALB/NALB in Alexandria, Louisiana; and WNEG in Toccoa, Georgia. The Company recognized an after-tax loss of $11.3 million in the first quarter of 2008 related to these divestitures. In the second quarter of 2009, the Company completed the sale of WCWJ in Jacksonville, Florida, and recorded an after-tax gain of $7.1 million related to this divestiture. Results of discontinued operations are presented below for the second quarter and six months period of 2009 and 2008:
| Quarter Ended | Six Months Ended | |||||||||||||
| (In thousands) |
June 28, 2009 |
June 29, 2008 |
June 28, 2009 |
June 29, 2008 | ||||||||||
| Revenues |
$ | 1,224 | $ | 8,515 | $ | 3,500 | $ | 17,833 | ||||||
| Costs and expense |
1,124 | 6,420 | 3,362 | 14,400 | ||||||||||
| Income before income taxes |
100 | 2,095 | 138 | 3,433 | ||||||||||
| Income taxes |
(56 | ) | 817 | (56 | ) | 1,339 | ||||||||
| Income from discontinued operations |
$ | 156 | $ | 1,278 | $ | 194 | $ | 2,094 | ||||||
5. The following table includes information about the carrying values and estimated fair values of the Company’s financial instruments at June 28, 2009 and December 28, 2008:
| June 28, 2009 | December 28, 2008 | |||||||||||
| (In thousands) |
Carrying Amounts | Fair Value | Carrying Amounts | Fair Value | ||||||||
| Assets |
||||||||||||
| Investments |
||||||||||||
| Trading |
$ | 262 | $ | 262 | $ | 243 | $ | 243 | ||||
| Liabilities |
||||||||||||
| Long-term debt: |
||||||||||||
| Revolving credit facility |
423,698 | 416,932 | 425,000 | 425,000 | ||||||||
| Bank term loan |
287,722 | 283,127 | 300,000 | 300,000 | ||||||||
| Bank lines |
— | — | 5,000 | 5,000 | ||||||||
| Interest rate swaps |
18,290 | 18,290 | 22,723 | 22,723 | ||||||||
Trading securities are held by the Supplemental 401(k) plan and are carried at fair value and are determined by reference to quoted market prices. The fair value of the long-term debt in the chart above was estimated using discounted cash flow analyses and an estimate of the Company’s bank borrowing rate (by reference to publicly traded debt rates as of June 28, 2009) for similar types of borrowings. The interest rate swaps are carried at fair value based on a discounted cash flow analysis (predicated on quoted LIBOR prices) of the estimated amounts the Company would have received or paid to terminate the swaps. Under the fair value hierarchy set forth by SFAS 157, the Company’s trading securities fall under Level 1 (quoted prices in active markets) and its interest rate swaps and long-term debt fall under Level 2 (other observable inputs).
7
In the third quarter of 2006, the Company entered into several interest rate swaps as part of an overall strategy to manage interest cost and risk associated with variable interest rates, primarily short-term changes in LIBOR. These interest rate swaps are cash flow hedges with notional amounts totaling $300 million; swaps with notional amounts of $100 million will mature in August of 2009 and $200 million will mature in 2011. Changes in cash flows of the interest rate swaps offset changes in the interest payments on the Company’s long-term debt. These swaps effectively convert the Company’s variable rate bank debt to fixed rate debt with a weighted average interest rate approximating 8.3% at June 28, 2009, based on margins at that date. The following table includes information about the Company’s derivative instruments as of June 28, 2009.
| (In thousands) |
||||||||
| Derivatives designated as hedging instruments |
Balance sheet location |
Fair Value | Amount of pretax derivative gain recognized in OCI in 2009 | |||||
| Interest rate swaps |
Other liabilities and deferred credits |
$ | 18,290 | $ | 4,433 | |||
6. The Company is a diversified communications company located primarily in the southeastern United States Effective at the beginning of the third quarter of 2009, the Company changed its management structure, shifting from its three-division structure (Publishing, Broadcast, and Interactive Media) to five geographic segments (Virginia/Tennessee, Florida, Mid-South, North Carolina, Ohio/Rhode Island) along with a sixth segment that includes interactive advertising services and certain other operations. This change was undertaken to more closely connect the Company to its customers and non-customers, to accelerate its Web-first strategy, to speed decision-making, and to create and serve new market opportunities. The Company has reclassified the corresponding items of segment information for earlier periods to conform with its current structure.
Revenues for the geographic markets include revenues from 18 network-affiliated television stations, three metro newspapers, and 20 community newspapers, all of which have associated Web sites. Additionally, more than 200 specialty publications that include weekly newspapers and niche publications and the Web sites that are associated with many of these specialty publications are included in revenues for the geographic markets. Revenues for the sixth segment, Advertising Services & Other, are generated by three interactive advertising services companies and certain other operations including a broadcast equipment and studio design company.
Management measures segment performance based on profit or loss from operations before interest, income taxes, and acquisition related amortization. Amortization of acquired intangibles is not allocated to individual segments although the intangible assets themselves are included in identifiable assets for each segment. Intercompany sales are primarily accounted for as if the sales were at current market prices and are eliminated in the consolidated financial statements. Certain promotion in the Company’s newspapers and television stations on behalf of its online shopping portal are recognized based on incremental cost. The Company’s reportable segments, are managed separately, largely based on geographic market considerations and a desire to provide services to customers regardless of the media platform or any difference in the method of delivery. In certain instances, operations have been aggregated based on similar economic characteristics.
8
The following table sets forth the Company’s current and prior-year financial performance by segment:
| (In thousands) |
Revenues | Depreciation & Amortization |
Operating Profit (Loss) |
|||||||||
| Three Months ended June 28, 2009 |
||||||||||||
| Virginia/Tennessee |
$ | 50,587 | $ | (3,486 | ) | $ | 11,324 | |||||
| Florida |
37,627 | (2,094 | ) | 193 | ||||||||
| Mid-South |
36,941 | (3,397 | ) | 5,971 | ||||||||
| North Carolina |
19,675 | (1,696 | ) | 1,483 | ||||||||
| Ohio/Rhode Island |
12,614 | (847 | ) | 2,577 | ||||||||
| Advertising Services & Other |
6,242 | (224 | ) | 776 | ||||||||
| Eliminations |
(299 | ) | — | (5 | ) | |||||||
| 22,319 | ||||||||||||
| Unallocated amounts: |
||||||||||||
| Acquisition intangibles amortization |
— | (1,787 | ) | (1,787 | ) | |||||||
| Corporate expense |
— | (1,526 | ) | (6,629 | ) | |||||||
| $ | 163,387 | $ | (15,057 | ) | ||||||||
| Interest expense |
(11,257 | ) | ||||||||||
| Loss on investments |
(209 | ) | ||||||||||
| Other |
(80 | ) | ||||||||||
| Consolidated income from continuing operations before income taxes |
$ | 2,357 | ||||||||||
| Three Months ended June 29, 2008 |
||||||||||||
| Virginia/Tennessee |
$ | 60,511 | $ | (4,288 | ) | $ | 11,409 | |||||
| Florida |
51,569 | (2,466 | ) | (1,908 | ) | |||||||
| Mid-South |
44,097 | (3,772 | ) | 6,913 | ||||||||
| North Carolina |
26,656 | (1,770 | ) | 2,445 | ||||||||
| Ohio/Rhode Island |
14,617 | (1,119 | ) | 2,070 | ||||||||
| Advertising Services & Other |
7,419 | (201 | ) | 488 | ||||||||
| Eliminations |
(617 | ) | 1 | (383 | ) | |||||||
| 21,034 | ||||||||||||
| Unallocated amounts: |
||||||||||||
| Acquisition intangibles amortization |
(3,957 | ) | (3,957 | ) | ||||||||
| Corporate expense |
(1,451 | ) | (10,224 | ) | ||||||||
| $ | 204,252 | $ | (19,023 | ) | ||||||||
| Interest expense |
(10,548 | ) | ||||||||||
| Impairment of and loss on investments |
(5,940 | ) | ||||||||||
| Gain on insurance recovery |
2,750 | |||||||||||
| Goodwill and other asset impairment |
(778,318 | ) | ||||||||||
| Other |
758 | |||||||||||
| Consolidated loss from continuing operations before income taxes |
$ | (784,445 | ) | |||||||||
9
| (In thousands) |
Revenues | Depreciation & Amortization |
Operating Profit (Loss) |
|||||||||
| Six months ended June 28, 2009 |
||||||||||||
| Virginia/Tennessee |
$ | 97,427 | $ | (7,144 | ) | $ | 13,360 | |||||
| Florida |
79,867 | (4,190 | ) | (2,837 | ) | |||||||
| Mid-South |
70,739 | (6,788 | ) | 7,037 | ||||||||
| North Carolina |
38,656 | (3,392 | ) | (76 | ) | |||||||
| Ohio/Rhode Island |
23,700 | (1,692 | ) | 2,737 | ||||||||
| Advertising Services & Other |
12,804 | (449 | ) | 1,367 | ||||||||
| Eliminations |
(673 | ) | 1 | (49 | ) | |||||||
| 21,539 | ||||||||||||
| Unallocated amounts: |
||||||||||||
| Acquisition intangibles amortization |
(3,586 | ) | (3,586 | ) | ||||||||
| Corporate expense |
(3,135 | ) | (15,263 | ) | ||||||||
| $ | 322,520 | $ | (30,375 | ) | ||||||||
| Interest expense |
(21,229 | ) | ||||||||||
| Equity in net loss of unconsolidated affiliates |
(209 | ) | ||||||||||
| Other |
(186 | ) | ||||||||||
| Consolidated loss from continuing operations before income taxes |
$ | (18,934 | ) | |||||||||
| Six months ended June 29, 2008 |
||||||||||||
| Virginia/Tennessee |
$ | 118,699 | $ | (8,083 | ) | $ | 20,381 | |||||
| Florida |
104,210 | (4,845 | ) | (1,712 | ) | |||||||
| Mid-South |
85,702 | (7,569 | ) | 11,161 | ||||||||
| North Carolina |
50,974 | (3,548 | ) | 3,156 | ||||||||
| Ohio/Rhode Island |
27,615 | (2,270 | ) | 2,348 | ||||||||
| Advertising Services & Other |
12,616 | (361 | ) | (359 | ) | |||||||
| Eliminations |
(1,578 | ) | 9 | (854 | ) | |||||||
| 34,121 | ||||||||||||
| Unallocated amounts: |
||||||||||||
| Acquisition intangibles amortization |
(7,782 | ) | (7,782 | ) | ||||||||
| Corporate expense |
(2,900 | ) | (21,474 | ) | ||||||||
| $ | 398,238 | $ | (37,349 | ) | ||||||||
| Interest expense |
(22,837 | ) | ||||||||||
| Impairment of and net loss on investments |
(5,961 | ) | ||||||||||
| Gain on insurance recovery |
2,750 | |||||||||||
| Goodwill and other asset impairment |
(778,318 | ) | ||||||||||
| Other |
(1,327 | ) | ||||||||||
| Consolidated loss from continuing operations before income taxes |
$ | (800,828 | ) | |||||||||
10
7. In January of 2009, the Company adopted FASB Staff Position EITF 03-6-1, Determining Whether Instruments Granted in Share-Based Payment Transactions Are Participating Securities. EITF 03-6-1 clarifies that unvested share-based payment awards that contain nonforfeitable rights to dividends or dividend equivalents are participating securities and are to be included in the computation of earnings per share. The Company adjusted the prior-period earnings per share calculation which resulted in a $.01 per share change in both the second quarter and six-month period of 2008. The following table sets forth the computation of basic and diluted earnings per share from continuing operations:
| Quarter Ended June 28, 2009 | Quarter Ended June 29, 2008 | |||||||||||||||||||
| (In thousands, except per share amounts) |
Income (Numerator) |
Shares (Denominator) |
Per Share Amount |
Loss (Numerator) |
Shares (Denominator) |
Per Share Amount |
||||||||||||||
| Basic and Diluted EPS: |
||||||||||||||||||||
| Income (loss) from continuing operations |
$ | 13,312 | $ | (533,490 | ) | |||||||||||||||
| Distributed and distributed earnings attributable to participating securities |
(646 | ) | (158 | ) | ||||||||||||||||
| Income (loss) from continuing operations available to common stockholders |
$ | 12,666 | 22,253 | $ | 0.57 | $ | (533,648 | ) | 22,074 | $ | (24.18 | ) | ||||||||
| Six Months Ended June 28, 2009 | Six Months Ended June 29, 2008 | |||||||||||||||||||
| (In thousands, except per share amounts) |
Loss (Numerator) |
Shares (Denominator) |
Per Share Amount |
Loss (Numerator) |
Shares (Denominator) |
Per Share Amount |
||||||||||||||
| Basic and Diluted EPS: |
||||||||||||||||||||
| Income (loss) from continuing operations |
$ | (7,979 | ) | $ | (543,261 | ) | ||||||||||||||
| Undistributed earnings attributable to participating securities |
— | (299 | ) | |||||||||||||||||
| Income (loss) from continuing operations available to common stockholders |
$ | (7,979 | ) | 22,217 | $ | (0.36 | ) | $ | (543,560 | ) | 22,093 | $ | (24.60 | ) | ||||||
8. The following table provides the components of net periodic employee benefits expense for the Company’s benefit plans for the second quarter and first six months of 2009 and 2008:
| Quarter Ended | ||||||||||||||||
| Pension Benefits | Other Benefits | |||||||||||||||
| (In thousands ) |
June 28, 2009 |
June 29, 2008 |
June 28, 2009 |
June 29, 2008 |
||||||||||||
| Service cost |
$ | 142 | $ | 247 | $ | 50 | $ | 82 | ||||||||
| Interest cost |
5,906 | 6,536 | 617 | 755 | ||||||||||||
| Expected return on plan assets |
(5,814 | ) | (6,424 | ) | — | — | ||||||||||
| Amortization of prior-service (credit)/cost |
(79 | ) | (2 | ) | 424 | 411 | ||||||||||
| Amortization of net loss/(gain) |
270 | 1,414 | (280 | ) | (64 | ) | ||||||||||
| Curtailment charge |
50 | — | — | — | ||||||||||||
| Net periodic benefit cost |
$ | 475 | $ | 1,771 | $ | 811 | $ | 1,184 | ||||||||
11
| Six Months Ended | ||||||||||||||||
| Pension Benefits | Other Benefits | |||||||||||||||
| (In thousands) |
June 28, 2009 |
June 29, 2008 |
June 28, 2009 |
June 29, 2008 |
||||||||||||
| Service cost |
$ | 332 | $ | 472 | $ | 125 | $ | 207 | ||||||||
| Interest cost |
12,408 | 13,061 | 1,267 | 1,505 | ||||||||||||
| Expected return on plan assets |
(12,054 | ) | (12,949 | ) | — | — | ||||||||||
| Amortization of prior-service (credit)/cost |
(92 | ) | (27 | ) | 874 | 861 | ||||||||||
| Amortization of net loss/(gain) |
2,047 | 2,764 | (505 | ) | (189 | ) | ||||||||||
| Curtailment charge |
50 | — | — | — | ||||||||||||
| Net periodic benefit cost |
$ | 2,691 | $ | 3,321 | $ | 1,761 | $ | 2,384 | ||||||||
In the second quarter of 2009, the Company amended its plans so that future retirement benefits under the retirement, ERISA Excess and Executive Supplemental Retirement plans will now be based on final average earnings as of May 31, 2009. Service accruals under the retirement and ERISA Excess plans ceased at the beginning of 2007 and the retirement plan was closed to new participants at that time, but benefits had been allowed to grow based on future compensation. This change does not affect the benefits of current retirees. In the second quarter, because of the curtailment of the retirement and ERISA Excess plans, the Company recorded a net curtailment charge of $50,000 and adjusted OCI by $53 million net of tax.
9. The Company’s comprehensive loss consisted of the following:
| Quarter Ended | Six Months Ended | ||||||||||||||
| (In thousands) |
June 28, 2009 |
June 29, 2008 |
June 28, 2009 |
June 29, 2008 |
|||||||||||
| Net income (loss) |
$ | 20,588 | $ | (532,212 | ) | $ | (665 | ) | $ | (552,467 | ) | ||||
| Unrealized (loss) gain on derivative contracts (net of deferred taxes) |
2,348 | 5,373 | 3,972 | 112 | |||||||||||
| Change in pension and postretirement (net of deferred taxes) |
52,892 | 1,951 | 52,892 | 1,812 | |||||||||||
| Unrealized holding gain on equity securities (net of deferred taxes) |
— | 103 | — | — | |||||||||||
| Comprehensive income (loss) |
$ | 75,828 | $ | (524,785 | ) | $ | 56,199 | $ | (550,543 | ) | |||||
12
10. The Company accounts for severance benefits related to workforce reductions in accordance with FASB Statement No. 112, Employers’ Accounting for Postemployment Benefits, and accrues the related expense when payment of severance benefits is both probable and the amount is reasonably estimable. During the first six months of 2009, the Company recorded $6 million in severance expense in selling, general and administrative expenses related to involuntary employee terminations. The workforce reductions, the majority of which were completed in the second quarter, were in response to the deepening economic recession and the Company’s continued efforts to align its costs with the current business environment. The Company recorded severance expense of $1.5 million and $6 million in the second quarter and first half of 2009, as compared to $5.4 million in the first half of 2008 (virtually all of which was recorded in the second quarter of 2008). The following table represents a summary of severance activity by segment (in thousands) for the six months ended June 28, 2009. Accrued severance costs are included in “Accrued expenses and other liabilities” on the Consolidated Condensed Balance Sheets:
| (In thousands) |
Virginia/ Tennessee |
Florida | Mid-South | North Carolina |
Ohio/ Rhode Island |
Advertising Services & Other |
Corporate | Consolidated | ||||||||||||||||||||||||
| Accrued severance - |
||||||||||||||||||||||||||||||||
| December 28, 2008 |
$ | 870 | $ | 1,522 | $ | 1,086 | $ | 383 | $ | 907 | $ | 221 | $ | 167 | $ | 5,156 | ||||||||||||||||
| Severance expense |
2,479 | 2,085 | 382 | 597 | 215 | 282 | 8 | 6,048 | ||||||||||||||||||||||||
| Severance payments |
(3,146 | ) | (3,196 | ) | (1,357 | ) | (975 | ) | (1,084 | ) | (407 | ) | (59 | ) | (10,224 | ) | ||||||||||||||||
| Accrued severance - |
||||||||||||||||||||||||||||||||
| June 28, 2009 |
$ | 203 | $ | 411 | $ | 111 | $ | 5 | $ | 38 | $ | 96 | $ | 116 | $ | 980 | ||||||||||||||||
| Accrued severance - |
||||||||||||||||||||||||||||||||
| December 28, 2007 |
$ | 9 | $ | 262 | $ | — | $ | — | $ | — | $ | 158 | $ | — | $ | 429 | ||||||||||||||||
| Severance expense |
540 | 3,305 | 229 | 390 | 250 | 33 | 679 | 5,426 | ||||||||||||||||||||||||
| Severance payments |
(328 | ) | (1,371 | ) | (228 | ) | (147 | ) | (250 | ) | (21 | ) | (679 | ) | (3,024 | ) | ||||||||||||||||
| Accrued severance - |
||||||||||||||||||||||||||||||||
| June 28, 2008 |
$ | 221 | $ | 2,196 | $ | 1 | $ | 243 | $ | — | $ | 170 | $ | — | $ | 2,831 | ||||||||||||||||
11. The FCC has mandated a reallocation of a portion of the broadcast spectrum to others, including Sprint/Nextel. According to the FCC order, broadcasters must surrender their old equipment to prevent interference within a narrowed broadcasting frequency range. In exchange for the relinquished equipment, Sprint/Nextel has been providing broadcasters with new digital equipment and reimbursing associated out-of-pocket expenses. During the remainder of 2009, Sprint/Nextel will continue to provide the Company with new equipment which is capable of meeting the narrowed broadcasting frequency criteria. The Company recorded gains of $38 thousand and $1.3 million in the second quarters of 2009 and 2008, respectively, and gains of $.9 million and $2 million for the first six months of 2009 and 2008, respectively, in the line item “Selling, general and administrative” on the Consolidated Condensed Statements of Operations. The Company anticipates recording additional gains approaching $1.6 million in total in the next quarter relating to the new equipment.
12. In the second quarter of 2009, intraperiod tax allocation rules led to variations in the customary relationship between income tax expense and pretax accounting income resulting in an income tax benefit on pretax income and income tax expense on discontinued operations and other comprehensive income. The year-to-date tax benefit, excluding a $3.6 million state tax benefit recognized in the second quarter in connection with a favorable determination of a state tax issue, bore a more customary relationship (39%) to the pretax loss from continuing operations in the first half of 2009.
13. In the second quarter of 2008, the Company and its two equal partners completed the sale of SP Newsprint to White Birch Paper Company. The sale generated proceeds of approximately $60 million which were used to reduce debt and pay income taxes in 2008; a small adjustment related to working capital was recognized in 2009.
14. The Consolidated Condensed Balance Sheet and Consolidated Condensed Statements of Operations and Notes 1, 3, 4, 6, 7 and 10 have been revised for the effects of the Company’s change in segments and the reporting of the sale of a small business magazine and related web site as a discontinued operation.
13
| Item 2. | Management’s Discussion and Analysis of Financial Condition and Results of Operations |
OVERVIEW
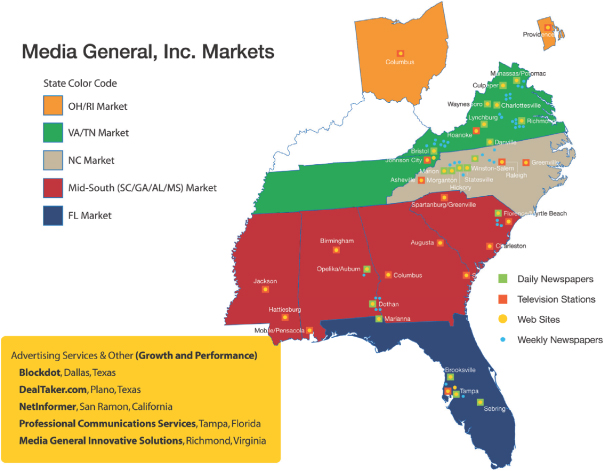
The Company is a diversified communications company located primarily in the southeastern United States. Effective at the beginning of the third quarter of 2009, Media General changed its management structure from three platform-based divisions to five geographic market segments and a sixth segment that includes the Company’s interactive advertising services and certain other operations. This change was undertaken to more closely connect the Company to its customers and non-customers, to accelerate its Web-first strategy, to speed decision-making, and to create and serve new market opportunities. This market-based approach is a natural extension of the Company’s mission, which is to be the leading provider of high-quality news, information and entertainment in the Southeast by continually building its position of strength in strategically located markets.
The following map shows the locations and composition of the Company’s operating assets within its new management structure.
The Company’s fiscal year ends on the last Sunday in December.
RESULTS OF OPERATIONS
The Company recorded net income of $20.6 million in the second quarter of 2009 and a net loss of $.7 million in the first six months of the year, as compared to a net loss of $532.2 million and $552.5 million in the equivalent 2008 periods. Embedded within these results are two items which merit separate discussion: discontinued operations and impairment charges. The Company sold four TV stations and their associated Web sites
14
in 2008: WTVQ in Lexington, Kentucky, WMBB in Panama City, Florida, KALB/NALB in Alexandria, Louisiana, and WNEG in Toccoa, Georgia. The Company completed the sale of its final held-for-sale station, WCWJ in Jacksonville, Florida, in the second quarter of 2009. The Company recognized an after-tax gain of $7.1 million in 2009 and an after-tax loss of $11.3 million in 2008 related to these divestitures. See Note 4 for a further discussion of discontinued operations. Challenging business conditions and the market’s perception of the value of media company stocks prompted the Company to perform an interim impairment test as of the end of the second quarter of 2008. As a result of this testing, the Company recorded impairment charges in 2008 related to goodwill in the Publishing Division of $512 million, FCC licenses in the Broadcast Division of $198 million, network affiliation agreements in the Broadcast Division of $67 million, trade names in the Broadcast Division of $.5 million, and investments and assets held for sale of $4.4 million, resulting in an after-tax non-cash impairment charge of $532 million. For a more complete discussion regarding this impairment charge, see Note 3. The remainder of this discussion focuses only on results from continuing operations.
In the second quarter of 2009, the Company had income from continuing operations of $13.3 million as compared to a loss from continuing operations of $533.5 million in the comparable quarter of 2008; excluding the $532 million after-tax impairment charge in 2008 the loss was $1.4 million. Most of the improvement was due to income taxes. The quarter included an $11 million tax benefit that was the result of a favorable determination concerning a state tax issue and an intraperiod tax allocation of tax benefits recorded on the Company’s loss from continuing operations (see the Income Taxes section of this MD&A for a further discussion). Severance costs, which were lower than the second quarter of 2008 by $3.9 million, benefitted the current quarter’s reduction in operating losses and were the catalyst for significantly reduced operating costs in the face of continuing declines in advertising revenues. Additionally, the bottom line benefited from a 55% decline in intangibles amortization expense (due to the 2008 impairment write-downs of network affiliation agreement intangibles), a mandatory employee furlough program, the suspension of the company match on the 401(k) plan, and a favorable adjustment for medical expense and reduced compensation costs due to lower employee counts.
The Company recorded a loss from continuing operations of $8.1 million in the first six months of 2009 as compared to a loss of $543.3 million in the first half of 2008; excluding the $532 million after-tax impairment charge in the first half of 2008, the loss was $11.2 million. As with the quarter, reduced operating costs played a large role in the Company’s improved year-over-year results. Employee compensation expenses were down 22% which served to temper a 19% revenue decline. Additional cost savings were achieved for reasons similar to those in the second quarter such as lower intangibles expense, the furlough program, the absence of the company match on the 401(k) plan, and workforce reductions.
MARKET RESULTS
As previously mentioned, the third quarter of 2009 marked the Company’s shift from three platform-based divisions to five geographic market segments and a sixth segment that includes the Company’s interactive advertising services and certain other operations; collectively, they contain all of the operations that were formerly part of the Publishing, Broadcast and Interactive Media segments. The geographically-managed segments include: Virginia/Tennessee, Florida, Mid-South, North Carolina, and Ohio/Rhode Island.
Revenues
As part of this reorganization, revenues have been grouped primarily into five major categories: Local (including the category that was formerly Retail in the Publishing Division), National, Political (which includes Political advertising as was traditionally reported), Classified, and Subscription/Content/Circulation (which includes newspaper circulation, broadcast retransmission revenues, and interactive subscription and content revenues). The following chart summarizes the total consolidated period-over-period changes in these select revenue categories:
Change in Market Revenues by Major Category
2009 versus 2008
| Q2 Change | Year-to-date Change | |||||||||||||
| (In thousands) |
Amount | Percent | Amount | Percent | ||||||||||
| Local |
$ | (23,558 | ) | (22.0 | ) | $ | (40,993 | ) | (20.0 | ) | ||||
| National |
(8,644 | ) | (23.5 | ) | (15,060 | ) | (21.0 | ) | ||||||
| Political |
(2,016 | ) | (71.7 | ) | (6,289 | ) | (86.7 | ) | ||||||
| Classified |
(13,445 | ) | (35.9 | ) | (28,423 | ) | (37.2 | ) | ||||||
| Subs/Content/Circulation |
4,709 | 28.0 | 8,334 | 24.6 | ||||||||||
15
While the tough advertising environment played a significant role in lower Local and National advertising revenues, period-over-period comparisons were also directly affected by the reduction in Political revenues, as expected in this off-election year; markets which have a higher mix of broadcast stations over newspapers were obviously more affected by this category. Classified advertising was hampered by continued softness in the auto, real estate and employment categories. However, Subscription/Content/Circulation revenues made meaningful progress as a rise in cable and satellite retransmission revenues contributed approximately two-thirds of the growth and an increase in newspaper circulation (the result of higher rates) was responsible for the remainder.
Revenues in the Virginia/Tennessee Market fell 16% and 18% in the second quarter and first six months of 2009 as compared to equivalent prior-year periods. Decreased Local and Classified advertising were the largest reasons for the period-over-period declines, driven by the current recession-induced environment. Partially offsetting weak advertising revenues were strong Subscription/Content/Circulation revenues which showed solid growth due to rate increases across all newspapers as well as to excellent broadcast retransmission revenues.
Revenues in the Florida Market were down 27% and 23% in the second quarter and year-to-date of 2009 from comparable 2008 periods. Local advertising declined 29% and 23% in the quarterly and year-to-date periods, respectively, on weakness in the department store and home furniture categories. Classified advertising continued to show declines due to the erosion of employment, real estate and automotive advertising.
Revenues in the Mid-South Market fell 16% and 18% in the second quarter and first six months of 2009 as compared to equivalent 2008 periods as Local and National advertising were down over 20% from the prior-year levels. As anticipated, Political advertising was almost nonexistent in 2009 as compared to $3.5 million in the first six months of last year. Following the trend, strong Subscription/Content/Circulation revenues partially offset the other revenue shortfalls.
Revenues in the North Carolina Market declined 26% and 24% in the second quarter and year-to-date of 2009 from the same periods of 2008. Cutbacks in Local and Classified advertising comprised most of the revenue shortfall in the North Carolina Market.
Revenues in the Ohio/Rhode Island Market decreased 14% in both the second quarter and first six months of 2009 from comparable prior-year periods. This is the Company’s only geographic market which does not include any newspapers and is consequently less influenced by Classified advertising, but more affected by the ebb and flow of Political and Olympic revenues in corresponding odd and even-numbered years. Local advertising was down 16% in both the second quarter and first six months of 2009, with lower National and Political advertising comprising the remainder of the period-over-period declines. As with all of the other geographic markets, Subscription/Content/Circulation revenues showed increases and partially offset lower advertising revenues.
16
Operating Expenses
Cost-containment efforts aimed at reducing the cost structure of the Company have been successful as evidenced by a 23% and 17% reduction in total operating expenses (excluding impairment charges) in the second quarter and first six months of 2009 from equivalent prior-year periods. Total compensation costs declined 28% in the quarter and 22% in the first six months of 2009 due to lower employee counts, the elimination of positions at most locations, lower commissions, the consolidation of certain production facilities, and savings from mandatory unpaid furlough days (discussed in further detail in the Liquidity section of this MD&A). Additionally, despite higher average newsprint prices, up $39/ton (to $633/ton) in the second quarter and up $90/ton (to $656/ton) in the first half of 2009, newsprint costs were down 29% and 18% in those similar periods due to reduced consumption as a result of lower advertising linage, decreased circulation volumes, and concerted conservation efforts including web-width reductions.
Operating expenses in the Virginia/Tennessee Market decreased $9.9 million or 20% and $14.3 million or 14.5% in the second quarter and first six months of 2009 from those same periods in 2008. The largest portion of this decrease was attributable to a 35% and 21% reduction in compensation expense in the second quarter and first six months from the equivalent prior-year periods. Reduced newsprint cost was responsible for a substantial part of the remaining decrease.
Operating expenses in the Florida Market were down $16 million (30%) and $23.2 million (22%) in the second quarter and year-to-date period of 2009 as compared to equivalent prior-year periods. The Florida Market, through its severance programs, reduced compensation costs by $9.8 million and $14.9 million in the second quarter and six months ended June 28, 2009 compared to the same periods in 2008. The Florida Market also achieved meaningful departmental savings in the areas of circulation sales, production supplies and reduced discretionary spending.
Operating expenses in the Mid-South Market fell 17% and 15% in the current quarter and first six months of 2009 from similar periods in 2008. The majority of the savings came from lower compensation cost. This market has a heavier mix of broadcast stations than newspapers and therefore, while newsprint costs were down, they were proportionally less significant to the overall cost savings than in other markets.
Operating expenses in the North Carolina Market declined 25% in the second quarter and 19% in the first six months of 2009 as compared to 2008’s second quarter and year-to-date period. Approximately half of the savings in both the quarter and year-to-date were realized from lower compensation cost. Lower newsprint costs combined with reduced departmental spending contributed the remaining savings.
Operating expenses in the Ohio/Rhode Island Market were down 28% and 17% in the quarter and first six months of the current year from similar 2008 periods due primarily to lower compensation cost. The remaining savings were achieved primarily through concerted efforts to control discretionary spending. Newsprint was not a factor as the Company does not operate any newspapers in the Ohio/Rhode Island Market.
ADVERTISING SERVICES & OTHER
Advertising Services & Other (ASO) primarily includes:
| • | Blockdot - a leading advergaming business; |
| • | Dealtaker.com - an online social shopping portal that was acquired at the beginning of the second quarter of 2008; |
| • | NetInformer - a leading provider of mobile advertising and marketing services purchased in the fourth quarter of 2008; |
17
| • | Production Services – comprised primarily of a provider of broadcast equipment and studio design services. |
Revenues in ASO fell $1.2 million (16%) and improved 2% in the second quarter and first six months of 2009 over the equivalent prior-year periods. The change in revenue in the second quarter was primarily due to a $1.9 million reduction in revenue in the Production Services operations as the economy and the recently completed digital upgrade has reduced demand for this operation’s services. This reduction in revenue was partially offset by strong revenue growth from Dealtaker.com (particularly in the first six months of 2009 as compared to 2008 when its results included only three months of ownership) reflecting increased traffic and visitors buying from merchant sites. Blockdot exhibited solid improvement in its advergaming revenues as a result of successful sales initiatives.
Operating expenses were down 21% and 12% in the second quarter and first six months of 2009 from the equivalent prior-year periods due primarily to lower compensation costs. Additionally, lower cost of goods sold was in line with the previously mentioned reduced volume of work at Production Services.
Operating Profit (Loss)
The following chart shows the change in operating profit by market for the second quarter and first six months of 2009 and 2008; the period-over-period movement in market operating profit was driven by the underlying fluctuations in revenue and expense as detailed in the previous discussion.
Change in Market Operating Profits
2009 versus 2008
| Q2 Change | Year-to-date Change | |||||||||||||
| (In thousands) |
Amount | Percent | Amount | Percent | ||||||||||
| Virginia/Tennessee |
$ | (85 | ) | (0.7 | ) | $ | (7,021 | ) | (34.4 | ) | ||||
| Florida |
2,101 | — | (1,125 | ) | 65.7 | |||||||||
| Mid-South |
(942 | ) | (13.6 | ) | (4,124 | ) | (37.0 | ) | ||||||
| North Carolina |
(962 | ) | (39.3 | ) | (3,232 | ) | — | |||||||
| Ohio/Rhode Island |
507 | 24.5 | 389 | 16.6 | ||||||||||
| Adv. Services & Other |
288 | 59.0 | 1,726 | — | ||||||||||
| Eliminations/Disc. Ops |
378 | 98.7 | 805 | 94.3 | ||||||||||
| Total |
$ | 1,285 | 6.1 | $ | (12,582 | ) | (36.9 | ) | ||||||
In the second quarter of 2009, the Florida Market was responsible for the majority of the operating profit improvement from last year’s second quarter. Lower operating expenses, resulting from cost reduction initiatives, in this market were able to overcome decreased revenues.
In the first six months of 2009, the Virginia/Tennessee, Mid-South, and North Carolina Markets contributed the largest portion of the year-over-year operating profit shortfall. Anemic Classified advertising was the common thread among these markets, while depressed Local revenues at the Virginia/Tennessee and North Carolina Markets contributed as well. The Florida Market showed lesser declines as a substantial portion of their reduced revenues was offset by lower compensation costs and decreased newsprint expense.
INTEREST EXPENSE
Interest expense increased $.7 million in the second quarter from 2008’s same quarter due to a 100 basis point increase (to 5.9%) in the Company’s all-in borrowing rate, partially offset by an approximate $90 million decline in average debt levels. Interest expense declined $1.6 million in the year to date from the first half of 2008 due to a $105 million decline in average debt levels, partially offset by a small increase in the average interest rate to 5.5%. Proceeds from the sales of SP Newsprint and four television station in 2008 drove the debt reduction.
18
In the second quarter of 2006, the Company entered into three interest rate swaps (where it pays a fixed rate and receives a floating rate) to manage interest cost and cash flows associated with variable interest rates, primarily short-term changes in LIBOR, not to trade such instruments for profit or loss. These interest rate swaps are cash flow hedges with notional amounts totaling $300 million and maturities of either three or five years. Changes in cash flows of the interest rate swaps offset changes in the interest payments on the Company’s borrowings. These swaps effectively convert the Company’s variable rate bank term loan to fixed rate debt with a weighted average interest rate approximating 8.3% at June 28, 2009.
INCOME TAXES
In the second quarter and first half of 2009, the Company recorded an income tax benefit attributable to continuing operations and income tax expense on discontinued operations and other comprehensive income. The income tax benefit was comprised of two components: a $7.5 million tax benefit on its loss from continuing operations for the year-to-date period and a discrete tax benefit related to a favorable determination of a state tax issue ($3.6 million) resulting in an unusual effective tax rate. In the first six months of 2009, the Company benefitted income from continuing operations at a 39% rate (excluding the one-time tax benefit related to the state tax issue) compared to 32.2% a year ago. The increase in the 2009 tax rate was primarily due to the relatively low effective tax rate related to the impairment charge recorded in the second quarter of last year.
LIQUIDITY
Net cash generated from operating activities in the first half of 2009 was $3.3 million. Additionally, the Company completed the sale of its fifth held-for-sale television station, WCWJ, which yielded proceeds of approximately $17 million. During the year, the Company collected a $5 million note receivable related to its sale of SP Newsprint in 2008, incurred capital expenditures of $8 million and made a retirement plan contribution of $5 million. Based on the general economic environment and outlook, the Company has reduced its capital spending plans by postponing various projects.
At June 28, 2009, the Company had in place a $578 million revolving credit facility and a $288 million variable-rate bank term loan facility (together the “Facilities”). The term loan is with essentially the same syndicate of banks that provides the Company’s revolving credit facility. At the end of the second quarter, there were borrowings of $424 million outstanding under the revolving credit facility and $288 million under the bank term loan. The Facilities have both interest coverage and leverage ratio covenants. Under the terms of the Facilities, the maximum leverage ratio covenant was reduced slightly for the remainder of 2009 beginning with the second quarter and will reduce again for the first three quarters of 2010; it will remain at a constant level thereafter. Also effective for the second quarter of 2009, the minimum interest coverage ratio increased slightly for the remaining term of the Facilities. These covenants, which involve debt levels, interest expense, and a rolling four-quarter calculation of EBITDA (a measure of cash earnings as defined in the revolving credit agreement), can affect the Company’s maximum borrowing capacity allowed by the Facilities (which was approximately $33.5 million as of the filing date). Annual borrowing capacity reductions will be made based on the Company’s excess cash flow, as defined. Because the leverage ratio exceeds certain preset levels, the Facilities contain restrictions on dividends, capital spending, indebtedness, capital leases, and investments, as defined. The Company was in compliance with all covenants at quarter-end and, as covenants tighten, the Company expects to remain in compliance with them going forward by taking the steps necessary to maintain EBITDA and reduce debt.
As the economy has deteriorated, the Company responded to the economic crisis with several aggressive actions to improve its cash flow. These actions included suspending the Company’s match for the 401(k) Plan for the last three quarters of 2009, a minimum of ten mandatory unpaid furlough days for all employees spread across the first three quarters of 2009 (4 days in the first quarter and 3 days in each of the second and third quarters), and the Board of Directors suspending the Company dividend. As discussed earlier, the Company has significantly reduced its workforce, and effective May 31, froze benefits under its retirement plan. All of these actions will conserve cash in either the short- or long-term, or both.
19
In the second quarter, the Company completed the sale of WCWJ in Jacksonville, Florida and used the proceeds to reduce debt. The combined commitment under the Facilities is now $866 million. The Company believes that internally generated funds provided by operations, together with the unused portion of the Facilities, provide it with the flexibility to manage working capital needs and finance planned capital expenditures.
* * * * * * * *
Certain statements in this quarterly report that are not historical facts are “forward-looking” statements, as that term is defined by the federal securities laws. Forward-looking statements include statements related to accounting estimates and assumptions, expectations regarding credit facilities, acquisitions and dispositions, the impact of cost-containment measures, staff reductions, retirement plan changes, the Internet, the Yahoo! agreements, debt compliance, general advertising levels and political advertising levels. Forward-looking statements, including those which use words such as the Company “believes,” “anticipates,” “expects,” “estimates,” “intends,” “projects,” “plans,” “may” and similar words, are made as of the date of this filing and are subject to risks and uncertainties that could cause actual results to differ materially from those expressed in or implied by such statements.
Some significant factors that could affect actual results include: the effect of the credit crisis on advertising demand, asset impairments, interest rates or energy prices, the availability and pricing of credit and newsprint, changes to pending accounting standards, health care cost trends, a natural disaster, the level of political advertising, the performance of acquisitions, and regulatory rulings and laws.
20