Attached files
| file | filename |
|---|---|
| 8-K - FORM 8-K - MEDIA GENERAL INC | d8k.htm |
| EX-99.1 - EXHIBIT 99.1 - MEDIA GENERAL INC | dex991.htm |
| EX-23.1 - EXHIBIT 23.1 - MEDIA GENERAL INC | dex231.htm |
| EX-23.2 - EXHIBIT 23.2 - MEDIA GENERAL INC | dex232.htm |
| EX-99.4 - EXHIBIT 99.4 - MEDIA GENERAL INC | dex994.htm |
| EX-99.8 - EXHIBIT 99.8 - MEDIA GENERAL INC | dex998.htm |
| EX-99.2 - EXHIBIT 99.2 - MEDIA GENERAL INC | dex992.htm |
| EX-99.9 - EXHIBIT 99.9 - MEDIA GENERAL INC | dex999.htm |
| EX-99.3 - EXHIBIT 99.3 - MEDIA GENERAL INC | dex993.htm |
| EX-99.7 - EXHIBIT 99.7 - MEDIA GENERAL INC | dex997.htm |
| EX-99.5 - EXHIBIT 99.5 - MEDIA GENERAL INC | dex995.htm |
| EX-99.10 - EXHIBIT 99.10 - MEDIA GENERAL INC | dex9910.htm |
Exhibit 99.6
Item 7. Management’s Discussion and Analysis of Financial Condition and Results of Operations
This discussion addresses the principal factors affecting the Company’s financial condition and operations during the past three years and should be read in conjunction with the consolidated financial statements and the Five-Year Financial Summary found in Exhibit 99.7 and Exhibit 99.5 of this Form 8-K, respectively.
OVERVIEW
The Company is a diversified communications company located primarily in the southeastern United States. Its mission is to be the leading provider of high-quality news, information and entertainment in the Southeast by continually building its position of strength in strategically located markets. The Company is committed to providing excellent local content in growth markets over multiple platforms, to continually developing new products and services that will stimulate audience and revenue growth, and to nurturing traditional audience viewership while cultivating the expanding role of online media. Effective at the beginning of the third quarter of 2009, the Company changed its management structure, shifting from its three-division structure (Publishing, Broadcast, and Interactive Media) to five geographic segments (Virginia/Tennessee, Florida, Mid-South (South Carolina/Georgia/Alabama/Mississippi), North Carolina, Ohio/Rhode Island) along with a sixth segment that includes interactive advertising services and certain other operations. This was done to more closely connect the Company to its customers and non-customers, to accelerate its Web-First strategy, to speed decision-making, and to create and serve new market opportunities. The Company’s three metro, 20 community newspapers and more than 200 weekly newspapers and other targeted publications, as well as 18 network-affiliated broadcast television stations and all related web sites are managed in the geographic region they serve. The Advertising Services & Other Segment primarily consists of the Company’s three growing interactive advertising services companies and certain other operations including a broadcast equipment and studio design company.
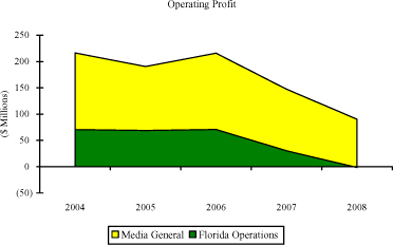
While the signs of a weakening economy were noticeable toward the end of 2006 and more pronounced throughout the following year, 2008 ushered in nearly unprecedented economic turmoil. Most companies, and particularly those in the media industry, were directly impacted by the adverse effects on consumer confidence and consequential lower advertiser spending levels. The Company’s Florida Market (which include The Tampa Tribune, WFLA-TV, and TBO.com) was the first of the Company’s markets to be materially impacted, as a housing-induced recession in Florida which began in late 2006 served as an indicator of what was to follow throughout the country; unfortunately, many of the Company’s other markets are following similar paths. The following chart illustrates the sharp drop in operating profits at the Company’s Florida Market in the later part of 2006 and throughout 2007, culminating with a small operating loss by the close of 2008. Unfavorable market conditions in the Tampa Bay region in 2008 and 2007 were amplified because they followed several years of booming growth in that area. Prior to 2006, the Florida Market contributed meaningfully to the Company’s year-over-year rise in operating profits; however, beginning in late 2006, it was responsible for a sizeable portion of the decline in operating profits.
1
Advertising sales comprise the main source of the Company’s revenue. The distribution of advertising revenues in the United States continues to shift among numerous established media, as well as many new entrants, resulting in increased competition. The Company recognizes the impending challenges facing its geographic regions, not only from Internet competition, but also from structural changes in industries that have historically been major purchasers of print advertising, from a floundering economy punctuated by a sharp downturn in Florida’s economy, and from an upcoming odd-numbered year which translates into the absence of Political and Olympic advertising for the television operations. The Company itself can do little to influence the weak economy or change the cyclical nature of odd-numbered years, but it has made strategic plans to capitalize on the expansion of Web-based advertising. While the pace and intensity of a shift away from traditional print advertising remains a concern, the Internet and all of its potential presents tremendous opportunity. Maximizing this potential is a key strategy of all of the Company’s geographic markets.
The Company has created a “Web-First” approach to news reporting which provides an immediate platform for breaking news and positions the digital media in each of its geographies for strong long-term growth. Additionally, the Company continues to focus on cultivating key partnership opportunities with established online presences such as Yahoo!, on creating ways to grow revenues through niche publications (by expanding and building upon the success of its over 200 weekly newspapers and targeted publications), and on facilitating the success of its interactive advertising services companies which represent a valuable and expanding source of revenues.
ACQUISITIONS AND DISPOSITIONS
In 2007, several plans were set in motion which allowed for a substantial reduction in debt in 2008, a renewed focus on the Company’s core business as a pure media company, and a heightened focus on the expanding role of interactive media service companies. In 2008, the
2
Company purchased Dealtaker.com, an online social shopping portal that provides coupons and bargains to its users, and NetInformer, a leading provider of mobile advertising and marketing services. Additionally, the Company sold its one-third ownership stake in SP Newsprint Company to White Birch Paper Company. That sale substantially reduced the earnings volatility the Company experienced in recent years due to the highly cyclical nature of newsprint prices. Additionally, the Company sold four TV stations and their associated websites in three transactions in 2008 including WTVQ in Lexington, Kentucky, WMBB in Panama City, Florida, KALB/NALB in Alexandria, Louisiana, and WNEG in Toccoa, Georgia. The Company also completed the sale of WCWJ in Jacksonville, Florida, in the second quarter of 2009. Primarily as a result of proceeds generated from these divestitures, long-term debt was reduced by more than $165 million in 2008. The sale of WCWJ resulted in a reduction of approximately $16 million in long-term debt in 2009.
In 2006, the Company acquired four NBC owned and operated television stations and disposed of several CBS stations in markets which were not strategically aligned with the Company’s vision. The stations acquired included WNCN in Raleigh, North Carolina, WCMH in Columbus, Ohio, WVTM in Birmingham, Alabama, and WJAR in Providence, Rhode Island. This acquisition expanded the Company’s southeastern footprint to include the key Raleigh-Durham market. The divested stations included KWCH in Wichita, Kansas (including that station’s three satellites), WIAT in Birmingham, Alabama (as agreed upon when granted FCC approval for the purchase of WVTM in Birmingham), WDEF in Chattanooga, Tennessee, and KIMT in Mason City, Iowa.
CRITICAL ACCOUNTING ESTIMATES AND ASSUMPTIONS
The preparation of financial statements in accordance with generally accepted accounting principles in the United States (GAAP) requires that management make various estimates and assumptions that have an impact on the assets, liabilities, revenues, and expenses reported. The Company considers an accounting estimate to be critical if that estimate requires assumptions be made about matters that were uncertain at the time the accounting estimate was made, and if changes in the estimate (which are reasonably likely to occur from period to period) would have a material impact on the Company’s financial condition or results of operations. The Audit Committee of the Board of Directors has reviewed the development, selection and disclosure of these critical accounting estimates. While actual results could differ from accounting estimates, the Company’s most critical accounting estimates and assumptions are in the following areas:
Intangible assets
The Company reviews the carrying values of both goodwill and other identified intangible assets, including FCC licenses, in the fourth quarter each year, or earlier if events indicate impairment may have arisen, utilizing discounted cash flow models and market-based models. The preparation of the discounted cash flow models requires significant management judgment with respect to revenue growth, compensation levels, newsprint prices, discount rates and market trading multiples for broadcast and newspaper assets. The preparation of the market-based models requires the collection of estimated peer company data as to revenues and EBITDA, as well as an assessment of enterprise values by looking at stock prices and debt levels. These key assumptions for both the discounted cash flow and market-based models work in concert with one another. Changes to one variable may necessitate changes to other variables. Challenging business conditions and the market’s perception of the value of media company stocks prompted the Company to perform an interim impairment test as of the end of the second quarter in 2008 that resulted in an impairment charge in that quarter. The Company performed its annual impairment test at the beginning of the fourth quarter of 2008 with no additional impairment
3
indicated. However, business conditions worsened during the fourth quarter, and the market’s perception of the value of media company stocks deteriorated further resulting in both another interim impairment test and the recognition of additional impairment as of December 28, 2008.
As 2009 progressed, it became clear that the anticipated economic recovery would be delayed, leading the Company to perform a second-quarter 2009 interim impairment test, with no impairment indicated. Several developments in the third quarter of 2009 had relevance for purposes of impairment testing. First, at the beginning of the quarter the Company changed its structure from one organized by division (media platform) to one organized primarily by geographic market (see Note 6 to the Financial Statements in Exhibit 99.7 of this Form 8-K). At the same time, the Company reallocated goodwill in accordance with the new market structure. Second, the market’s perception of the value of media stocks rose considerably, which contributed to an increase of approximately $50 million in the estimated fair value of all of the Company’s reporting units in total. Third, there were signs of the economy bottoming out. However, continued lackluster consumer spending in the quarter resulted in further ad revenue erosion, and the Company’s expectation regarding a recovery in ad spending was delayed into 2010. These factors, together with the more granular testing required by accounting standards as a result of the Company’s new reporting structure, resulted in the recognition of additional impairment from the third-quarter 2009 impairment test. As a result of the testing performed in the third quarter of 2009, the Company recorded non-cash impairment charges related to goodwill totaling approximately $66 million and FCC licenses, network affiliation and other intangibles of approximately $18 million.
Since the estimated fair values that arise in both the discounted cash flow and market-based models are subject to change based on the Company’s performance and stock prices, peer company performance and stock prices, overall market conditions, and the state of the credit markets, future impairment charges are possible.
Pension plans and postretirement benefits
The determination of the liabilities and cost of the Company’s pension and other postretirement plans requires the use of assumptions. The actuarial assumptions used in the Company’s pension and postretirement reporting are reviewed annually with independent actuaries and compared with external benchmarks, historical trends, and the Company’s own experience to determine that its assumptions are reasonable. The assumptions used in developing the required estimates include the following key factors:
| • | Discount rates |
| • | Expected return on plan assets |
| • | Salary growth |
| • | Mortality rates |
| • | Health care cost trends |
| • | Retirement rates |
| • | Expected contributions |
A one percentage-point change in the expected long-term rate of return on plan assets would have resulted in a change in pension expense for 2008 of approximately $3 million. A one percentage-point change in the discount rate would have raised or lowered by more than $4 million the plans’ 2008 expense and would have changed the plans’ projected obligations by approximately $55 to $65 million as of the end of 2008. Effective for fiscal 2007, the Company redesigned its defined benefit and defined contribution retirement plans and also added certain new employee benefit programs. The changes included: freezing the service accrual in the defined benefit retirement plan for existing employees (while closing this plan to new employees), increasing the maximum
4
company match in the 401(k) defined contribution plan to 5% from 4% of an employee’s earnings (the entire match has been suspended effective April 1, 2009), adding a profit sharing feature to the 401(k) plan, and establishing new retiree medical savings accounts. The Company took these steps to reduce the volatility of future pension expense and contributions while continuing to offer competitive retirement benefits to its employees. Subsequent to the close of 2008, the Company took the final steps to fully freeze all benefits under its retirement plans.
Self-insurance liabilities
The Company self-insures for certain medical and disability benefits, workers’ compensation costs, and automobile and general liability claims with specified stop-loss provisions for high-dollar claims. The Company estimates the liabilities for these items (approximately $20 million at December 28, 2008) based on historical experience and advice from actuaries and claim administrators. Actual claims experience as well as changes in health care cost trends could result in the Company’s eventual cost differing from the estimate.
Income taxes
The Company files income tax returns with various state tax jurisdictions in addition to the Internal Revenue Service and is regularly audited by both federal and state tax agencies. From time to time, those audits may result in proposed adjustments. The Company has considered the alternative interpretations that may be assumed by the various tax agencies and does not anticipate any material impact on its earnings as a result of the various audits. The Company adopted Interpretation No. 48, Accounting for Uncertainty in Income Taxes – an interpretation of FASB Statement No. 109, in the first quarter of 2007. This interpretation requires that income tax positions recognized in an entity’s tax returns have a more-likely-than-not chance of being sustained prior to recording the related tax benefit in the financial statements. If subsequent information becomes available that changes the more-likely-than-not assessment of either a previously unrecognized or recognized tax benefit, the corresponding tax benefit or expense would be recorded in the period in which the information becomes available.
The Company records income tax expense and liabilities in accordance with SFAS No. 109, Accounting for Income Taxes, under which deferred tax assets and liabilities are recorded for the differing treatments of various items of income and expense for financial reporting versus tax reporting purposes. Under this standard, the Company evaluates the need, if any, for a valuation allowance for deferred tax assets. The Company ordinarily bases its estimate of deferred tax assets and liabilities on current tax laws and rates as well as expected future income. However, the Company was in a net deferred tax asset position at the end of 2008 and, although the Company fully expects to utilize the underlying tax benefits, it could not assume future taxable income due to a cumulative book loss in recent years (the direct result of non-cash intangible asset impairment charges) and therefore, established a valuation allowance.
Due to the requirements of accounting interpretations related to the Company’s amortization of intangible assets for income tax purposes, the Company anticipates recording additional deferred tax valuation allowance of $30 million, $25 million and $23 million in 2010, 2011, and 2012, respectively. This additional valuation allowance will be recorded as a non-cash charge to income tax expense. An explanation of this additional valuation allowance as well as a description of the situation and events that would alter it are described fully in Note 4 to the Company’s 2009 third quarter Form 10-Q. Significant changes in enacted federal and state tax laws or in expected future earnings might impact income tax expense and deferred tax assets and liabilities as well as the valuation allowance.
5
Summary
Management believes, given current facts and circumstances, supplemented by the expertise and concurrence of external resources, including actuaries and accountants, that its estimates and assumptions are reasonable and are in accordance with GAAP. Management further believes that the assumptions and estimates actually used in the financial statements, taken as a whole, represent the most appropriate choices from among reasonably possible alternatives and fairly present the financial position, results of operations and cash flows of the Company. Management will continue to discuss key estimates with the Audit Committee of the Board of Directors.
RESULTS OF OPERATIONS
Net income
The Company recorded a net loss of $632 million in 2008, and net income of $11 million and $79 million in 2007 and 2006, respectively. In order to facilitate a meaningful comparison of results for the last three years, several items merit separate consideration. Challenging business conditions and the market’s perception of the value of media company stocks prompted the Company to perform an interim impairment test as of the end of the second quarter in 2008 that resulted in an impairment charge in that quarter. The Company performed its annual impairment test at the beginning of the fourth quarter of 2008 with no additional impairment indicated. However, business conditions worsened during the fourth quarter, and the market’s perception of the value of media company stocks deteriorated further, resulting in an additional impairment at the end of 2008. As a result of this testing, in 2008 the Company recorded aggregate impairment charges related to goodwill of $512 million for publishing operations, FCC licenses of $289 million, network affiliation agreements of $103 million, trade names and other intangible assets related to broadcast operations of $2.2 million, and certain investments and real estate of $5.7 million, resulting in after-tax non-cash impairment charges totaling $615 million. For a more complete discussion regarding these impairment charges, see Note 3 to the Financial Statements in Exhibit 99.7 of this Form 8-K. As indicated earlier, the Company completed the sale of four television stations in 2008 and recorded after-tax losses of $11.3 million in 2008 and $2 million in 2007 related to these divestitures. Additionally, the Company sold several CBS stations in 2006 resulting in an after-tax gain of $11 million. The results of the sold stations (and their associated web sites), WCWJ (sold in the second quarter of 2009) and a small Virginia magazine (sold in the third quarter of 2009) have been reported as discontinued operations for all years presented. See Note 2 in Exhibit 99.7 of this Form 8-K for a detailed discussion of the Company’s acquisitions and divestitures.
The Company also consummated the sale of SP Newsprint Company (SPNC) in the second quarter of 2008 and increased the year-end pre-tax sale-related costs and write-downs it originally recorded in 2007 of approximately $15 million by another $1.6 million in 2008 based on the estimated value of certain post-closing items. In addition to these losses, the Company’s share of SPNC’s underlying operating results was a loss of $16.3 million in 2007 compared to income of $10.5 million in 2006. The decline in 2007 was due to the impact of lower newsprint prices and higher raw material costs in that year. The total after-tax impact of the SP Newsprint operations was an after-tax loss of $1 million and $18.7 million in 2008 and 2007, respectively, and after-tax income of $6.4 million in 2006. See Note 4 in Exhibit 99.7 of this Form 8-K for a more complete discussion of the SPNC sale. The remainder of this discussion focuses only on results from continuing operations.
6
In an effort to better align its costs with the current business environment, the Company implemented various cost-reduction plans which included voluntary and non-voluntary separation programs. These workforce reductions were in response to a general economic downturn, and particularly, to the deep housing-induced recession in the Florida market. As the Company reduced its workforce, severance costs of $10.9 million, $3 million, and $1 million were included in operating expenses for 2008, 2007, and 2006, respectively. Accrued severance costs are included in “Accrued expenses and other liabilities” on the Consolidated Balance Sheet. The following summarized the activity in accrued severance for these workforce reductions:
| (In thousands) |
Virginia/ Tennessee |
Florida | Mid- South |
North Carolina |
Ohio/ Rhode Island |
Advertising Services & Other |
Corporate | Consolidated | ||||||||||||||||||||||||
| Accrued severance-12/31/2006 |
$ | — | $ | — | $ | — | $ | — | $ | — | $ | — | $ | — | $ | — | ||||||||||||||||
| Severance expense |
341 | 1,594 | 212 | 156 | 41 | 459 | 154 | 2,957 | ||||||||||||||||||||||||
| Severance payments |
(332 | ) | (1,332 | ) | (212 | ) | (156 | ) | (41 | ) | (301 | ) | (154 | ) | (2,528 | ) | ||||||||||||||||
| Accrued severance-12/30/2007 |
9 | 262 | — | — | — | 158 | — | 429 | ||||||||||||||||||||||||
| Severance expense |
1,474 | 4,939 | 1,445 | 712 | 1,124 | 301 | 913 | 10,908 | ||||||||||||||||||||||||
| Severance payments |
(613 | ) | (3,679 | ) | (359 | ) | (329 | ) | (217 | ) | (238 | ) | (746 | ) | (6,181 | ) | ||||||||||||||||
| Accrued severance-12/28/2008 |
$ | 870 | $ | 1,522 | $ | 1,086 | $ | 383 | $ | 907 | $ | 221 | $ | 167 | $ | 5,156 | ||||||||||||||||
In 2008, there was a $98.9 million (11%) decrease in revenues. Mitigating the significant drop in revenues were cost containment efforts put in place beginning in the Florida market in 2007 and continuing throughout the rest of the geographic markets in 2008. These cost containment efforts resulted in a $60 million, or 7.4%, decrease in operating costs (excluding severance and costs related to consolidation of printing facilities). Partially offsetting the downturn in year-over-year operating results were: a 27% decrease in interest expense in the current year (due to lower interest rates and decreased average debt levels), a $4 million increase in gains on fixed asset sales, a $3.3 million reduction in intangibles amortization expense due primarily to the write down of network affiliation assets resulting from the mid-year impairment charge, and lower costs for performance-based incentives. Additionally, the Company recorded a deferred tax valuation allowance in 2008, $7.5 million of which was recorded in income tax expense (See Note 7 to the Financial Statements in Exhibit 99.7 of this Form 8-K).
In 2007, the Company recorded a $17.6 million pre-tax gain on an insurance settlement related to a fire at the Company’s Richmond Times-Dispatch printing facility that occurred in the second quarter of that year; an additional $3.3 million pre-tax gain was recorded in 2008 as the Company identified a more cost-effective method to clean the equipment and remediate the facility than previously anticipated. Additionally, fiscal 2006 included an extra (53rd) week, which contributed approximately $18 million in revenues and $2.5 million to net income and, accordingly, influenced virtually all comparisons of 2007 and 2006 results.
In 2007, two factors contributed almost equally to the year-over-year downturn from 2006. First, revenue declined $33 million from the prior year, reflecting substantially reduced political advertising in the odd-numbered year. Second, operating profits fell as all major advertising categories were down from the prior year due in large part to the pronounced
7
economic downturn in Florida’s economy. Also impacting the first half of 2007 was higher interest expense as a result of increased debt levels associated with the acquisition of the NBC stations acquired in the third quarter of 2006.
Segment Results
As previously mentioned, the third quarter of 2009 marked the beginning of the Company’s shift from three platform-based divisions to five geographic market segments and a sixth segment that includes the Company’s interactive advertising services and certain other operations; collectively, they contain all of the operations that were formerly part of the Publishing, Broadcast and Interactive Media segments. The geographically-managed segments are: Virginia/Tennessee, Florida, Mid-South, North Carolina, and Ohio/Rhode Island.
Geographic Markets
Revenues
Revenues are grouped in the following classifications within their geographic segments:
| (in millions) 2008 |
Virginia/ Tennessee |
Florida | Mid- South |
North Carolina |
Ohio/ Rhode Island |
Total Geographic Markets | ||||||||||||
| Advertising |
$ | 186.6 | $ | 179.4 | $ | 151.7 | $ | 89.4 | $ | 58.3 | $ | 665.4 | ||||||
| Subscription/Content/Circulation |
38.1 | 10.5 | 9.6 | 11.7 | 1.1 | 71.0 | ||||||||||||
| Other |
7.8 | 11.4 | 10.2 | 4.3 | 3.5 | 37.2 | ||||||||||||
| 2007 |
||||||||||||||||||
| Advertising |
$ | 219.3 | $ | 232.9 | $ | 161.7 | $ | 95.1 | $ | 56.6 | $ | 765.6 | ||||||
| Subscription/Content/Circulation |
37.7 | 10.1 | 9.1 | 10.7 | — | 67.6 | ||||||||||||
| Other |
8.9 | 10.4 | 9.4 | 4.5 | 4.0 | 37.2 | ||||||||||||
| 2006 |
||||||||||||||||||
| Advertising |
$ | 224.4 | $ | 288.6 | $ | 157.4 | $ | 90.2 | $ | 42.7 | $ | 803.3 | ||||||
| Subscription/Content/Circulation |
39.8 | 10.9 | 8.4 | 11.1 | — | 70.2 | ||||||||||||
| Other |
10.0 | 8.3 | 11.6 | 4.3 | 1.1 | 35.3 | ||||||||||||
In general, advertising revenue is derived from four sources: Local, National, Classified and Political. While a tough advertising market plays a significant role in lower Local and National advertising revenues, in 2008 this trend was somewhat mitigated by the 2008 Summer Olympics. In 2008, Local revenues were down due to lower general advertising levels in reaction to the stunted economy; categories which struggled the most over the past three years included the department store, home improvement and home furnishing categories. National revenues fell primarily due to weak spending levels in the automotive, telecommunications and pharmaceutical categories. The 2007 Local and National revenues increased due to the 2006 acquisitions.
Classified advertising suffered the largest portion of the revenue decline as employment, automotive and real estate advertising decreased in virtually all markets, but particularly in the Florida market, where Classified fell 44% in 2008 and 54% in 2007 from the prior year equivalent period. The decline in Classified results would have been more severe had it not been for the Company’s relationship with Yahoo! HotJobs which allowed for higher rates due to the increase in volume brought about by that relationship. Total consolidated Local, National and Classified advertising trends, year over year are as follows:
| Year-to-date Change | ||||||
| 2008 vs 2007 |
2007 vs 2006 |
|||||
| Local |
-8.9 | % | 5.3 | % | ||
| National |
-19.6 | % | 12.6 | % | ||
| Classified |
-30.3 | % | -21.0 | % | ||
8
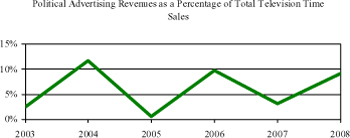
Broadcast political advertising time sales are typically elevated in even-numbered years as a result of the national and statewide political races which generate additional advertising dollars. These events, or their absence in a given year, cause a certain cyclicality which is demonstrated in the following graph that shows Political advertising as a percentage of total television time sales.
Revenues in the Virginia/Tennessee Market fell $33.4 million or 12.6% in 2008 compared to 2007 and fell $8.3 million or 3.1% in 2007 compared to 2006. In 2008, decreased Local and Classified advertising of approximately $32 million were the largest contributors to the year-over-year declines driven by the current recession-induced environment. Improved Political advertising and subscription revenue in 2008 were largely offset by decreased National advertising. In 2007, the majority of the decrease in revenue was attributable to reduced Classified and Political advertising.
Revenues in the Florida Market were responsible for over half the total consolidated revenue decline in 2008 and over two-thirds of the revenue decline in 2007 as the market remains in a pronounced recession. The revenue decreases of $52.2 million, or 20.6%, in 2008 compared to 2007 and $54.4 million, or 17.7%, in 2007 compared to 2006 reflected the significantly weakened advertising environment across all sources of advertising dollars. Only Political advertising revenues in 2008 slightly mitigated this trend with a $5.6 million improvement year-over-year due to strong spending associated with the presidential campaigns, U.S. congressional races, and issue spending. A predictable, but nonetheless large ($9.5 million), decline in Political advertising exacerbated the 2007 lower revenue trend.
Revenues in the Mid-South Market fell $8.7 million, or 4.8%, in 2008 compared to 2007 and increased $2.8 million, or 1.6%, in 2007 compared to 2006. With 11 of the Company’s 18
9
network-affiliated television stations, the Mid-South Market is significantly influenced by Political advertising. Political advertising improved $6.7 million in 2008 from 2007 with the strong election year offsetting in part the decline in Local and National advertising due to weakness in the automotive advertising category. In 2007, political advertising declined $9.8 million from 2006 which was more than offset by the improved revenue generated from having a full year of operating results for the 2006 acquisitions.
Revenues in the North Carolina Market declined 4.5% in 2008 and increased 4.4% in 2007 from the comparable periods in 2007 and 2006. In 2008, the North Carolina Market’s decrease in Local, National and Classified advertising was partially offset by a $7 million improvement in Political advertising revenues from the segment’s two broadcast stations (similar to the Mid-South Market) and a $1 million increase in subscription/content/circulation revenues reflecting meaningful progress in increasing cable and satellite retransmission revenues. In 2007, the Company saw improved revenues generated from the impact of a full year of the 2006 acquisition of one NBC affiliated station.
Revenues in the Ohio/Rhode Island Market improved $2.3 million or 3.9% in 2008 compared to 2007 and improved $16.8 million or 38.2% in 2007 compared to 2006. The Ohio/Rhode Island Market is comprised of two of the NBC affiliated stations acquired in 2006 and their websites; as such it is the Company’s only geographic market which does not include any newspaper operations and is consequently less influenced by Classified advertising, but more affected by the ebb and flow of Political and Olympic revenues in corresponding odd and even-numbered years. In 2008, Political advertising improved $10.3 million which more than offset the economic-based decreases in Local and National advertising; subscription/content/circulation revenues improved $1.1 million due to increases in retransmission fees. The 2007 improvement in revenue reflects a full year’s results for the acquired stations.
Operating Expenses
The Company has reacted to the challenging advertising environment by reducing costs across all markets while achieving greater efficiencies and implementing aggressive actions to better align expenses with current economic opportunities. This included a workforce reduction across the entire Company which resulted in an approximate 18% decrease in personnel from the end of 2006 to the end of 2008. As discussed previously, the Company’s results included pretax charges of approximately $10.9 million, $3 million and $1 million in 2008, 2007, and 2006, respectively, which were comprised of severance costs as the result of workforce reductions in most operations. Excluding the aforementioned severance costs, total employee compensation expense decreased a substantial 6.7% from 2007 due to the combination of several factors, including: the elimination of positions, lower commissions, and the absence of profit sharing expense in 2008.
In 2008 and 2007, production costs were down primarily due to lower newsprint costs. In 2008, despite higher average newsprint prices per ton, (up $73 per ton to $613 per ton), newsprint costs were down $6 million due to reduced consumption as a result of newspaper redesigns, lower advertising linage, decreased circulation volumes, and concerted conservation efforts. In 2007, newsprint costs were down $16.1 million due to reduced consumption as a result of switching to lighter weight newsprint, concerted conservation efforts and decreased advertising and circulation volumes, as well as to lower average newsprint prices which were down $58 per ton. Additionally, the consolidation of certain production facilities helped to reduce production costs.
10
In both 2008 and 2007, selling general and administrative expense reductions were derived from savings in the areas of circulation sales, promotion and repairs and maintenance, particularly in the Florida Market. In 2008 and 2007 depreciation increased $1.8 million and $6.1 million resulting from capital spending for the replacement of certain newspaper production facilities and due to new digital broadcast equipment which the Company had virtually completed and put in place as part of the government-mandated conversion to broadcast high definition television by the end of 2007.
Operating expenses in the Virginia/Tennessee Market decreased $9.3 million in 2008 compared to 2007 and decreased $6.9 million in 2007 compared to 2006. Consistent with the overall trend, lower employee compensation costs made up a significant portion of the operating expense decrease; compensation costs before severance decreased $7.1 million (7.4%) and $5.2 million (5.4%) in 2008 and 2007, respectively, compared to the prior year. Additionally, reductions in newsprint costs of $1.9 million in 2008 and $4.8 million in 2007 contributed to the 2008 and 2007 cost decreases, partially offset by increases in depreciation.
Responding to the difficult operating environment in Florida, the reduction in operating expenses of $20.3 million in the Florida Market represented over half of the Company’s operating expense reductions in 2008. Excluding the severance costs, the Florida operations reduced employee compensation costs by $12.3 million, or 12.5%, and newsprint costs decreased $3.8 million. In addition to the areas of expense reduction already discussed, the Florida Market further reduced departmental costs by approximately $6 million due to savings in circulation sales, promotion and repairs and maintenance. In 2007, the Florida Market reduced operating expenses by $13.9 million from 2006 levels. Similar to 2008, the 2007 reductions were achieved through staff reductions of 9%, newsprint savings and elimination of selling, general and administrative costs.
Operating expenses in the Mid-South Market, which has a higher concentration of television stations, decreased 2.3% in 2008 compared to 2007 primarily due to a concerted effort to reduce advertising and promotion expenses, travel and entertainment, marketing and compensation costs (through a 7% reduction in employee headcount). These reductions were offset in part, by severance costs and increased production costs.
Operating expense decreases in 2008 in the North Carolina market are consistent with the overall trend of reduced headcount (down 6%), reduced newsprint costs and a focus on driving down the more discretionary spending for repairs and maintenance, promotional and marketing costs.
Operating expenses in the Ohio/Rhode Island Market decreased 2.6% in 2008 compared to 2007 largely driven by reductions in departmental spending primarily in the more discretionary areas of marketing and promotion.
In 2007, operating expenses increased in the Mid-South, North Carolina and Ohio/Rhode Island Markets compared to 2006 due to a full year of operations for the NBC affiliated stations acquired in 2006.
Advertising Services & Other
Advertising Services & Other (ASO) primarily includes:
| • | Blockdot - a leading advergaming business; |
11
| • | Dealtaker.com - an online social shopping portal that was acquired at the beginning of the second quarter of 2008; |
| • | NetInformer - a leading provider of mobile advertising and marketing services purchased in the fourth quarter of 2008; |
| • | Production Services - comprised primarily of a provider of broadcast equipment and studio design services. |
Revenues in the Advertising Services & Other segment decreased $7.8 million in 2008 compared to 2007 as the result of two factors. First, sales in Production Services fell $11.8 million as the digital conversion to broadcast high definition was substantially completed at the end of 2007 and second, sales at Blockdot were down $2.3 million as the pace of advergaming sales reflected the sluggish economy. These reductions were offset, in part, by the acquisition in the first half of 2008 of DealTaker.com, which generated revenues of $5.7 million in 2008. In 2007, Advertising Services & Other revenues increased $6.5 million primarily due to the growth of Blockdot, where advergaming revenues tripled.
Operating costs were down 21% in 2008 due largely to Production Services. Costs were up $6 million (20.6%) in 2007 primarily due to $1.9 million in increased operating costs at Blockdot and a write-down of $2.7 million of interactive investments.
Operating Profit (Loss)
The following chart shows the change in operating profit by market; the year-over-year movement in market operating profit was driven by the underlying fluctuations in revenue and expense as detailed in the previous discussion.
Change in Operating Profit/(Loss)
| 2008 versus 2007 | 2007 versus 2006 | |||||||||||||
| ($ in millions) |
Amount | Percent | Amount | Percent | ||||||||||
| Virginia/Tennessee |
$ | (24.1 | ) | (37.2 | ) | $ | (1.3 | ) | (2.0 | ) | ||||
| Florida |
(31.7 | ) | — | (40.5 | ) | (57.2 | ) | |||||||
| Mid-South |
(5.3 | ) | (17.5 | ) | (8.4 | ) | (21.7 | ) | ||||||
| North Carolina |
(2.6 | ) | (18.0 | ) | (3.2 | ) | (18.4 | ) | ||||||
| Ohio/Rhode Island |
3.6 | 35.5 | (9.5 | ) | (48.0 | ) | ||||||||
| Advertising Services & Other |
2.3 | — | 0.3 | (26.5 | ) | |||||||||
| Eliminations/Disc. Ops |
0.7 | 36.6 | 1.3 | 43.3 | ||||||||||
| $ | (57.1 | ) | (38.8 | ) | $ | (61.3 | ) | (29.4 | ) | |||||
In 2008, the Virginia/Tennessee and Florida Markets were responsible for the majority of the operating profit shortfall from the prior year. Lower operating expenses in these markets were unable to overcome decreased revenues. Both markets were impacted by significantly reduced advertising in their publishing operations as compared to the other geographic markets with significant broadcast stations which benefitted from strong 2008 Political advertising revenue. Advertising Services & Other operating profit benefitted from the second-quarter 2008 acquisition of DealTaker.com which produced robust operating profits of $3.9 million.
In 2007, the Florida Market’s economic decline and increased depreciation expenses were largely responsible for the decrease in operating profits. Operating profits in 2007 in the
12
Mid-South, North Carolina and Ohio/Rhode Island Markets were impacted by higher employee compensation from higher sales commissions as the Company worked to replace Political revenues through sales development initiatives and higher depreciation costs which increased over 10% on new digital equipment in 2007 across the Company for the government-mandated conversion to broadcast high definition television.
Interest expense
Interest expense decreased $16.1 million in 2008 from the prior year due almost equally to a decrease in the Company’s average effective borrowing rate of 100 basis points (to 5.35%) and to an approximate $105 million decline in average debt levels, primarily the result of the application of proceeds from the sales of SP Newsprint and four television stations to debt reduction during 2008.
In the third quarter of 2006, the Company entered into three interest rate swaps (where it pays a fixed rate and receives a floating rate) to manage interest cost and cash flows associated with variable interest rates, primarily short-term changes in LIBOR, not to trade such instruments for profit or loss. The interest rate swaps are carried at fair value based on a discounted cash flow analysis (predicated on quoted LIBOR prices) of the estimated amounts the Company would have received or paid to terminate the swaps. These interest rate swaps are cash flow hedges with notional amounts totaling $300 million; swaps with notional amounts of $100 million matured in 2009, and $200 million will mature in 2011. Changes in cash flows of the interest rate swaps offset changes in the interest payments on the Company’s $300 million bank term loan. These swaps effectively convert the Company’s variable rate bank debt to fixed rate debt with a weighted average interest rate approximating 7.3% at December 28, 2008.
Income taxes
The Company’s effective tax rate on income (loss) from continuing operations was 32% (on a pre-tax loss), 24% (on pre-tax income, including a one-time tax benefit discussed below) and 37% (on pre-tax income) in 2008, 2007 and 2006, respectively. The increase in the 2008 rate was due primarily to the absence of the state tax benefit recognized in 2007. The sharp reduction in the 2007 rate was due to the relatively greater impact that favorable permanent differences (book versus tax) had on the current year’s reduced pre-tax income and to a tax benefit of $786 thousand that the Company recognized in the third quarter of 2007 to record the favorable resolution of an outstanding state income tax assessment.
As of December 28, 2008, the Company established a valuation allowance against its entire net deferred tax asset of $47.6 million because cumulative pretax income in recent years was in an overall loss position primarily due to the current-year impairment charges. There was no valuation allowance as of December 30, 2007. A portion of the valuation allowance ($7.5 million) affected the Consolidated Statement of Operations and was reflected in the Company’s 2008 effective tax rate of 32%; the remainder affected comprehensive income items. See Note 7 to the Financial Statements in Exhibit 99.7 for a complete discussion of the Company’s deferred tax asset valuation allowance.
The Company adopted the provisions of FASB Interpretation No. 48, Accounting for Uncertainty in Income Taxes – an interpretation of FASB Statement No. 109 at the beginning of fiscal 2007. The Company recognized a $4.9 million net increase in the liability for uncertain tax positions, which was accounted for as a reduction of retained earnings, as of January 1, 2007. See Note 7 to the Financial Statements in Exhibit 99.7 for a complete discussion of the adoption of this standard and the roll-forward of the liability of uncertain tax positions.
13
Other
The Company has certain plans in place, mainly the Supplemental 401(k) Plan and the Director’s Deferred Compensation Plan, which are designed to align the interests of the participants with those of the shareholders. Future fluctuations in the Company’s stock price could have a significant effect on the amount of expense recognized. Each $1 change in the Company’s stock price as of September 27, 2009 would have affected the Company’s pre-tax income by approximately $.3 million.
LIQUIDITY
The country has been faced with both an economic crisis, the effect of which on the Company’s operating results has been discussed earlier, and a credit crisis, which has also impacted the Company. However, the steps that the Company has taken to lower its debt levels and renegotiate its bank agreements, plus other available operating measures, should allow the Company the flexibility necessary to operate within the debt covenants at a cost that is manageable.
Entering 2006, the Company had in place a $1 billion revolving credit facility ($180 million outstanding), $200 million in senior notes, $95 million in debt that existed as the result of consolidating certain variable interest entities in which the Company had controlling financial interest by virtue of certain real property leases, and $10 million in bank lines. The Company was subject to both interest coverage and leverage ratio covenants. This debt structure not only served the Company’s operating needs but allowed the Company to make significant strategic acquisitions like the purchase of four NBC stations in mid-2006 when total debt outstanding reached a peak of $1.06 billion. Subsequent to that acquisition, the Company announced a plan to lower its debt through a combination of television station sales and by using operating cash flow to repay debt. By the end of 2006, the Company had replaced the $200 million of senior notes with a $300 million bank term loan and completed the sales of certain television stations with gross proceeds of $135 million. However, its operating performance, particularly in its largest market in Florida, began to weaken late in the year. The Company repaid $144 million of the outstanding debt in the later half of 2006 even with capital spending of $94 million mostly related to the government-mandated conversion to digital television and replacement of certain newspaper production facilities.
As the wider economy deteriorated in 2007, the weakness in Tampa deepened and the Company’s other markets were affected to a greater degree. Even as the Company was taking steps on the operating side to reduce its expenses, it reassessed its portfolio of assets and initiated the process to sell its interest in SP Newsprint and certain other television stations. During that year it also repaid the $95 million of variable interest debt by using existing capacity under its revolving credit facility. In the fourth quarter of 2007, the Company amended certain provisions of its debt agreements to increase the maximum leverage ratio covenant and reduce the minimum interest ratio covenant for a period of three fiscal quarters. The Company’s covenants have historically involved - and continue to involve - debt levels, interest expense, and a rolling four-quarter calculation of EBITDA (a measure of cash earnings as defined in the revolving credit agreement) and thus a decline in operating performance adversely affects these ratios. Despite these difficult economic times and capital expenditures that totaled $78 million, the Company repaid $19 million of debt in 2007.
Unfortunately, both the wider economy and the Company’s markets worsened in 2008. The Company took additional steps on the operating side to reduce costs. During the year, it also
14
completed the sale of SP Newprint and four television stations (the Company entered into an agreement for the sale of a fifth station, WCWJ, which was completed in the second quarter of 2009) yielding aggregate proceeds of $138 million. The Company also reduced its capital spending to $32 million as expenditures for digital television and newspaper production facility replacements were largely completed, and in the fourth quarter it cut its dividend approximately in half. The Company made acquisitions totaling $24 million in 2008, primarily targeting online and Advertising Services companies reflecting the strategic direction in which the Company is headed. The Company repaid debt of $168 million during 2008. The Company also amended its credit agreements just before the end of 2008.
At the end of 2008, the Company’s debt consisted of a modified revolving credit facility of $600 million ($425 million outstanding at year end), the term loan of $300 million, and $5 million outstanding under bank lines. These facilities mature in 2011. Pursuant to the 2008 amendments, the maximum leverage ratio covenants were increased for the fourth quarter of 2008 and the first quarter of 2009; they will subsequently be reduced slightly for the remainder of 2009 and for the first three quarters of 2010, and will remain at a constant level thereafter. The minimum interest coverage ratio covenant was also reduced through the first quarter of 2009 and will be increased slightly for the remaining term of the Facilities. The borrowing capacity on the modified revolving credit facility was reduced from $1 billion to $600 million, and interest rate margins on both facilities were increased. Additional annual borrowing capacity reductions will be made based on the Company’s excess cash flow, as defined. If the leverage ratio were to exceed certain levels, the amended agreements also contain restrictions on dividends, capital spending, indebtedness, capital leases, and investments. The Company pledged its cash and assets and the capital stock of its subsidiaries as collateral.
Since mid-2006, the Company has repaid $330 million of debt. It has also taken actions to be fully compliant with its covenants, and it continues to take prudent actions to ensure it will be in compliance with its covenants going forward. In January 2009, the Company announced the suspension of dividends to shareholders. Additionally, in order to continue to address operating costs for 2009, the Company suspended the 401(k) match for the last nine months of the year and does not anticipate paying profit sharing or management bonuses (neither of which were paid in 2008). Capital spending will be limited as well. The Company’s current operating plan contemplates further debt reduction in 2009. Given the economic climate facing the country, there is uncertainty about the Company’s operating results in the short term but the Company is closely monitoring operating results and their effect on debt covenants. The Company believes that its operating cash flow over the next year together with its debt agreements provides the necessary flexibility to manage its working capital and capital expenditure needs while developing new products and revenue streams and maintaining existing ones.
15
The Company does not have material off-balance sheet arrangements.
The table that follows shows long-term debt and other specified obligations of the Company:
| (In millions) | Payments Due By Periods | ||||||||||||||
| Contractual obligations1 |
Total | 2009 | 2010 2011 |
2012 2013 |
2013 and beyond | ||||||||||
| Long-term debt:2 |
|||||||||||||||
| Revolving credit facility |
$ | 425.0 | $ | — | $ | 425.0 | $ | — | $ | — | |||||
| Term loan |
300.0 | — | 300.0 | — | — | ||||||||||
| Other |
5.1 | 5.0 | 0.1 | — | — | ||||||||||
| Operating leases3 |
31.2 | 6.9 | 10.9 | 5.3 | 8.1 | ||||||||||
| Broadcast film rights4 |
50.5 | 14.9 | 34.2 | 1.1 | 0.3 | ||||||||||
| Estimated benefit payments from Company assets5 |
67.5 | 4.5 | 10.8 | 13.4 | 38.8 | ||||||||||
| Purchase obligations6 |
190.4 | 125.9 | 44.9 | 15.7 | 3.9 | ||||||||||
| Total specified obligations |
$ | 1,069.7 | $ | 157.2 | $ | 825.9 | $ | 35.5 | $ | 51.1 | |||||
| 1 | Other than the estimated benefit payments from Company assets and Broadcast film rights disclosed above and discussed further below, the table excludes items contained in “Other liabilities and deferred credits” on the Consolidated Balance Sheets, primarily because the ultimate timing and amount of these future payments is not determinable. As disclosed in Note 7 in Exhibit 99.7 of this Form 8-K, the Company had a non-current liability for uncertain tax positions of approximately $15 million at December 28, 2008. The Company cannot reasonably estimate the amount or period in which the ultimate settlement of these uncertain tax positions will occur, therefore the contractual obligations table excludes this liability. |
| 2 | The Company has the legal right to prepay its long-term debt without penalty; accordingly, no future interest expense has been included. |
| 3 | Minimum rental commitments under noncancelable lease terms in excess of one year. |
| 4 | Broadcast film rights include both recorded short-term and long-term liabilities for programs which have been produced and unrecorded commitments to purchase film rights which are not yet available for broadcast. |
| 5 | Actuarially estimated benefit payments under pension and other benefit plans expected to be funded directly from Company assets through 2018 which excludes expected contributions to the qualified pension plan. The Company contributed $15 million in 2009 and expects to contribute $20 million in 2010 to its qualified pension plan, which is in excess of the expected minimum funding requirements. A further discussion is included in the paragraph that follows this chart. |
| 6 | Purchase obligations include: 1) all current liabilities not otherwise reported in the table that will require cash settlement, 2) significant purchase commitments for fixed assets, and 3) significant non-ordinary course contract-based obligations. Purchase obligations exclude the Company’s purchase commitment to SPNC for newsprint as the contract is based on market prices which are highly volatile. As indicated in Note 4 in Exhibit 99.7 of this Form 8-K, the Company is committed to purchase a minimum of approximately 48 thousand, 42 thousand, and 35 thousand tons of newsprint, respectively from SPNC in 2009, 2010, and 2011. |
As was the case with many companies’ pension plans, the Company’s unfunded obligation widened significantly in 2008 (see Note 9 to the Financial Statements in Exhibit 99.7 of this Form 8-K) due primarily to a 32% decline in the value of plan assets. Although not required to do so,
16
the Company made contributions of $15 million to its Retirement Plan in 2009 and currently anticipates making $15 million in 2010. By making contributions before they are required – as it has in the past – the Company expects to limit the ultimate amount that it will need to contribute. Many factors influence the required funding for the plan including the return on invested assets, funding requirements that are set forth by ERISA in enacting the laws passed by Congress, and the long-term discount rates that are applied to the funds’ benefit liabilities. The amounts shown in the table do not reflect plan contributions. If the factors noted above remain unchanged, the Company’s required contributions in subsequent years would be more in the range of the 2010 contribution.
* * * * * * *
Certain statements in this annual report that are not historical facts are “forward-looking” statements, as that term is defined by the federal securities laws. Forward-looking statements include statements related to pending transactions and contractual obligations, critical accounting estimates and assumptions, the impact of the Internet, and expectations regarding the effects and timing of debt compliance, the Yahoo! agreements, newsprint prices, pension and post-retirement plans, general advertising levels and political advertising levels, and the effects of changes to FCC regulations. Forward-looking statements, including those which use words such as the Company “believes,” “anticipates,” “expects,” “estimates,” “intends,” “projects,” “plans,” “hopes” and similar words, are made as of the date of this filing and are subject to risks and uncertainties that could cause actual results to differ materially from those expressed in or implied by such statements. The reader should understand that it is not possible to predict or identify all risk factors. Consequently, any such list should not be considered a complete statement of all potential risks or uncertainties.
These forward-looking statements should be considered in light of various important factors that could cause actual results to differ materially from estimates or projections including, without limitation: changes in advertising demand, changes to pending accounting standards, changes in circulation levels, changes in relationships with broadcast networks and lenders, the availability and pricing of newsprint, fluctuations in interest rates, the performance of pension plan assets, health care cost trends, regulatory rulings including those related to ERISA and tax law, natural disasters, and the effects of acquisitions, investments and dispositions on the Company’s results of operations and its financial condition. Actual results may differ materially from those suggested by forward-looking statements for a number of reasons including those described in Exhibit 99.3 “Risk Factors” of this Form 8-K.
17