Attached files
| file | filename |
|---|---|
| 8-K - FORM 8-K - Super Micro Computer, Inc. | d8k.htm |
| EX-99.1 - PRESS RELEASE OF SUPER MICRO COMPUTER, INC. DATED JANUARY 26, 2010 - Super Micro Computer, Inc. | dex991.htm |
 GPU
Solutions Universal I/O Double-Sided Datacenter Optimized Twin Architecture SuperBlade ® Storage 2 nd Quarter Fiscal 2010 Earnings Conference Presentation January 26, 2010 Exhibit 99.2 GPU Solutions Universal I/O Double-Sided Datacenter Optimized Twin Architecture SuperBlade ® Storage Supermicro © 2009 |
 2 Safe Harbor Statement This presentation contains forward-looking statements within the meaning of Section
27A of the Securities Act of 1933, as amended, and Section 21E of the
Securities Exchange Act of 1934, as amended. These forward-looking
statements may relate, among other things, to our expected financial and
operating results, our ability to build and grow Supermicro, the benefit of
our products and our ability to achieve our goals, plans and
objectives. Such forward-looking statements do not constitute guarantees
of future performance and are subject to a variety of risks and
uncertainties that could cause our actual results to differ materially from those anticipated. These include, but are not limited to: our dependence on continued growth
in the markets for X86 based servers, blade servers and embedded
applications, increased competition, difficulties of predicting timing of
new product introductions, customer acceptance of new products, difficulties in establishing and maintaining successful relationships with our distributors and vendors,
shortages or price fluctuations in our supply chain, our ability to protect
our intellectual property rights, our ability to control the rate of
expansion domestically and internationally, difficulty managing rapid growth and general political, economic and market conditions and events. For a further list and description of risks and uncertainties, see the reports filed by
Supermicro with the Securities and Exchange Commission. Supermicro disclaims
any intention or obligation to update or revise any forward-looking
statements, whether as a result of new information, future events or otherwise. Supplemental information, condensed balance sheets and statements of operations follow.
All monetary amounts are stated in U.S. dollars.
|
 3 Non-GAAP Financial Measures Non-GAAP gross margin in this presentation excludes stock-based compensation expense. Non-GAAP
net income and net income per share in this presentation exclude stock-based compensation
expense, a provision for litigation loss and the related tax effect of the applicable items.
Management presents non- GAAP financial measures because it considers them to be important
supplemental measures of performance. Management uses the non-GAAP financial measures for
planning purposes, including analysis of the Company's performance against prior periods, the
preparation of operating budgets and to determine appropriate levels of operating and capital
investments. Management also believes that non-GAAP financial measures provide additional insight for analysts and
investors in evaluating the Company's financial and operational performance. However, these
non-GAAP financial measures have limitations as an analytical tool, and are not intended to
be an alternative to financial measures prepared in accordance with GAAP. Pursuant to the requirements of SEC Regulation G, detailed reconciliations between the Company's
GAAP and non-GAAP financial results is provided at the end of the press release that was issued
announcing the Company’s operating and financial results for the quarter ended December
31, 2009. In addition, a reconciliation from GAAP to non-GAAP results is contained in
the financial summary attached to today’s presentation and is available in the Investor
Relations section of our website at www.supermicro.com in the Events and Presentations section. Investors are advised to carefully review
and consider this information as well as the GAAP financial results that are
disclosed in the Company's SEC filings. |
 4 Q2’FY2010 Non-GAAP Financial Highlights (in millions, except per share data) Q2'10 YoY Sequential Revenue $182.0 41.5% 22.5% Profit after Tax $9.2 37.2% 58.4% Diluted EPS $0.22 29.4% 46.7% Change |
 5 Summary of Results Our second quarter was a record quarter for revenues for Supermicro, up 41.5% from a year ago We grew in all product categories, especially in Nehalem based products, storage, GPU’s and Blades and we grew in all geographies Based on our strongest product line ever and our increasing brand recognition, we are invited to bid more and for larger opportunities With Supermicro’s leading performance per dollar and per watt, our customers get low TCO
and enhanced ROI performance In a benchmark win, an HPC cluster chose Supermicro SuperBlade as the most energy efficient and highest computing density solution using an industry standard configuration
With our brand strength, strong product lines, European assembly, and improving Asian opportunities we are confident in our continued growth |
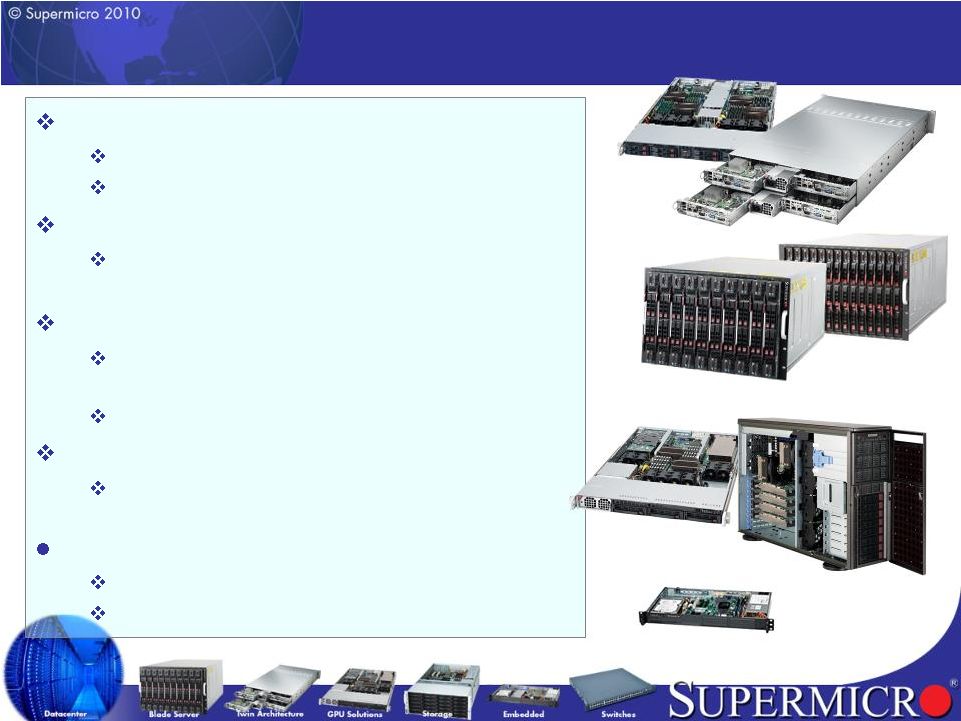 Leading Architecture – FY10 New Twin New GPUs TwinBlade™ New ATOM server New Generation Twin 1U Twin / 2U Twin² with new generation CPU / Chipset Continue the momentum and leading position TwinBlade™ 20/28 DP nodes in 7U, support 40Gb/s Infiniband or 10G Ethernet connectivity New GPU product lines Scientific computation, imaging processing and CFD simulation New generation GPU – NVIDIA Fermi & AMD ATI Boxboro MC Tukwila 4-way (Itanium) Enterprise class high-end with full RAS features for database and mission-critical applications ATOM based appliance & Embedded solutions Create territory in the market segments: Medical, Gaming, Telecom, Military… industries 6 |
 Leading Architecture – FY10 New generation 4-way / 8-way Systems Intel new Boxboro-EX MP system in 1U/4U/5U Addressing HPC application needs as well as enterprise market Storage product line expansion Super SBB product line Higher density storage subsystems: Double-Sided New generation 1U / 2U / 3U datacenter optimized rack mount product lines (Intel Westmere & AMD G34, Magne-cours) Further optimized for enterprise virtualization applications Including 18 DIMM, 94% high efficiency redundant power supply, more I/O capacity, GPU capability, and 100% cooling redundancy Rack Products for Double Density and Cooling Expending switch products offering: FCoE, QDR IB, 10G… Front Back Boxboro-EX SBB Double-Sided 7 |
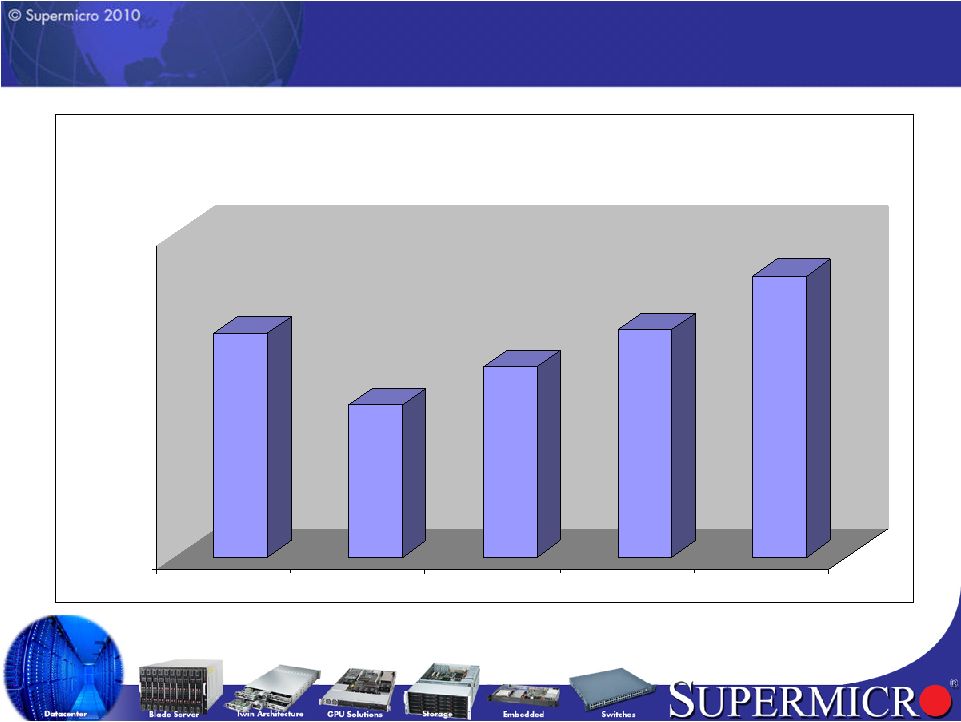
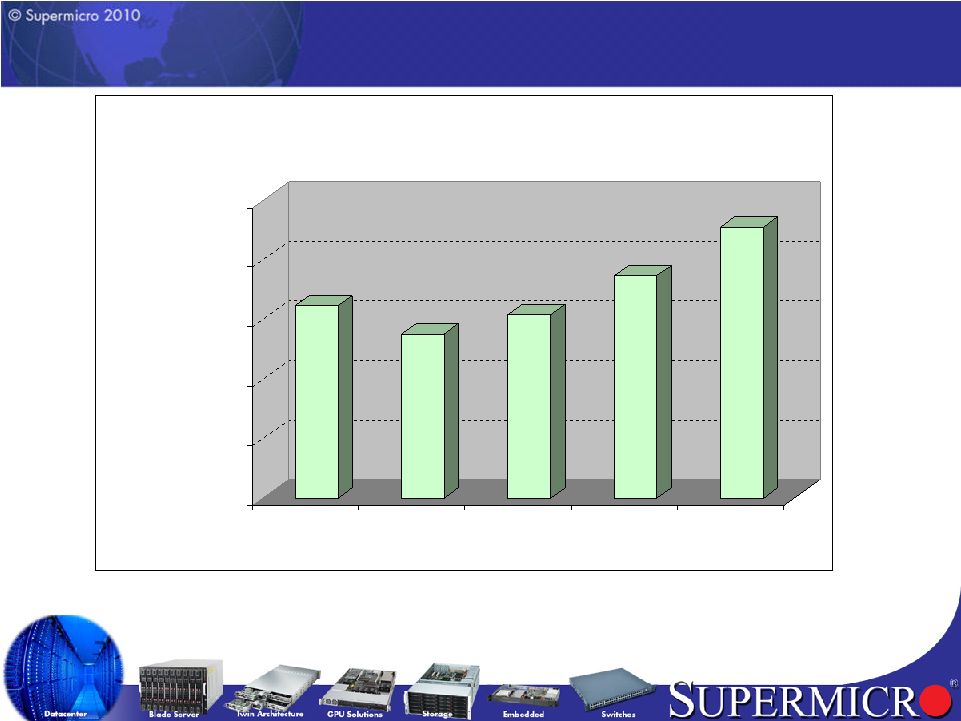 8 Revenue Comparables $129 $110 $123 $149 $182 $0 $40 $80 $120 $160 $200 $'s millions Q2'09 Q3'09 Q4'09 Q1'10 Q2'10 Supermicro Revenue Trend Y/Y -6.1% -19.9% -17.1% 3.1% 41.5% Seq. -10.8% -14.8% 12.7% 20.3% 22.5% |
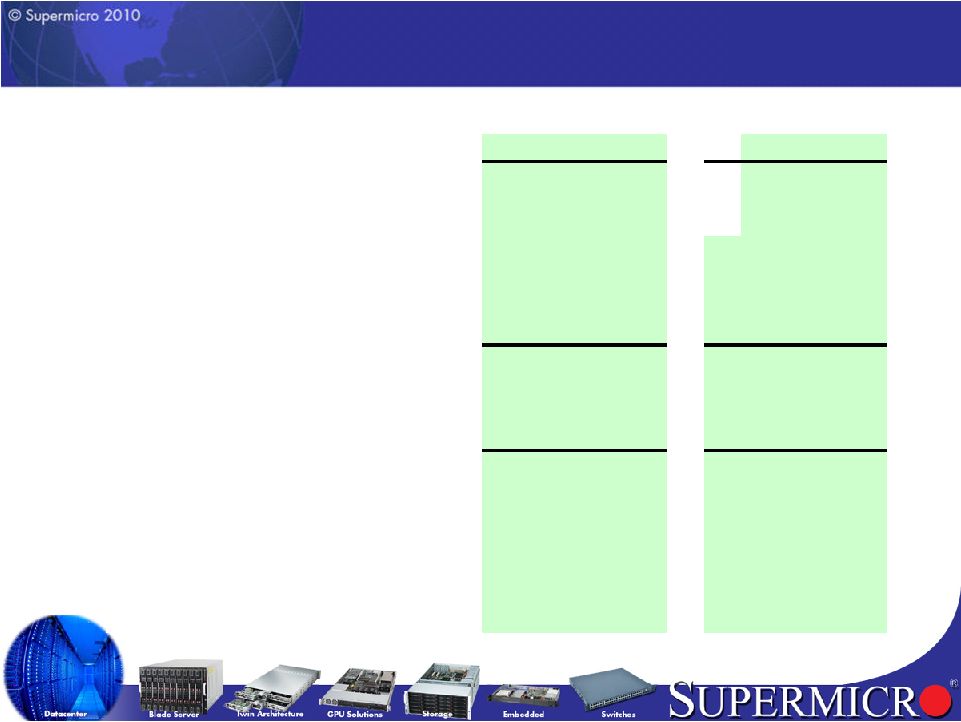
 9 Revenue Analysis $76 $53 $67 $43 $78 $45 $97 $51 $117 $65 $- $40 $80 $120 $160 $'s millions Q2'09 Q3'09 Q4'09 Q1'10 Q2'10 Supermicro Subsystem/System Revenue Subsystems Systems s |
 10 Non-GAAP Gross Margins 18.9% 15.0% 16.7% 16.6% 16.7% Q2'09 Q3'09 Q4'09 Q1'10 Q2'10 |
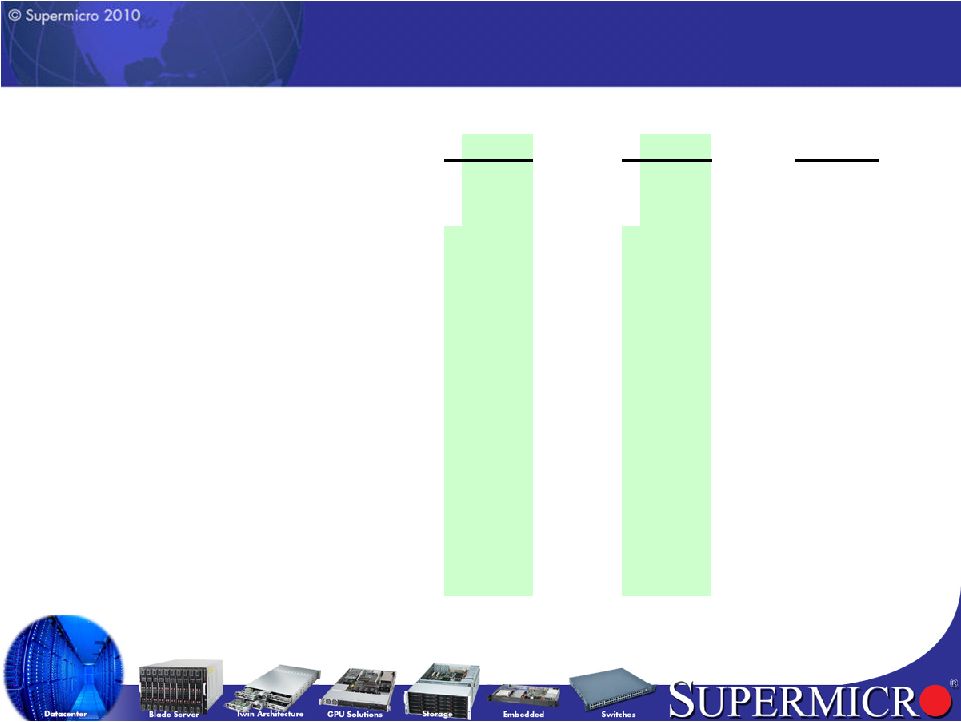
 11 Non-GAAP Gross Profit $24.2 $16.5 $20.6 $24.7 $30.5 $- Q2'09 Q3'09 Q4'09 Q1'10 Q2'10 Gross Profit $'s millions |
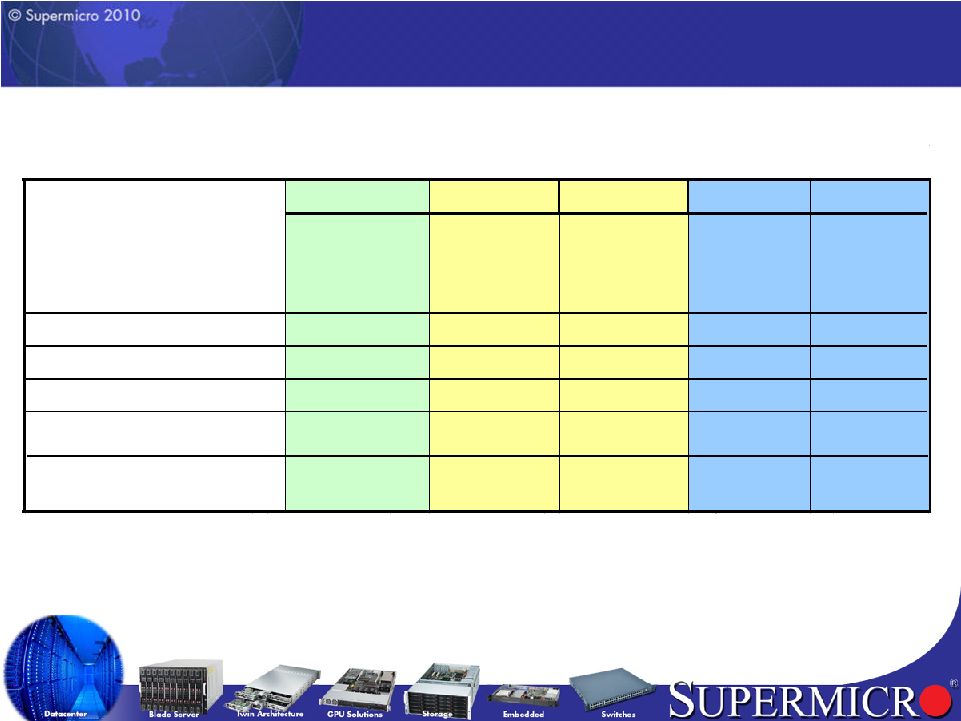 12 Summary P&L non-GAAP (in millions, except per share data) non-GAAP Q2'10 YoY Sequential Q2'09 Q1'10 Operating Expense $16.4 $0.8 $0.8 $15.6 $15.6 Operating Expense Ratio 9.0% -3.2% -1.5% 12.2% 10.5% Operating Income $14.1 $5.5 $5.0 $8.6 $9.1 Net Income $9.2 $2.5 $3.4 $6.7 $5.8 EPS $0.22 $0.05 $0.07 $0.17 $0.15 Diluted Common Share 40.5 39.2 40.1 Effective Quarterly Tax Rate (Benefit) 34.1% 20.8% 35.1% Change Count |
  13 Q2 FY2010 YTD Summary Statement of Cash Flows ($’s millions) 6 Months Ended 6 Months Ended 31-Dec-09 31-Dec-08 Net Income 11.5 $
12.5 $
Depreciation and amortization 2.2 $
1.7 $
Stock comp expense (FAS 123R) 3.2 $
2.5 $
Other reserves 2.1 $
3.3 $
Net change in AR, Inventory, AP (18.0) $
(11.5) $
Other prepaids and liabilities 10.6 $
1.4 $
Cash flow from operations 11.6 $
10.0 $
Capital expenditures (1.7) $
(2.5) $
Free cash flow 9.9 $
7.5 $
Net cash - other investing activities 8.7 $
0.8 $
Net cash - financing activities (6.6) $
0.5 $
Net change in cash 12.0 $
8.8 $
|
   14 Q2 FY 2010 Summary of Balance Sheet Metrics ($’s millions) Q2'10 Q1'10 Change Cash Equivalents & Investments 88.9 $ 85.2 $ 3.7 $ Accounts Receivable 54.9 $ 50.1 $ 4.8 $ Inventory 134.3 $ 100.1 $ 34.2 $ Accounts Payable 112.6 $ 86.3 $ 26.3 $ DSO 27 30 -3 DIO 71 71 0 DPO 60 59 1 Cash Cycle Days 38 42 -4 |
 15 Supplemental Financials Second Quarter Fiscal 2010 Ended December 31, 2009 |
 16 Non-GAAP Financial Summary (in millions, except per share data) Q2'10 Q1'10 Q2'09 Net Sales 182.0 $ 148.5 $ 128.6 $ Non-GAAP Gross Margin 16.7% 16.6% 18.9% Non-GAAP Operating Expenses 16.4 $ 15.6 $ 15.6 $ Non-GAAP Operating Income 14.1 $ 9.1 $ 8.6 $ Non-GAAP Net Income 9.2 $ 5.8 $ 6.7 $ Non-GAAP Net Income per common share 0.22 $ 0.15 $ 0.17 $ Fully diluted common shares for calculation 40.5 40.1 39.2 |
 17 Prior Period Net Income Comparisons (in millions, except per share data) Q2'10 Q1'10 Q2'09 Net Income (GAAP) 7.6 $ 3.9 $ 5.3 $ FAS123R & Other Unusual Expense (tax affected) 1.6 $ 1.9 $ 1.3 $ Net Income (Non-GAAP) 9.2 $ 5.8 $ 6.7 $ Diluted Net Income per common share (GAAP) 0.19 $ 0.10 $ 0.14 $ FAS123R 0.03 $ 0.05 $ 0.03 $ Diluted Net Income per common share (Non-GAAP) 0.22 $ 0.15 $ 0.17 $ Common shares used in diluted EPS calculation 40.5 40.1 39.2 |
 18 Q2 FY 2010 GAAP to Non-GAAP Reconciliation (in millions, except per share data) FAS123R & Q2'10 Q2'10 GAAP Other Unusual Non-GAAP Results Expenses Results Net Sales 182.0 $ - $
182.0 $ Cost of Sales 151.7 $ 0.2 $
151.5 $ Gross Profit 30.3 $ 0.2 $
30.5 $ Operating Expense 17.9 $ 1.5 $
16.4 $ Operating Income 12.4 $ 1.7 $
14.1 $ Interest, net (0.1) $ - $
(0.1) $ Income Before Tax 12.3 $ 1.7 $
14.0 $ Income Tax 4.7 $
(0.1) $
4.8 $
Net Income 7.6 $
1.6 $
9.2 $
Diluted Net Income per common share 0.19 $ 0.03 $
0.22 $ Diluted common shares used in GAAP and Non-GAAP per share calculation 39.8 40.5 40.5 |
 19 Q1 FY 2010 GAAP to Non-GAAP Reconciliation (in millions, except per share data) FAS123R & Q1'10 Q1'10 GAAP Other Unusual Non-GAAP Results Expenses Results Net Sales 148.5 $ - $
148.5 $ Cost of Sales 124.0 $ 0.1 $
123.9 $ Gross Profit 24.5 $ 0.1 $
24.7 $ Operating Expense 18.0 $ 2.5 $
15.6 $ Operating Income 6.5 $
2.6 $
9.1 $
Interest, net (0.1) $
- $
(0.1) $
Income Before Tax 6.4 $
2.6 $
9.0 $
Income Tax 2.5 $
0.7 $
3.1 $
Net Income 3.9 $
1.9 $
5.8 $
Diluted Net Income per common share 0.10 $ 0.05 $
0.15 $ Diluted common shares used in GAAP and Non-GAAP per share calculation 39.9 40.1 40.1 |
 20 Q4 FY 2009 GAAP to Non-GAAP Reconciliation (in millions, except per share data) Q4'09 Q4'09 GAAP FAS123R Non-GAAP Results Expenses Results Net Sales 123.5 $ - $ 123.5 $ Cost of Sales 103.0 $ 0.2 $
102.8 $ Gross Profit 20.5 $ 0.2 $
20.6 $ Operating Expense 16.7 $ 1.5 $
15.2 $ Operating Income 3.7 $
1.7 $
5.4 $
Interest, net (0.2) $ - $ (0.2) $ Income Before Tax 3.6 $
1.7 $
5.2 $
Income Tax 1.2 $
0.3 $
1.5 $
Net Income 2.4 $
1.4 $
3.8 $
Diluted Net Income per common share 0.06 $ 0.04 $ 0.10 $ Diluted common shares used in GAAP and Non-GAAP per share calculation 39.2 39.5 39.5 |
 21 Q3 FY 2009 GAAP to Non-GAAP Reconciliation (in millions, except per share data) Q3'09 Q3'09 GAAP FAS123R Non-GAAP Results Expenses Results Net Sales 109.5 $ - $ 109.5 $ Cost of Sales 93.2 $ 0.1 $
93.1 $ Gross Profit 16.3 $ 0.1 $
16.5 $ Operating Expense 15.9 $ 1.2 $
14.6 $ Operating Income 0.4 $
1.3 $
1.8 $
Interest, net (0.2) $ - $ (0.2) $ Income Before Tax 0.3 $
1.3 $
1.7 $
Income Tax (1.0) $ 0.2 $
(0.7) $ Net Income 1.2 $
1.0 $
2.4 $
Diluted Net Income per common share 0.03 $ 0.03 $ 0.06 $ Diluted common shares used in GAAP and Non-GAAP per share calculation 38.8 38.9 38.9 |
 22 Q2 FY 2009 GAAP to Non-GAAP Reconciliation (in millions, except per share data) Q2'09 Q2'09 GAAP FAS123R Non-GAAP Results Expenses Results Net Sales 128.6 $ - $ 128.6 $ Cost of Sales 104.5 $ 0.1 $
104.3 $ Gross Profit 24.1 $ 0.1 $
24.2 $ Operating Expense 16.8 $ 1.2 $
15.6 $ Operating Income 7.3 $
1.3 $
8.6 $
Interest, net (0.1) $ - $ (0.1) $ Income Before Tax 7.2 $
1.3 $
8.5 $
Income Tax 1.8 $
(0.0) $ 1.8 $
Net Income 5.3 $
1.3 $
6.7 $
Diluted Net Income per common share 0.14 $ 0.03 $ 0.17 $ Diluted common shares used in GAAP and Non-GAAP per share calculation 39.2 39.2 39.2 |