Attached files
Table of Contents
UNITED STATES
SECURITIES AND EXCHANGE COMMISSION
Washington, D.C. 20549
Form 10-K
| x | ANNUAL REPORT PURSUANT TO SECTION 13 OR 15(d) OF THE SECURITIES EXCHANGE ACT OF 1934 |
For the fiscal year ended June 30, 2011
or
| ¨ | TRANSITION REPORT PURSUANT TO SECTION 13 OR 15(d) OF THE SECURITIES EXCHANGE ACT OF 1934 |
For the transition period from to
Commission File Number 001-33383
Super Micro Computer, Inc.
(Exact name of registrant as specified in its charter)
| Delaware | 77-0353939 | |
| (State or other jurisdiction of incorporation or organization) |
(I.R.S. Employer Identification No.) |
980 Rock Avenue
San Jose, CA 95131
(Address of principal executive offices, including zip code)
(408) 503-8000
(Registrant’s telephone number, including area code)
Securities registered pursuant to Section 12(b) of the Act:
| Title of each class |
Name of each exchange on which registered | |
| Common Stock, $0.001 par value per share | The Nasdaq Stock Market, Inc. |
Securities registered pursuant to section 12(g) of the Act:
None
Indicate by check mark if the registrant is a well-known seasoned issuer, as defined in Rule 405 of the Securities Act. Yes ¨ No x
Indicate by check mark if the registrant is not required to file reports pursuant to Section 13 or Section 15(d) of the Act. Yes ¨ No x
Indicate by check mark whether the registrant (1) has filed all reports required to be filed by Section 13 or 15(d) of the Securities Exchange Act of 1934 during the preceding 12 months (or for such shorter period that the registrant was required to file such reports), and (2) has been subject to such filing requirements for the past 90 days. Yes x No ¨
Indicate by check mark whether the registrant has submitted electronically and posted on its corporate Web site, if any, every Interactive Data File required to be submitted and posted pursuant to Rule 405 of Regulation S-T (§229.405 of this chapter) during the preceding 12 months (or for such shorter period that the registrant was required to submit and post such files). Yes ¨ No ¨
Indicate by check mark if disclosure of delinquent filers pursuant to Item 405 of Regulation S-K (§229.405 of this chapter) is not contained herein, and will not be contained, to the best of registrant’s knowledge, in definitive proxy or information statements incorporated by reference in Part III of this Form 10-K or any amendment to this Form 10-K. ¨
Indicate by check mark whether the registrant is a large accelerated filer, an accelerated filer, a non-accelerated filer, or a smaller reporting company. See the definitions of “large accelerated filer,” “accelerated filer” and “smaller reporting company” in Rule 12b-2 of the Exchange Act.
| Large accelerated filer ¨ |
Accelerated filer x | |
| Non-accelerated filer ¨ (Do not check if a smaller reporting company) |
Smaller reporting company ¨ | |
Indicate by check mark whether the registrant is a shell company (as defined in Rule 12b of the Exchange Act) Yes ¨ No x
The aggregate market value of the registrant’s Common Stock held by non-affiliates, based upon the closing price of the Common Stock on December 31, 2010, as reported by the Nasdaq Global Market, was approximately $310,199,000. Shares of Common Stock held by each executive officer and director and by each person who owns 5% or more of the outstanding Common Stock, based on filings with the Securities and Exchange Commission, have been excluded since such persons may be deemed affiliates. This determination of affiliate status is not necessarily a conclusive determination for other purposes.
As of August 22, 2011 there were 40,325,404 shares of the registrant’s common stock, $0.001 par value, outstanding, which is the only class of common stock of the registrant issued.
DOCUMENTS INCORPORATED BY REFERENCE
None
Table of Contents
SUPER MICRO COMPUTER, INC.
ANNUAL REPORT ON FORM 10-K
FOR THE FISCAL YEAR ENDED JUNE 30, 2011
This Annual Report on Form 10-K contains “forward-looking statements” within the meaning of Section 27A of the Securities Act of 1933 and Section 21E of the Securities Exchange Act of 1934, as amended (Exchange Act) that involve risks and uncertainties. These statements relate to future events or our future financial performance. In some cases, you can identify forward-looking statements by terminology including “would,” “could,” “may,” “will,” “should,” “expect,” “intend,” “plan,” “anticipate,” “believe,” “estimate,” “predict,” “potential,” or “continue,” the negative of these terms or other comparable terminology. In evaluating these statements, you should specifically consider various factors, including the risks described below, under “Item 1A Risk Factors”, and in other parts of this Form 10-K as well as in our other filings with the SEC. These factors may cause our actual results to differ materially from those anticipated or implied in the forward-looking statements. We undertake no obligation to publicly update or revise any forward-looking statements, whether as a result of new information, future events or otherwise. We cannot guarantee future results, levels of activity, performance or achievements.
Table of Contents
PART I
| Item 1. | Business |
Overview
We are a global leader in server technology and green computing innovation. We develop and provide high performance server solutions based on an innovative, modular and open-standard architecture. Our solutions include a range of complete rackmount servers, storage systems, workstations, blade servers, networking devises and complete rack solutions, as well as subsystems and accessories which can be used by distributors, original equipment manufacturers, or OEMs, and end customers to assemble server systems. We offer our clients a high degree of flexibility and customization by providing what we believe to be the industry’s broadest array of servers, server subsystems and accessories, which are interoperable and can be configured to create complete server systems. Our server systems, subsystems and accessories are architected to provide high levels of reliability, quality and scalability, thereby enabling benefits in the areas of performance, thermal management, power efficiency and total cost of ownership. We base our solutions on open standard components, such as processors from Intel, AMD and Nvidia and our solutions can utilize both the Linux and Windows operating systems.
We perform the majority of our research and development efforts in-house, which increases the communication and collaboration between design teams, streamlines the development process and reduces time-to-market. We have developed a set of design principles which allow us to aggregate individual industry standard materials to develop proprietary components, such as serverboards, chassis, power supplies and networking / storage devices. This building block approach allows us to provide a broad range of SKUs, and enables us to build and deliver application-optimized solutions based upon customers’ application requirements. As of June 30, 2011, we offered over 4,500 SKUs, including SKUs for rackmont and blade server systems, serverboards, chassis and power supplies and other system accessories.
We conduct our operations principally from our headquarters in California and subsidiaries in the Netherlands and Taiwan. We sell our server systems and server subsystems and accessories primarily through distributors, which include value added resellers and system integrators, and to a lesser extent to OEMs as well as through our direct sales force. During fiscal year 2011, our products were purchased by over 600 customers, most of which are distributors in 85 countries. We commenced operations in 1993 and have been profitable every year since inception. For fiscal years 2011, 2010 and 2009, our net sales were $942.6 million, $721.4 million and $505.6 million, respectively, and our net income was $40.2 million, $26.9 million and $16.1 million, respectively.
Industry Background
Increasing Demand for Computing Capacity
As businesses of all sizes process larger quantities of data to communicate, transact and collaborate, their business processes are becoming more complex and their requirements for computing capacity are growing rapidly. Businesses are using traditional networked environments, such as local area networks, or LANs, as well as the Internet, to host a wide range of applications including databases, Intranets and email. Businesses are also using external functions, such as data centers, e-commerce storefronts and extranets, to enable growth of their operations. The infrastructure and computing model to support those businesses are often referred as “Cloud Computing”. All of these factors and business’ needs are fueling the demand for increased computing power and storage capacity.
Evolution of Open Systems and Scale-out Computing
Computing architectures are continuing to evolve to meet this rapidly growing demand for computing capacity. As businesses increasingly require solutions that provide flexibility and scalability in a cost effective
1
Table of Contents
manner, they are moving away from traditional proprietary computing solutions toward open system servers with x86 based architectures using either Linux or Windows operating systems. Businesses are building upon this modular and open system concept to create what are commonly referred to as scale-out computing architectures. These scale-out architectures typically consist of open standard components that are configured into modular computing systems and organized into clustered or rackmount server configurations. These systems are designed to comply with a set of industry standard specifications that are referred to as Server System Infrastructure, or SSI. SSI is also an industry standard organization, which defines server specification standards. We actively participate in the SSI organization and have a representative on the board of directors. Our development methodology for servers is not only to comply with the SSI standards but also to focus on the superset of SSI (which we call Super-SSI), in order that our products accommodate our own proprietary design as well as comply with SSI standards. Scale-out computing enables businesses to add computing capacity incrementally as their needs arise without significantly disrupting existing systems, providing greater flexibility and scalability and improving total cost of ownership over earlier generations of server systems.
Increasing Need for Rapidly Deployable, Highly Optimized Server Solutions
Scale-out server architectures provide significant benefits for many businesses. However, there are a wide range of circumstances in which businesses need more than just the incremental computing capacity that can be obtained by adding more general purpose servers as part of a scale-out deployment. In these circumstances, the nature of the underlying computing architecture contributes meaningfully to the competitive advantage of the business. We refer to the solutions these businesses seek as “application optimized” solutions, as these businesses typically need customized server configurations which provide optimal levels of processing, I/O or memory. These situations include, among others:
| • | Large scalable server farms: Data centers of online service providers and Global 2000 companies, as well as supercomputing clusters of large research organizations, want to optimize industry standard components by architecting a system platform that enables higher performance through enhanced processing or I/O, more efficient memory bandwidth and greater capacity. |
| • | Businesses that have complex computing requirements: Certain businesses, such as financial services companies, oil exploration companies and entertainment production studios, require systems that have optimized processing and I/O capabilities in order to maximize information and image capture and processing. |
| • | OEMs: Certain OEMs, including vendors of networking hardware, medical imaging and industrial equipment, seek to differentiate their end products by requiring a broad selection of high performance and rapidly deployable server solutions that can be optimized for specific applications for their end customers. |
In all of these situations, server vendors are selected based on several key criteria:
Rapidly deployable server solutions. Many businesses desire the most advanced server technology as soon as it becomes commercially available. For instance, given the rapid product development cycles of new technologies in the networking hardware market, vendors of networking equipment increasingly seek to partner for certain aspects of their solutions, such as server technology, because it enables them to deliver a high performance solution to their customers more quickly. Similarly, online service providers must continue to deploy the latest server technology as soon as it becomes available since the ability to cost-effectively deliver a high degree of service is critical to their business. Because traditional server vendors typically use third party component suppliers, they must deal with the time, complexity and sometimes conflicting interests of coordinating with multiple suppliers throughout the product design and manufacturing process. This lengthens the time required to incorporate new technology into next generation systems. As a result, when building or upgrading their computing capability, businesses must either wait to deploy the latest products or accept solutions that do not incorporate the benefits of the latest technology.
2
Table of Contents
Increased optimization for specific business needs. Servers are deployed to address widely differing applications with very different system requirements. An online gaming company, for instance, may require a server architecture that enables optimal graphic processing, while a scientific research organization may require a server architecture that maximizes computing power. In either case, the business will seek to deploy server systems that are optimized to its specific needs to maximize performance while minimizing costs. Traditional server vendors typically offer only a limited number of standalone server models. Given this lack of flexibility and choice, building an application optimized server solution with traditional server components can be challenging. In order to meet their performance requirements, businesses must often purchase more computing functionality, including potentially more memory, greater processing power or more efficient power supplies, than would be otherwise necessary had the system been optimized for a specific business need. This increases not only the initial purchase price, but also the total cost of ownership over the useful life of the servers. Alternatively, businesses that seek a customized server solution from traditional server vendors face limited choices and often must accept considerable delays.
Superior price-to-performance per watt. In addition to the need for rapidly available and highly optimized server solutions, businesses with application optimized server needs face growing scalability challenges. Many application optimized server deployments constitute increasingly larger server systems, particularly in scale-out configurations, and can involve hundreds or even thousands of servers. Deployments of this magnitude can present numerous performance, space, energy and maintenance challenges. First, the aggregation of large numbers of computing systems leads to escalating energy requirements. As a result, businesses require scale-out computing systems that not only perform well but also minimize power consumption. Second, the increasing need for computing capacity has resulted in the need for higher density solutions to optimize the use of valuable floor space and to minimize operating costs. Third, the high density of the equipment, together with increasing power consumption per CPU, are creating a significant challenge for businesses attempting to manage heat dissipation, including the cost of owning and operating computer room air conditioning, or CRAC, units to effectively prevent system failure.
The Super Micro Solution
We develop and provide high performance server solutions based upon an innovative, modular and open-standard architecture. Our primary competitive advantages arise from how we use our integrated internal research and development organization to develop the intellectual property used in our server solutions. These have enabled us to develop a set of design principles and performance specifications that we refer to as Super SSI that meet industry standard SSI requirements and also incorporate advanced functionality and capabilities. Super SSI provides us with greater flexibility to quickly and efficiently develop new server solutions that are optimized for our customers’ specific application requirements. Our modular architectural approach has allowed us to offer our customers interoperable designs across all of our product lines. This modular approach, in turn, enables us to provide what we believe to be the industry’s largest array of server systems, subsystems and accessories.
Flexible and Customizable Server Solutions
We provide flexible and customizable server solutions to address the specific application needs of our customers. Our design principles allow us to aggregate industry standard materials to develop proprietary subsystems and accessories, such as serverboards, chassis and power supplies to deliver a broad range of products with superior features. Each subsystem and accessory is built to be backward compatible. We believe this building block approach allows us to provide a broad range of SKUs. As of June 30, 2011, we offered over 4,500 SKUs, including SKUs for rackmount and blade server systems, serverboards, chassis and power supplies and other system accessories.
Rapid Time-to-Market
We are able to significantly reduce the design and development time required to incorporate the latest technologies and to deliver the next generation application optimized server solutions. Our in-house design
3
Table of Contents
competencies and control of the design of many of the components used within our server systems enable us to rapidly develop, build and test server systems, subsystems and accessories with unique configurations. As a result, when new products are brought to market we are generally able to quickly design, integrate and assemble server solutions with little need to re-engineer other portions of our solution. Our efficient design capabilities allow us to offer our customers server solutions incorporating the latest technology with a superior price-to-performance ratio. We work closely with the leading microprocessor vendors to coordinate the design of our new products with their product release schedules, thereby enhancing our ability to rapidly introduce new products incorporating the latest technology.
Improved Power Efficiency and Thermal Management
We leverage advanced technology and system design expertise to reduce the power consumption of our server, blade, workstation and storage systems. We believe that we are an industry leader in power saving technology. Our server solutions include many design innovations to optimize power consumption and manage heat dissipation. We have designed flexible power management systems which customize or eliminate components in an effort to reduce overall power consumption. We have proprietary power supplies that can be integrated across a wide range of server system form factors which can significantly enhance power efficiency. We have also developed technologies that are specifically designed to reduce the effects of heat dissipation from our servers. Our thermal management technology allows our products to achieve a superior price-to-performance ratio while minimizing energy costs and reducing the risk of server malfunction caused by overheating.
High Density Servers
Our servers are designed to enable customers to maximize computing power while minimizing the physical space utilized. We offer server systems with twice the density of conventional solutions, which allows our customers to efficiently deploy our server systems in scale-out configurations. Through our proprietary technology, we can offer significantly more memory and expansion slots than traditional server systems with a comparable server form factor. In addition, we offer systems in a 1U configuration with features and capabilities generally offered by competitors only in a server with room for two racks or shelves, or a 2U server, configuration. For example, our “1U Twin” system contains two full feature dual processor, or DP, compute nodes in a 1U chassis. We also offer systems in a 2U configuration with features and capabilities generally offered by competitors only in a server with room for four racks or shelves, or a 4U server, configuration. For example, our “2U Twin2” system contains four full feature DP compute nodes in a 2U chassis which are designed to address the ever-increasing efficiency, density and low total cost of ownership demands of today’s high performance computing clusters and data centers. Our “2U Twin3 system contains eight full feature UP compute nodes in a 2U chassis which are designed to optimize for high-density and low-power environments. In addition, our MicroCloud, an 8-node system within a 3U enclosure provides a compelling, cost-effective solution for hosting, searching, or cloud computing applications.
Strategy
Our objective is to be the leading provider of application optimized, high performance server solutions worldwide. Key elements of our strategy include:
Maintain Our Time-to-Market Advantage
We believe one of our major competitive advantages is our ability to rapidly incorporate the latest computing innovations into our products. We intend to maintain our time-to-market advantage by continuing our investment in our research and development efforts to rapidly develop new proprietary server solutions based on industry standard components. We plan to continue to work closely with Intel, AMD, Nvidia and among others to develop products that are compatible with the latest generation of industry standard technologies. We believe these efforts will allow us to continue to offer products that lead in price for performance as each generation of computing innovations becomes available.
4
Table of Contents
Expand Our Product Offerings
We plan to increase the number of products we offer to our customers. Our product portfolio will continue to include additional solutions based on the latest Intel and AMD technologies as well as other technology vendors such as Nvidia. We plan to continue to improve the energy efficiency of our products by enhancing our ability to deliver improved power and thermal management capabilities, as well as servers and subsystems and accessories that can operate in increasingly dense environments. We also plan to continue developing and in the future offer additional management software capabilities that are integrated with our server products and will further enable our customers to simplify and automate the deployment, configuration and monitoring of our servers.
Further Develop Existing Markets and Expand Into New Markets
We intend to strengthen our relationships with existing customers and add new distributors and OEM partners. We will continue to target specific industry segments that require application optimized server solutions including data center environments, financial services, oil and gas exploration, biotechnology, entertainment and embedded applications. We have begun manufacturing and service operations in the Netherlands and Taiwan in support of European and Asian customers and we plan to continue to increase our overseas manufacturing capacity and expand our reach geographically.
Strengthen Our Relationships with Suppliers and Manufacturers
Our efficient supply chain and combined internal and outsourced manufacturing allow us to build systems to order that are customized, while minimizing costs. We plan to continue leveraging our relationships with suppliers and contract manufacturers in order to maintain and improve our cost structure as we benefit from economies of scale. We intend to continue to source non-core products from external suppliers. We also believe that as our solutions continue to gain greater market acceptance, we will generate growing and recurring business for our suppliers and contract manufacturers. We believe this increased volume will enable us to receive better pricing and achieve higher margins. We believe that a highly disciplined approach to cost control is critical to success in our industry. For example, we continue to maintain our warehousing capacity in Asia through our relationship with Ablecom Technology, Inc., or Ablecom, one of our major contract manufacturers and a related party, so that we continue to deliver products to our customers in Asia and elsewhere more quickly and in higher volumes.
Advanced Blade Server Technology
To meet the emerging demand for blade servers, we have developed and continued to improve our high-performance blade server solutions, called SuperBlades. Our SuperBlades are designed to share a common computing infrastructure, thereby saving additional space and power. Our SuperBlades are self-contained servers designed to achieve industry leading density and superior performance per square foot at a lower total cost of ownership. The SuperBlade’s enclosure provides power, cooling, networking, various interconnects and system-level management and supports both Intel Xeon and AMD Opteron processors. By creating a range of unique blade server offerings, we provide our customers with solutions that can be customized to fit their needs. In addition, the SuperBlade power supplies provide up to 94% efficiency, which is currently considered the highest AC power supply efficiency providing extreme electricity cost saving. We believe that our SuperBlade server system provides industry leading density, memory expandability, reliability, price-to-performance per square foot and energy saving. We also offer our TwinBlade SuperBlade configuration which includes two dual processor blades into one slot. The TwinBlade with the most current Infiniband quad data rate (QDR) connection enables the new SuperBlade to achieve even higher performance, density and efficiency by doubling the number of dual-processor compute nodes per 7U enclosure from 10 to 20. In addition to its superior processing power, TwinBlade combines 94%+ power supply efficiency with our innovative and highly efficient thermal and cooling system designs making it the greenest, most power-saving blade solution available. In March 2011, we launched our GPU SuperBlade which supports 20 GPUs in a single 7U blade enclosure. This GPU SuperBlade solution delivers maximum performance with the best CPU to GPU balance and optimized I/O.
5
Table of Contents
Products
We offer a broad range of application optimized server solutions, including complete rackmount and blade server systems and subsystems and accessories which customers can use to build complete server systems. Our servers are deployed in several configurations within two areas of an enterprise network:
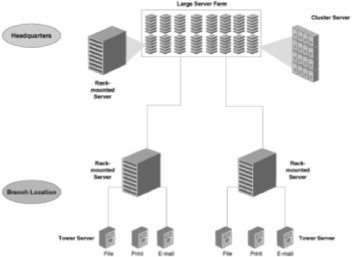
Headquarters: Enterprises build large scalable server farms at the enterprise gateway to run many of the most demanding applications and to provide basic computational infrastructure. Enterprises typically deploy our rackmount servers in order to save floor space and enable rapid deployment of additional server capacity as computing demands increase. Enterprises may also choose to deploy our tower servers in a clustered configuration, which combines the processing capability of multiple standalone, or tower servers such that they act like a single, large computer in order to accomplish computationally intensive tasks in a more cost-effective manner.
Branch: Within branch office data rooms, servers are deployed in rackmount configurations, in order to simplify the upgrade of servers or to swap out faulty servers, minimizing network downtime and making the management of the server infrastructure easier to maintain for branch offices with less specialized IT staffs. Also, within branch office workgroups, enterprises typically deploy our tower servers to accomplish basic office functions such as centralizing printing jobs, serving files and running local e-mail and other messaging applications.
Server Systems
We sell server systems in rackmount, standalone tower and blade form factors. We currently offer a complete range of server options with single, dual and quad CPU capability supporting Intel Pentium and Xeon multi-core architectures in 1U, 2U, 3U, 4U, tower and blade form factors. We also offer complete server systems based on AMD dual and quad Opteron in 1U, 2U, 4U and blade form factors. As of June 30, 2011, we offered over 1,000 different server systems. For each system, we offer multiple chassis designs and power supply options to best suit customer requirements. We also offer multiple configurations based on our latest generation systems with most comprehensive selections of chassis and serverboards. A majority of our most common systems are also available in minimum 1U or 1/2 depth form factors which are approximately one half of the size of standard sized rackmount servers.
6
Table of Contents
The figure below depicts a typical rackmount server and the different components that we typically optimize for our customers. The layout presented is for illustrative purposes only and does not represent the typical layout of all our servers.
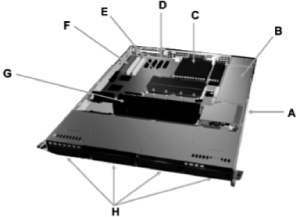
| A. | Chassis: Industry standard 1U rackmount chassis that permits server interoperability while efficiently housing key server components. |
| B. | Power Supply: Cost effective, high efficiency AC/DC energy saving power supply. |
| C. | Memory: Scalable memory expansion capability. |
| D. | Supermicro Intelligent Management Card: Monitors onboard instrumentation for server health and allows remote management and KVM over LAN for the entire network via a single keyboard, monitor and mouse. |
| E. | CPU: Programmable computer processing units that perform all server instruction and logic processing. Supermicro servers support Single, Dual Core, Quad Core or multi Core processors from both Intel and AMD. |
| F. | Expansion Modules: Allows increased functionality, I/O customization and flexibility. Super SSI features enable five Expansion I/O cards in a 1U server allowing 2U capability in a 1U form factor. |
| G. | Thermal Management: PWM Counter rotating and redundant fans control, provide optimum cooling and energy saving and dissipation of server component heat. |
| H. | Hard Disk Drives: Storage medium for operating system, applications and data. We offer “power-on” hot-swappable capability. |
7
Table of Contents
Below is a table that summarizes the most common server configurations purchased by our customers. We also design and build other customized systems using these and other building blocks to meet specific customer requirements.
| Server System Model |
CPU |
Memory |
Drive Bays | Form Factor | SKUs | |||||
| 5000 Series | Core 2 Duo, Core 2 Quad, Xeon, Core i7, Core i3, E3-1200, Atom | Unbuffered DDR2/ DDR3 |
1 to 4 drives | 1U, Mid-tower | 98 models | |||||
| 6000 Series | Dual Xeon (Dual/Quad/Six Core) | FB-DIMM DDR2/DDR3, ECC Registered DDR2/DDR3 | 1 to 16 drives | 1U, 2U, 3U | 210 models | |||||
| 7000 Series | Dual Xeon (Dual/Quad/Six Core) | FB-DIMM DDR2/DDR3, ECC Registered DDR2/DDR3 | 1 to 8 drives | 4U, Tower | 45 models | |||||
| 8000 Series | Quad Xeon (Quad/Six/Eight/Ten Core), MP Xeon (Quad/Six/Eight Core) |
FB-DIMM DDR2/DDR3, ECC Registered DDR2/DDR3 | 1 to 6 drives | 1U, 2U, 4U, Tower |
16 models | |||||
| 1000 Series | Dual Xeon (Dual/Quad/Six Core), Dual/Quad Opteron (Dual/Quad/Six/Eight/ Twelve Core) |
ECC Registered DDR2/DDR3, FB-DIMM DDR2/DDR3 | 1 to 8 drives | 1U | 77 models | |||||
| 2000 Series | Dual Xeon (Dual/Quad/Six Core), Dual/MP Opteron (Dual/Quad Core/Six/Eight/Twelve Core) |
ECC Registered DDR2/DDR3 | 1 to 6 drives | 2U | 41 models | |||||
| 4000 Series | Dual/Quad/MP Opteron (Dual/Quad Core/Six/Eight/Twelve Core) | ECC Registered DDR2/DDR3 | 1 to 8 drives | 4U, Tower, Mid- tower |
15 models | |||||
| SuperBlade | Dual Xeon (Quad/Six Core), Dual/Quad/MP Opteron (Quad Core/ Six/Eight/Twelve Core) | FB-DIMM DDR2/DDR3, ECC Registered DDR2/DDR3 | 1 to 6 drives | Blade | 73 models | |||||
We offer a variety of server storage options depending upon the system, with disk drive alternatives including small computer system interface, serial advanced technology attachment, or SATA, SATAII, or SAS and SASII, Intelligent Drive Electronics, or IDE, and serial attached SCSI.
In addition to our server systems, we also offer Supermicro Intelligent Management, or SIM, card solutions which are sold as part of our server systems. Our SIM card implements the industry standard Intelligent Platform Management Interface, or IPMI 2.0, to provide remote access, system monitoring and administration functionality for our server platforms. Our SIM card includes key capabilities such as remote hardware status, failure notification, as well as the ability to power-cycle non-responsive servers and to manage the system through out-of-band network or KVM (keyboard, video and mouse) functionality over LAN. Our SIM solutions
8
Table of Contents
enable server administrators to view a server’s hardware status remotely, receive an alarm automatically when a failure occurs, and power cycle a system that is non-responsive. Our Intelligent Management module monitors onboard instrumentation such as temperature sensors, power status, voltages and fan speed, and provides remote power control capabilities to reboot and reset the server. It also includes remote access to the Basic Input/Output System, or BIOS, configuration and operating system console information. The monitoring and control functions work independently of the CPU because the SIM card is a completely separate processor. Data center administrators can gain full remote access to control the BIOS, utilities, operating systems and software applications. In summary, our SIM solutions include the following key features:
| • | embedded processor to provide in or out of band KVM capabilities thereby extending the use of a single keyboard, monitor and mouse to the entire network; |
| • | enhanced authentication support to establish secure remote sessions and authenticate users; |
| • | enhanced encryption support to allow secure remote password configuration and protect sensitive system data when it is transferred over the network; |
| • | Power management for the remote power on/off; and |
| • | Virtual Media for booting from Virtual CD-ROM, floppy over LAN, etc. |
Furthermore, our system management software, Supermicro Server Management, or SSM, solution and High-Performance Computing , or HPC, cluster toolset have been designed for server farm. The SSM software provided the ability to manage large-scale servers and storage in an organization’s IT infrastructure. It includes optional modules as well as the capability of incorporating third-party plug-in software, which is connected within a common framework and enables communication between devices. The HPC Toolset is designed specifically for HPC cluster deployment and management. The Command Line Interface, or CLI, which utilizes the Linux operating system, provides a convenient working environment for our system integrator or the cluster administrator to deploy, configure, control, and manage the HPC cluster. Both of our SSM and HPC Toolset can leverage our SIM technology to integrate management functions.
Server Subsystems and Accessories
We believe we offer the largest array of modular server subsystems and accessories or building blocks in the industry that are sold off the shelf or built-to-order. These components are the foundation of our server solutions and span product offerings from the entry-level single and dual processor server segment to the high-end multi-processor market. The majority of the subsystems and accessories we sell individually are optimized to work together and are ultimately integrated into complete server systems.
Serverboards
We design our serverboards with the latest chipset and networking technologies. Each serverboard is designed and optimized to adhere to specific physical, electrical and design requirements in order to work with certain combinations of chassis and power supplies and achieve maximum functionality. For our rackmount server systems, we not only adhere to SSI specifications, but our Super SSI specifications provide an advanced set of features that increase the functionality and flexibility of our products. The following table displays our serverboard offerings for X9 Sandy Bridge (Intel’s new generation of Dual and Quad Core Xeon E3-1200 family support), X8 (Intel’s generation of QPI, Six and Eight Core, Dual and Quad Core Xeon 5600/5500/3600/3500 series), X7 (Intel’s generation of Dual and Quad Core Xeon 5000/5100 series), X6 (Intel’s 800Mhz Front Side Bus generation of Dual and Quad Xeon solutions) and H8 (AMD’s Six, Eight and Twelve Core, Dual and Quad Core Opteron 200 and 800 series). As of June 30, 2011, we offered more than 400 SKUs for serverboards.
9
Table of Contents
Below is a table that summarizes the most common serverboard configurations purchased by our customers.
| Serverboard Model |
CPU |
System Bus |
Form Factor |
Memory | SKUs | |||||
| X9 Series |
UP Xeon (Dual/Quad Core) | E3-1200 | Twin, Advanced Technology Extended (ATX), Micro Advanced Technology Extended (MATX) | ECC Registered DDR3 |
14 models | |||||
| X8 Series |
Dual Xeon (Dual/Quad/Six Core), UP Xeon (Dual/Quad/Six Core), MP Xeon (Quad/Six/Eight Core) |
QPI up to 6.4 GT/s | Twin, UIO, Extended ATX (EATX), ATX | ECC Registered DDR3 |
107 models | |||||
| X7 Series |
Dual Xeon (Dual/Quad Core), MP Xeon (Dual/Quad Core), Atom |
1333/1066/800 MHz | ATX, EATX, Flex ATX (FATX) | Fully- Buffered DIMM DDR2 |
99 models | |||||
| X6 Series |
Dual/Quad Xeon | 800 MHz | ATX, EATX | ECC Registered DDR2 |
28 models | |||||
| C2, C7 Series | Pentium D (Dual/Quad/Six Core) | 1333/1066/800 MHz | ATX, MATX | Unbuffered DDR2/DDR3 |
22 models | |||||
| H8 Series | Dual/Quad/MP Opteron (Dual/Quad/Six/Eight/ Twelve Core) |
Hypertransport/HT3 | Twin, UIO, ATX, EATX | ECC Registered DDR2/ DDR3 |
92 models | |||||
Chassis and Power Supplies
Our chassis are designed to efficiently house our servers while maintaining interoperability, adhering to industry standards and increasing output efficiency through power supply design. We believe that our latest generation of power supplies achieves the maximum power efficiency available in the industry. In addition, we have developed a remote management system that offers the ability to stagger the start up of systems and reduce the aggregate power draw at system boot to allow customers to increase the number of systems attached to a power circuit. We design DC power solutions to be compatible with data centers that have AC, DC or AC and DC based power distribution infrastructures. We believe our unique power design technology reduces power consumption by increasing power efficiency up to 94%, which we believe is among the most efficient available in the industry. Our server chassis come with hot-plug, heavy-duty fans, fan speed control and an advanced air shroud design to maximize airflow redundancy.
The table below depicts some of our chassis product offerings including the 500-series (front I/O options and space constrained environments), 800-series (most widely used for single, dual and quad processor servers and storage systems), 700-series (Tower, 4U rackmount servers and workstations), 900-series (for high-density storage applications) and 100/200/400-series (for 2.5” hard disk drives server and ultra high density storage) chassis products. These chassis solutions offer redundant power, hold swap power supply, redundant cooling fan options and high efficiency AC and DC power combinations. As of June 30, 2011, we offered more than 500 SKUs for chassis and power supplies.
10
Table of Contents
Below is a table that summarizes the most common chassis configurations purchased by our customers.
| Chassis Model |
CPU Support | Expansions | Drive Bays | Power Supply | Form Factor | SKUs | ||||||
| SC100 Series | Xeon, Pentium, Opteron, Atom |
1 to 4 FL & 1 LP |
4 to 8 drives (2.5” HDD) |
330W, 560W, 650W/700W– redundant, 1400W |
1U, Mini- 1U |
26 models | ||||||
| SC200 Series | Xeon, Pentium, Opteron, Atom |
7 LP or 4FH & 3 LP |
8 to 24 drives (2.5” HDD) |
720W to 1400W– redundant |
2U | 25 models | ||||||
| SC400 Series | Xeon, Pentium, Opteron, Atom |
7 LP or 4FH & 3 LP |
72 to 88 drives |
1400W– redundant |
4U | 5 models | ||||||
| SC500 Series | Xeon, Pentium, Opteron, Atom |
1 FH | 2 drives | 200W to 600W Low cost 200W |
Mini-1U | 38 models | ||||||
| SC700 Series | Xeon, Pentium, Opteron, Atom |
Up to 11 FHFL |
4 to 10 drives | 300W to 1400W– redundant |
4U, Tower, Mid-tower |
73 models | ||||||
| SC800 Series | Xeon, Pentium, Opteron, Quad Processer, Atom |
various configurations |
2 to 45 drives | 260W to 1400W– redundant |
1U, 2U, 3U, 4U |
267 models | ||||||
| SC900 Series | Xeon, Pentium, Opteron, Atom |
6 to 7 FL | Up to 16 drives |
650W, 900W/ 1200W –redundant |
3U, 4U, Tower |
18 models | ||||||
Other System Accessories
As part of our server component offerings, we also offer other system accessories that our customers may require or that we use to build our server solutions. These other products include, among others, microprocessors, memory and disc drives that generally are third party developed and manufactured products that we resell without modification. As of June 30, 2011, we offered more than 2,600 SKUs for other system accessories.
Technology
We are focused on providing leading edge, high performance products for our customers. We have developed a design process to rapidly deliver products with superior features. The technology incorporated in our products is designed to provide high levels of reliability, quality, security and scalability. Our most advanced technology is developed in-house, which allows us to efficiently implement advanced capabilities into our server solutions. We work in collaboration with our key customers and suppliers to constantly improve upon our designs, reduce complexity and improve reliability.
Our rackmount and tower server solutions are based on our Super SSI architecture, which incorporates proprietary I/O expansion, thermal and cooling design features as well as high-efficiency power supplies. For example, our 1U servers now offer up to 5 I/O expansion slots with up to 32 DIMM slots to accommodate up to 512GB of memory, which, prior to Super SSI, was only possible in a 2U chassis. We also achieved higher memory densities by designing customized serverboards to include 16 memory slots without sacrificing I/O expansion capability. The result is what we believe to be a superior serverboard design that provides our customers with increased flexibility for their new and legacy add-on card support and the ability to keep up with the growing memory requirements needed to maintain system performance requirements.
Our latest chassis designs include advanced cooling mechanisms such as proprietary air shrouds to help deliver cool air directly to the hottest components of the system resulting in improved cooling efficiency and
11
Table of Contents
consequently increased system reliability. Our newest generation of power supplies incorporates advanced design features that provide what we believe to be the highest level of efficiency in the industry and therefore reduce overall power consumption. Our advanced power supply solutions include volume shipments of the industry’s first and only currently available 1U chassis and servers with up to 94% power efficiency.
Our 1U Twin, 2U Twin, 2U Twin², 2U Twin3 and TwinBlade product lines optimize for density, performance and efficiency, and have been rapidly adopted by customers and other manufacturers. Our GPU optimized product line in 1U, 2U, 4U and blade platforms provides extreme performance in calculation intensive applications. Our Atom server line featuring low power, low noise and small form factor is optimized for embedded and server appliance applications. Our innovative double-sided storage provides high density with the ability of hot-plug from front and back sides. Our Super Storage Bridge Bay (SBB) is optimized for mission-critical, enterprise-level storage application which can incorporate or bridge SATA, SAS, and FC storage solutions and provides hot-swappable canisters for all active components in the server.
We have developed standalone switch products, which include 1G Ethernet, 10G Ethernet, and Infiniband for rack-mount servers. These switch products will not only help us to up-sell our server products, but also can generate additional revenues.
Our SuperRack product lines offer a wide range of flexible accessory options including front, rear and side expansion units to provide modular solutions for system configuration. Data center, high-performance Cloud Computing and server farm customers can use us as a one-stop shop for all of their IT hardware needs. Our SuperRack offers easy installation and rear access with no obstructions for hot-swap devices, user-friendly cabling and cable identification, and effortless integration of our high-density server, storage and blade systems.
Our MicroCloud product lines are high-density, multi-node UP servers with 8 hot-pluggable nodes and 16 hot-swappable HDDs in a compact 3U form factor. MicroCloud integrates advanced technologies within a compact functional design to deliver high performance in environments with space and power limitations. The entire system is designed with efficiency in mind from its ease of maintenance to is high-efficiency, redundant Platinum Level (94%+) power modules. These combined features provide a compelling, cost-effective solution for IT professionals implementing new hosting architectures for SMB and Public/Private Cloud Computing applications.
Research and Development
We have over 18 years of research and development experience in server subsystems and accessories design and in recent years, have devoted additional resources to the design of server systems. Our engineering staff is responsible for the design, development, quality, documentation and release of our products. We continuously seek ways to optimize and improve the performance of our existing product portfolio and introduce new products to address market opportunities. We perform the majority of our research and development efforts in-house, increasing the communication and collaboration between design teams to streamline the development process and reducing time-to-market. We are determined to continue to reduce our design and manufacturing costs and improve the performance, cost effectiveness and thermal and space efficiency of our solutions.
Over the years, our research and development team has focused on the development of new and enhanced products that can support emerging protocols while continuing to accommodate legacy technologies. Much of our research and development activity is focused on the new product cycles of leading chipset vendors. We work closely with Intel, AMD, Nvidia and among others to develop products that are compatible with the latest generation of industry standard technologies under development. Our collaborative approach with the chipset vendors allows us to coordinate the design of our new products with their product release schedules, thereby enhancing our ability to rapidly introduce new products incorporating the latest technology. We work closely with their development teams to optimize chip performance and reduce system level issues. We also work with companies such as Nvidia on Graphics Processing Unit, or GPU, solutions. Similarly, we work very closely with our customers to identify their needs and develop our new product plans accordingly.
12
Table of Contents
We believe that the combination of our focus on internal research and development activities, our close working relationships with chipset vendors and our modular design approach allow us to minimize time-to-market. Since January 2005, we believe we were the first to introduce the following new technologies to the market:
| • | a multi-core Xeon architecture with 144 GB main memory capability; |
| • | server solutions with a 1U configuration with high density I/O capability typically found in a 2U configuration, as well as a 5 I/O with PCI-E Gen2 expansion card in a 1U configuration; |
| • | configuration server solutions with a serial attached SCSI storage option capability with SCSI enclosure services, or SES2, for alerting users to drive temperature and fan failures; |
| • | 1U Twin design, including two DP boards configured in a 1U chassis which increases the density and reduces the power consumption; |
| • | The industry’s first 1U multiple-output silver-level certified power supply supporting our 2.5” HDD server / storage solutions; |
| • | 2U Twin² design, including four DP boards configured in a 2U chassis with hot-plug servers and redundant power which increases the density and reduces the power consumption; |
| • | The industry’s first optimized GPU 1U server providing extreme performance in graphics and computationally intensive applications; |
| • | TwinBlade design, supporting up to 20 dual-socket server blades in a 7U enclosure with 40GB/s Infiniband, or 10G Ethernet connectivity as options which provides the maximum density and reduces the power consumption by doubling the number of dual-processor compute nodes per 7U enclosure from 10 to 20; |
| • | The industry’s first line of double-sided storage chassis enabling extra high-density storage with ability of hot-plug front and back sides; |
| • | 2U Twin3 design, including eight UP nodes configured in a 2U chassis with hot-plug servers and redundant power which increases the density and reduces the power consumption particularly for Cloud Computing; |
| • | The 8-way server, the first clueless design 5U including 8 CPUs with 80 cores, 2TB of memory and high-efficiency redundant platform-level power supplies. It’s ideal for enterprise mission critical and virtualization applications; |
| • | MicroCloud design, supporting 8 UP nodes in a 3U enclosure with its high density and high efficiency features make it an optimized solution for hosting and cloud applications in an extremely low power consumption configuration; and |
| • | GPU SuperBlade, supporting 20 GPUs in a single 7U blade enclosure which delivers maximum performance with the design CPU to GPU balance and optimized I/O; |
As of June 30, 2011, we had 499 employees and 5 engineering consultants dedicated to research and development. Our total research and development expenses were $48.1 million, $37.4 million, and $34.5 million for fiscal years 2011, 2010 and 2009, respectively.
Sales, Marketing and Customer Service
To execute our strategy, we have developed a sales and marketing program which is primarily focused on indirect sales channels. As of June 30, 2011, our sales and marketing organization consisted of 153 employees and 28 independent sales representatives in 16 locations worldwide.
We work with distributors, including resellers and system integrators, and OEMs to market and sell customized solutions to their end customers. We provide sales and marketing assistance and training to our
13
Table of Contents
distributors and OEMs, who in turn provide service and support to end customers. We intend to leverage our relationships with key distributors and OEMs to penetrate select industry segments where our products can provide a superior alternative to existing solutions. For a more limited group of customers who do not normally purchase through distributors or OEMs, we have implemented a direct sales approach.
We maintain close contact with our distributors and end customers. We often collaborate during the sales process with our distributors and the customer’s technical point of contact to help determine the optimal system configuration for the customer’s needs. Our interaction with distributors and end customers allows us to monitor customer requirements and develop new products to better meet end customer needs.
International Sales
Product fulfillment and first level support for our international customers are provided by our distributors and OEMs. Our international sales efforts are supported both by our international offices in the Netherlands and Taiwan as well as by our U.S. sales organization. Sales to customers located outside of the U.S. represented 41.7%, 39.9% and 35.6% of net sales in fiscal years 2011, 2010 and 2009, respectively.
Marketing
Our marketing programs are designed to inform existing and potential customers, the trade press, distributors and OEMs about the capabilities and benefits of using our products and solutions. Our marketing efforts support the sale and distribution of our products through our distribution channels. We rely on a variety of marketing vehicles, including advertising, public relations, participation in industry trade shows and conferences to help gain market acceptance. We also provide funds for cooperative marketing to our distributors. These funds reimburse our distributors for promotional spending they may do on behalf of promoting Supermicro products. Promotional spending by distributors is subject to our pre-approval and includes items such as film or video for television, magazine or newspaper advertisements, trade show promotions and sales force promotions. The amount available to each distributor is based on its amount of purchases. We also work closely with leading microprocessor vendors in cooperative marketing programs and benefit from market development funds that they make available. These programs are similar to the programs we make available to our distributors in that we are reimbursed for expenses incurred related to promoting the vendor’s product.
Customer Service
We provide customer support for our blade and rackmount server systems through our website and 24-hour continuous direct phone based support. For strategic direct and OEM customers, we also have higher levels of customer service available, including, in some cases, on site service and support.
Customers
For fiscal year 2011, our products were purchased by over 600 customers, most of which are distributors, in 85 countries. None of our customers accounted for 10% or more of our net sales in fiscal years 2011, 2010 or 2009. End users of our products span a broad range of industries.
Intellectual Property
We seek to protect our intellectual property rights with a combination of trademark, copyright, trade secret laws and disclosure restrictions. We rely primarily on trade secrets, technical know-how and other unpatented proprietary information relating to our design and product development activities. We have issued patents and pending patent applications in the U.S. We also enter into confidentiality and proprietary rights agreements with our employees, consultants and other third parties and control access to our designs, documentation and other proprietary information.
14
Table of Contents
Despite our efforts to protect our proprietary rights, unauthorized parties may attempt to copy aspects of our products or obtain and use information that we regard as proprietary. We cannot assure you that the steps taken by us will prevent misappropriation of our technology. We cannot assure you that patents will issue from our pending or future applications or that, with respect to our issued or any future patents, they will not be challenged, invalidated or circumvented, or that the rights granted under the patents will provide us with meaningful protection or any commercial advantage. In addition, the laws of some foreign countries do not protect our proprietary rights to as great an extent as the laws of the United States, and many foreign countries do not enforce these laws as diligently as government agencies and private parties in the United States.
Our industry is characterized by the existence of a large number of patents and frequent claims and related litigation regarding patent and other intellectual property rights. From time-to-time, third parties, including competitors, may assert patent, copyright, trademark or other intellectual property rights against us, our channel partners or our end-customers. Successful claims of infringement by a third party could prevent us from performing certain services or require us to pay substantial damages, royalties or other fees. Even if third parties may offer a license to their technology, the terms of any offered license may not be acceptable and the failure to obtain a license or the costs associated with any license could cause our business, operating results or financial condition to be materially and adversely affected. We typically indemnify our end-customers and distributors against claims that our products infringe the intellectual property of third parties.
Manufacturing and Quality Control
We use several third party suppliers and contract manufacturers for materials and sub-assemblies, such as serverboards, chassis, disk drives, power supplies, fans and computer processors. We believe that selectively using outsourced manufacturing services allows us to focus on our core competencies in product design and development and increases our operational flexibility. Our manufacturing strategy allows us to quickly adjust manufacturing capacity in response to changes in customer demand and to rapidly introduce new products to the market. We use Ablecom, a related party, for contract design and manufacturing coordination support. We work with Ablecom to optimize modular designs for our chassis and certain of our other components. Ablecom coordinates the manufacturing of chassis for us. In addition to providing a larger volume of contract manufacturing services for us, Ablecom continues to warehouse for us a number of components and subassemblies manufactured by multiple suppliers prior to shipment to our facilities in the U.S., Europe and Asia.
For server systems, assembly, test and quality control are completed at our wholly-owned manufacturing facility in San Jose, California which Quality / Environmental Management System (Q/EMS) has been ISO 9001:2000 certified since 2001 and ISO 14001:2004 certified since 2009. In fiscal year 2010, we began server integration operations in our Netherlands and Taiwan facilities to be closer to our key international customers and to reduce costs of shipping our products to our customers. These facilities Q/EMS have also been ISO-9001:2000 certified and ISO 14001:2004 certified. In accordance with the two mentioned ISO standard requirements, environmental awareness, quality control and inventory management is flowed down as a requirement to our suppliers and contract manufacturers with continuous reporting and ongoing qualification programs. The assembly of our server system products involves integrating supplied materials and manufactured sub-assemblies into final products, which are configured and tested before being delivered to our customers.
We maintain sufficient inventory such that most of our orders can be filled within 14 days. We monitor our inventory on a continuous basis in order to be able to meet customer orders and to avoid inventory obsolescence. Due to our modular designs, our inventory can generally be used with multiple different products, further reducing the risk of inventory write-downs.
Competition
The market for our products is highly competitive, rapidly evolving and subject to new technological developments, changing customer needs and new product introductions. We compete primarily with large
15
Table of Contents
vendors of x86 general purpose servers and components. In addition, we also compete with a number of smaller vendors who specialize in the sale of server components and systems. We believe our principal competitors include:
| • | Global technology vendors such as Dell Inc., Hewlett-Packard Company, International Business Machines Corporation; |
| • | Original Design Manufacturers, or ODMs, such as Quanta Computer, Inc. |
The principal competitive factors in our market include the following:
| • | first to market with new emerging technologies; |
| • | flexible and customizable products to fit customers’ objectives; |
| • | high product performance and reliability; |
| • | early identification of emerging opportunities; |
| • | cost-effectiveness; |
| • | interoperability of products; |
| • | scalability; and |
| • | localized and responsive customer support on a worldwide basis. |
We believe that we compete favorably with respect to most of these factors. However, most of our competitors have longer operating histories, significantly greater resources and greater name recognition. They may be able to devote greater resources to the development, promotion and sale of their products than we can, which could allow them to respond more quickly to new technologies and changes in customer needs.
Employees
As of June 30, 2011, we employed 1,239 full time employees and 33 consultants, consisting of 499 employees in research and development, 153 employees in sales and marketing, 113 employees in general and administrative and 474 employees in manufacturing. Of these employees, 945 employees are based in our San Jose facility. We consider our highly qualified and motivated employees to be a key factor in our business success. Our employees are not represented by any collective bargaining organization and we have never experienced a work stoppage. We believe that our relations with our employees are good.
Available Information
Our Annual Report on Form 10-K, Quarterly Reports on Form 10-Q, Current Reports on Form 8-K and amendments to reports filed or furnished pursuant to Sections 13(a) and 15(d) of the Securities Exchange Act are available free of charge, on or through our website at www.supermicro.com , as soon as reasonably practicable after we electronically file such reports with, or furnish those reports to, the Securities and Exchange Commission. Information contained on our website is not incorporated by reference in, or made part of this Annual Report on Form 10-K or our other filings with or reports furnished to the Securities and Exchange Commission.
| Item 1A. | Risk Factors |
Risks Related to Our Business and Industry
Economic conditions could materially adversely affect us.
Our operations and performance depend significantly on worldwide economic conditions. Uncertainty about current global economic conditions poses a risk as consumers and businesses may continue to postpone spending in response to tighter credit, unemployment, negative financial news and/or declines in income or asset values, which could have a material negative effect on demand for our products and services.
16
Table of Contents
In the event of renewed financial turmoil affecting the banking system and financial markets, additional consolidation of the financial services industry, or significant financial service institution failures, there could be a new or incremental tightening in the credit markets, low liquidity, and extreme volatility in fixed income, credit, currency, and equity markets. In addition, the risk remains that there could be a number of follow-on effects from the credit crisis on our business, including the insolvency of key outsourcing partners or suppliers or their inability to obtain credit to finance development and/or manufacture products resulting in product delays; inability of customers, including channel partners, to obtain credit to finance purchases of our products and/or customer, including channel partner, insolvencies; and failure of derivative counterparties and other financial institutions negatively impacting our treasury operations. Uncertainty about current global economic conditions could also continue to increase the volatility of our stock price.
Our quarterly operating results will likely fluctuate in the future, which could cause rapid declines in our stock price.
As our business continues to grow, we believe that our quarterly operating results will be subject to greater fluctuation due to various factors, many of which are beyond our control. Factors that may affect quarterly operating results in the future include:
| • | our ability to attract new customers, retain existing customers and increase sales to such customers; |
| • | unpredictability of the timing and size of customer orders, since most of our customers purchase our products on a purchase order basis rather than pursuant to a long term contract; |
| • | fluctuations in availability and costs associated with materials needed to satisfy customer requirements; |
| • | variability of our margins based on the mix of server systems, subsystems and accessories we sell; |
| • | variability of operating expenses as a percentage of net sales; |
| • | the timing of the introduction of new products by leading microprocessor vendors and other suppliers; |
| • | our ability to introduce new and innovative server solutions that appeal to our customers; |
| • | our ability to address technology issues as they arise, improve our products’ functionality and expand our product offerings; |
| • | changes in our product pricing policies, including those made in response to new product announcements and pricing changes of our competitors; |
| • | mix of whether customer purchases are of full systems or subsystems and accessories and whether made directly or through indirect sales channels; |
| • | fluctuations based upon seasonality, with the quarters ending March 31 and September 30 typically being weaker; |
| • | the rate of expansion, domestically and internationally; |
| • | the effectiveness of our sales force and the efforts of our distributors; |
| • | the effect of mergers and acquisitions among our competitors, suppliers or partners; |
| • | general economic conditions in our geographic markets; and |
| • | impact of regulatory changes on our cost of doing business. |
Accordingly, it is difficult for us to accurately forecast our growth and results of operations on a quarterly basis. If we fail to meet expectations of investors or analysts, our stock price may fall rapidly and without notice. Furthermore, the fluctuation of quarterly operating results may render less meaningful period-to-period comparisons of our operating results, and you should not rely upon them as an indication of future performance.
17
Table of Contents
Our future financial performance will depend on the timely introduction and widespread acceptance of new server solutions and increased functionality of our existing server solutions.
Our future financial performance will depend on our ability to meet customer specifications and requirements by enhancing our current server solutions and developing server solutions with new and better functionality. The success of new features and new server solutions depends on several factors, including their timely introduction and market acceptance. We may not be successful in developing enhancements or new server solutions, or in timely bringing them to market. Customers may also defer purchases of our existing products pending the introduction of anticipated new products. For example, we experienced customer order delays in advance of Intel’s Nehalem microprocessor release at the end of the quarter ended March 31, 2009. If our new server solutions are not competitive with solutions offered by other vendors, we may not be perceived as a technology leader and could miss market opportunities. If we are unable to enhance the functionality of our server solutions or introduce new server solutions which achieve widespread market acceptance, our reputation will be damaged, the value of our brand will diminish, and our business will suffer. In addition, uncertainties about the timing and nature of new features and products could result in increases in our research and development expenses with no assurance of future sales.
We may not be able to successfully manage our planned growth and expansion.
Over time we expect to continue to make investments to pursue new customers and expand our product offerings to grow our business rapidly. In connection with this growth, we expect that our annual operating expenses will increase significantly if the economy continues to improve and as we invest in sales and marketing, research and development, manufacturing and production infrastructure, and strengthen customer service and support resources for our customers. Our failure to expand operational and financial systems timely or efficiently could result in additional operating inefficiencies, which could increase our costs and expenses more than we had planned and prevent us from successfully executing our business plan. We may not be able to offset the costs of operation expansion by leveraging the economies of scale from our growth in negotiations with our suppliers and contract manufacturers. Additionally, if we do increase our operating expenses in anticipation of the growth of our business and this growth does not meet our expectations, our financial results will be negatively impacted.
If our business grows, we will have to manage additional product design projects, materials procurement processes, and sales efforts and marketing for an increasing number of SKUs, as well as expand the number and scope of our relationships with suppliers, distributors and end customers. If we fail to manage these additional responsibilities and relationships successfully, we may incur significant costs, which may negatively impact our operating results.
Additionally, in our efforts to be first to market with new products with innovative functionality and features, we may devote significant research and development resources to products and product features for which a market does not develop quickly, or at all. If we are not able to predict market trends accurately, we may not benefit from such research and development activities, and our results of operations may suffer.
During fiscal 2010 and 2011, we began to significantly increase our operations in Taiwan and the Netherlands, in part to enable us to manufacture products and provide service closer to our customers’ locations in Europe and Asia. If we fail to effectively manage the transition of manufacturing and service operations to these locations or if we misjudge our ability to utilize this additional capacity, our gross margin and results of operations may suffer.
We may encounter difficulties with our ERP Systems.
As we grow our business we will need to enhance our enterprise resource planning, or ERP, System or acquire and implement a new system. Many companies have experienced delays and difficulties with the implementation of new or changed ERP systems that have had a negative effect on their business. Any disruptions, delays or deficiencies in the design and implementation of a revised or new ERP system could result
18
Table of Contents
in potentially much higher costs than we had anticipated and could adversely affect our ability to develop new products, provide services, fulfill contractual obligations, file reports with the SEC in a timely manner and/or otherwise operate our business, or otherwise impact our controls environment. Any of these consequences could have an adverse effect on our results of operations and financial condition.
The market in which we participate is highly competitive, and if we do not compete effectively, we may not be able to increase our market penetration, grow our net sales or improve our gross margins.
The market for server solutions is intensely competitive and rapidly changing. Barriers to entry in our market are relatively low and we expect increased challenges from existing as well as new competitors. Some of our principal competitors offer server solutions at a lower price, which has resulted in pricing pressures on sales of our server solutions. We expect further downward pricing pressure from our competitors and expect that we will have to price some of our server solutions aggressively to increase our market share with respect to those products, particularly for datacenter customers. If we are unable to maintain the margins on our server solutions, our operating results could be negatively impacted. In addition, if we do not develop new innovative server solutions, or enhance the reliability, performance, efficiency and other features of our existing server solutions, our customers may turn to our competitors for alternatives. In addition, pricing pressures and increased competition generally may also result in reduced sales, lower margins or the failure of our products to achieve or maintain widespread market acceptance, any of which could have a material adverse effect on our business, results of operations and financial condition.
Our principal competitors include global technology companies such as Dell, Inc., Hewlett-Packard Company, IBM and Intel. In addition, we also compete with a number of smaller vendors who also sell application optimized servers and original design manufacturers, or ODMs, such as Quanta Computer Incorporated. ODMs sell server solutions marketed or sold under a third party brand.
Many of our competitors enjoy substantial competitive advantages, such as:
| • | greater name recognition and deeper market penetration; |
| • | longer operating histories; |
| • | larger sales and marketing organizations and research and development teams and budgets; |
| • | more established relationships with customers, contract manufacturers and suppliers and better channels to reach larger customer bases; |
| • | larger customer service and support organizations with greater geographic scope; |
| • | a broader and more diversified array of products and services; and |
| • | substantially greater financial, technical and other resources. |
As a result, our competitors may be able to respond more quickly and effectively than we can to new or changing opportunities, technologies, standards or customer requirements. Competitors may seek to copy our innovations and use cost advantages from greater size to compete aggressively with us on price. Certain customers are also current or prospective competitors and as a result, assistance that we provide to them as customers may ultimately result in increased competitive pressure against us. Furthermore, because of these advantages, even if our application optimized server solutions are more effective than the products that our competitors offer, potential customers might accept competitive products in lieu of purchasing our products. The challenges we face from larger competitors will become even greater if consolidation or collaboration between or among our competitors occurs in our industry. For all of these reasons, we may not be able to compete successfully against our current or future competitors, and if we do not compete effectively, our ability to increase our net sales may be impaired.
19
Table of Contents
As we increasingly target larger customers, our customer base may become less diversified, our cost of sales may increase, and our sales may be less predictable.
We expect that as our business continues to grow, we will be increasingly dependent upon larger sales to maintain our rate of growth and that selling our server solutions to larger customers will create new challenges. However, if certain customers buy our products in greater volumes, and their business becomes a larger percentage of our net sales, we may grow increasingly dependent on those customers to maintain our growth. If our largest customers do not purchase our products at the levels or in the timeframes that we expect, our ability to maintain or grow our net sales will be adversely affected.
Additionally, as we and our distribution partners focus increasingly on selling to larger customers and attracting larger orders, we expect greater costs of sales. Our sales cycle may become longer and more expensive, as larger customers typically spend more time negotiating contracts than smaller customers. Larger customers often seek to gain greater pricing concessions, as well as greater levels of support in the implementation and use of our server solutions. These factors can result in lower margins for our products.
Increased sales to larger companies may also cause fluctuations in results of operations. A larger customer may seek to fulfill all or substantially all of its requirements in a single order, and not make another purchase for a significant period of time. Accordingly, a significant increase in revenue during the period in which we recognize the revenue from the sale may be followed by a period of time during which the customer purchases none or few of our products. A significant decline in net sales in periods following a significant order could adversely affect our stock price.
We must work closely with our suppliers to make timely new product introductions.
We rely on our close working relationships with our suppliers, including Intel, AMD and Nvidia, to anticipate and deliver new products on a timely basis when new generation materials and core components are made available. Intel, AMD and Nvidia are the only suppliers of the microprocessors we use in our server systems. If we are not able to maintain our relationships with our suppliers or continue to leverage their research and development capabilities to develop new technologies desired by our customers, our ability to quickly offer advanced technology and product innovations to our customers would be impaired. We have no long term agreements that obligate our suppliers to continue to work with us or to supply us with products.
Our suppliers’ failure to improve the functionality and performance of materials and core components for our products may impair or delay our ability to deliver innovative products to our customers.
We need our material and core component suppliers, such as Intel, AMD and Nvidia, to provide us with core components that are innovative, reliable and attractive to our customers. Due to the pace of innovation in our industry, many of our customers may delay or reduce purchase decisions until they believe that they are receiving best of breed products that will not be rendered obsolete by an impending technological development. Accordingly, demand for new server systems that incorporate new products and features is significantly impacted by our suppliers’ new product introduction schedules and the functionality, performance and reliability of those new products. If our materials and core component suppliers fail to deliver new and improved materials and core components for our products, we may not be able to satisfy customer demand for our products in a timely manner, or at all. If our suppliers’ components do not function properly, we may incur additional costs and our relationships with our customers may be adversely affected.
As our business grows and if the economy does not improve, we expect that we may be exposed to greater customer credit risks.
Historically, we have offered limited credit terms to our customers. As our customer base expands, as our orders increase in size, and as we obtain more direct customers, we expect to offer increased credit terms and flexible payment programs to our customers. Doing so may subject us to increased credit risk, higher accounts
20
Table of Contents
receivable with longer days outstanding, and increases in charges or reserves, which could have a material adverse effect on our business, results of operations and financial condition. Likewise, if the economic recovery does not continue, we could be exposed to greater credit risk.
Our ability to develop our brand is critical to our ability to grow.
We believe that acceptance of our server solutions by an expanding customer base depends in large part on increasing awareness of the Supermicro brand and that brand recognition will be even more important as competition in our market develops. In particular, we expect an increasing proportion of our sales to come from sales of server systems, the sales of which we believe may be particularly impacted by brand strength. Successful promotion of our brand will depend largely on the effectiveness of our marketing efforts and on our ability to develop reliable and useful products at competitive prices. To date, we have not devoted significant resources to building our brand, and have limited experience in increasing customer awareness of our brand. Our future brand promotion activities, including any expansion of our cooperative marketing programs with strategic partners, may involve significant expense and may not generate desired levels of increased revenue, and even if such activities generate some increased revenue, such increased revenue may not offset the expenses we incurred in endeavoring to build our brand. If we fail to successfully promote and maintain our brand, or incur substantial expenses in our attempts to promote and maintain our brand, we may fail to attract enough new customers or retain our existing customers to the extent necessary to realize a sufficient return on our brand-building efforts, and as a result our operating results and financial condition could suffer.
We principally rely on indirect sales channels for the sale and distribution of our products and any disruption in these channels could adversely affect our sales.
Historically, a majority of our revenues have resulted from sales of our products through third party distributors and resellers, which sales accounted for 56.1%, 66.7% and 64.9% of our net sales in fiscal years 2011, 2010 and 2009, respectively. We depend on our distributors to assist us in promoting market acceptance of our products and anticipate that a majority of our revenues will continue to result from sales through indirect channels. To maintain and potentially increase our revenue and profitability, we will have to successfully preserve and expand our existing distribution relationships as well as develop new distribution relationships. Our distributors also sell products offered by our competitors and may elect to focus their efforts on these sales. If our competitors offer our distributors more favorable terms or have more products available to meet the needs of their customers, or utilize the leverage of broader product lines sold through the distributors, those distributors may de-emphasize or decline to carry our products. In addition, our distributors’ order decision-making process is complex and involves several factors, including end customer demand, warehouse allocation and marketing resources, which can make it difficult to accurately predict total sales for the quarter until late in the quarter. We also do not control the pricing or discounts offered by distributors to end customers. To maintain our participation in distributors’ marketing programs, in the past we have provided cooperative marketing arrangements or made short-term pricing concessions.
The discontinuation of cooperative marketing arrangements or pricing concessions could have a negative effect on our business. Our distributors could also modify their business practices, such as payment terms, inventory levels or order patterns. If we are unable to maintain successful relationships with distributors or expand our distribution channels or we experience unexpected changes in payment terms, inventory levels or other practices by our distributors, our business will suffer.
We may be unable to accurately predict future sales through our distributors, which could harm our ability to efficiently manage our resources to match market demand.
Since a significant portion of our sales are made through domestic and international distributors, our financial results, quarterly product sales, trends and comparisons are affected by fluctuations in the buying patterns of end customers and our distributors, and by the changes in inventory levels of our products held by these distributors. We generally record revenue based upon a “sell-in” model which means that we generally
21
Table of Contents
record revenue upon shipment to our distributors. For more information regarding our revenue recognition policies, see “Management’s Discussion and Analysis of Financial Condition and Results of Operations—Critical Accounting Policies.” While we attempt to assist our distributors in maintaining targeted stocking level of our products, we may not consistently be accurate or successful. This process involves the exercise of judgment and use of assumptions as to future uncertainties including end customer demand. Our distributors also have various rights to return products which could, among other things, result in our having to repurchase inventory which has declined in value or is obsolete. Consequently, actual results could differ from our estimates. Inventory levels of our products held by our distributors may exceed or fall below the levels we consider desirable on a going-forward basis. This could adversely affect our distributors or our ability to efficiently manage or invest in internal resources, such as manufacturing and shipping capacity, to meet the demand for our products.
Any failure to adequately expand or retain our sales force will impede our growth.
Though we expect to continue to rely primarily on third party distributors to sell our server solutions, we expect that, over time, our direct sales force will grow. Competition for direct sales personnel with the advanced sales skills and technical knowledge we need is intense. Our ability to grow our revenue in the future will depend, in large part, on our success in recruiting, training, retaining and successfully managing sufficient qualified direct sales personnel. We have traditionally experienced greater turnover in our sales and marketing personnel as compared to other departments. New hires require significant training and may take six months or longer before they reach full productivity. Our recent hires and planned hires may not become as productive as we would like, and we may be unable to hire sufficient numbers of qualified individuals in the future in the markets where we do business. If we are unable to hire, develop and retain sufficient numbers of productive sales personnel, sales of our server solutions will suffer.
Our direct sales efforts may create confusion for our end customers and harm our relationships with our distributors and OEMs.
Though our direct sales efforts have historically been limited and focused on customers who typically do not buy from distributors or OEMs, we expect our direct sales force to grow as our business grows. As our direct sales force becomes larger, our direct sales efforts may lead to conflicts with our distributors and OEMs, who may view our direct sales efforts as undermining their efforts to sell our products. If a distributor or OEM deems our direct sales efforts to be inappropriate, the distributor or OEM may not effectively market our products, may emphasize alternative products from competitors, or may seek to terminate our business relationship. Disruptions in our distribution channels could cause our revenues to decrease or fail to grow as expected. Our failure to implement an effective direct sales strategy that maintains and expands our relationships with our distributors and OEMs could lead to a decline in sales and adversely affect our results of operations.
If we are required to change the timing of our revenue recognition, our net sales and net income could decrease.
We currently record revenue based upon a “sell-in” model with revenues generally recorded upon shipment of products to our distributors. This is in contrast to a “sell-through” model pursuant to which revenues are generally recognized upon sale of products by distributors to their customers. This requires that we maintain a reserve to cover the estimated costs of any returns or exercises of stock rotation rights, which we estimate primarily based on our historical experience. If facts and circumstances change such that the rate of returns of our products exceeds our historical experience, we may have to increase our reserve, which, in turn, would cause our revenue to decline. Similarly, if facts and circumstances change such that we are no longer able to determine reasonable estimates of our sales returns, we would be required to defer our revenue recognition until the point of sale from the distributors to their customers. Any such change may negatively impact our net sales or net income for particular periods and cause a decline in our stock price. For additional information regarding our revenue recognition policies, see “Management’s Discussion and Analysis of Financial Condition and Results of Operations—Critical Accounting Policies.”
22
Table of Contents
The average selling prices for our existing server solutions are subject to decline if customers do not continue to purchase our latest generation products, which could harm our results of operations.
As with most electronics based products, average selling prices of servers typically are highest at the time of introduction of new products, which utilize the latest technology, and tend to decrease over time as such products become commoditized and are ultimately replaced by even newer generation products. As our business continues to grow, we may increasingly be subject to this industry risk. We cannot predict the timing or amount of any decline in the average selling prices of our server solutions that we may experience in the future. In some instances, our agreements with our distributors limit our ability to reduce prices unless we make such price reductions available to them, or price protect their inventory. If we are unable to decrease per unit manufacturing costs faster than the rate at which average selling prices continue to decline, our business, financial condition and results of operations will be harmed.
Our cost structure and ability to deliver server solutions to customers in a timely manner may be adversely affected by volatility of the market for core components and materials for our products.
Prices of materials and core components utilized in the manufacture of our server solutions, such as serverboards, chassis, central processing units, or CPUs, memory and hard drives represent a significant portion of our cost of sales. We generally do not enter into long-term supply contracts for these materials and core components, but instead purchase these materials and components on a purchase order basis. Prices of these core components and materials are volatile, and, as a result, it is difficult to predict expense levels and operating results. In addition, if our business growth renders it necessary or appropriate to transition to longer term contracts with materials and core component suppliers, our costs may increase and our gross margins could correspondingly decrease.
Because we often acquire materials and core components on an as needed basis, we may be limited in our ability to effectively and efficiently respond to customer orders because of the then-current availability or the terms and pricing of materials and core components. Our industry has experienced materials shortages and delivery delays in the past, and we may experience shortages or delays of critical materials in the future. From time to time, we have been forced to delay the introduction of certain of our products or the fulfillment of customer orders as a result of shortages of materials and core components. For example, we were unable to fulfill certain orders at the end of the quarter ended June 30, 2010 due to component shortages. If shortages or delays arise, the prices of these materials and core components may increase or the materials and core components may not be available at all. In addition, in the event of shortages, some of our larger competitors may have greater abilities to obtain materials and core components due to their larger purchasing power. We may not be able to secure enough core components or materials at reasonable prices or of acceptable quality to build new products to meet customer demand, which could adversely affect our business and financial results.
In order to address market volatility, we from time to make larger investments in material and component inventory. Such investments expose us to risk for lower margins or loss on disposal of such inventory if your expectations of customer demand are incorrect and the market price of the material or component inventory decline.
We may lose sales or incur unexpected expenses relating to insufficient, excess or obsolete inventory.
As a result of our strategy to provide greater choice and customization of our products to our customers, we are required to maintain a high level of inventory. If we fail to maintain sufficient inventory, we may not be able to meet demand for our products on a timely basis, and our sales may suffer. If we overestimate customer demand for our products, we could experience excess inventory of our products and be unable to sell those products at a reasonable price, or at all. As a result, we may need to record higher inventory reserves. If we are later able to sell such products at a profit, it may increase the quarterly variances in our operating results. Additionally, the rapid pace of innovation in our industry could render significant portions of our existing inventory obsolete. Certain of our distributors and OEMs have rights to return products, limited to purchases over
23
Table of Contents
a specified period of time, generally within 60 to 90 days of the purchase, or to products in the distributor’s or OEM’s inventory at certain times, such as termination of the agreement or product obsolescence. Any returns under these arrangements could result in additional obsolete inventory. In addition, server systems, subsystems and accessories that have been customized and later returned by those of our customers and partners who have return rights or stock rotation rights may be unusable for other purposes or may require reformation at additional cost to be made ready for sale to other customers. Excess or obsolete inventory levels for these or other reasons could result in unexpected expenses or increases in our reserves against potential future charges which would adversely affect our business and financial results. For example, during fiscal years 2011, 2010 and 2009, we recorded inventory write-downs charged to cost of sales of $3.4 million, $2.6 million and $1.5 million, for excess and obsolete inventory. For additional information regarding customer return rights, see “Management’s Discussion and Analysis of Financial Condition and Results of Operations—Critical Accounting Policies—Revenue Recognition.”
Our focus on internal development and customizable server solutions could delay our introduction of new products and result in increased costs.
Our strategy is to rely to a significant degree on internally developed components, even when third party components may be available. We believe this allows us to develop products with a greater range of features and functionality and allows us to develop solutions that are more customized to customer needs. However, if not properly managed, this reliance on internally developed components may be more costly than use of third party components, thereby making our products less price competitive or reducing our margins. In addition, our reliance on internal development may lead to delays in the introduction of new products and impair our ability to introduce products rapidly to market. We may also experience increases in our inventory costs and obsolete inventory, thereby reducing our margins.
Our research and development expenditures, as a percentage of our net sales, are considerably higher than many of our competitors and our earnings will depend upon maintaining revenues and margins that offset these expenditures.
Our strategy is to focus on being consistently rapid-to-market with flexible and customizable server systems that take advantage of our own internal development and the latest technologies offered by microprocessor manufacturers and other component vendors. Consistent with this strategy, we spend higher amounts, as a percentage of revenues, on research and development costs than many of our competitors. If we can not sell our products in sufficient volume and with adequate gross margins to compensate for such investment in research and development, our earnings may be materially and adversely affected.
If our limited number of contract manufacturers or suppliers of materials and core components fail to meet our requirements, we may be unable to meet customer demand for our products, which could decrease our revenues and earnings.
We purchase many sophisticated materials and core components from one or a limited number of qualified suppliers and rely on a limited number of contract manufacturers to provide value added design, manufacturing, assembly and test services. We generally do not have long-term agreements with these vendors, and instead obtain key materials and services through purchase order arrangements. We have no contractual assurances from any contract manufacturer that adequate capacity will be available to us to meet future demand for our products.
Consequently, we are vulnerable to any disruptions in supply with respect to the materials and core components provided by limited-source suppliers, and we are at risk of being harmed by discontinuations of design, manufacturing, assembly or testing services from our contract manufacturers. We have occasionally experienced delivery delays from our suppliers and contract manufacturers because of high industry demand or because of inability to meet our quality or delivery requirements. For example, in the past we experienced delays in the delivery of printed circuit board material as a result of the loss of two of our five printer circuit board
24
Table of Contents
vendors. One of the vendors filed for bankruptcy and the other changed its business model and ceased supplying us. The delays in delivery of the materials resulted in a reduction of net sales for the quarter of approximately two to three million dollars. If our relationships with our suppliers and contract manufactures are negatively impacted by late payments or other issues, we may not receive timely delivery of materials and core components. If we were to lose any of our current supply or contract manufacturing relationships, the process of identifying and qualifying a new supplier or contract manufacturer who will meet our quality and delivery requirements, and who will appropriately safeguard our intellectual property, may require a significant investment of time and resources, adversely affecting our ability to satisfy customer purchase orders and delaying our ability to rapidly introduce new products to market. Similarly, if any of our suppliers were to cancel or materially change contracts or commitments to us or fail to meet the quality or delivery requirements needed to satisfy customer demand for our products, our reputation and relationships with customers could be damaged. We could lose orders, be unable to develop or sell some products cost-effectively or on a timely basis, if at all, and have significantly decreased revenues, margins and earnings, which would have a material adverse effect on our business.
The recent earthquake and tsunami in Japan has disrupted the global supply chain for components manufactured in Japan, some of which are incorporated in our products or included in the end user products of our customers. Due to cross dependencies, supply chain disruptions stemming from the occurrences in Japan could negatively impact the demand for our products or our ability to supply products, including, for example, if we are unable to obtain sufficient supply of our components required for our products or our customers are unable to obtain sufficient supply of other components required for their end products. While we have increased our inventory to reduce risk of supply chain disruption we cannot assure that our ability to obtain components on a timely basis will not be adversely impacted.
Our failure to deliver high quality server solutions could damage our reputation and diminish demand for our products.
Our server solutions are critical to our customers’ business operations. Our customers require our server solutions to perform at a high level, contain valuable features and be extremely reliable. The design of our server solutions is sophisticated and complex, and the process for manufacturing, assembling and testing our server solutions is challenging. Occasionally, our design or manufacturing processes may fail to deliver products of the quality that our customers require. For example, in the past a vendor provided us with a defective capacitor that failed under certain heavy use applications. As a result, our product needed to be repaired. Though the vendor agreed to pay for a large percentage of the costs of the repairs, we incurred costs in connection with the recall and diverted resources from other projects.
New flaws or limitations in our server solutions may be detected in the future. Part of our strategy is to bring new products to market quickly, and first-generation products may have a higher likelihood of containing undetected flaws. If our customers discover defects or other performance problems with our products, our customers’ businesses, and our reputation, may be damaged. Customers may elect to delay or withhold payment for defective or underperforming server solutions, request remedial action, terminate contracts for untimely delivery, or elect not to order additional server solutions, which could result in an increase in our provision for doubtful accounts, an increase in collection cycles for accounts receivable or subject us to the expense and risk of litigation. We may incur expense in recalling, refurbishing or repairing defective server solutions. If we do not properly address customer concerns about our products, our reputation and relationships with our customers may be harmed. For all of these reasons, customer dissatisfaction with the quality of our products could substantially impair our ability to grow our business.
Conflicts of interest may arise between us and Ablecom Technology Inc., one of our major contract manufacturers, and those conflicts may adversely affect our operations.
We use Ablecom, a related party, for contract design and manufacturing coordination support. We work with Ablecom to optimize modular designs for our chassis and certain of other components. Our purchases from
25
Table of Contents
Ablecom represented 19.6%, 20.5% and 22.1% of our cost of sales for fiscal years 2011, 2010 and 2009, respectively. Ablecom’s sales to us constitute a substantial majority of Ablecom’s net sales. Ablecom is a privately-held Taiwan-based company.
Steve Liang, Ablecom’s Chief Executive Officer and largest shareholder, is the brother of Charles Liang, our President, Chief Executive Officer and Chairman of the Board. Charles Liang, and his spouse, Chiu-Chu (Sara) Liu Liang, our Vice President of Operations, Treasurer and director, jointly own 10.5% of Ablecom’s outstanding common stock. Mr. Charles Liang, Ms. Liang, Mr. Steve Liang and relatives of these individuals own 46.4% of Ablecom’s outstanding common stock. Mr. and Mrs. Charles Liang, as directors, officers and significant stockholders of the Company, have considerable influence over the management of our business relationships. Accordingly, we may be disadvantaged by their economic interests as stockholders of Ablecom and their personal relationship with Ablecom’s Chief Executive Officer. We may not negotiate or enforce contractual terms as aggressively with Ablecom as we might with an unrelated party, and the commercial terms of our agreements may be less favorable than we might obtain in negotiations with third parties. If our business dealings with Ablecom are not as favorable to us as arms-length transactions, our results of operations may be harmed.
If Steve Liang ceases to have significant influence over Ablecom, or if those of our stockholders who hold shares of Ablecom cease to have a significant amount of the outstanding shares of Ablecom, the terms and conditions of our agreements with Ablecom may not be as favorable as those in our existing contracts. As a result, our costs could increase and adversely affect our margins and results of operations.
Our relationship with Ablecom may allow us to benefit from favorable pricing which may result in reported results more favorable than we might report in the absence of our relationship.
Although we generally re-negotiate the price of products that we purchase from Ablecom on a quarterly basis, pursuant to our agreements with Ablecom either party may re-negotiate the price of products for each order. As a result of our relationship with Ablecom, it is possible that Ablecom may in the future sell products to us at a price lower than we could obtain from an unrelated third party supplier. This may result in future reporting of gross profit as a percentage of net sales that is in excess of what we might have obtained absent our relationship with Ablecom.
Our reliance on Ablecom could be subject to risks associated with our reliance on a limited source of contract manufacturing services and inventory warehousing.
We continue to maintain our manufacturing relationship with Ablecom in Asia. In order to provide a larger volume of contract manufacturing services for us, Ablecom will continue to warehouse for us an increasing number of components and subassemblies manufactured by multiple suppliers prior to shipment to our facilities in the U.S. and Europe. We also anticipate that we will continue to lease office space from Ablecom in Taiwan to support the research and development efforts we are undertaking.
If we or Ablecom fail to manage the contract manufacturing services and warehouse operations in Asia, we may experience delays in our ability to fulfill customer orders. Similarly, if Ablecom’s facility in Asia is subject to damage, destruction or other disruptions, our inventory may be damaged or destroyed, and we may be unable to find adequate alternative providers of contract manufacturing services in the time that we or our customers require. We could lose orders and be unable to develop or sell some products cost-effectively or on a timely basis, if at all.
Currently, we purchase contract manufacturing services primarily for our chassis and power supply products from Ablecom. If our commercial relationship with Ablecom were to deteriorate or terminate, establishing direct relationships with those entities supplying Ablecom with key materials for our products or identifying and negotiating agreements with alternative providers of warehouse and contract manufacturing services might take a
26
Table of Contents
considerable amount of time and require a significant investment of resources. Pursuant to our agreements with Ablecom and subject to certain exceptions, Ablecom has the exclusive right to be our supplier of the specific products developed under such agreements. As a result, if we are unable to obtain such products from Ablecom on terms acceptable to us, we may need to identify a new supplier, change our design and acquire new tooling, all of which could result in delays in our product availability and increased costs. If we need to use other suppliers, we may not be able to establish business arrangements that are, individually or in the aggregate, as favorable as the terms and conditions we have established with Ablecom. If any of these things should occur, our net sales, margins and earnings could significantly decrease, which would have a material adverse effect on our business.
Our growth into markets outside the United States exposes us to risks inherent in international business operations.
We market and sell our systems and components both domestically and outside the United States. We intend to expand our international sales efforts, especially into Asia and are expanding our business operations in Europe and Asia, particularly in the Netherlands, Taiwan and China. Our international expansion efforts may not be successful. Our international operations expose us to risks and challenges that we would otherwise not face if we conducted our business only in the United States, such as:
| • | heightened price sensitivity from customers in emerging markets; |
| • | our ability to establish local manufacturing, support and service functions, and to form channel relationships with resellers in non-U.S. markets; |
| • | localization of our systems and components, including translation into foreign languages and the associated expenses; |
| • | compliance with multiple, conflicting and changing governmental laws and regulations; |
| • | foreign currency fluctuations; |
| • | limited visibility into sales of our products by our distributors; |
| • | laws favoring local competitors; |
| • | weaker legal protections of intellectual property rights and mechanisms for enforcing those rights; |
| • | market disruptions created by public health crises in regions outside the U.S., such as Avian flu, SARS and other diseases; |
| • | difficulties in staffing and managing foreign operations, including challenges presented by relationships with workers’ councils and labor unions; and |
| • | changing regional economic and political conditions. |
These factors could limit our future international sales or otherwise adversely impact our operations.
We have in the past entered into plea and settlement agreements with the government relating to violations of export control and related laws; if we fail to comply with laws and regulations restricting dealings with sanctioned countries, we may be subject to future civil or criminal penalties, which may have a material adverse effect on our business or ability to do business outside the U.S.
In 2006, we entered into certain plea and settlement agreement with government agencies relating to export control and related law violations for activities that occurred in the 2001 to 2003 timeframe. We believe we are currently in compliance in all material respects with applicable export related laws and regulations. However, if our export compliance program is not effective, or if we are subject to any future claims regarding violation of export control and economic sanctions laws, we could be subject to civil or criminal penalties, which could lead to a material fine or other sanctions, including loss of export privileges, that may have a material adverse effect
27
Table of Contents
on our business, financial condition, results of operation and future prospects. In addition, these plea and settlement agreements and any future violations could have an adverse impact on our ability to sell our products to U.S. federal, state and local government and related entities.
Any failure to protect our intellectual property rights, trade secrets and technical know-how could impair our brand and our competitiveness.
Our ability to prevent competitors from gaining access to our technology is essential to our success. If we fail to protect our intellectual property rights adequately, we may lose an important advantage in the markets in which we compete. Trademark, patent, copyright and trade secret laws in the United States and other jurisdictions as well as our internal confidentiality procedures and contractual provisions are the core of our efforts to protect our proprietary technology and our brand. Our patents and other intellectual property rights may be challenged by others or invalidated through administrative process or litigation, and we may initiate claims or litigation against third parties for infringement of our proprietary rights. Such administrative proceedings and litigation are inherently uncertain and divert resources that could be put towards other business priorities. We may not be able to obtain a favorable outcome and may spend considerable resources in our efforts to defend and protect our intellectual property.
Furthermore, legal standards relating to the validity, enforceability and scope of protection of intellectual property rights are uncertain. Effective patent, trademark, copyright and trade secret protection may not be available to us in every country in which our products are available. The laws of some foreign countries may not be as protective of intellectual property rights as those in the United States, and mechanisms for enforcement of intellectual property rights may be inadequate.
Accordingly, despite our efforts, we may be unable to prevent third parties from infringing upon or misappropriating our intellectual property and using our technology for their competitive advantage. Any such infringement or misappropriation could have a material adverse effect on our business, results of operations and financial condition.
Resolution of claims that we have violated or may violate the intellectual property rights of others could require us to indemnify our customers, resellers or vendors, redesign our products, or pay significant royalties to third parties, and materially harm our business.
Our industry is marked by a large number of patents, copyrights, trade secrets and trademarks and by frequent litigation based on allegations of infringement or other violation of intellectual property rights. Third-parties have in the past sent us correspondence regarding their intellectual property and in the future we may receive claims that our products infringe or violate third parties’ intellectual property rights. In addition, increasingly non-operating companies are purchasing patents and bringing claims against technology companies. We settled one claim in fiscal year 2011. Successful intellectual property claims against us from others could result in significant financial liability or prevent us from operating our business or portions of our business as we currently conduct it or as we may later conduct it. In addition, resolution of claims may require us to redesign our technology, to obtain licenses to use intellectual property belonging to third parties, which we may not be able to obtain on reasonable terms, to cease using the technology covered by those rights, and to indemnify our customers, resellers or vendors. Any claim, regardless of its merits, could be expensive and time consuming to defend against, and divert the attention of our technical and management resources.
If we lose Charles Liang, our President, Chief Executive Officer and Chairman, or any other key employee or are unable to attract additional key employees, we may not be able to implement our business strategy in a timely manner.
Our future success depends in large part upon the continued service of our executive management team and other key employees. In particular, Charles Liang, our President, Chief Executive Officer and Chairman of the
28
Table of Contents
Board, is critical to the overall management of our company as well as to the development of our culture and our strategic direction. Mr. Liang co-founded our company and has been our Chief Executive Officer since our inception. His experience in running our business and his personal involvement in key relationships with suppliers, customers and strategic partners are extremely valuable to our company. We currently do not have a succession plan for the replacement of Mr. Liang if it were to become necessary. Additionally, we are particularly dependent on the continued service of our existing research and development personnel because of the complexity of our products and technologies. Our employment arrangements with our executives and employees do not require them to provide services to us for any specific length of time, and they can terminate their employment with us at any time, with or without notice, without penalty. The loss of services of any of these executives or of one or more other key members of our team could seriously harm our business.
To execute our growth plan, we must attract additional highly qualified personnel, including additional engineers and executive staff. Competition for qualified personnel is intense, especially in San Jose, where we are headquartered. We have experienced in the past and may continue to experience difficulty in hiring and retaining highly skilled employees with appropriate qualifications. In particular, we are currently working to add personnel in our finance, accounting and general administration departments, which have historically had limited budgets and staffing. If we are unable to attract and integrate additional key employees in a manner that enables us to scale our business and operations effectively, or if we do not maintain competitive compensation policies to retain our employees, our ability to operate effectively and efficiently could be limited.
Backlog does not provide a substantial portion of our net sales in any quarter.
Our net sales are difficult to forecast because we do not have sufficient backlog of unfilled orders to meet our quarterly net sales targets at the beginning of a quarter. Rather, a majority of our net sales in any quarter depend upon customer orders that we receive and fulfill in that quarter. Because our expense levels are based in part on our expectations as to future net sales and to a large extent are fixed in the short term, we might be unable to adjust spending in time to compensate for any shortfall in net sales. Accordingly, any significant shortfall of revenues in relation to our expectations would harm our operating results.
Our business and operations are especially subject to the risks of earthquakes other natural catastrophic events.
Our corporate headquarters, including our most significant research and development and manufacturing operations, are located in the Silicon Valley area of Northern California, a region known for seismic activity. We do not currently have a comprehensive disaster recovery program and as a result, a significant natural disaster, such as an earthquake, could have a material adverse impact on our business, operating results, and financial condition. Although we are in the process of preparing such a program, there is no assurance that it will be effective in the event of such a disaster.
We invest in auction rate securities that are subject to market risk and the recent problems in the financial markets could adversely affect the value and liquidity of our assets.
As of June 30, 2011, we held $5.2 million of auction rate securities, net of unrealized losses, representing our interest in auction rate preferred shares in a closed end mutual fund invested in municipal securities and auction rate student loans guaranteed by the Federal Family Education Loan Program; such auction rate securities were rated AAA or BAA at June 30, 2011. These auction rate preferred shares have no stated maturity date and the stated maturity dates for these auction rate student loans range from 2035 to 2040.
Based on our assessment of fair value at June 30, 2011, we have recorded an accumulated unrealized loss of $0.2 million, net of deferred income taxes, on long-term auction rate securities. The unrealized loss was deemed to be temporary and has been recorded as a component of accumulated other comprehensive loss.
29
Table of Contents
Although we have determined that we will not likely be required to sell the securities before their anticipated recovery and we have the intent and ability to hold our investments until successful auctions occur, these investments are not currently liquid and in the event we need to access these funds, we will not be able to do so without a loss of principal. There can be no assurances that these investments will be settled in the short term or that they will not become other-than-temporarily impaired subsequent to June 30, 2011, as the market for these investments is presently uncertain. In any event, we do not have a present need to access these funds for operational purposes. We will continue to monitor and evaluate these investments as there is no assurance as to when the market for these investments will allow us to liquidate them. We may be required to record impairment charges in periods subsequent to June 30, 2011 with respect to these securities and, if a liquid market does not develop for these investments, we could be required to hold them to maturity.
If we are unable to favorably assess the effectiveness of our internal control over financial reporting, or if our independent auditors are unable to provide an unqualified attestation report on our internal control over financial reporting, our stock price could be adversely affected.
Pursuant to Section 404 of the Sarbanes-Oxley Act of 2002, or Section 404, our management is required to report on the effectiveness of our internal control over financial reporting in our annual reports. In addition, our independent auditors must attest to and report on the effectiveness of our internal control over financial reporting. The rules governing the standards that must be met for management to assess our internal control over financial reporting are complex, and require significant documentation, testing and possible remediation. As a result, our efforts to comply with Section 404 have required the commitment of significant managerial and financial resources. As we are committed to maintaining high standards of public disclosure, our efforts to comply with Section 404 are ongoing, and we are continuously in the process of reviewing, documenting and testing our internal control over financial reporting, which will result in continued commitment of significant financial and managerial resources. Although we strive to maintain effective internal controls over financial reporting in order to prevent and detect material misstatements in our annual and quarterly financial statements and prevent fraud, we cannot assure that such efforts will be effective. If we fail to maintain effective internal controls in future periods, our operating results, financial position and stock price could be adversely affected.
Our operations involve the use of hazardous and toxic materials, and we must comply with environmental laws and regulations, which can be expensive, and may affect our business and operating results.
We are subject to federal, state and local regulations relating to the use, handling, storage, disposal and human exposure to hazardous and toxic materials. If we were to violate or become liable under environmental laws in the future as a result of our inability to obtain permits, human error, accident, equipment failure or other causes, we could be subject to fines, costs, or civil or criminal sanctions, face third party property damage or personal injury claims or be required to incur substantial investigation or remediation costs, which could be material, or experience disruptions in our operations, any of which could have a material adverse effect on our business. In addition, environmental laws could become more stringent over time imposing greater compliance costs and increasing risks and penalties associated with violations, which could harm our business.
We also face increasing complexity in our product design as we adjust to new and future requirements relating to the materials composition of our products, including the restrictions on lead and other hazardous substances applicable to specified electronic products placed on the market in the European Union (Restriction on the Use of Hazardous Substances Directive 2002/95/EC, also known as the RoHS Directive). We are also subject to laws and regulations such as California’s “Proposition 65” which requires that clear and reasonable warnings be given to consumers who are exposed to certain chemicals deemed by the State of California to be dangerous, such as lead. We expect that our operations will be affected by other new environmental laws and regulations on an ongoing basis. Although we cannot predict the ultimate impact of any such new laws and regulations, they will likely result in additional costs, and could require that we change the design and/or manufacturing of our products, any of which could have a material adverse effect on our business.
30
Table of Contents
Risks Related to Owning Our Stock
The trading price of our common stock is likely to be volatile, and you might not be able to sell your shares at or above the price at which you purchased the shares.
The trading prices of technology company securities historically have been highly volatile and the trading price of our common stock has been and is likely to continue to be subject to wide fluctuations. Factors, in addition to those outlined elsewhere in this filing, that may affect the trading price of our common stock include:
| • | actual or anticipated variations in our operating results; |
| • | announcements of technological innovations, new products or product enhancements, strategic alliances or significant agreements by us or by our competitors; |
| • | changes in recommendations by any securities analysts that elect to follow our common stock; |
| • | the financial projections we may provide to the public, any changes in these projections or our failure to meet these projections; |
| • | the loss of a key customer; |
| • | the loss of key personnel; |
| • | technological advancements rendering our products less valuable; |
| • | lawsuits filed against us; |
| • | changes in operating performance and stock market valuations of other companies that sell similar products; |
| • | price and volume fluctuations in the overall stock market; |
| • | market conditions in our industry, the industries of our customers and the economy as a whole; and |
| • | other events or factors, including those resulting from war, incidents of terrorism or responses to these events. |
Future sales of shares by existing stockholders could cause our stock price to decline.
Attempts by existing stockholders to sell substantial amounts of our common stock in the public market could cause the trading price of our common stock to decline significantly. As of June 30, 2011, we had 40.7 million shares of common stock outstanding, net of treasury stock. All of these shares are eligible for sale in the public market, including 11.6 million shares held by directors, executive officers and other affiliates, which are subject to volume limitations under Rule 144 under the Securities Act. In addition, 10.5 million shares subject to outstanding options and reserved for future issuance under our stock option plans are eligible for sale in the public market to the extent permitted by the provisions of various vesting agreements. If these additional shares are sold, or if it is perceived that they will be sold in the public market, the trading price of our common stock could decline.
If securities analysts do not publish research or reports about our business or if they downgrade our stock, the price of our stock could decline.
The research and reports that industry or financial analysts publish about us or our business likely have an effect on the trading price of our common stock. If an industry analyst decides not to cover our company, or if an industry analyst decides to cease covering our company at some point in the future, we could lose visibility in the market, which in turn could cause our stock price to decline. If an industry analyst downgrades our stock, our stock price would likely decline rapidly in response.
31
Table of Contents
The concentration of our capital stock ownership with insiders will likely limit your ability to influence corporate matters.
As of August 22, 2011, our executive officers, directors, current five percent or greater stockholders and affiliated entities together beneficially owned 32.8 percent of our common stock, net of treasury stock. As a result, these stockholders, acting together, will have significant influence over all matters that require approval by our stockholders, including the election of directors and approval of significant corporate transactions. Corporate action might be taken even if other stockholders oppose them. This concentration of ownership might also have the effect of delaying or preventing a change of control of our company that other stockholders may view as beneficial.
Provisions of our certificate of incorporation and bylaws and Delaware law might discourage, delay or prevent a change of control of our company or changes in our management and, as a result, depress the trading price of our common stock.
Our certificate of incorporation and bylaws contain provisions that could discourage, delay or prevent a change in control of our company or changes in our management that the stockholders of our company may deem advantageous. These provisions:
| • | establish a classified board of directors so that not all members of our board are elected at one time; |
| • | require super-majority voting to amend some provisions in our certificate of incorporation and bylaws; |
| • | authorize the issuance of “blank check” preferred stock that our board could issue to increase the number of outstanding shares and to discourage a takeover attempt; |
| • | limit the ability of our stockholders to call special meetings of stockholders; |
| • | prohibit stockholder action by written consent, which requires all stockholder actions to be taken at a meeting of our stockholders; |
| • | provide that the board of directors is expressly authorized to adopt, or to alter or repeal our bylaws; and |
| • | establish advance notice requirements for nominations for election to our board or for proposing matters that can be acted upon by stockholders at stockholder meetings. |
In addition, we are subject to Section 203 of the Delaware General Corporation Law, which, subject to some exceptions, prohibits “business combinations” between a Delaware corporation and an “interested stockholder,” which is generally defined as a stockholder who becomes a beneficial owner of 15% or more of a Delaware corporation’s voting stock for a three-year period following the date that the stockholder became an interested stockholder. Section 203 could have the effect of delaying, deferring or preventing a change in control that our stockholders might consider to be in their best interests.
These anti-takeover defenses could discourage, delay or prevent a transaction involving a change in control of our company. These provisions could also discourage proxy contests and make it more difficult for stockholders to elect directors of their choosing and cause us to take corporate actions other than those stockholders desire.
We do not expect to pay any cash dividends for the foreseeable future.
We do not anticipate that we will pay any cash dividends to holders of our common stock in the foreseeable future. Accordingly, investors must rely on sales of their common stock after price appreciation, which may never occur, as the only way to realize any future gains on their investment. Investors seeking cash dividends in the foreseeable future should not purchase our common stock.
| Item 1B. | Unresolved Staff Comments |
Not applicable.
32
Table of Contents
| Item 2. | Properties |
Our principal executive offices, research and development center and production operations are located in San Jose, California where we own approximately 518,000 square feet of office and manufacturing space subject to existing mortgage loan and line of credit with $18.3 million remaining outstanding as of June 30, 2011. In fiscal year 2008, we began leasing approximately 246,000 square feet of warehouse in Fremont, California under a lease that expires in 2015. Our European headquarters for manufacturing and service operations is located in Denbosch, the Netherlands where we lease approximately 58,000 square feet of office space under four leases, two of which expire in 2011 and two expire in 2016. In Asia, our research and development center, manufacturing and service operations are located in an approximately 102,000 square feet facility in Taipei and Taoyuan County, Taiwan under seven leases that expire at various dates through 2012. We believe that our existing properties, including both owned and leased, are in good condition and are suitable for the conduct of our business. In August 2010, we purchased land in Taiwan, consisting of approximately 4.7 acres. The purchase price was $6.1 million. In March 2011, we drew an additional $9.9 million of the line of credit to pay $9.2 million for a deposit to purchase 2.2 acres of land in Taiwan that is adjacent to the land that was purchased in August 2010. The anticipated purchase cost of this land ranges from $5.0 million to $9.2 million and the title to the land is expected to transfer in the first half of fiscal year 2012. As the total purchase cost of the land is not known at this time, the difference between the purchase cost and the land deposit will be refunded when the title transfers to us. The construction of the Taiwan facilities and the headquarters office expansion in San Jose, California began in the fourth quarter of fiscal year 2011 and will continue through fiscal year 2012. The anticipated costs for the next twelve months to build the Taiwan facilities and the headquarters office expansion in San Jose, California are approximately $16.9 million. We plan to finance the purchase and the development through operating cash flows and additional financing from banks.
| Item 3. | Legal Proceedings |
From time to time, we may be involved in various legal proceedings arising from the normal course of business activities. In our opinion, resolution of these and the above matters is not expected to have a material adverse impact on our consolidated results of operations, cash flows or our financial position. However, depending on the amount and timing, an unfavorable resolution of a matter could materially affect our future results of operations, cash flows or financial position in a particular period.
| Item 4. | Reserved |
33
Table of Contents
PART II
| Item 5. | Market for Registrant’s Common Equity, Related Stockholder Matters and Issuer Purchases of Equity Securities |
Market Information
Our common stock has been traded on The Nasdaq Global Market under the symbol “SMCI” since our initial public offering on March 28, 2007. The following table sets forth for the periods indicated the high and low sale prices of our common stock as reported by The Nasdaq Global Market.
| High | Low | |||||||
| Fiscal Year 2010: |
||||||||
| First Quarter |
$ | 8.84 | $ | 7.09 | ||||
| Second Quarter |
$ | 11.45 | $ | 7.56 | ||||
| Third Quarter |
$ | 17.84 | $ | 11.27 | ||||
| Fourth Quarter |
$ | 18.89 | $ | 12.01 | ||||
| High | Low | |||||||
| Fiscal Year 2011: |
||||||||
| First Quarter |
$ | 15.48 | $ | 8.63 | ||||
| Second Quarter |
$ | 11.98 | $ | 10.18 | ||||
| Third Quarter |
$ | 16.04 | $ | 11.65 | ||||
| Fourth Quarter |
$ | 18.99 | $ | 15.30 | ||||
Dividend Policy
We have never declared or paid cash dividends on our capital stock and do not expect to pay any dividends in the foreseeable future.
Holders
The last reported sale price of our common stock on the Nasdaq Global Market on August 22, 2011 was $13.08 per share. There were 40 registered stockholders of record of our common stock on August 22, 2011. Because most of our shares are held by brokers and other institutions on behalf of stockholders, we are unable to estimate the total number of beneficial stockholders represented by these record holders.
Equity Compensation Plan
Please see Part III, Item 12 of this report for disclosure relating to our equity compensation plans.
34
Table of Contents
Stock Performance Graph
The following graph compares our cumulative total stockholder return on our common stock between March 29, 2007 (the date of our initial public offering) and June 30, 2011 with the cumulative return of the Nasdaq Computer Index and the Nasdaq Composite Index, which both include our common stock, for the comparable period.
The graph reflects an investment of $100 in our common stock, the Nasdaq Computer Index and the Nasdaq Composite Index, on March 29, 2007, and a reinvestment of dividends, if any. The stockholder return shown on the graph below is not necessarily indicative of future performance, and we do not make or endorse any predictions as to future stockholder returns.
Comparison of March 29, 2007 to June 30, 2011 Cumulative Total Return
Among Super Micro Computer, Nasdaq Computer Index and Nasdaq Composite
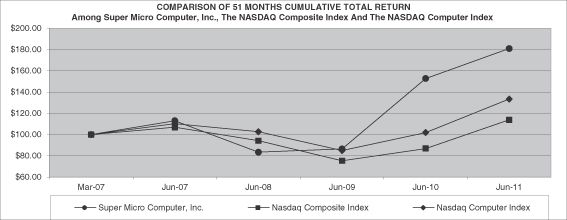
| 03/29/07 | 06/29/07 | 06/30/08 | 06/30/09 | 06/30/10 | 06/30/11 | |||||||||||||||||||
| Super Micro Computer, Inc. |
100.00 | 113.11 | 83.39 | 86.55 | 152.54 | 181.11 | ||||||||||||||||||
| Nasdaq Composite Index |
100.00 | 107.02 | 94.26 | 75.44 | 86.71 | 114.02 | ||||||||||||||||||
| Nasdaq Computer Index |
100.00 | 110.22 | 102.75 | 85.05 | 101.73 | 133.40 | ||||||||||||||||||
Recent Sales of Unregistered Securities
None.
Issuer Purchases of Equity Securities
None.
35
Table of Contents
| Item 6. | Selected Financial Data |
The following selected consolidated financial data is qualified by reference to, and should be read in conjunction with, our Consolidated Financial Statements and notes thereto in Part II, Item 8 and “Management’s Discussion and Analysis of Financial Condition and Results of Operations” in Part II, Item 7, of this Annual Report on Form 10-K. Our historical results are not necessarily indicative of the results to be expected in any future period.
| Fiscal Years Ended June 30, | ||||||||||||||||||||
| 2011 | 2010 | 2009 | 2008 | 2007 | ||||||||||||||||
| (in thousands, except per share data) | ||||||||||||||||||||
| Consolidated Statements of Operations Data:(1) |
||||||||||||||||||||
| Net sales |
$ | 942,582 | $ | 721,438 | $ | 505,609 | $ | 540,503 | $ | 420,393 | ||||||||||
| Cost of sales |
791,478 | 606,446 | 416,899 | 436,950 | 345,384 | |||||||||||||||
|
|
|
|
|
|
|
|
|
|
|
|||||||||||
| Gross profit |
151,104 | 114,992 | 88,710 | 103,553 | 75,009 | |||||||||||||||
|
|
|
|
|
|
|
|
|
|
|
|||||||||||
| Operating expenses: |
||||||||||||||||||||
| Research and development |
48,108 | 37,382 | 34,514 | 30,537 | 21,171 | |||||||||||||||
| Sales and marketing |
26,859 | 20,458 | 17,119 | 18,191 | 12,586 | |||||||||||||||
| General and administrative |
17,444 | 15,318 | 13,824 | 14,554 | 11,467 | |||||||||||||||
| Provision for (reversal of) litigation loss |
— | 1,089 | — | — | (120 | ) | ||||||||||||||
|
|
|
|
|
|
|
|
|
|
|
|||||||||||
| Total operating expenses |
92,411 | 74,247 | 65,457 | 63,282 | 45,104 | |||||||||||||||
|
|
|
|
|
|
|
|
|
|
|
|||||||||||
| Income from operations |
58,693 | 40,745 | 23,253 | 40,271 | 29,905 | |||||||||||||||
| Interest and other income, net |
66 | 103 | 476 | 1,558 | 765 | |||||||||||||||
| Interest expense |
(686 | ) | (383 | ) | (930 | ) | (1,025 | ) | (1,332 | ) | ||||||||||
|
|
|
|
|
|
|
|
|
|
|
|||||||||||
| Income before income tax provision |
58,073 | 40,465 | 22,799 | 40,804 | 29,338 | |||||||||||||||
| Income tax provision |
17,860 | 13,550 | 6,692 | 15,385 | 9,999 | |||||||||||||||
|
|
|
|
|
|
|
|
|
|
|
|||||||||||
| Net income |
$ | 40,213 | $ | 26,915 | $ | 16,107 | $ | 25,419 | $ | 19,339 | ||||||||||
|
|
|
|
|
|
|
|
|
|
|
|||||||||||
| Net income per share |
||||||||||||||||||||
| Basic |
$ | 1.04 | $ | 0.73 | $ | 0.46 | $ | 0.81 | $ | 0.80 | ||||||||||
| Diluted |
$ | 0.93 | $ | 0.65 | $ | 0.41 | $ | 0.65 | $ | 0.57 | ||||||||||
| Shares used in per share calculation |
||||||||||||||||||||
| Basic |
38,132 | 35,883 | 34,218 | 31,355 | 24,153 | |||||||||||||||
| Diluted |
42,396 | 40,735 | 38,596 | 38,843 | 33,946 | |||||||||||||||
|
(1) Includes charges for stock-based compensation: |
|
|||||||||||||||||||
| Cost of sales |
$ | 812 | $ | 573 | $ | 578 | $ | 523 | $ | 300 | ||||||||||
| Research and development |
4,077 | 3,106 | 2,608 | 1,817 | 1,058 | |||||||||||||||
| Sales and marketing |
1,077 | 880 | 826 | 641 | 362 | |||||||||||||||
| General and administrative |
2,090 | 1,898 | 1,649 | 1,187 | 710 | |||||||||||||||
| As of June 30, | ||||||||||||||||||||
| 2011 | 2010 | 2009 | 2008 | 2007 | ||||||||||||||||
| (in thousands) | ||||||||||||||||||||
| Consolidated Balance Sheet Data: |
||||||||||||||||||||
| Cash and cash equivalents |
$ | 69,943 | $ | 72,644 | $ | 70,295 | $ | 51,481 | $ | 50,864 | ||||||||||
| Working capital |
228,975 | 158,982 | 130,987 | 102,392 | 95,086 | |||||||||||||||
| Total assets |
464,620 | 370,762 | 283,135 | 264,385 | 205,583 | |||||||||||||||
| Long-term obligations, net of current portion(2) |
36,716 | 8,186 | 15,482 | 15,023 | 11,291 | |||||||||||||||
| Total stockholders’ equity |
287,257 | 224,701 | 178,622 | 151,871 | 115,872 | |||||||||||||||
| (2) | $27.6 million, $9.7 million, $10.0 million and $11.3 million of our long-term obligations, net of current portion consisted of building loans at June 30, 2011, 2009, 2008 and 2007, respectively. $18.6 million of our short-term debt related to building loan at June 30, 2010 was refinanced to long-term debt at June 30, 2011. |
36
Table of Contents
| Item 7. | Management’s Discussion and Analysis of Financial Condition and Results of Operations |
The following discussion should be read in conjunction with the consolidated financial statements and related notes which appear elsewhere in this Annual Report on Form 10-K. This discussion contains forward-looking statements that involve risks and uncertainties. Our actual results could differ materially from those anticipated in these forward-looking statements as a result of various factors, including those discussed below and elsewhere in this Annual Report on Form 10-K, particularly under the heading “Risk Factors.”
Overview
We are a global leader in server technology and green computing innovation. We develop and provide high performance server solutions based on an innovative, modular and open-standard architecture. Our solutions include a range of complete rackmount, workstation, storage, graphic processing unit and blade server systems, as well as subsystems and accessories which can be used by distributors, OEMs and end customers to assemble server systems. To date, we have generated the majority of our net sales from subsystems. In recent years our growth in net sales has been driven by the growth in the market for application optimized server systems. For fiscal years 2011, 2010 and 2009, net sales of optimized servers were $351.3 million, $245.2 million and $196.7 million, respectively, and net sales of subsystems and accessories were $591.3 million, $476.2 million and $309.0 million, respectively. The increase in our net sales in fiscal year 2011 compared with fiscal year 2010 was primarily attributable to the server refresh cycle and increased sales across our product lines. The growth on a percentage basis was primarily in our SuperBlade®, GPU and storage solutions.
We commenced operations in 1993 and have been profitable every year since inception. For fiscal years 2011, 2010 and 2009, our net sales were $942.6 million, $721.4 million and $505.6 million, respectively, and our net income was $40.2 million, $26.9 million and $16.1 million, respectively. Our increase in profitability in fiscal year 2011 was primarily attributable to the increase in our gross profit resulting from our increased net sales and to a lesser extent to the lower effective tax rate resulting from the reinstatement of the Federal research and development tax credit in fiscal year 2011.
We sell our server systems and subsystems and accessories primarily through distributors and to a lesser extent to OEMs as well as through our direct sales force. For fiscal years 2011, 2010 and 2009, we derived 56.1%, 66.7% and 64.9%, respectively, of our net sales from products sold to distributors, and we derived 43.9%, 33.3% and 35.1%, respectively, from sales to OEMs and to end customers. None of our customers accounted for 10% or more of our net sales in fiscal years 2011, 2010 or 2009. For fiscal years 2011, 2010 and 2009, we derived 58.3%, 60.1% and 64.4%, respectively, of our net sales from customers in the United States. For fiscal years 2011, 2010, and 2009, we derived 41.7%, 39.9% and 35.6%, respectively, of our net sales from customers outside the United States.
We perform the majority of our research and development efforts in-house. For fiscal years 2011, 2010 and 2009, research and development expenses represented 5.1%, 5.2% and 6.8% of our net sales, respectively.
We use several suppliers and contract manufacturers to design and manufacture components in accordance with our specifications, with most final assembly and testing performed at our manufacturing facility in San Jose, California. During fiscal year 2011, we continued to invest in expanding our operations both in San Jose, California and our subsidiaries in the Netherlands and Taiwan in order to support our growth. We have increased manufacturing and service operations in the Netherlands and Taiwan to support our European and Asian customers and we plan to continue expanding our overseas manufacturing capacity through fiscal year 2012. One of our key suppliers is Ablecom, a related party, which supplies us with contract design and manufacturing support. For fiscal years 2011, 2010 and 2009, our purchases from Ablecom represented 19.6%, 20.5% and 22.1% of our cost of sales, respectively. The decrease in percentage of cost of sales in fiscal year 2011 and 2010 was primarily related to server systems sales composing a higher percentage of our net sales and a change in product mix which resulted in a higher percentage of server subsystems and accessories being purchased from other suppliers. Ablecom’s sales to us constitute a substantial majority of Ablecom’s net sales. We continue to
37
Table of Contents
maintain our manufacturing relationship with Ablecom in Asia in an effort to reduce our product costs and do not have any current plans to reduce our reliance on Ablecom product purchases. In addition to providing a larger volume of contract manufacturing services for us, Ablecom continues to warehouse for us a number of components and subassemblies manufactured by multiple suppliers prior to shipment to our facilities in the U.S. and Europe. We typically negotiate the price of products that we purchase from Ablecom on a quarterly basis; however, either party may re-negotiate the price of products with each order. As a result of our relationship with Ablecom, it is possible that Ablecom may in the future sell products to us at a price higher or lower than we could obtain from an unrelated third party supplier. This may result in our future reporting of gross profit as a percentage of net sales that is less than or in excess of what we might have obtained absent our relationship with Ablecom.
In order to continue to increase our net sales and profits, we believe that we must continue to develop flexible and customizable server solutions and be among the first to market with new features and products. We measure our financial success based on various indicators, including growth in net sales, gross profit as a percentage of net sales, operating income as a percentage of net sales, levels of inventory, and days sales outstanding, or DSOs. In connection with these efforts, we monitor daily and weekly sales and shipment reports. Among the key non-financial indicators of our success is our ability to rapidly introduce new products and deliver the latest application optimized server solutions. In this regard, we work closely with microprocessor and other component vendors to take advantage of new technologies as they are introduced. Historically, our ability to introduce new products rapidly has allowed us to benefit from the introduction of new microprocessors and as a result we monitor the introduction cycles of Intel, AMD and Nvidia carefully. This also impacts our research and development expenditures. For example, our results for the quarter ended March 31, 2009 were in part adversely impacted by customer order delays in anticipation of the introduction of the Nehalem line of microprocessors and research and development expenditures necessary for us to prepare for the introduction.
Other Financial Highlights
The following is a summary of other financial highlights of fiscal year 2011:
| • | Net cash generated (used) in operating activities was $8.5 million, ($2.2) million and $21.8 million in fiscal year 2011, 2010 and 2009, respectively. Our cash and cash equivalents, together with our investments, were $75.2 million at the end of fiscal year 2011, compare with $79.4 million at the end of fiscal year 2010. The decrease in our cash and cash equivalents, together with our investments at the end of fiscal year 2011 was primarily due to an increase in our inventory balance to support our growth and the investments in property for our expansion overseas. |
| • | Days sales outstanding in accounts receivable (“DSO”) at the end of fiscal year 2011 was 30 days, consistent with the end of fiscal year 2010. |
| • | Our inventory balance was $192.7 million at the end of fiscal year 2011, compared with $135.6 million at the end of fiscal year 2010. Days sales of inventory (“DSI”) at the end of fiscal year 2011 was 75 days, compared with 67 days at the end of fiscal year 2010. The increase in our inventory balance at the end of fiscal year 2011 was in part due to an increase in demand for our products resulting from a recovering economy, in part to support our growth and in part due to our increasing manufacturing activities in the Netherlands and Taiwan. Our purchase commitments with contract manufacturers and suppliers were $91.8 million at the end of fiscal year 2011 and $92.1 million at the end of fiscal year 2010. |
| • | In August 2010, we purchased land in Taiwan, consisting of approximately 4.7 acres for a total purchase price of $6.1 million. In March 2011, we drew an additional $9.9 million from our revolving line of credit and paid $9.2 million as a deposit to purchase land in Taiwan that is adjacent to the land that was purchased in August 2010. Title to this land is expected to transfer in the first half of fiscal year 2012. We are developing the land through fiscal year 2012 for manufacturing and service operations. |
38
Table of Contents
Fiscal Year
Our fiscal year ends on June 30. References to fiscal year 2011, for example, refer to the fiscal year ended June 30, 2011.
Revenues and Expenses
Net sales. Net sales consist of sales of our server solutions, including server systems, subsystems and accessories. The main factors which impact our net sales are unit volumes shipped and average selling prices. The prices for server systems range widely depending upon the configuration, and the prices for our subsystems and accessories vary based on the type. As with most electronics-based products, average selling prices typically are highest at the time of introduction of new products which utilize the latest technology and tend to decrease over time as such products mature in the market and are replaced by next generation products.
Cost of sales. Cost of sales primarily consists of the costs to manufacture our products, including the costs of materials, contract manufacturing, shipping, personnel and related expenses, equipment and facility expenses, warranty costs and inventory excess and obsolete provisions. The primary factors that impact our cost of sales are the mix of products sold and cost of materials, which include raw material costs, shipping costs and salary and benefits related to production. Cost of sales as a percentage of net sales may increase over time if decreases in average selling prices are not offset by corresponding decreases in our costs. Our cost of sales, as a percentage of net sales, is generally lower on server systems than on subsystems and accessories. Because we do not have long-term fixed supply agreements, our cost of sales is subject to change based on market conditions.
Research and development expenses. Research and development expenses consist of the personnel and related expenses of our research and development teams, and materials and supplies, consulting services, third party testing services and equipment and facility expenses related to our research and development activities. All research and development costs are expensed as incurred. We occasionally receive non-recurring engineering, or NRE funding from certain suppliers and customers. Under these programs, we are reimbursed for certain research and development costs that we incur as part of the joint development of our products and those of our suppliers and customers. These amounts offset a portion of the related research and development expenses and have the effect of reducing our reported research and development expenses.
Sales and marketing expenses. Sales and marketing expenses consist primarily of salaries and commissions for our sales and marketing personnel, costs for tradeshows, independent sales representative fees and marketing programs. From time to time, we receive cooperative marketing funding from certain suppliers. Under these programs, we are reimbursed for certain marketing costs that we incur as part of the joint promotion of our products and those of our suppliers. These amounts offset a portion of the related expenses and have the effect of reducing our reported sales and marketing expenses. Similarly, we from time to time offer our distributors cooperative marketing funding which has the effect of increasing our expenses. The timing, magnitude and estimated usage of our programs and those of our suppliers can result in significant variations in reported sales and marketing expenses from period to period. Spending on cooperative marketing, either by us or our suppliers, typically increases in connection with significant product releases by us or our suppliers.
General and administrative expenses. General and administrative expenses consist primarily of general corporate costs, including personnel expenses, financial reporting, corporate governance and compliance and outside legal, audit and tax fees.
Provision for litigation loss. Loss from litigation relates to an action filed in France by Digitechnic, S.A., a former customer. The Company entered into a settlement agreement with Digitechnic, pursuant to which the Company made a payment of $1.1 million in December 2009.
Interest and other income, net. Interest and other income, net represents the net of our interest income on investments or interest expense on the building loans or letters of credit for our owned facilities offset by interest earned on our cash balances.
39
Table of Contents
Income tax provision. Our income tax provision is based on our taxable income generated in the jurisdictions in which we operate, currently primarily the United States and the Netherlands and to a lesser extent, Taiwan. Our effective tax rate differs from the statutory rate primarily due to research and development tax credits and the domestic production activities deduction which were partially offset by the impact of state taxes and stock option expenses. A reconciliation of the federal statutory income tax rate to our effective tax rate is set forth in Note 12 of Notes to Consolidated Financial Statements.
Critical Accounting Policies
Our discussion and analysis of our financial condition and results of operations are based upon our financial statements, which have been prepared in accordance with accounting principles generally accepted in the United States. The preparation of these financial statements requires us to make estimates and judgments that affect the reported amount of assets, liabilities, revenues and expenses. We evaluate our estimates on an on-going basis, including those related to allowances for doubtful accounts and sales returns, cooperative marketing accruals, investment valuations, inventory valuations, income taxes, warranty obligations and stock-based compensation. We base our estimates on historical experience and on various other assumptions that we believe to be reasonable under the circumstances, the results of which form the basis for making the judgments we make about the carrying values of assets and liabilities that are not readily apparent from other sources. Because these estimates can vary depending on the situation, actual results may differ from the estimates.
We believe the following are our most critical accounting policies as they require our more significant judgments in the preparation of our financial statements.
Revenue recognition. We recognize revenue from sales of products, when persuasive evidence of an arrangement exists, shipment has occurred and title has transferred, the sales price is fixed or determinable, collection of the resulting receivable is reasonably assured, and all significant obligations have been met. Generally this occurs at the time of shipment when risk of loss and title has passed to the customer. Our standard arrangement with our customers includes a signed purchase order or contract, 30 to 60 days payment terms, Ex-works terms, except for a few customers who have free-on-board destination terms or customer acceptance provisions, and revenue is recognized when the products arrive or are accepted at the destination. We generally do not provide for non-warranty rights of return except for products which have “Out-of-box” failure, where customers could return these products for credit within 30 days of receiving the items. Certain distributors and OEMs are also permitted to return products in unopened boxes, limited to purchases over a specified period of time, generally within 60 to 90 days of the purchase, or to products in the distributor’s or OEM’s inventory at certain times (such as the termination of the agreement or product obsolescence). In addition, we have a sale arrangement with an OEM that has limited product return rights. To estimate reserves for future sales returns, we regularly review our history of actual returns for each major product line. We also communicate regularly with our distributors to gather information about end customer satisfaction, and to determine the volume of inventory in the channel. Reserves for future returns are adjusted as necessary, based on returns experience, returns expectations and communication with our distributors.
In addition, certain customers have acceptance provisions and revenue is deferred until the customers provide the necessary acceptance. At June 30, 2011 and 2010, we had deferred revenue of $2.4 million and $1.3 million and related deferred product costs of $1.9 million and $1.3 million, respectively, related to shipments to customers pending acceptances.
Probability of collection is assessed on a customer-by-customer basis. Customers are subjected to a credit review process that evaluates the customers’ financial position and ability to pay. If it is determined from the outset of an arrangement that collection is not probable based upon the review process, the customers are required to pay cash in advance of shipment. We also make estimates of the uncollectibility of accounts receivables, analyzing accounts receivable and historical bad debts, customer concentrations, customer-credit-worthiness, current economic trends and changes in customer payment terms to evaluate the adequacy of the
40
Table of Contents
allowance for doubtful accounts. On a quarterly basis, we evaluate aged items in the accounts receivable aging report and provide an allowance in an amount we deem adequate for doubtful accounts. If management were to make different judgments or utilize different estimates, material differences in the amount of our reported operating expenses could result. We provide for price protection to certain distributors. We assess the market competition and product technology obsolescence, and make price adjustments based on our judgment. Upon each announcement of price reductions, the accrual for price protection is calculated based on our distributors’ inventory on hand. Such reserves are recorded as a reduction to revenue at the time we reduce the product prices.
We have an immaterial amount of service revenue relating to non-warranty repairs, which is recognized upon shipment of the repaired units to customers. Service revenue has been less than 10% of net sales for all periods presented and is not separately disclosed.
Cooperative marketing accruals. We have arrangements with resellers of our products to reimburse the resellers for cooperative marketing costs meeting specified criteria. We accrue the cooperative marketing costs based on these arrangements and our estimate for resellers’ claims for marketing activities. We record marketing costs meeting such specified criteria within sales and marketing expenses in the accompanying condensed consolidated statements of operations. For those marketing costs that do not meet the specified criteria, the amounts are recorded as a reduction to sales in the accompanying condensed consolidated statements of operations.
Impairment of short-term and long-term investments. Impairment of short-term and long-term investments relates to the unrealized loss on the carrying value of our investments in auction rate securities; such securities were rated AAA at the date of purchase. The liquidity and fair value of these securities has been negatively impacted by the uncertainty in the credit markets and exposure of these securities to the financial condition of bond insurance companies. We have received all interest payments due on these instruments on a timely basis. Each of these securities has been subject to auction processes for which there has been insufficient bidders on the scheduled rollover dates and the auctions have subsequently failed. When these securities lost the short-term liquidity previously provided by the auction processes, we reclassified these securities as long-term investments. For the securities with the stated maturity less than a year, the securities were classified as short-term available-for-sale investments. We have used a discounted cash flow model to estimate the fair value of these investments as of June 30, 2011 and 2010. The material factors used in preparing the discounted cash flow model are 1) the discount rate utilized to present value the cash flows, 2) the time period until redemption and 3) the estimated rate of return. Management derives the estimates by obtaining input from market data on the applicable discount rate, estimated time to maturity and estimated rate of return. The changes in fair value have been primarily due to changes in the estimated rate of return and a change in the estimated period to liquidity. The fair value of our investment portfolio may change between 2% to 3% by increasing or decreasing the rate of return used by 1% or by increasing or decreasing the term used by 1 year. Changes in these estimates or in the market conditions for these investments are likely in the future based upon the then current market conditions for these investments and may affect the fair value of these investments. As of June 30, 2011 and 2010 we have recorded an accumulated unrealized loss of $0.2 million, net of deferred income taxes, on the securities. We deem this loss to be temporary as we determined that we will not likely be required to sell the securities before their anticipated recovery and we have the intent and ability to hold our investments until recovery of cost.
Product warranties. We offer product warranties ranging from 15 to 39 months against any defective product. We accrue for estimated returns of defective products at the time revenue is recognized, based on historical warranty experience and recent trends. We monitor warranty obligations and may make revisions to our warranty reserve if actual costs of product repair and replacement are significantly higher or lower than estimated. Accruals for anticipated future warranty costs are charged to cost of sales and included in accrued liabilities. The liability for product warranties was $4.7 million as of June 30, 2011, compared with $4.6 million as of June 30, 2010. The provision for warranty reserve was $9.6 million, $8.5 million and $6.7 million in fiscal years 2011, 2010 and 2009, respectively. Our estimates and assumptions used have been historically close to actual. The change in estimated liability for pre-existing warranties was ($0.9) million, ($0.9) million and $0.3
41
Table of Contents
million in fiscal years 2011, 2010 and 2009, respectively. As we experienced an increase in net sales in fiscal year 2011, the provision for warranty reserve increased $1.1 million compared to fiscal year 2010. As we experienced an increase in net sales in fiscal year 2010, the provision for warranty reserve increased $1.8 million compared to fiscal year 2009. If in future periods, we experience or anticipate an increase or decrease in warranty claims as a result of new product introductions or change in unit volumes compared with our historical experience, or if the cost of servicing warranty claims is greater or lesser than expected, we intend to adjust our estimates appropriately.
Inventory valuation. Inventory is valued at the lower of cost or market. We evaluate inventory on a quarterly basis for lower of cost or market and excess and obsolescence and, as necessary, write down the valuation of units to lower of cost or market or for excess and obsolescence based upon the number of units that are unlikely to be sold based upon estimated demand for the following twelve months. This evaluation takes into account matters including expected demand, anticipated sales price, product obsolescence and other factors. If actual future demand for our products is less than currently forecasted, additional inventory adjustments may be required. Once a reserve is established, it is maintained until the product to which it relates is sold or scrapped. If a unit that has been written down is subsequently sold, the cost associated with the revenue from this unit is reduced to the extent of the write down, resulting in an increase in gross profit. We monitor the extent to which previously written down inventory is sold at amounts greater or less than carrying value, and based on this analysis, adjust our estimate for determining future write downs. If in future periods, we experience or anticipate a change in recovery rate compared with our historical experience, our gross margin would be affected. Our provision for inventory was $3.4 million, $2.6 million and $1.5 million in fiscal years 2011, 2010 and 2009, respectively.
Accounting for income taxes. We account for income taxes under an asset and liability approach. Deferred income taxes reflect the impact of temporary differences between assets and liabilities recognized for financial reporting purposes and such amounts recognized for income tax reporting purposes, net operating loss carry-forwards and other tax credits measured by applying currently enacted tax laws. Valuation allowances are provided when necessary to reduce deferred tax assets to an amount that is more likely than not to be realized.
We recognize the tax liability for uncertain income tax positions on the income tax return based on the two-step process. The first step is to determine whether it is more likely than not that each income tax position would be sustained upon audit. The second step is to estimate and measure the tax benefit as the amount that has a greater than 50% likelihood of being realized upon ultimate settlement with the tax authority. Estimating these amounts requires us to determine the probability of various possible outcomes. We evaluate these uncertain tax positions on a quarterly basis. This evaluation is based on the consideration of several factors, including changes in facts or circumstances, changes in applicable tax law, settlement of issues under audit and new exposures. If we later determine that our exposure is lower or that the liability is not sufficient to cover our revised expectations, we adjust the liability and effect a related change in our tax provision during the period in which we make such determination. See Note 12 of Notes to Consolidated Financial Statements for the impact on our consolidated financial statements.
Stock-based compensation. Effective July 1, 2006, stock-based compensation cost is measured at the grant date based on the fair value of the award and is recognized as expense on a straight-line basis over the requisite service period, which is generally the vesting period. Prior to July 1, 2006, we have recorded compensation expense for stock options with exercise prices less than the fair value of the underlying common stock at the option grant date. Amortization of deferred stock compensation, resulting from such stock options granted to employees and directors, when the exercise price of our stock options was less than the deemed market price of the underlying stock on the date of the grant, for the years ended June 30, 2011, 2010 and 2009, was $0, $0.1 million and $0.6 million, respectively. Since July 1, 2006, the Company measures the cost of employee services received in exchange for an award of equity instruments, including stock options, based on the grant-date fair value of the award. That cost will be recognized over the period during which an employee is required to provide services in exchange for the award, known as the requisite service period (usually the vesting period).
42
Table of Contents
Compensation expense for options granted to employees after July 1, 2006, was $8.1 million, $6.3 million and $5.1 million for the years ended June 30, 2011, 2010 and 2009, respectively.
As of June 30, 2011, the total unrecognized compensation cost, adjusted for estimated forfeitures, related to unvested stock options granted since July 1, 2006 to employees and non-employee directors, was $18.2 million, which is expected to be recognized as an expense over a weighted-average period of approximately 2.42 years. See Note 11 of Notes to our Consolidated Financial Statements for additional information.
We estimated the fair value of stock options granted using a Black-Scholes option-pricing model and a single option award approach. This model requires us to make estimates and assumptions with respect to the expected term of the option, the expected volatility of the price of our common stock and the expected forfeiture rate. The fair value is then amortized on a straight-line basis over the requisite service periods of the awards, which is generally the vesting period.
The expected term represents the period that our stock-based awards are expected to be outstanding and was determined based on an analysis of the relevant peer companies’ post-vest termination rates and exercise behavior. The expected volatility is based on a combination of the implied and historical volatility of our relevant peer group for the stock options granted prior to September 30, 2009. For stock options granted after September 30, 2009, expected volatility is based solely on our historical volatility. In addition, forfeitures of share-based awards are estimated at the time of grant and revised, if necessary, in subsequent periods if actual forfeitures differ from those estimates. We use historical data to estimate pre-vesting option forfeitures and record stock-based compensation expense only for those awards that are expected to vest.
Variable interest entities. In June 2009, the FASB issued authoritative guidance on the consolidation of variable interest entities, which is effective for fiscal years beginning after November 15, 2009 and interim periods therein and thereafter. The new guidance requires revised evaluations of whether entities represent variable interest entities, ongoing assessments of control over such entities, and additional disclosures for variable interests. We adopted this standard and have analyzed our relationship with Ablecom and its subsidiaries (collectively “Ablecom”). We have concluded that Ablecom is a variable interest entity in accordance with applicable accounting standards and guidance; however, we are not the primary beneficiary of Ablecom and therefore, we do not consolidate Ablecom. In performing our analysis, we considered our explicit arrangements with Ablecom including the supplier and distributor arrangements. Also, as a result of the substantial related party relationship between the two companies, we considered whether any implicit arrangements exist that would cause us to protect those related parties’ interests in Ablecom from suffering losses. We determined that no implicit arrangements exist with Ablecom or its shareholders. Such an arrangement would be inconsistent with the fiduciary duty that we have towards our stockholders who do not own shares in Ablecom.
43
Table of Contents
Results of Operations
The following table sets forth our financial results, as a percentage of net sales for the periods indicated:
| Years Ended June 30, | ||||||||||||
| 2011 | 2010 | 2009 | ||||||||||
| Net sales |
100.0 | % | 100.0 | % | 100.0 | % | ||||||
| Cost of sales |
84.0 | 84.1 | 82.5 | |||||||||
|
|
|
|
|
|
|
|||||||
| Gross profit |
16.0 | 15.9 | 17.5 | |||||||||
|
|
|
|
|
|
|
|||||||
| Operating expenses: |
||||||||||||
| Research and development |
5.1 | 5.2 | 6.8 | |||||||||
| Sales and marketing |
2.8 | 2.8 | 3.4 | |||||||||
| General and administrative |
1.9 | 2.1 | 2.7 | |||||||||
| Provision for litigation loss |
0.0 | 0.2 | 0.0 | |||||||||
|
|
|
|
|
|
|
|||||||
| Total operating expenses |
9.8 | 10.3 | 12.9 | |||||||||
|
|
|
|
|
|
|
|||||||
| Income from operations |
6.2 | 5.6 | 4.6 | |||||||||
| Interest and other income, net |
0.0 | 0.0 | 0.1 | |||||||||
| Interest expense |
(0.0 | ) | (0.0 | ) | (0.2 | ) | ||||||
|
|
|
|
|
|
|
|||||||
| Income before income tax provision |
6.2 | 5.6 | 4.5 | |||||||||
| Income tax provision |
1.9 | 1.9 | 1.3 | |||||||||
|
|
|
|
|
|
|
|||||||
| Net income |
4.3 | % | 3.7 | % | 3.2 | % | ||||||
|
|
|
|
|
|
|
|||||||
Comparison of Fiscal Years Ended June 30, 2011 and 2010
Net sales. Net sales increased by $221.1 million, or 30.7%, to $942.6 million from $721.4 million, for fiscal year 2011 and 2010, respectively. This increase was due primarily to an increase in unit volumes of server systems and subsystems and accessories and an increase in average selling prices of server systems. For fiscal year 2011, the number of units sold increased 40.5% to 4.8 million compared to 3.4 million for fiscal year 2010.
For fiscal year 2011, the number of server system units sold increased 25.6% to 221,000 compared to 176,000 for fiscal year 2010. The average selling price of server system units increased 14.3% to $1,600 in fiscal year 2011 compared to $1,400 in fiscal year 2010. The average selling prices of our server systems increased principally due to an increase in our sales of complete integrated, high-end server solutions to OEM and end customers and higher average selling prices of 1000, 6000 and 7000 Series configuration of servers which incorporated additional features such as higher density, memory and hard disk drive capacity and higher average selling prices of SuperBlades® offset in part by declines in average selling prices of more mature products. Sales of server systems increased by $106.1 million or 43.3% from fiscal year 2010 to fiscal year 2011, primarily due to higher sales of OEM and end customers, higher sales of SuperBaldes®, higher sales of 1000, 2000, 6000 and 7000 Series configuration of servers including storage and GPU solutions offset in part by lower sales of more mature products. Sales of server systems represented 37.3% of our net sales for fiscal year 2011 compared to 34.0% of our net sales for fiscal year 2010.
For fiscal year 2011, the number of subsystems and accessories units sold increased 41.3% to 4.6 million compared to 3.3 million for fiscal year 2010. Sales of subsystems and accessories increased by $115.1 million or 24.2% from fiscal year 2010 to fiscal year 2011, primarily due to higher sales of bundled server solutions to OEM and system integrators who increasingly are purchasing additional accessories from us and completing the final assembly themselves. Sales of subsystems and accessories represented 62.7% of our net sales for fiscal year 2011 as compared to 66.0% of our net sales for fiscal year 2010. For fiscal year 2011 and 2010, we derived 56.1% and 66.7%, respectively, of our net sales from products sold to distributors and we derived 43.9% and 33.3%, respectively, from sales to OEMs and to end customers. For fiscal year 2011, customers in the United
44
Table of Contents
States, Europe and Asia accounted for 58.3%, 21.4% and 16.9%, of our net sales, respectively, as compared to 60.1%, 21.7% and 14.8%, respectively, for fiscal year 2010.
Cost of sales. Cost of sales increased by $185.0 million, or 30.5%, to $791.5 million from $606.4 million, for fiscal year 2011 and 2010, respectively. Cost of sales as a percentage of net sales was 84.0% and 84.1% for fiscal year 2011 and 2010, respectively. The increase in absolute dollars of cost of sales was primarily attributable to the increase in net sales, an increase of $7.3 million in freight-in charges, an increase of $1.1 million in provision for warranty reserve and an increase of $0.7 million in provision for inventory reserve. The lower cost of sales as a percentage of net sales was primarily due to an increase in sales of server systems and an increase in sales to OEM and end customers. In fiscal year 2011, we recorded a $9.6 million expense, or 1.0% of net sales, related to the provision for warranty reserve as compared to $8.5 million, or 1.2% of net sales, in fiscal year 2010. The increase in the provision for warranty reserve was primarily due to higher net sales in fiscal year 2011. If in future periods we experience or anticipate an increase or decrease in warranty claims as a result of new product introductions or change in unit volumes compared with our historical experience, or if the cost of servicing warranty claims is greater or lesser than expected, our gross margin would be affected. In fiscal year 2011, we recorded a $3.4 million expense, or 0.4% of net sales, related to the inventory provision as compared to $2.6 million, or 0.4% of net sales, in fiscal year 2010. The increase in the inventory provision was primarily for older products as a result of product transitions.
Research and development expenses. Research and development expenses increased by $10.7 million, or 28.7%, to $48.1 million from $37.4 million, for fiscal year 2011 and 2010, respectively. Research and development expenses were 5.1% and 5.2% of net sales for fiscal year 2011 and 2010, respectively. The increase in absolute dollars was primarily due to an increase of $8.5 million in compensation and benefits resulting from growth in research and development personnel, including higher stock-based compensation expense related to expanded product development initiatives in the U.S. and in Taiwan, an increase of $3.0 million in development costs associated with new products offset in part by an increase of $0.8 million in non-recurring engineering funding from certain suppliers and customers.
Research and development expenses include stock-based compensation expense of $4.1 million and $3.1 million for fiscal year 2011 and 2010, respectively.
Sales and marketing expenses. Sales and marketing expenses increased by $6.4 million, or 31.3%, to $26.9 million from $20.5 million, for fiscal year 2011 and 2010, respectively. Sales and marketing expenses were 2.8% of net sales for both fiscal year 2011 and 2010. The increase in absolute dollars was primarily due to an increase of $4.3 million in compensation and benefits resulting from growth in sales and marketing personnel, including higher stock-based compensation expense, an increase of $1.1 million in advertising and promotion expense, an increase of $0.6 million in cooperative marketing funding to customers and an increase of $0.4 million in trade show and travel expenses.
Sales and marketing expenses include stock-based compensation expense of $1.1 million and $0.9 million for fiscal year 2011 and 2010, respectively.
General and administrative expenses. General and administrative expenses increased by $2.1 million, or 13.9%, to $17.4 million from $15.3 million, for fiscal year 2011 and 2010, respectively. General and administrative expenses were 1.9% and 2.1% of net sales for fiscal year 2011 and 2010, respectively. The increase in absolute dollars was primarily due to an increase of $2.4 million in compensation and benefits, including higher stock-based compensation expense, in part to support the expansion of our operations at our headquarters and operations in Taiwan, an increase of $0.6 million in customs fee accrual related to prior periods, an increase of $0.4 million in legal fees offset in part by an increase of $1.0 million in rental income and an increase of $0.6 million in foreign currency transaction gain.
General and administrative expenses include stock-based compensation expense of $2.1 million and $1.9 million for fiscal year 2011 and 2010, respectively.
45
Table of Contents
Provision for litigation loss. There was no loss from litigation expense for fiscal year 2011. For fiscal year 2010, there was a $1.1 million expense due to a settlement payment related to the Digitechnic lawsuit. (See Note 13 of Notes to Consolidated Financial Statements.)
Interest and other expense, net. Interest and other expense changed by $0.3 million, to $0.6 million of expense from $0.3 million of expense, for fiscal year 2011 and 2010, respectively, which included $0.7 million and $0.4 million of interest expense for fiscal year 2011 and 2010, respectively. The net change was primarily due to higher interest expense as our average debt outstanding for fiscal year 2011 was $21.5 million versus $2.5 million in fiscal year 2010. Interest rates were not significantly different in fiscal year 2011 compared to 2010. We expect that our interest expenses will increase in the future as we plan to obtain additional financing from banks to fund the construction of the Taiwan facilities and the expansion of our headquarters office in San Jose.
Provision for income taxes. Provision for income taxes increased by $4.3 million, or 31.8%, to $17.9 million from $13.6 million, for the fiscal year 2011 and 2010, respectively. The effective tax rate was 30.8% and 33.5% for fiscal year 2011 and 2010, respectively. The effective tax rate was lower for fiscal year 2011 primarily due to the reinstatement of Federal research and development tax credits and domestic production activities deduction which were partially offset by the impact of state taxes and stock option expenses.
Comparison of Fiscal Years Ended June 30, 2010 and 2009
Net sales. Net sales increased by $215.8 million, or 42.7%, to $721.4 million from $505.6 million, for fiscal year 2010 and 2009, respectively. This increase was due primarily to an increase in unit volumes of subsystems and accessories and average selling prices of server systems. For fiscal year 2010, the number of units sold increased 54.4% to 3.4 million compared to 2.2 million for fiscal year 2009.
For fiscal year 2010, the number of server system units sold increased 12.1% to 176,000 compared to 157,000 for fiscal year 2009. The average selling price of server system units increased 12.0% to $1,400 in fiscal year 2010 compared to $1,250 in fiscal year 2009. The average selling prices of our server systems increased principally due to higher average selling prices of our 6000 Series configuration of servers which incorporated additional features offset in part by declines in average selling prices of more mature products. Sales of server systems increased by $48.6 million or 24.7% from fiscal year 2009 to fiscal year 2010, primarily due to higher sales of our 6000 Series configuration of servers and higher sales to system integrators offset in part by lower sales of more mature products. Sales of server systems represented 34.0% of our net sales for fiscal year 2010 compared to 38.9% of our net sales for fiscal year 2009. For fiscal year 2010, the number of subsystems and accessories units sold increased 57.6% to 3.3 million compared to 2.1 million for fiscal year 2009. Sales of subsystems and accessories increased by $167.3 million or 54.1% from fiscal year 2009 to fiscal year 2010, primarily due to higher sales to distributors, resellers and system integrators who increasingly are purchasing additional accessories from us and completing the final assembly themselves. Sales of subsystems and accessories represented 66.0% of our net sales for fiscal year 2010 as compared to 61.1% of our net sales for fiscal year 2009. For fiscal year 2010 and 2009, we derived 66.7% and 64.9%, respectively, of our net sales from products sold to distributors and we derived 33.3% and 35.1%, respectively, from sales to OEMs and to end customers. For fiscal year 2010, customers in the United States, Europe and Asia accounted for 60.1%, 21.7% and 14.8%, of our net sales, respectively, as compared to 64.4%, 21.5% and 11.2%, respectively, for fiscal year 2009.
Cost of sales. Cost of sales increased by $189.5 million, or 45.5%, to $606.4 million from $416.9 million, for fiscal year 2010 and 2009, respectively. Cost of sales as a percentage of net sales was 84.1% and 82.5% for fiscal year 2010 and 2009, respectively. The increase in absolute dollars of cost of sales was primarily attributable to the increase in net sales, an increase of $3.3 million in freight-in charges, an increase of $1.8 million in provision for warranty reserve and an increase of $1.2 million in provision for inventory reserve. The higher cost of sales as a percentage of net sales was primarily due to a lower percentage of sales from server systems and a higher percentage of sales of subsystem and accessories and increased sales to distributors,
46
Table of Contents
resellers and system integrators. In fiscal year 2010, we recorded a $8.5 million expense, or 1.2% of net sales, related to the provision for warranty reserve as compared to $6.7 million, or 1.3% of net sales, in fiscal year 2009. The increase in the provision for warranty reserve was primarily due to higher net sales in fiscal year 2010. If in future periods we experience or anticipate an increase or decrease in warranty claims as a result of new product introductions or change in unit volumes compared with our historical experience, or if the cost of servicing warranty claims is greater or lesser than expected, our gross margin would be affected. In fiscal year 2010, we recorded a $2.6 million expense, or 0.4% of net sales, related to the inventory provision as compared to $1.5 million, or 0.3% of net sales, in fiscal year 2009. The increase in the inventory provision was primarily for older products as a result of product transitions.
Research and development expenses. Research and development expenses increased by $2.9 million, or 8.3%, to $37.4 million from $34.5 million, for fiscal year 2010 and 2009, respectively. Research and development expenses were 5.2% and 6.8% of net sales for fiscal year 2010 and 2009, respectively. The increase in absolute dollars was primarily due to an increase of $4.0 million in compensation and benefits resulting from growth in research and development personnel, including higher stock-based compensation expense to support the expansion of our operations at our headquarters and operations in the Netherlands and Taiwan and a decrease of $0.2 million in non-recurring engineering funding from certain suppliers and customers. This increase was offset in part by a decrease of $1.3 million in development costs associated with new products.
Research and development expenses include stock-based compensation expense of $3.1 million and $2.6 million for fiscal year 2010 and 2009, respectively.
Sales and marketing expenses. Sales and marketing expenses increased by $3.3 million, or 19.5%, to $20.5 million from $17.1 million, for fiscal year 2010 and 2009, respectively. Sales and marketing expenses were 2.8% and 3.4% of net sales for fiscal year 2010 and 2009, respectively. The increase in absolute dollars was primarily due to an increase of $2.0 million in compensation and benefits resulting from growth in sales and marketing personnel, including higher stock-based compensation expense, a decrease of $0.4 million in cooperative marketing funding from vendors, an increase of $0.4 million in advertising and promotion expenses and an increase of $0.3 million in trade show expenses.
Sales and marketing expenses include stock-based compensation expense of $0.9 million and $0.8 million for fiscal year 2010 and 2009, respectively.
General and administrative expenses. General and administrative expenses increased by $1.5 million, or 10.8%, to $15.3 million from $13.8 million, for fiscal year 2010 and 2009, respectively. General and administrative expenses were 2.1% and 2.7% of net sales for fiscal year 2010 and 2009, respectively. The increase in absolute dollars was primarily due to an increase of $0.9 million in compensation and benefits, including higher stock-based compensation expense, in part to support the expansion of our operations at our headquarters and operations in the Netherlands and Taiwan and an increase of $0.5 million in bad debt expenses.
General and administrative expenses include stock-based compensation expense of $1.9 million and $1.6 million for fiscal year 2010 and 2009, respectively.
Provision for litigation loss. Loss from litigation was $1.1 million for fiscal year 2010. There was no provision for fiscal year 2009. The provision was due to a settlement payment related to the Digitechnic lawsuit. (See Note 13 of Notes to Consolidated Financial Statements.)
Interest and other expense, net. Interest and other expense was reduced by $0.2 million, to $0.3 million of expense from $0.5 million of expense, for fiscal year 2010 and 2009, respectively, of which $0.4 million and $0.9 million was interest expense for fiscal year 2010 and 2009, respectively. The net change was due to lower interest income of $0.4 million resulting from lower interest rates and lower interest expense of $0.5 million as the Company paid off two outstanding building loans in July and August 2009. We expect the interest expenses
47
Table of Contents
will increase in the future as we have borrowed $18.6 million to purchase properties in San Jose, California in June 2010 and intend to obtain additional financing to purchase land and to fund building construction in Taiwan in fiscal year 2011.
Provision for income taxes. Provision for income taxes increased by $6.9 million, or 102.5%, to $13.6 million from $6.7 million, for the fiscal year 2010 and 2009, respectively. The effective tax rate was 33.5% and 29.4% for fiscal year 2010 and 2009, respectively. The increase in the effective tax rate was primarily due to the expiration of the federal research and development tax credit in fiscal year 2010.
Liquidity and Capital Resources
Since our inception, we have financed our growth primarily with funds generated from operations and from the proceeds of our initial public offering. Our cash and cash equivalents and short-term investments were $70.0 million and $73.5 million as of June 30, 2011 and 2010, respectively.
Operating Activities. Net cash provided by (used in) operating activities was $8.5 million, ($2.2) million and $21.8 million for fiscal years 2011, 2010 and 2009, respectively. Net cash provided by our operating activities for fiscal year 2011 was primarily due to our net income of $40.2 million, an increase in accounts payable of $16.9 million, stock-based compensation expense of $8.1 million, allowance for sales returns of $6.6 million, an increase in net income taxes payable of $5.7 million, depreciation expense of $5.5 million, an increase in accrued liabilities of $5.3 million, which was partially offset by an increase in inventory of $60.5 million and an increase in accounts receivable of $19.2 million. Net cash used in our operating activities for fiscal year 2010 was primarily due to our net income of $26.9 million, an increase in accounts payable of $21.8 million, an increase in net income taxes payable of $9.5 million, stock-based compensation expense of $6.5 million, an increase in accrued liabilities of $5.5 million and allowance for sales returns of $5.3 million which were offset by an increase in inventory of $48.2 million and an increase in accounts receivable of $33.3 million. Net cash provided by our operating activities for fiscal year 2009 was primarily due to our net income of $16.1 million, stock-based compensation expense of $5.7 million, an increase in net income taxes payable of $4.8 million and allowance for sales returns of $4.2 million which was substantially offset by a decrease in accounts payable of $6.9 million and an increase in inventory of $5.8 million.
The increase for fiscal year 2011 in accounts receivable was primarily due to higher net sales during fiscal year 2011. The increase for fiscal year 2011 in inventory, accounts payable and accrued liabilities was in part due to an increase in demand for our products resulting from a recovering economy, in part to support our growth and in part due to our increasing manufacturing activities in the Netherlands and Taiwan. We anticipate that accounts receivable, sales returns, inventory and accounts payable will continue to increase to the extent we continue to grow our product lines and our business.
The increase for fiscal year 2010 in accounts receivable was primarily due to higher net sales during fiscal year 2010. The increase for fiscal year 2010 in inventory, accounts payable and accrued liabilities was due to an increase in demand for our products resulting from a recovering economy and to support the growth of the Company.
The decrease for fiscal year 2009 in sales returns was primarily due to lower net sales during fiscal year 2009 as a result of reductions in information technology spending in response to the global economic downturn and to a lesser extent was impacted by delayed customer orders in anticipation of the release by Intel of its Nehalem line of microprocessors in the quarter ended March 31, 2009. The decrease for fiscal year 2009 in accounts payable was primarily due to timing of payments to our vendors. The increase for fiscal year 2009 in inventory was primarily due to our increased purchases of X8 Nehalem products which were launched at the end of March 31, 2009.
Investing activities. Net cash used in our investing activities was $24.8 million, $11.8 million and $2.7 million for fiscal years 2011, 2010 and 2009, respectively. In fiscal year 2011, $16.2 million was related to the
48
Table of Contents
purchase of property, plant and equipment including $6.1 million related to the land purchased in Taiwan in August 2010 and $9.2 million was related to a deposit made in March 2011 for land in Taiwan. This was offset by the redemption at par of investments in auction rate securities of $1.5 million. In fiscal year 2010, $22.2 million was related to the purchase of property, plant and equipment offset in part by the redemption at par of investments in auction rate securities of $8.9 million. In fiscal year 2009, $3.6 million was related to the purchase of property, plant and equipment offset in part by the redemption at par of investments in auction rate securities of $0.9 million.
We anticipate to close the title on the land deposit in Taiwan and finalize the purchase price, consisting of approximately 2.2 acres, in the first half of fiscal year 2012 to develop our manufacturing and service operations in Asia. We also plan to expand our headquarters office in San Jose, California. The construction of the Taiwan facilities and the headquarters office expansion in San Jose, California began in the fourth quarter of fiscal year 2011 and will continue through fiscal year 2012. The anticipated costs for the next twelve months to build the Taiwan facilities and the headquarters office expansion in San Jose, California are approximately $16.9 million. We plan to finance these projects through our operating cash flows and additional financing from banks in fiscal year 2012.
Financing activities. Net cash provided by (used in) our financing activities was $13.6 million, $16.3 million and ($0.3) million for fiscal years 2011, 2010 and 2009, respectively. In fiscal year 2011, we received $10.3 million related to the proceeds from the exercise of stock options. We withheld shares and paid the minimum tax withholding on behalf of several executive officers and an employee for their stock options and restricted stock awards of $8.4 million for fiscal year 2011. Further, we obtained a new term loan of $13.9 million and borrowed $9.9 million of our revolving line of credit. We repaid $14.1 million in loans for fiscal year 2011. We expect the net cash provided by financing activities will increase in the quarter ending September 30, 2011 as we intend to obtain additional financing from banks to construct our manufacturing building in Taiwan and support our building expansion in San Jose, California. In fiscal year 2010, $18.6 million was related to proceeds from the revolving line of credit associated with the purchase of three buildings and $6.4 million was proceeds from exercise of stock options and $1.5 million was related to the excess tax benefits from stock-based compensation. In fiscal year 2009, we repurchased 445,028 shares of treasury stock for $2.0 million and received $2.1 million of proceeds from the exercise of stock options.
We expect to experience continued growth in our working capital requirements and capital expenditures as we continue to expand our business. We intend to fund this continued expansion through cash generated by operations and by drawing on the revolving credit facility or through other debt financing. However we cannot be certain whether such financing will be available on commercially reasonable or otherwise favorable terms or that such financing will be available at all. We anticipate that working capital and capital expenditures will constitute a material use of our cash resources. We have sufficient cash on hand to continue to operate in the next 12 months.
Other factors affecting liquidity and capital resources
As of June 30, 2011, we had a revolving line of credit totaling $25.0 million that matures on June 15, 2013 with an interest rate at the LIBOR rate plus 1.50% per annum. In June 2010, we used $18.6 million of the line of credit to purchase three buildings with approximately 167,000 square feet of space in San Jose, California adjacent to our headquarters. The loan is secured by all our assets except for the three buildings purchased in San Jose, California, and we were required to obtain a mortgage loan to pay-off this line of credit by December 2010. In December 2010, we repaid $13.9 million of the line of credit by obtaining a term loan for the same amount and the remaining $4.7 million of the line of credit has been extended to be repaid by June 15, 2013. The term loan is secured by the three buildings purchased in San Jose, California in June 2010 and the principal and interest are payable monthly through October 1, 2013 with an interest rate at the LIBOR rate plus 1.75% per annum. The LIBOR rate was 0.19% at June 30, 2011.
49
Table of Contents
In March 2011, we drew an additional $9.9 million of the line of credit with an interest rate equal to the lender’s established interest rate which is adjusted monthly and paid $9.2 million for a deposit to purchase land in Taiwan. The interest rate was 1.64% at June 30, 2011. As of June 30, 2011 and June 30, 2010, the total outstanding borrowing under these loans was $28.2 million and $18.6 million, respectively. As of June 30, 2011, the unused revolving line of credit was $10.4 million and we were not in compliance with the investment covenant associated with these loans; however, we obtained waivers as of June 30, 2011 from the lenders in August 2011 regarding such non-compliance.
In addition, we have historically paid our contract manufacturers within 38 to 76 days of invoice and Ablecom between 53 and 100 days of invoice. As of June 30, 2011 and 2010 amounts owed to Ablecom by us were $34.2 million and $19.5 million, respectively.
In February 2008, we leased an office building of approximately 246,000 square feet in Fremont, California with total payment obligations of $6.8 million over the next 4.1 years as of June 30, 2011. We also obtained an irrevocable standby letter of credit required by the landlord of the office lease totaling $121,000. This amount has been classified as a restricted cash as of June 30, 2011.
As of June 30, 2011, we held $5.2 million of auction rate securities, net of unrealized losses, representing our interest in auction rate preferred shares in a closed end mutual fund invested in municipal securities and auction rate student loans guaranteed by the Federal Family Education Loan Program; such auction rate securities were rated AAA or BAA at June 30, 2011. These auction rate preferred shares have no stated maturity date and stated maturity dates for these auction rate student loans range from 2035 to 2040.
During February 2008, the auctions for these auction rate securities began to fail to obtain sufficient bids to establish a clearing rate and were not saleable in the auction, thereby losing the short-term liquidity previously provided by the auction process. As a result, as of June 30, 2011, $5.2 million of these auction rate securities have been classified as long-term available-for-sale investments. Based on our assessment of fair value at June 30, 2011, we have recorded an accumulated unrealized loss of $0.2 million, net of deferred income taxes, on long-term auction rate securities. The unrealized loss was deemed to be temporary and has been recorded as a component of accumulated other comprehensive loss.
Although we have determined that we will not likely be required to sell the securities before the anticipated recovery and we have the intent and ability to hold these investments until successful auctions occur, these investments are not currently liquid and in the event we need to access these funds, we will not be able to do so without a loss of principal. There can be no assurances that these investments will be settled in the short term or that they will not become other-than-temporarily impaired subsequent to June 30, 2011, as the market for these investments is presently uncertain. In any event, we do not have a present need to access these funds for operational purposes. We will continue to monitor and evaluate these investments as there is no assurance as to when the market for these investments will allow us to liquidate them. We may be required to record impairment charges in periods subsequent to June 30, 2011 with respect to these securities and, if a liquid market does not develop for these investments, we could be required to hold them to maturity. In fiscal year 2011, 2010 and 2009, $1.5 million, $8.9 million and $0.9 million of these auction rate securities were redeemed at par, respectively.
Our long-term future capital requirements will depend on many factors, including our level of revenues, the timing and extent of spending to support our product development efforts, the expansion of sales and marketing activities, the timing of our introductions of new products, the costs to ensure access to adequate manufacturing capacity and the continuing market acceptance of our products. We could be required, or could elect, to seek additional funding through public or private equity or debt financing and additional funds may not be available on terms acceptable to us or at all.
50
Table of Contents
Contractual Obligations
The following table describes our contractual obligations as of June 30, 2011:
| Payments Due by Period | ||||||||||||||||||||
| Less Than 1 Year |
1 to 3 Years |
3 to 5 Years |
More Than 5 Years |
Total | ||||||||||||||||
| (in thousands) | ||||||||||||||||||||
| Operating leases |
$ | 3,210 | $ | 4,609 | $ | 2,859 | $ | 32 | $ | 10,710 | ||||||||||
| Capital leases, including interest |
41 | 51 | 5 | — | 97 | |||||||||||||||
| Long-term debt, including interest (1) |
827 | 27,942 | — | — | 28,769 | |||||||||||||||
| License arrangements |
511 | 911 | 228 | — | 1,650 | |||||||||||||||
| Purchase commitments (2) |
91,812 | — | — | — | 91,812 | |||||||||||||||
|
|
|
|
|
|
|
|
|
|
|
|||||||||||
| Total |
$ | 96,401 | $ | 33,513 | $ | 3,092 | $ | 32 | $ | 133,038 | ||||||||||
|
|
|
|
|
|
|
|
|
|
|
|||||||||||
| (1) | Amount reflects total anticipated cash payments, including anticipated interest payments based on the interest rate at June 30, 2011. |
| (2) | Amount reflects total gross purchase commitments under our manufacturing arrangements with third-party contract manufacturers or vendors. |
The table above excludes liabilities for deferred revenue for warranty services of $2.4 million and unrecognized tax benefits and related interest and penalties accrual of $7.2 million. We have not provided a detailed estimate of the payment timing of unrecognized tax benefits due to the uncertainty of when the related tax settlements will become due. See Note 12 of Notes to our Consolidated Financial Statements in Item 8 of this Form 10-K for a discussion of income taxes.
We expect to fund our remaining contractual obligations from our ongoing operations and existing cash and cash equivalents on hand.
Recent Accounting Pronouncements
In May 2011, the FASB issued additional guidance on fair value measurements that clarifies the application of existing guidance and disclosure requirements, changes certain fair value measurement principles and requires additional disclosures about fair value measurements. The updated guidance is effective on a prospective basis for financial statements issued for fiscal years, and interim periods within those fiscal years, beginning after December 15, 2011. The adoption of this guidance will not have a material impact on our consolidated financial position and results of operations.
In June 2011, the FASB issued guidance regarding the presentation of comprehensive income. The new standard requires the presentation of comprehensive income, the components of net income and the components of other comprehensive income either in a single continuous statement of comprehensive income or in two separate but consecutive statements. The new standard also requires presentation of adjustments for items that are reclassified from other comprehensive income to net income in the statement where the components of net income and the components of other comprehensive income are presented. The updated guidance is effective on a retrospective basis for financial statements issued for fiscal years, and interim periods within those fiscal years, beginning after December 15, 2011. The adoption of this guidance will not have a material impact on our consolidated financial position and results of operations.
Off-Balance Sheet Arrangements
We do not have any off-balance sheet arrangements.
51
Table of Contents
| Item 7A. | Qualitative and Quantitative Disclosure About Market Risk |
Interest Rate Risk
The primary objectives of our investment activities are to preserve principal, provide liquidity and maximize income without significantly increasing the risk. Some of the securities we invest in are subject to market risk. This means that a change in prevailing interest rates may cause the fair value of the investment to fluctuate. To minimize this risk, we maintain our portfolio of cash equivalents and short-term investments in money market funds and certificates of deposit. Since our results of operations are not dependent on investments, the risk associated with fluctuating interest rates is limited to our investment portfolio, and we believe that a 10% change in interest rates would not have a significant impact on our results of operations. As of June 30, 2011, our investments were in money market funds, certificates of deposits and auction rate securities (see Liquidity Risk below).
We had $28.2 million and $18.6 million of indebtedness under our credit facilities as of June 30, 2011 and 2010, respectively. In December 2010, we repaid $13.9 million of the revolving line of credit by obtaining a term loan. In March 2011, we also drew an additional $9.9 million from the revolving line of credit and paid $9.2 million for a deposit to purchase land in Taiwan that is adjacent to the land that was purchased in August 2010. The annual interest rate on our credit facilities for our outstanding term loan is based on the LIBOR rate plus 1.50% per annum. The annual interest rate for our revolving line of credit is based on LIBOR rate plus 1.75% per annum and lender’s established interest rate. The interest rate for the term loan and the revolving line of credit ranges from 1.69% to 2.14% at June 30, 2011 and 1.84% at June 30, 2010. We believe that a 10% change in interest rates would not have a significant impact on our results of operations.
Liquidity Risk
As of June 30, 2011, we held $5.2 million of auction rate securities, net of unrealized losses, representing our interest in auction rate preferred shares in a closed end mutual fund invested in municipal securities and auction rate student loans guaranteed by the Federal Family Education Loan Program; such auction rate securities were rated AAA or BAA at June 30, 2011. These auction rate preferred shares have no stated maturity date and the stated maturity dates for these auction rate student loans range from 2035 to 2040. During February 2008, the auctions for these auction rate securities began to fail to obtain sufficient bids to establish a clearing rate and were not saleable in the auction, thereby losing the short-term liquidity previously provided by the auction process. As a result, as of June 30, 2011, $5.2 million of these auction rate securities have been classified as long-term available-for-sale investments. Based on our assessment of fair value at June 30, 2011, we have recorded an accumulated unrealized loss of $0.2 million, net of deferred income taxes, on long-term auction rate securities. The unrealized loss was deemed to be temporary and has been recorded as a component of accumulated other comprehensive loss. During fiscal year 2011, 2010 and 2009, $1.5 million, $8.9 million and $0.9 million were redeemed at par, respectively.
Although we have determined that we will not likely be required to sell the securities before the anticipated recovery and we have the intent and ability to hold our investments until successful auctions occur, these investments are not currently liquid and in the event we need to access these funds, we will not be able to do so without a loss of principal. There can be no assurances that these investments will be settled in the short term or that they will not become other-than-temporarily impaired subsequent to June 30, 2011, as the market for these investments is presently uncertain. In any event, we do not have a present need to access these funds for operational purposes. We will continue to monitor and evaluate these investments as there is no assurance as to when the market for these investments will allow us to liquidate them. We may be required to record impairment charges in periods subsequent to June 30, 2011 with respect to these securities and, if a liquid market does not develop for these investments, we could be required to hold them to maturity.
52
Table of Contents
Foreign Currency Risk
To date, our international customer and supplier agreements have been denominated primarily in U.S. dollars, and accordingly, we have not been exposed to foreign currency exchange rate fluctuations from customer agreements, and do not currently engage in foreign currency hedging transactions. However, the functional currency of our operations in Netherlands and Taiwan is the U.S. dollar and our local accounts are maintained in the local currency in the Netherlands and Taiwan, respectively, and thus we are subject to foreign currency exchange rate fluctuations associated with re-measurement to U.S. dollars. Such fluctuations have not been significant historically. Foreign exchange gain for fiscal years 2011, 2010 and 2009 was $0.8 million, $0.2 million and $3,000, respectively.
53
Table of Contents
| Item 8. | Financial Statements and Supplementary Data |
INDEX TO CONSOLIDATED FINANCIAL STATEMENTS
| Page | ||||
| 55 | ||||
| 56 | ||||
| 57 | ||||
| 58 | ||||
| 59 | ||||
| 60 | ||||
54
Table of Contents
REPORT OF INDEPENDENT REGISTERED PUBLIC ACCOUNTING FIRM
To the Board of Directors and Stockholders of
Super Micro Computer, Inc.:
We have audited the accompanying consolidated balance sheets of Super Micro Computer, Inc. and subsidiaries (the “Company”) as of June 30, 2011 and 2010, and the related consolidated statements of operations, stockholders’ equity, and cash flows for each of the three years in the period ended June 30, 2011. These consolidated financial statements are the responsibility of the Company’s management. Our responsibility is to express an opinion on the consolidated financial statements based on our audits.
We conducted our audits in accordance with the standards of the Public Company Accounting Oversight Board (United States). Those standards require that we plan and perform the audit to obtain reasonable assurance about whether the financial statements are free of material misstatement. An audit includes examining, on a test basis, evidence supporting the amounts and disclosures in the financial statements. An audit also includes assessing the accounting principles used and significant estimates made by management, as well as evaluating the overall financial statement presentation. We believe that our audits provide a reasonable basis for our opinion.
In our opinion, such consolidated financial statements present fairly, in all material respects, the financial position of Super Micro Computer, Inc. and subsidiaries as of June 30, 2011 and 2010, and the results of their operations and their cash flows for each of the three years in the period ended June 30, 2011, in conformity with accounting principles generally accepted in the United States of America.
As discussed in Note 10 to the consolidated financial statements, the Company has significant purchases from and sales to a related party.
We have also audited, in accordance with the standards of the Public Company Accounting Oversight Board (United States), the Company’s internal control over financial reporting as of June 30, 2011, based on the criteria established in Internal Control—Integrated Framework issued by the Committee of Sponsoring Organizations of the Treadway Commission and our report dated September 2, 2011 expressed an unqualified opinion on the Company’s internal control over financial reporting.
/s/ Deloitte & Touche, LLP
San Jose, California
September 2, 2011
55
Table of Contents
CONSOLIDATED BALANCE SHEETS
(in thousands, except share amounts)
| June 30, 2011 |
June 30, 2010 |
|||||||
| ASSETS |
||||||||
| Current assets: |
||||||||
| Cash and cash equivalents |
$ | 69,943 | $ | 72,644 | ||||
| Short-term investments |
59 | 845 | ||||||
| Accounts receivable, net of allowances of $1,062 and $1,210 at June 30, 2011 and 2010, respectively (including amounts receivable from a related party of $527 and $1,201 at June 30, 2011 and 2010, respectively) |
85,005 | 72,963 | ||||||
| Inventory, net |
192,711 | 135,584 | ||||||
| Deferred income taxes-current |
10,250 | 9,756 | ||||||
| Prepaid income taxes |
7,207 | 2,737 | ||||||
| Prepaid expenses and other current assets |
4,447 | 2,328 | ||||||
|
|
|
|
|
|||||
| Total current assets |
369,622 | 296,857 | ||||||
| Long-term investments |
5,188 | 5,901 | ||||||
| Property, plant and equipment, net |
74,438 | 62,691 | ||||||
| Deferred income taxes-noncurrent |
2,792 | 4,825 | ||||||
| Restricted cash |
409 | 286 | ||||||
| Other assets |
12,171 | 202 | ||||||
|
|
|
|
|
|||||
| Total assets |
$ | 464,620 | $ | 370,762 | ||||
|
|
|
|
|
|||||
| LIABILITIES AND STOCKHOLDERS’ EQUITY |
||||||||
| Current liabilities: |
||||||||
| Accounts payable (including amounts due to a related party of $34,210 and $19,464 at June 30, 2011 and 2010, respectively) |
$ | 113,340 | $ | 95,416 | ||||
| Accrued liabilities |
24,780 | 19,432 | ||||||
| Income taxes payable |
936 | 3,219 | ||||||
| Advances from receivable financing arrangements |
1,000 | 1,193 | ||||||
| Short-term debt |
— | 18,553 | ||||||
| Current portion of capital lease obligations |
36 | 62 | ||||||
| Current portion of long-term debt |
555 | — | ||||||
|
|
|
|
|
|||||
| Total current liabilities |
140,647 | 137,875 | ||||||
| Long-term capital lease obligations-net of current portion |
50 | 46 | ||||||
| Long-term debt-net of current portion |
27,596 | — | ||||||
| Other long-term liabilities |
9,070 | 8,140 | ||||||
|
|
|
|
|
|||||
| Total liabilities |
177,363 | 146,061 | ||||||
| Commitments and contingencies (Note 13) |
||||||||
| Stockholders’ equity: |
||||||||
| Common stock and additional paid-in capital, $0.001 par value |
||||||||
| Authorized shares: 100,000,000 |
||||||||
| Issued shares: 40,727,562 and 37,493,534 at June 30, 2011 and 2010, respectively |
122,693 | 100,350 | ||||||
| Treasury stock (at cost), 445,028 shares at June 30, 2011 and 2010 |
(2,030 | ) | (2,030 | ) | ||||
| Accumulated other comprehensive loss |
(204 | ) | (204 | ) | ||||
| Retained earnings |
166,798 | 126,585 | ||||||
|
|
|
|
|
|||||
| Total stockholders’ equity |
287,257 | 224,701 | ||||||
|
|
|
|
|
|||||
| Total liabilities and stockholders’ equity |
$ | 464,620 | $ | 370,762 | ||||
|
|
|
|
|
|||||
See accompanying notes to consolidated financial statements.
56
Table of Contents
CONSOLIDATED STATEMENTS OF OPERATIONS
(in thousands, except per share amounts)
| Years Ended June 30, | ||||||||||||
| 2011 | 2010 | 2009 | ||||||||||
| Net sales (including related party sales of $11,017, $10,190 and $6,025 in fiscal years 2011, 2010 and 2009, respectively) |
$ | 942,582 | $ | 721,438 | $ | 505,609 | ||||||
| Cost of sales (including related party purchases of $155,430, $124,466 and $91,954 in fiscal years 2011, 2010 and 2009, respectively) |
791,478 | 606,446 | 416,899 | |||||||||
|
|
|
|
|
|
|
|||||||
| Gross profit |
151,104 | 114,992 | 88,710 | |||||||||
| Operating expenses: |
||||||||||||
| Research and development |
48,108 | 37,382 | 34,514 | |||||||||
| Sales and marketing |
26,859 | 20,458 | 17,119 | |||||||||
| General and administrative |
17,444 | 15,318 | 13,824 | |||||||||
| Provision for litigation loss |
— | 1,089 | — | |||||||||
|
|
|
|
|
|
|
|||||||
| Total operating expenses |
92,411 | 74,247 | 65,457 | |||||||||
|
|
|
|
|
|
|
|||||||
| Income from operations |
58,693 | 40,745 | 23,253 | |||||||||
| Interest and other income, net |
66 | 103 | 476 | |||||||||
| Interest expense |
(686 | ) | (383 | ) | (930 | ) | ||||||
|
|
|
|
|
|
|
|||||||
| Income before income tax provision |
58,073 | 40,465 | 22,799 | |||||||||
| Income tax provision |
17,860 | 13,550 | 6,692 | |||||||||
|
|
|
|
|
|
|
|||||||
| Net income |
$ | 40,213 | $ | 26,915 | $ | 16,107 | ||||||
|
|
|
|
|
|
|
|||||||
| Net income per common share: |
||||||||||||
| Basic |
$ | 1.04 | $ | 0.73 | $ | 0.46 | ||||||
| Diluted |
$ | 0.93 | $ | 0.65 | $ | 0.41 | ||||||
| Weighted-average shares used in calculation of net income per common share: |
||||||||||||
| Basic |
38,132 | 35,884 | 34,218 | |||||||||
| Diluted |
42,396 | 40,735 | 38,596 | |||||||||
See accompanying notes to consolidated financial statements.
57
Table of Contents
CONSOLIDATED STATEMENTS OF STOCKHOLDERS’ EQUITY
(in thousands, except share amounts)
| Common Stock and Additional Paid-In Capital |
Deferred Stock-Based Compensation |
Treasury Stock | Accumulated Other Comprehensive Loss |
Retained Earnings |
Total Stockholders’ Equity |
|||||||||||||||||||||||||||
| Shares | Amount | Shares | Amount | |||||||||||||||||||||||||||||
| Balance at June 30, 2008 |
32,668,731 | $ | 69,434 | $ | (675 | ) | — | $ | — | $ | (451 | ) | $ | 83,563 | $ | 151,871 | ||||||||||||||||
| Purchase of treasury stock |
— | — | — | (445,028 | ) | (2,030 | ) | — | — | (2,030 | ) | |||||||||||||||||||||
| Exercise of stock options |
2,549,553 | 2,057 | — | — | — | — | — | 2,057 | ||||||||||||||||||||||||
| Stock-based compensation |
— | 5,099 | — | — | — | — | — | 5,099 | ||||||||||||||||||||||||
| Amortization of deferred compensation |
— | — | 562 | — | — | — | — | 562 | ||||||||||||||||||||||||
| Forfeitures of stock-based compensation |
— | (3 | ) | 3 | — | — | — | — | — | |||||||||||||||||||||||
| Tax benefit resulting from stock option transactions |
— | 5,306 | — | — | — | — | — | 5,306 | ||||||||||||||||||||||||
| Unrealized loss on investments |
— | — | — | — | — | (350 | ) | — | (350 | ) | ||||||||||||||||||||||
| Net income |
— | — | — | — | — | — | 16,107 | 16,107 | ||||||||||||||||||||||||
|
|
|
|
|
|
|
|
|
|
|
|
|
|
|
|
|
|||||||||||||||||
| Balance at June 30, 2009 |
35,218,284 | 81,893 | (110 | ) | (445,028 | ) | (2,030 | ) | (801 | ) | 99,670 | 178,622 | ||||||||||||||||||||
| Exercise of stock options |
1,958,652 | 6,351 | — | — | — | — | — | 6,351 | ||||||||||||||||||||||||
| Issuance of restricted stock awards |
316,598 | — | — | — | — | — | — | — | ||||||||||||||||||||||||
| Stock-based compensation |
— | 6,347 | — | — | — | — | — | 6,347 | ||||||||||||||||||||||||
| Amortization of deferred compensation |
— | — | 110 | — | — | — | — | 110 | ||||||||||||||||||||||||
| Tax benefit resulting from stock option transactions |
— | 5,759 | — | — | — | — | — | 5,759 | ||||||||||||||||||||||||
| Unrealized gain on investments |
— | — | — | — | — | 597 | — | 597 | ||||||||||||||||||||||||
| Net income |
— | — | — | — | — | — | 26,915 | 26,915 | ||||||||||||||||||||||||
|
|
|
|
|
|
|
|
|
|
|
|
|
|
|
|
|
|||||||||||||||||
| Balance at June 30, 2010 |
37,493,534 | 100,350 | — | (445,028 | ) | (2,030 | ) | (204 | ) | 126,585 | 224,701 | |||||||||||||||||||||
| Exercise of stock options, net of taxes |
3,065,405 | 3,281 | — | — | — | — | — | 3,281 | ||||||||||||||||||||||||
| Issuance of restricted stock awards, net of taxes |
168,623 | (1,434 | ) | — | — | — | — | — | (1,434 | ) | ||||||||||||||||||||||
| Stock-based compensation |
— | 8,056 | — | — | — | — | — | 8,056 | ||||||||||||||||||||||||
| Tax benefit resulting from stock option transactions |
— | 12,440 | — | — | — | — | — | 12,440 | ||||||||||||||||||||||||
| Net income |
— | — | — | — | — | — | 40,213 | 40,213 | ||||||||||||||||||||||||
|
|
|
|
|
|
|
|
|
|
|
|
|
|
|
|
|
|||||||||||||||||
| Balance at June 30, 2011 |
40,727,562 | $ | 122,693 | $ | — | (445,028 | ) | $ | (2,030 | ) | $ | (204 | ) | $ | 166,798 | $ | 287,257 | |||||||||||||||
|
|
|
|
|
|
|
|
|
|
|
|
|
|
|
|
|
|||||||||||||||||
See accompanying notes to consolidated financial statements.
58
Table of Contents
CONSOLIDATED STATEMENTS OF CASH FLOWS
(in thousands)
| Years Ended June 30, | ||||||||||||
| 2011 | 2010 | 2009 | ||||||||||
| OPERATING ACTIVITIES: |
||||||||||||
| Net income |
$ | 40,213 | $ | 26,915 | $ | 16,107 | ||||||
| Reconciliation of net income to net cash provided by operating activities: |
||||||||||||
| Depreciation and amortization |
5,453 | 4,619 | 3,653 | |||||||||
| Stock-based compensation expense |
8,056 | 6,457 | 5,661 | |||||||||
| Excess tax benefits from stock-based compensation |
(2,401 | ) | (1,484 | ) | — | |||||||
| Allowance for doubtful accounts |
499 | 772 | 299 | |||||||||
| Allowance for sales returns |
6,624 | 5,310 | 4,248 | |||||||||
| Provision for inventory |
3,353 | 2,614 | 1,459 | |||||||||
| Loss on disposal of property, plant and equipment |
35 | 63 | 40 | |||||||||
| Gain on short-term investments |
— | (1 | ) | — | ||||||||
| Deferred income taxes |
1,539 | (4,407 | ) | (1,002 | ) | |||||||
| Changes in operating assets and liabilities: |
||||||||||||
| Accounts receivable, net (including changes in related party balances of $674, $(921) and $512 in fiscal years 2011, 2010 and 2009, respectively) |
(19,165 | ) | (33,336 | ) | (755 | ) | ||||||
| Inventory |
(60,480 | ) | (48,154 | ) | (5,820 | ) | ||||||
| Prepaid expenses and other assets |
(4,144 | ) | (792 | ) | 116 | |||||||
| Accounts payable (including changes in related party balances of $14,746, $(1,991) and $(6,262) in fiscal years 2011, 2010 and 2009, respectively) |
16,933 | 21,840 | (6,914 | ) | ||||||||
| Income taxes payable, net |
5,687 | 9,497 | 4,792 | |||||||||
| Accrued liabilities |
5,348 | 5,514 | (872 | ) | ||||||||
| Other long-term liabilities |
930 | 2,399 | 807 | |||||||||
|
|
|
|
|
|
|
|||||||
| Net cash provided by (used in) operating activities |
8,480 | (2,174 | ) | 21,819 | ||||||||
|
|
|
|
|
|
|
|||||||
| INVESTING ACTIVITIES: |
||||||||||||
| Restricted cash |
(123 | ) | 1,480 | (38 | ) | |||||||
| Proceeds from investments |
1,500 | 8,999 | 942 | |||||||||
| Purchases of property, plant and equipment |
(16,202 | ) | (22,223 | ) | (3,561 | ) | ||||||
| Investment in a privately held company |
(750 | ) | — | — | ||||||||
| Land deposit |
(9,195 | ) | — | — | ||||||||
| Purchases of investments |
— | (58 | ) | (58 | ) | |||||||
|
|
|
|
|
|
|
|||||||
| Net cash used in investing activities |
(24,770 | ) | (11,802 | ) | (2,715 | ) | ||||||
|
|
|
|
|
|
|
|||||||
| FINANCING ACTIVITIES: |
||||||||||||
| Proceeds from exercise of stock options |
10,271 | 6,351 | 2,057 | |||||||||
| Minimum tax withholding paid on behalf of employees for stock options and restricted stock awards |
(8,424 | ) | — | — | ||||||||
| Excess tax benefits from stock-based compensation |
2,401 | 1,484 | — | |||||||||
| Proceeds from debt |
23,730 | 18,553 | — | |||||||||
| Repayment of debt |
(14,132 | ) | (9,994 | ) | (307 | ) | ||||||
| Payment of obligations under capital leases |
(64 | ) | (42 | ) | (57 | ) | ||||||
| Advances (payments) under receivable financing arrangements |
(193 | ) | (27 | ) | 47 | |||||||
| Payment to acquire treasury stock |
— | — | (2,030 | ) | ||||||||
|
|
|
|
|
|
|
|||||||
| Net cash provided by (used in) by financing activities |
13,589 | 16,325 | (290 | ) | ||||||||
|
|
|
|
|
|
|
|||||||
| Net increase (decrease) in cash and cash equivalents |
(2,701 | ) | 2,349 | 18,814 | ||||||||
| Cash and cash equivalents at beginning of year |
72,644 | 70,295 | 51,481 | |||||||||
|
|
|
|
|
|
|
|||||||
| Cash and cash equivalents at end of year |
$ | 69,943 | $ | 72,644 | $ | 70,295 | ||||||
|
|
|
|
|
|
|
|||||||
| Supplemental disclosure of cash flow information: |
||||||||||||
| Cash paid for interest |
$ | 649 | $ | 371 | $ | 930 | ||||||
| Cash paid for taxes, net of refunds |
$ | 9,813 | $ | 6,542 | $ | 3,648 | ||||||
| Non-cash investing and financing activities: |
||||||||||||
| Equipment purchased under capital leases |
$ | 42 | $ | 42 | $ | — | ||||||
| Reversal of deferred stock-based compensation for cancellation of stock options |
$ | — | $ | — | $ | 3 | ||||||
| Accrued costs for property, plant and equipment purchases |
$ | 1,482 | $ | 491 | $ | 447 | ||||||
| Changes in fair values of investments |
$ | — | $ | 984 | $ | (577 | ) | |||||
See accompanying notes to consolidated financial statements.
59
Table of Contents
NOTES TO CONSOLIDATED FINANCIAL STATEMENTS
| Note 1. | Organization |
Super Micro Computer, Inc. (“Super Micro Computer”) was incorporated in 1993. Super Micro Computer is a global leader in server technology and green computing innovation. Super Micro Computer develops and provides high performance server solutions based upon an innovative, modular and open-standard architecture. Super Micro Computer has operations in San Jose, California, the Netherlands and Taiwan.
| Note 2. | Summary of Significant Accounting Policies |
Principles of Consolidation
The consolidated financial statements reflect the consolidated balance sheets, results of operations and cash flows of Super Micro Computer, Inc. and its wholly-owned subsidiaries (collectively, the “Company”). All intercompany accounts and transactions have been eliminated in consolidation.
Use of Estimates
The preparation of financial statements in conformity with accounting principles generally accepted in the United States of America (“U.S. GAAP”) requires management to make estimates and assumptions that affect the reported amounts of assets and liabilities and disclosure of contingent assets and liabilities at the date of the financial statements and the reported amounts of revenues and expenses during the reporting periods. Such estimates include, but are not limited to: allowances for doubtful accounts and sales returns, cooperative marketing accruals, inventory valuation, product warranty accruals, stock-based compensation, impairment of short-term and long-term investments and income taxes. Actual results could differ from those estimates.
Fair Value Measurements
The Company accounts for certain assets and liabilities at fair value. The hierarchy below lists three levels of fair value based on the extent to which inputs used in measuring fair value are observable in the market. The Company categorizes each of its fair value measurements in one of these three levels based on the lowest level input that is significant to the fair value measurement in its entirety. These levels are:
| • | Level 1 - Unadjusted quoted prices in active markets that are accessible at the measurement date for identical, unrestricted assets or liabilities; |
| • | Level 2 - Quoted prices in markets that are not active or financial instruments for which all significant inputs are observable, either directly or indirectly; and |
| • | Level 3 - Prices or valuations that require inputs that are both significant to the fair value measurement and unobservable. |
Cash and Cash Equivalents
The Company considers all highly liquid instruments with an original maturity of three months or less from the date of purchase to be cash equivalents. Cash equivalents consist primarily of money market funds and certificate of deposits with maturities of less than three months.
Short-term Investments
Short-term investments consist of a certificate of deposit with maturity of more than three months but less than a year and auction rate securities. See Note 6 related to auction rate securities. The certificate of deposit is carried at amortized cost which approximates fair value.
60
Table of Contents
SUPER MICRO COMPUTER, INC.
NOTES TO CONSOLIDATED FINANCIAL STATEMENTS—(Continued)
Inventory
Inventory is valued at the lower of cost (first-in, first-out method) or market. Inventory consists of raw materials (principally components), work in process (principally products being assembled) and finished goods. Market value represents net realizable value for finished goods and work in process and replacement value of raw materials and parts. The Company evaluates inventory on a quarterly basis for lower of cost or market and excess and obsolescence and, as necessary, writes down the valuation of units to lower of cost or market or for excess and obsolescence calculated as the number of units that are unlikely to be sold based upon estimated demand for the following twelve months. This evaluation takes into account matters including expected demand, anticipated sales price, product obsolescence and other factors. If actual future demand for our products is less than currently forecasted, additional inventory adjustments may be required. Once a reserve is established, it is maintained until the product to which it relates is sold or scrapped. If a unit that has been written down is subsequently sold, the cost associated with the revenue from this unit is reduced to the extent of the write down, resulting in an increase in gross profit. The Company monitors the extent to which previously written down inventory is sold at amounts greater or less than carrying value, and based on this analysis, adjusts its estimate for determining future write downs. If in future periods, the Company experiences or anticipates a change in recovery rate compared with its historical experience, its gross margin would be affected. During fiscal years 2011, 2010 and 2009, the Company recorded a provision for lower of costs or market and excess and obsolete inventory totaling $3,353,000, $2,614,000 and $1,459,000, respectively.
Property, Plant and Equipment
Property, plant and equipment are recorded at cost and depreciated using the straight-line method over the estimated useful lives of the related assets as follows:
| Machinery and equipment |
1.5 to 7 years | |
| Furniture and fixtures |
5 years | |
| Software |
3 years | |
| Buildings |
39 years | |
| Building improvements |
20 years | |
| Leasehold improvements |
shorter of lease term or estimated useful life |
For assets acquired and financed under capital leases, the present value of the future minimum lease payments is recorded at the date of acquisition as property and equipment with the corresponding amount recorded as a capital lease obligation, and the amortization is computed on a straight-line basis over the shorter of lease term or estimated useful life.
Other Assets
Other assets consist primarily of a deposit for land in Taiwan totaling $9,195,000 that is adjacent to the land that was purchased in August 2010, a long-term prepaid royalty license of $1,994,000 and an investment in a privately held company of $750,000. The title to the land in Taiwan is expected to transfer in the first half of fiscal year 2012.
Long-Lived Assets
The Company evaluates its long-lived assets for impairment whenever events or changes in circumstances indicate that the carrying amount of an asset may not be recoverable. When the sum of the undiscounted future
61
Table of Contents
SUPER MICRO COMPUTER, INC.
NOTES TO CONSOLIDATED FINANCIAL STATEMENTS—(Continued)
net cash flows expected to result from the use of the asset and its eventual disposition is less than its carrying amount, an impairment loss would be measured based on the fair value of the asset compared to the carrying amount. No impairment charge has been recorded in any of the periods presented.
Revenue Recognition
The Company recognizes revenue from sales of products, when persuasive evidence of an arrangement exists, shipment has occurred and title has transferred, the sales price is fixed or determinable, collection of the resulting receivable is reasonably assured, and all significant obligations have been met. Generally this occurs at the time of shipment when risk of loss and title has passed to the customer. The Company’s standard arrangement with its customers includes a signed purchase order or contract, 30 to 60 days payment terms, Ex-works terms, except for a few customers who have free-on-board destination terms or customer acceptance provisions, and revenue is recognized when the products arrive or are accepted at the destination. The Company generally does not provide for non-warranty rights of return except for products which have “Out-of-box” failure, in which case customers may return these products for credit within 30 days of receiving the items. Certain distributors and original equipment manufacturers (OEMs) are also permitted to return products in unopened boxes, limited to purchases over a specified period of time, generally within 60 to 90 days of the purchase, or to products in the distributor’s or OEM’s inventory at certain times (such as the termination of the agreement or product obsolescence). In addition, the Company has a sales arrangement with an OEM under which the Company sells its products with the OEM’s brand to the OEM. The OEM has limited product return rights. To estimate reserves for future sales returns, the Company regularly reviews its history of actual returns for each major product line. The Company also communicates regularly with the relevant distributors to gather information about end customer satisfaction, and to determine the volume of inventory in the channel. Estimated reserves for future returns, which are recorded at the time the related revenue is recognized, are adjusted as necessary, based on returns experience, returns expectations and communication with distributors
In addition, certain customers have acceptance provisions and revenue is deferred until the customers provide the necessary acceptance. At June 30, 2011 and 2010, the Company had deferred revenue of $2,388,000 and $1,345,000 and related deferred product costs of $1,935,000 and $1,330,000, respectively, related to shipments to customers pending acceptances.
Probability of collection is assessed on a customer-by-customer basis. Customers are subjected to a credit review process that evaluates the customers’ financial position and ultimately their ability to pay. If it is determined from the outset of an arrangement that collection is not probable based upon the review process, the customers are required to pay cash in advance of shipment. The Company also makes estimates of the uncollectibility of accounts receivables, analyzing accounts receivable and historical bad debts, customer concentrations, customer-credit-worthiness, current economic trends and changes in customer payment terms to evaluate the adequacy of the allowance for doubtful accounts. On a quarterly basis, the Company evaluates aged items in the accounts receivable aging report and provides an allowance in an amount the Company deems adequate for doubtful accounts. The Company provides for price protection to certain distributors. Management assesses the market competition and product technology obsolescence, and makes price adjustments based on their judgment. Upon each announcement of price reductions, the accrual for price protection is calculated based on the distributors’ inventory on hand. Such reserves are recorded as a reduction to revenue at the time management reduces the product prices.
Cost of Sales
Cost of sales primarily consists of the costs of materials, contract manufacturing, in-bound shipping, personnel and related expenses, equipment and facility expenses, warranty costs and provision for excess and obsolete inventory.
62
Table of Contents
SUPER MICRO COMPUTER, INC.
NOTES TO CONSOLIDATED FINANCIAL STATEMENTS—(Continued)
Product Warranties
The Company provides warranties against any defective products which range from 15 to 39 months. The Company accrues for estimated returns of defective products at the time revenue is recognized, based on historical warranty experience and recent trends. The Company monitors warranty obligations and may make revisions to its warranty reserve if actual costs of product repair and replacement are significantly higher or lower than estimated. Accruals for anticipated future warranty costs are charged to cost of sales and included in accrued liabilities. The Company’s estimates and assumptions used have been historically close to actual. If in future periods, the Company experiences or anticipates an increase or decrease in warranty claims as a result of new product introductions or change in unit volumes compared with its historical experience, or if the cost of servicing warranty claims is greater or lesser than expected, the Company intends to adjust its estimates appropriately. The following table presents for the years ended June 30, 2011, 2010 and 2009, the reconciliation of the changes in accrued warranty costs (in thousands):
| June 30, | ||||||||||||
| 2011 | 2010 | 2009 | ||||||||||
| Balance, beginning of year |
$ | 4,564 | $ | 3,579 | $ | 2,920 | ||||||
| Provision for warranty |
9,606 | 8,473 | 6,703 | |||||||||
| Costs charged to accrual |
(8,518 | ) | (6,629 | ) | (6,299 | ) | ||||||
| Change in estimated liability for pre-existing warranties |
(942 | ) | (859 | ) | 255 | |||||||
|
|
|
|
|
|
|
|||||||
| Balance, end of year |
$ | 4,710 | $ | 4,564 | $ | 3,579 | ||||||
|
|
|
|
|
|
|
|||||||
Software Development Costs
Software development costs are included in research and development and are expensed as incurred. Software development costs are capitalized beginning when technological feasibility has been established and ending when a product is available for general release to customers. To date, the period between achieving technological feasibility and the issuance of such software has been short and software development costs qualifying for capitalization have been insignificant.
Research and Development
Research and development costs are expensed as incurred and consist primarily of salaries, consulting services, other direct expenses and other engineering expenses. The Company occasionally receives funding from certain suppliers and customers towards its development efforts. Such amounts are recorded as a reduction of research and development expenses and were $3,354,000, $2,519,000 and $2,716,000 for the years ended June 30, 2011, 2010 and 2009, respectively.
Cooperative Marketing Arrangements
The Company has arrangements with resellers of its products to reimburse the resellers for cooperative marketing costs meeting specified criteria. The Company accrues the cooperative marketing costs based on these arrangements and our estimate for resellers’ claims for marketing activities. The Company records marketing costs meeting such specified criteria within sales and marketing expenses in the consolidated statements of operations. For those marketing costs that do not meet the specified criteria, the amounts are recorded as a reduction to sales in the consolidated statements of operations.
63
Table of Contents
SUPER MICRO COMPUTER, INC.
NOTES TO CONSOLIDATED FINANCIAL STATEMENTS—(Continued)
Total cooperative marketing costs charged to sales and marketing expenses for the years ended June 30, 2011, 2010 and 2009, were $2,092,000, $1,527,000 and $1,355,000, respectively. Total amounts recorded as reductions to sales for the years ended June 30, 2011, 2010 and 2009, were $2,663,000, $1,725,000 and $1,043,000, respectively.
Advertising Costs
Advertising costs are expensed as incurred. Total advertising and promotional expenses, including cooperative marketing payments, were $3,670,000, $2,038,000 and $1,767,000 for the years ended June 30, 2011, 2010 and 2009, respectively.
Stock-Based Compensation
The Company adopted the fair value recognition provisions effective July 1, 2006 using the prospective transition method, which establishes standards for the accounting for transactions in which an entity exchanges its equity instruments for goods or services, primarily focusing on accounting for transactions where an entity obtains employee services in share-based payment transactions. The Company is required to measure the cost of employee services received in exchange for an award of equity instruments, including stock options, based on the grant-date fair value of the award. That cost will be recognized over the period during which an employee is required to provide services in exchange for the award, known as the requisite service period (usually the vesting period).
Shipping and Handling Fees
The Company incurred shipping costs of $1,046,000, $662,000 and $576,000 for the years ended June 30, 2011, 2010 and 2009, respectively, that were included in sales and marketing expenses.
Income Taxes
The Company accounts for income taxes under an asset and liability approach. Deferred income taxes reflect the impact of temporary differences between assets and liabilities recognized for financial reporting purposes and such amounts recognized for income tax reporting purposes, net operating loss carryforwards and other tax credits measured by applying currently enacted tax laws. Valuation allowances are provided when necessary to reduce deferred tax assets to an amount that is more likely than not to be realized.
Foreign Currency Translation
The functional currency of the Company’s foreign subsidiaries is the U.S. dollar. Accordingly, remeasurement of foreign currency accounts and foreign exchange transaction gains and losses, which have not been material, are reflected in the consolidated statements of operations.
Net Income Per Common Share
The Company’s restricted share awards subject to repurchase and settled in shares of common stock upon vesting have the nonforfeitable right to receive dividends on an equal basis with common stock and therefore are considered participating securities that must be included in the calculation of net income per share using the two-class method. Under the two-class method, basic and diluted net income per common share is determined by calculating net income per share for common stock and participating securities based on participation rights in undistributed earnings. Diluted net income per common share also considers the dilutive effect of in-the-money
64
Table of Contents
SUPER MICRO COMPUTER, INC.
NOTES TO CONSOLIDATED FINANCIAL STATEMENTS—(Continued)
stock options, calculated using the treasury stock method. Under the treasury stock method, the amount of assumed proceeds from unexercised stock options includes the amount of compensation cost attributable to future services not yet recognized, assumed proceeds from the exercise of the options, and the incremental income tax benefit or liability as if the options were exercised during the period.
The computation of basic and diluted net income per common share using the two-class method is as follows (in thousands, except per share amounts):
| Years Ended June 30, | ||||||||||||
| 2011 | 2010 | 2009 | ||||||||||
| Basic net income per common share calculation |
||||||||||||
| Net income |
$ | 40,213 | $ | 26,915 | $ | 16,107 | ||||||
| Less: Undistributed earnings allocated to participating securities |
(645 | ) | (686 | ) | (424 | ) | ||||||
|
|
|
|
|
|
|
|||||||
| Net income attributable to common shares—basic |
$ | 39,568 | $ | 26,229 | $ | 15,683 | ||||||
|
|
|
|
|
|
|
|||||||
| Weighted-average number of common shares used to compute basic net income per common share |
38,132 | 35,884 | 34,218 | |||||||||
|
|
|
|
|
|
|
|||||||
| Basic net income per common share |
$ | 1.04 | $ | 0.73 | $ | 0.46 | ||||||
|
|
|
|
|
|
|
|||||||
| Diluted net income per common share calculation |
||||||||||||
| Net income |
$ | 40,213 | $ | 26,915 | $ | 16,107 | ||||||
| Less: Undistributed earnings allocated to participating securities |
(581 | ) | (606 | ) | (377 | ) | ||||||
|
|
|
|
|
|
|
|||||||
| Net income attributable to common shares—diluted |
$ | 39,632 | $ | 26,309 | $ | 15,730 | ||||||
|
|
|
|
|
|
|
|||||||
| Weighted-average number of common shares used to compute basic net income per common share |
38,132 | 35,884 | 34,218 | |||||||||
| Dilutive effect of options to purchase common stock |
4,264 | 4,851 | 4,378 | |||||||||
|
|
|
|
|
|
|
|||||||
| Weighted-average number of common shares used to compute diluted net income per common share |
42,396 | 40,735 | 38,596 | |||||||||
|
|
|
|
|
|
|
|||||||
| Diluted net income per common share |
$ | 0.93 | $ | 0.65 | $ | 0.41 | ||||||
|
|
|
|
|
|
|
|||||||
For the years ended June 30, 2011, 2010 and 2009, the Company had stock options outstanding that could potentially dilute basic earnings per share in the future, but were excluded from the computation of diluted net income per share in the periods presented, as their effect would have been anti-dilutive. The shares of common stock issuable upon exercise of such anti-dilutive outstanding stock options were 3,391,000, 2,093,000 and 4,679,000 for the years ended June 30, 2011, 2010 and 2009, respectively.
Comprehensive Income
Comprehensive income, as defined, includes all changes in equity during a period from non-owner sources. Accumulated other comprehensive loss at June 30, 2011, 2010 and 2009 is comprised solely of unrealized losses on investments, net of taxes. The components of comprehensive income, net of taxes, are as follows (in thousands):
| Years Ended June 30, | ||||||||||||
| 2011 | 2010 | 2009 | ||||||||||
| Net income |
$ | 40,213 | $ | 26,915 | $ | 16,107 | ||||||
| Unrealized gains or (losses) on investments, net of taxes |
— | 597 | (350 | ) | ||||||||
|
|
|
|
|
|
|
|||||||
| Total comprehensive income |
$ | 40,213 | $ | 27,512 | $ | 15,757 | ||||||
|
|
|
|
|
|
|
|||||||
65
Table of Contents
SUPER MICRO COMPUTER, INC.
NOTES TO CONSOLIDATED FINANCIAL STATEMENTS—(Continued)
Certain Significant Risks and Uncertainties
The Company operates in the high technology industry and is subject to a number of risks, some of which are beyond the Company’s control, that could have a material adverse effect on the Company’s business, operating results, and financial condition. These risks include variability and uncertainty of revenues and operating results; product obsolescence; geographic concentration; international operations; dependence on key personnel; competition; intellectual property claims and litigation; management of growth; and limited sources of supply.
Concentration of Supplier Risk
Certain of the raw materials used by the Company in the manufacture of its products are available from a limited number of suppliers. Shortages could occur in these essential materials due to an interruption of supply or increased demand in the industry. Two suppliers accounted for 13.2% and 20.4%, 14.6% and 20.4%, and 22.5% and 23.6%, of total purchases for the years ended June 30, 2011, 2010 and 2009, respectively.
Fair Value of Financial Instruments
Cash equivalents, accounts receivable and accounts payable are carried at cost, which approximates fair value due to the short maturity of these instruments. Short-term and long-term investments are carried at fair value. Short-term and long-term debts are carried at amortized cost, which approximates its fair value based on borrowing rates currently available to the Company for loans with similar terms.
Concentration of Credit Risk
Financial instruments which potentially subject the Company to concentration of credit risk consist primarily of cash and cash equivalents, short-term and long-term investments and accounts receivable. Deposits may exceed the amount of insurance provided on such deposits. No single customer accounted for 10% or more of net sales in fiscal years 2011, 2010 and 2009. No customer accounted for 10% or more of accounts receivable as of June 30, 2011 and one customer accounted for 10.2% of the Company’s accounts receivable as of June 30, 2010.
Recent Accounting Pronouncements
In June 2009, the Financial Accounting Standards Board (“FASB”) issued authoritative guidance on the consolidation of variable interest entities, which is effective for fiscal years beginning after November 15, 2009 and interim periods therein and thereafter. The new guidance requires revised evaluations of whether entities represent variable interest entities, ongoing assessments of control over such entities, and additional disclosures for variable interests. This accounting guidance was effective for the Company beginning in the first quarter of fiscal year 2011. The adoption of this standard did not have a material impact on the Company’s consolidated financial position and results of operations.
In May 2011, the FASB issued additional guidance on fair value measurements that clarifies the application of existing guidance and disclosure requirements, changes certain fair value measurement principles and requires additional disclosures about fair value measurements. The updated guidance is effective on a prospective basis for financial statements issued for fiscal years, and interim periods within those fiscal years, beginning after December 15, 2011. The adoption of this guidance will not have a material impact on the Company’s consolidated financial position and results of operations.
66
Table of Contents
SUPER MICRO COMPUTER, INC.
NOTES TO CONSOLIDATED FINANCIAL STATEMENTS—(Continued)
In June 2011, the FASB issued guidance regarding the presentation of comprehensive income. The new standard requires the presentation of comprehensive income, the components of net income and the components of other comprehensive income either in a single continuous statement of comprehensive income or in two separate but consecutive statements. The new standard also requires presentation of adjustments for items that are reclassified from other comprehensive income to net income in the statement where the components of net income and the components of other comprehensive income are presented. The updated guidance is effective on a retrospective basis for financial statements issued for fiscal years, and interim periods within those fiscal years, beginning after December 15, 2011. The adoption of this guidance will not have a material impact on the Company’s consolidated financial position and results of operations.
| Note 3. | Fair Value Disclosure |
The financial assets of the Company measured at fair value on a recurring basis are cash equivalents, short-term and long-term investments. The Company’s money market funds are classified within Level 1 of the fair value hierarchy which is based on quoted market prices of the identical underlying securities in active markets. The Company’s short-term and long-term auction rate securities investments are classified within Level 3 of the fair value hierarchy which did not have observable inputs for its auction rate securities as of June 30, 2011 and 2010. Refer to Note 2 of Notes to Consolidated Financial Statements for a discussion of the Company’s policies regarding the fair value hierarchy. The Company’s methodology for valuing these investments is the discounted cash flow model and is described in Note 6 of Notes to Consolidated Financial Statements.
The following table sets forth the Company’s cash equivalents, short-term and long-term investments as of June 30, 2011 and 2010 which are measured at fair value on a recurring basis by level within the fair value hierarchy. These are classified based on the lowest level of input that is significant to the fair value measurement, (in thousands):
| June 30, 2011 |
Level 1 | Level 2 | Level 3 | Asset at Fair Value |
||||||||||||
| Money market funds |
$ | 4,287 | $ | — | $ | — | $ | 4,287 | ||||||||
| Auction rate securities |
— | — | 5,188 | 5,188 | ||||||||||||
|
|
|
|
|
|
|
|
|
|||||||||
| Total |
$ | 4,287 | $ | — | $ | 5,188 | $ | 9,475 | ||||||||
|
|
|
|
|
|
|
|
|
|||||||||
| June 30, 2010 |
Level 1 | Level 2 | Level 3 | Asset at Fair Value |
||||||||||||
| Money market funds |
$ | 29,646 | $ | — | $ | — | $ | 29,646 | ||||||||
| Auction rate securities |
— | — | 6,688 | 6,688 | ||||||||||||
|
|
|
|
|
|
|
|
|
|||||||||
| Total |
$ | 29,646 | $ | — | $ | 6,688 | $ | 36,334 | ||||||||
|
|
|
|
|
|
|
|
|
|||||||||
The above table excludes $65,656,000 and $42,997,000 of cash and $468,000 and $345,000 of certificates of deposit held by the Company as of June 30, 2011 and 2010, respectively.
The Company’s Level 3 assets consist of short-term and long-term auction rate securities for which the Company used a discounted cash flow model to value these investments (See Note 6).
67
Table of Contents
SUPER MICRO COMPUTER, INC.
NOTES TO CONSOLIDATED FINANCIAL STATEMENTS—(Continued)
The following table provides a reconciliation of the Company’s financial assets measured at fair value on a recurring basis, consisting of long-term auction rate securities, using significant unobservable inputs (Level 3) for fiscal year 2011 and 2010 (in thousands):
| June 30, | ||||||||
| 2011 | 2010 | |||||||
| Balance as of beginning of period |
$ | 6,688 | $ | 14,644 | ||||
| Total realized gains or (losses) included in net income |
— | — | ||||||
| Total unrealized gains or (losses) included in other comprehensive income |
— | 984 | ||||||
| Sales and settlements at par |
(1,500 | ) | (8,940 | ) | ||||
| Transfers in and/or out of Level 3 |
— | — | ||||||
|
|
|
|
|
|||||
| Balance as of end of year |
$ | 5,188 | $ | 6,688 | ||||
|
|
|
|
|
|||||
The following is a summary of the Company’s short-term investments as of June 30, 2011 and 2010 (in thousands):
| June 30, 2011 | ||||||||||||||||
| Amortized Cost |
Gross Unrealized Holding Gains |
Gross Unrealized Holding Losses |
Fair Value | |||||||||||||
| Certificate of deposit |
$ | 59 | $ | — | $ | — | $ | 59 | ||||||||
|
|
|
|
|
|
|
|
|
|||||||||
| Total |
$ | 59 | $ | — | $ | — | $ | 59 | ||||||||
|
|
|
|
|
|
|
|
|
|||||||||
| June 30, 2010 | ||||||||||||||||
| Amortized Cost |
Gross Unrealized Holding Gains |
Gross Unrealized Holding Losses |
Fair Value | |||||||||||||
| Certificate of deposit |
$ | 58 | $ | — | $ | — | $ | 58 | ||||||||
| Auction rate securities |
800 | — | (13 | ) | 787 | |||||||||||
|
|
|
|
|
|
|
|
|
|||||||||
| Total |
$ | 858 | $ | — | $ | (13 | ) | $ | 845 | |||||||
|
|
|
|
|
|
|
|
|
|||||||||
The following is a summary of the Company’s long-term investments as of June 30, 2011 and 2010 (in thousands):
| June 30, 2011 | ||||||||||||||||
| Amortized Cost |
Gross Unrealized Holding Gains |
Gross Unrealized Holding Losses |
Fair Value | |||||||||||||
| Auction rate securities |
$ | 5,525 | $ | — | $ | (337 | ) | $ | 5,188 | |||||||
| June 30, 2010 | ||||||||||||||||
| Amortized Cost |
Gross Unrealized Holding Gains |
Gross Unrealized Holding Losses |
Fair Value | |||||||||||||
| Auction rate securities |
$ | 6,225 | $ | — | $ | (324 | ) | $ | 5,901 | |||||||
68
Table of Contents
SUPER MICRO COMPUTER, INC.
NOTES TO CONSOLIDATED FINANCIAL STATEMENTS—(Continued)
The Company measures the fair value of outstanding debts for disclosure purposes on a recurring basis. As of June 30, 2010, its short-term debt of $18,553,000 is reported at amortized cost. As of June 30, 2011, its current and non-current long-term debt of $28,151,000 is reported at amortized cost. The fair value of the outstanding debts is based on borrowing rates currently available to the Company for loans with similar terms, and approximates amortized cost.
| Note 4. | Accounts Receivable Allowances |
The Company establishes an allowance for doubtful accounts and an allowance for sales returns. The allowance for doubtful accounts is based upon the credit risk of specific customers, historical trends related to past losses and other relevant factors. The Company also provides its customers with product return rights. A provision for such returns is provided for in the same period that the related sales are recorded based upon contractual return rights and historical trends. Accounts receivable allowances as of June 30, 2011, 2010 and 2009, consisted of the following (in thousands):
| Beginning Balance |
Charged to Cost and Expenses |
Deductions | Ending Balance |
|||||||||||||
| Allowance for doubtful accounts: |
||||||||||||||||
| Year ended June 30, 2011 |
$ | 842 | $ | 499 | $ | (603 | ) | $ | 738 | |||||||
| Year ended June 30, 2010 |
671 | 772 | (601 | ) | 842 | |||||||||||
| Year ended June 30, 2009 |
601 | 299 | (229 | ) | 671 | |||||||||||
| Allowance for sales returns |
||||||||||||||||
| Year ended June 30, 2011 |
$ | 368 | $ | 6,624 | $ | (6,668 | ) | $ | 324 | |||||||
| Year ended June 30, 2010 |
397 | 5,310 | (5,339 | ) | 368 | |||||||||||
| Year ended June 30, 2009 |
572 | 4,248 | (4,423 | ) | 397 | |||||||||||
| Note 5. | Inventory |
Inventory as of June 30, 2011 and 2010 consisted of the following (in thousands):
| June 30, | ||||||||
| 2011 | 2010 | |||||||
| Finished goods |
$ | 134,990 | $ | 88,392 | ||||
| Work in process |
9,540 | 8,540 | ||||||
| Purchased parts and raw materials |
48,181 | 38,652 | ||||||
|
|
|
|
|
|||||
| Total inventory, net |
$ | 192,711 | $ | 135,584 | ||||
|
|
|
|
|
|||||
| Note 6. | Short-term and Long-term Investments |
As of June 30, 2011 and 2010, the Company held $5,188,000 and $6,688,000, respectively, of auction-rate securities (“auction rate securities”), net of unrealized losses, representing its interest in auction rate preferred shares in a closed end mutual fund invested in municipal securities and student loans guaranteed by the Federal Family Education Loan Program; such auction rate securities were rated AAA or BAA at June 30, 2011 and AAA or BAA3 at June 30, 2010. These auction rate preferred shares have no stated maturity date and the stated maturity dates for these auction rate student loans range from 2035 to 2040.
During February 2008, the auctions for these auction rate securities began to fail to obtain sufficient bids to establish a clearing rate and the securities were not saleable in the auction, thereby losing the short-term liquidity
69
Table of Contents
SUPER MICRO COMPUTER, INC.
NOTES TO CONSOLIDATED FINANCIAL STATEMENTS—(Continued)
previously provided by the auction process. As a result, as of June 30, 2011, $5,188,000 of these auction rate securities have been classified as long-term available-for-sale investments. As of June 30, 2010, $5,901,000 of these auction rate securities have been classified as long-term available-for-sales investments and the remaining $787,000 have been classified as short-term available-for-sale investments
The Company has used a discounted cash flow model to estimate the fair value of the auction rate securities as of June 30, 2011 and 2010. The material factors used in preparing the discounted cash flow model are 1) the discount rate utilized to present value the cash flows, 2) the time period until redemption and 3) the estimated rate of return. Management derives the estimates by obtaining input from market data on the applicable discount rate, estimated time to maturity and estimated rate of return. The changes in fair value have been primarily due to changes in the estimated rate of return and a change in the estimated redemption period. Changes in these estimates or in the market conditions for these investments are likely in the future based upon the then current market conditions for these investments and may affect the fair value of these investments. Based on this assessment of fair value, the Company determined there was no change in fair value of its auction rate securities during the year ended June 30, 2011, and a recovery in fair value of its auction rate securities of $984,000 during the year ended June 30, 2010, respectively, and a cumulative total decline of $337,000 and $324,000 as of June 30, 2011 and 2010, respectively. That amount has been recorded as a component of other comprehensive income. As of June 30, 2011 and 2010, the Company has recorded an accumulated unrealized loss of $204,000, net of deferred income taxes, on both long-term and short-term auction rate securities. The Company deems this loss to be temporary as it will not likely be required to sell the securities before their anticipated recovery and the Company has the intent and financial ability to hold these investments until recovery of cost.
Although the investment impairment is considered to be temporary, these investments are not currently liquid and in the event the Company needs to access these funds, the Company will not be able to do so without a loss of principal. The Company plans to continue to monitor the liquidity situation in the marketplace and the creditworthiness of its holdings and will perform periodic impairment analysis. In fiscal year 2011, 2010 and 2009, $1,500,000, $8,940,000 and $885,000 of these auction rate securities were redeemed at par, respectively.
| Note 7. | Property, Plant and Equipment |
Property, plant and equipment as of June 30, 2011 and 2010 consisted of the following (in thousands):
| June 30, | ||||||||
| 2011 | 2010 | |||||||
| Land |
$ | 35,334 | $ | 27,186 | ||||
| Buildings |
28,071 | 29,645 | ||||||
| Building and leasehold improvements |
3,540 | 3,335 | ||||||
| Buildings construction in progress |
4,608 | |||||||
| Machinery and equipment |
17,071 | 12,689 | ||||||
| Furniture and fixtures |
3,554 | 2,882 | ||||||
| Purchased Software |
2,540 | 2,107 | ||||||
|
|
|
|
|
|||||
| 94,718 | 77,844 | |||||||
| Accumulated depreciation and amortization |
(20,280 | ) | (15,153 | ) | ||||
|
|
|
|
|
|||||
| Property, plant and equipment, net |
$ | 74,438 | $ | 62,691 | ||||
|
|
|
|
|
|||||
70
Table of Contents
SUPER MICRO COMPUTER, INC.
NOTES TO CONSOLIDATED FINANCIAL STATEMENTS—(Continued)
In June 2010, the Company purchased three buildings in San Jose, California. The preliminary value allocated to the land and buildings were $7,966,000 and $10,537,000, respectively, as of June 30, 2010 which were subject to the completion of cost segregation study. Based on the cost segregation study completed in September 2010, the purchase values allocated to the land and buildings were $9,540,000 and $8,963,000, respectively. In August 2010, the Company purchased land in Taiwan, consisting of approximately 4.7 acres. The purchase price is $6,137,000 and the Company is developing the land for manufacturing and service operations through fiscal year 2012.
| Note 8. | Advances from Receivable Financing Arrangements |
The Company has accounts receivable financing agreements with certain financing companies whereby the financing companies pay the Company for sales transactions that have been pre-approved by these financing companies. The financing company then collects the receivable from the customer. For the years ended June 30, 2011, 2010 and 2009, such sales transactions totaled $25,011,000, $26,690,000 and $22,422,000, respectively. At June 30, 2011 and 2010, $1,000,000 and $1,193,000, respectively, remained uncollected from customers subject to these arrangements. Such amounts have been recorded as advances from receivable financing arrangements as the Company has obligations to repurchase inventories seized by the financing companies from defaulting customers. Historically, the Company has not been required to repurchase inventories from the financing companies. These financing arrangements bear interest at rates ranging from 11.40% to 13.80% and 11.70% to 13.80% per annum, depending on the customers’ credit ratings, at June 30, 2011 and 2010, respectively.
| Note 9. | Short-term and Long-term Obligations |
Short-term and long-term obligations as of June 30, 2011 and 2010 consisted of the following (in thousands):
| June 30, | ||||||||
| 2011 | 2010 | |||||||
| Line of credit |
$ | 14,554 | $ | 18,553 | ||||
| Building loans |
13,597 | — | ||||||
| Capital leases |
86 | 108 | ||||||
|
|
|
|
|
|||||
| Total |
28,237 | 18,661 | ||||||
| Current portion |
(591 | ) | (18,615 | ) | ||||
|
|
|
|
|
|||||
| Long-term portion |
$ | 27,646 | $ | 46 | ||||
|
|
|
|
|
|||||
In June 2010, the Company obtained a revolving line of credit totaling $25,000,000 that matures on June 15, 2013 with an interest rate at the LIBOR rate plus 1.50% per annum. The Company used $18,553,000 of the line of credit to purchase three buildings in San Jose, California and was required to obtain a mortgage loan to pay-off this line of credit by December 2010. The loan is secured by all the Company’s assets except for the three buildings purchased in San Jose, California. In December 2010, the Company repaid $13,854,000 of the line of credit by obtaining a new term loan from another bank for $13,875,000 and the remaining $4,699,000 of the line of credit has been extended to be paid-off by June 15, 2013. The term loan is secured by the three buildings purchased in San Jose, California in June 2010 and the principal and interest are payable monthly through October 1, 2013 with an interest rate at the LIBOR rate plus 1.75% per annum. The LIBOR rate was 0.19% at June 30, 2011.
In March 2011, the Company drew an additional $9,855,000 from the line of credit with an interest rate equal to the lender’s established interest rate which is adjusted monthly and paid $9,195,000 for a deposit to
71
Table of Contents
SUPER MICRO COMPUTER, INC.
NOTES TO CONSOLIDATED FINANCIAL STATEMENTS—(Continued)
purchase land in Taiwan that is adjacent to the land that was purchased in August 2010. The title to the land in Taiwan is expected to transfer in the quarter ending September 30, 2011. The interest rate was 1.64% at June 30, 2011. As of June 30, 2011 and 2010, the total outstanding borrowings under these loans were $28,151,000 and $18,553,000, respectively. As of June 30, 2011, the unused revolving line of credit was $10,446,000. As of June 30, 2011, the Company was not in compliance with the investment covenant associated with these loans; however, it obtained waivers as of June 30, 2011 from the lenders in August 2011 regarding such non-compliance.
As of June 30, 2011 and 2010, the total assets except for the three buildings purchased in San Jose, California in June 2010 collateralizing the line of credit were $446,347,000 and $352,259,000, respectively. As of June 30, 2011, the gross cost and net book value of the land, building and related improvements collateralizing the term loan were $18,503,000 and $18,273,000, respectively.
The following table as of June 30, 2011, summarizes future minimum principal payments on the Company’s debts excluding capital leases (in thousands):
| Fiscal Years Ending June 30, |
||||
| 2012 |
$ | 555 | ||
| 2013 |
15,109 | |||
| 2014 |
12,487 | |||
| 2015 |
— | |||
| 2016 |
— | |||
| Thereafter |
— | |||
|
|
|
|||
| Total |
$ | 28,151 | ||
|
|
|
|||
Note 10. Related-party and Other Transactions
Ablecom Technology Inc.—Ablecom, a Taiwan corporation, together with one of its subsidiaries, Compuware (collectively “Ablecom”), is one of the Company’s major contract manufacturers. Ablecom’s ownership of Compuware is below 50% but Compuware remains a related party as Ablecom still has significant influence over the operations. Ablecom’s chief executive officer, Steve Liang, is the brother of Charles Liang, the Company’s President, Chief Executive Officer and Chairman of the Board of Directors, and owns approximately 1.1% of the Company’s common stock. Charles Liang and his wife, also an officer of the Company, collectively own approximately 10.5% of Ablecom , while Steve Liang and other family members own approximately 35.9% of Ablecom at June 30, 2011 and 2010.
The Company has product design and manufacturing services agreements (“product design and manufacturing agreements”) and a distribution agreement (“distribution agreement”) with Ablecom.
Under the product design and manufacturing agreements, the Company outsources a portion of its design activities and a significant part of its manufacturing of components such as server chassis to Ablecom. Ablecom agrees to design products according to the Company’s specifications. Additionally, Ablecom agrees to build the tools needed to manufacture the products. Under the product design and manufacturing agreements, the Company commits to purchase a minimum quantity over a set period. The purchase price of the products manufactured by Ablecom is negotiated on a purchase order by purchase order basis at each purchase date. However, a fixed charge is added to the price of each unit purchased until the agreed minimum number of units is purchased. In August 2007, the Company entered into a new product development, manufacturing and service
72
Table of Contents
SUPER MICRO COMPUTER, INC.
NOTES TO CONSOLIDATED FINANCIAL STATEMENTS—(Continued)
agreement with Ablecom. Under the new agreement, the Company has agreed to pay for the cost of blade server tooling and engineering services and will pay for those items when the work has been completed. In this case no fixed charge is added to future purchases for reimbursement of tooling costs. In September 2009, the Company entered into a similar product development agreement with Ablecom. Under this agreement, the Company has agreed to pay for the cost of chassis and related product tooling and engineering services and will pay for those items when the work has been completed. In this case no fixed charge is added to future purchases for reimbursement of tooling costs.
Under the distribution agreement, Ablecom purchases server products from the Company for distribution in Taiwan. The Company believes that the pricing and terms under the distribution agreement are similar to the pricing and terms of distribution arrangements the Company has with similar, third party distributors.
Ablecom’s net sales to the Company and its net sales of the Company’s products to others comprise a substantial majority of Ablecom’s net sales. For fiscal year 2011, 2010 and 2009, the Company purchased products from Ablecom totaling $155,430,000, $124,466,000 and $91,954,000. For fiscal year 2011, 2010 and 2009, the Company sold products to Ablecom totaling $11,017,000, $10,190,000 and $6,025,000, respectively.
Amounts owed to the Company by Ablecom as of June 30, 2011 and 2010, were $527,000 and $1,201,000, respectively. Amounts owed to Ablecom by the Company as of June 30, 2011 and 2010, were $34,210,000 and $19,464,000, respectively. Historically, the Company has paid Ablecom the majority of invoiced dollars between 53 and 100 days of invoice. For the years ended June 30, 2011, 2010 and 2009, the Company received $55,000, $164,000 and $2,000, respectively, from Ablecom for penalty charges and paid $4,052,000 $3,352,000 and $2,918,000, respectively, in tooling assets and miscellaneous costs to Ablecom. Penalty charges are assessments relating to delayed deliveries or quality issues.
The Company’s exposure to loss as a result of its involvement with Ablecom is limited to (a) potential losses on its purchase orders in the event of an unforeseen decline in the market price and/or demand of the Company’s products such that the Company incurs a loss on the sale or cannot sell the products and (b) potential losses on outstanding accounts receivable from Ablecom in the event of an unforeseen deterioration in the financial condition of Ablecom such that Ablecom defaults on its payable to the Company. Outstanding purchase orders with Ablecom were $38,326,000 and $35,266,0000 at June 30, 2011 and 2010, respectively, representing the maximum exposure to loss relating to (a) above. The Company does not have any direct or indirect guarantees of losses of Ablecom.
In fiscal year 2011, Ablecom paid for a land deposit in Taiwan on behalf of the Company in the amount of $4,510,000 which the Company repaid Ablecom in March 2011. The amount paid to Ablecom of $4,510,000 represented Ablecom’s cost and the fair market value of the land.
Note 11. Stock-based Compensation and Stockholders’ Equity
Treasury Stock
In November 2008, the Board of Directors approved a program to repurchase, from time to time, at management’s discretion, shares of the Company’s common stock. Under the plan, the Company was authorized to repurchase up to 2,000,000 of its outstanding shares of common stock in the open market or in private transactions during the period ended June 30, 2009 at prevailing market prices in compliance with applicable securities laws and other legal requirements. Repurchases were made under the program using the Company’s own cash resources. The plan did not obligate the Company to acquire any particular amount of common stock and the plan could be suspended or discontinued at any time. As of June 30, 2011 and 2010, the Company had repurchased 445,028 shares of the Company’s common stock at a weighted average price of $4.56 per share for $2,030,000.
73
Table of Contents
SUPER MICRO COMPUTER, INC.
NOTES TO CONSOLIDATED FINANCIAL STATEMENTS—(Continued)
Repurchased shares of the Company’s common stock are held as treasury shares until they are reissued or retired. When the Company reissues treasury stock, if the proceeds from the sale are more than the average price the Company paid to acquire the shares, the Company records an increase in additional paid-in capital. Conversely, if the proceeds from the sale are less than the average price the Company paid to acquire the shares, the Company records a decrease in additional paid-in capital to the extent of increases previously recorded for similar transactions and a decrease in retained earnings for any remaining amount.
Stock Option Plans
The 1998 Stock Option Plan (the “1998 Plan”) authorized the Board of Directors to grant options to employees, directors and consultants to purchase shares of the Company’s common stock. The 2,661,988 remaining shares of common stock reserved for issuance under the 1998 Plan were cancelled upon the completion of the Company’s IPO.
In August 2006, the Board of Directors approved the 2006 Equity Incentive Plan (the “2006 Plan”) and reserved for issuance 4,000,000 shares of common stock for the granting of stock options, stock appreciation rights, restricted stock awards, restricted stock units and other equity-based awards. The number of shares reserved automatically increases on July 1 of each year through 2016, by an amount equal to the smaller of (a) three percent of the number of shares of stock issued and outstanding on the immediately preceding June 30, or (b) a lesser amount determined by the Board of Directors. The 2006 Plan was approved by the stockholders of the Company on January 8, 2007. The exercise price per share for options granted to employees and consultants owning shares representing more than 10% of the Company at the time of grant cannot be less than 110% of the fair value. Incentive and nonqualified stock options granted to all other persons shall be granted at a price not less than 100% of the fair value. Options generally expire ten years after the date of grant and options vest over four years; 25% at the end of one year and one sixteenth per quarter thereafter. In fiscal years 2011, 2010 and 2009, the Company granted 2,172,920, 1,581,230 and 3,442,652 options under the 2006 Plan, respectively. At June 30, 2011, 1,714,290 shares of common stock are available for future grant.
Outside the Stock Option Plans
In fiscal year 2001, the Company granted 1,480,000 non-statutory stock options to key officers of the Company outside of the 1998 Stock Option Plan. These options, which the Company has reserved for separately, were granted at an exercise price of $1.25 per share, which was the estimated fair value at the date of grant and are now fully vested.
In fiscal year 2003, the Company granted 200,000 non-statutory stock options to an officer of the Company outside the 1998 Stock Option Plan. This option, which the Company has reserved for separately, was granted at an exercise price of $1.25 per share, which was the estimated fair value at the date of grant and are now fully vested.
In fiscal year 2006, the Company granted 64,800 non-statutory stock options to an officer of the Company outside the 1998 Stock Option Plan. This option, which the Company has reserved for separately, was granted at an exercise price of $3.50 per share, which was the estimated fair value at the date of grant and are now fully vested.
Restricted Stock Awards
Restricted stock awards are share awards that provide the rights to a set number of shares of the Company’s stock on the grant date. In August 2008, the Compensation Committee of the Board of Directors of the Company (the “Committee”) approved the terms of an agreement (the “Option Exercise Agreement”) with Charles Liang, a director and President and Chief Executive Officer of the Company, pursuant to which Mr. Liang exercised a
74
Table of Contents
SUPER MICRO COMPUTER, INC.
NOTES TO CONSOLIDATED FINANCIAL STATEMENTS—(Continued)
fully vested option previously granted to him for the purchase of 925,000 shares. The option was exercised using a “net-exercise” procedure in which he was issued a number of shares representing the spread between the option exercise price and the then current market value of the shares subject to the option (898,205 shares based upon the market value as of the date of exercise). The shares issued upon exercise of the option are subject to vesting over a five-year vesting period. Vesting of the shares subject to the award may accelerate in certain circumstances pursuant to the terms of the Option Exercise Agreement. The Company determined that there is no incremental fair value of the option exchanged for the award. 359,282 and 179,641 shares were vested as of June 30, 2011 and 2010, respectively.
In November 2008, the Committee approved the terms of an Option Exercise Agreement with Chiu-Chu Liang, a director and Vice President of Operations & Treasurer of the Company and Shiow-Meei Liaw, Senior Warehouse Manager of the Company, pursuant to which they exercised fully vested options previously granted to them for the purchase of 185,263 and 92,631 shares, respectively. They exercised the options using a “net-exercise” procedure in which they were issued a number of shares representing the spread between the option exercise price and the then current market value of the shares subject to the option (182,611 and 91,305 shares, respectively, based upon the market value as of the date of exercise). The shares issued upon exercise of the options are subject to vesting over a two-year vesting period. Vesting of the shares subject to the awards may accelerate in certain circumstances pursuant to the terms of the applicable Option Exercise Agreement. The Company determined that there is no incremental fair value of the option exchanged for the awards. The awards were fully vested as of June 30, 2011 and 136,957 shares were vested as of June 30, 2010.
Determining Fair Value
Valuation and amortization method—The Company estimates the fair value of stock options granted using the Black-Scholes-option-pricing formula and a single option award approach. This fair value is then amortized ratably over the requisite service periods of the awards, which is generally the vesting period.
Expected Term—The Company’s expected term represents the period that the Company’s stock-based awards are expected to be outstanding and was determined based on an analysis of the relevant peer companies’ post-vest termination rates and the exercise factors.
Expected Volatility—Expected volatility is based on a combination of the implied and historical volatility for its peer group and the Company’s historical volatility for the stock options granted prior to September 30, 2009. For stock options granted after September 30, 2009, expected volatility is based solely on the Company’s historical volatility.
Expected Dividend—The Black-Scholes valuation model calls for a single expected dividend yield as an input and the Company has no plans to pay dividends.
Risk-Free Interest Rate—The risk-free interest rate used in the Black-Scholes valuation method is based on the U.S. Treasury zero coupon issues in effect at the time of grant for periods corresponding with the expected term of option.
Estimated Forfeitures—The estimated forfeiture rate is based on the Company’s historical forfeiture rates and the estimate is revised in subsequent periods if actual forfeitures differ from the estimate.
75
Table of Contents
SUPER MICRO COMPUTER, INC.
NOTES TO CONSOLIDATED FINANCIAL STATEMENTS—(Continued)
The fair value of stock option grants for the years ended June 30, 2011, 2010 and 2009 was estimated on the date of grant using the Black-Scholes option pricing model with the following assumptions:
| Years Ended June 30, | ||||||||||||
| 2011 | 2010 | 2009 | ||||||||||
| Risk-free interest rate |
1.01% – 2.12% | 1.88% – 2.28% | 1.42% – 3.09% | |||||||||
| Expected life |
4.33 – 4.45 years | 4.06 – 4.32 years | 4.06 – 10 years | |||||||||
| Dividend yield |
0% | 0% | 0% | |||||||||
| Volatility |
54.50% – 57.02% | 51.88% – 55.01% | 48.16% – 69.62% | |||||||||
| Weighted-average fair value |
$6.43 | $5.34 | $2.87 | |||||||||
In March 2009, the Committee approved the grant of an option to purchase 720,000 shares to Charles Liang, a director and President and Chief Executive Officer of the Company. This option, which vests ratably over four years, was granted at an exercise price of $10.66 per share with a grant date fair market value of $4.96 per share. The fair value of this option was estimated at the date of grant using the Black-Scholes option pricing model with the following assumptions: risk-free interest rate of 3.01%, expected life of 10 years, expected dividend yield of zero and expected volatility of 69.62%, resulting in a fair value of $3.28 per share.
The following table shows total stock-based compensation expense included in the consolidated statements of operations for the years ended June 30, 2011, 2010 and 2009 (in thousands).
| Years Ended June 30, | ||||||||||||
| 2011 | 2010 | 2009 | ||||||||||
| Cost of sales |
$ | 812 | $ | 573 | $ | 578 | ||||||
| Research and development |
4,077 | 3,106 | 2,608 | |||||||||
| Sales and marketing |
1,077 | 880 | 826 | |||||||||
| General and administrative |
2,090 | 1,898 | 1,649 | |||||||||
|
|
|
|
|
|
|
|||||||
| Stock-based compensation expense before taxes |
8,056 | 6,457 | 5,661 | |||||||||
| Income tax impact |
(1,412 | ) | (1,052 | ) | (570 | ) | ||||||
|
|
|
|
|
|
|
|||||||
| Stock-based compensation expense, net |
$ | 6,644 | $ | 5,405 | $ | 5,091 | ||||||
|
|
|
|
|
|
|
|||||||
The cash flows resulting from the tax benefits for tax deductions resulting from the exercise of stock options in excess of the compensation expense recorded for those options (excess tax benefits) issued or modified since July 1, 2006 are classified as cash from financing activities. Excess tax benefits for stock options issued prior to July 1, 2006 are classified as cash from operating activities. The Company had $12,440,000, $5,759,000 and $5,306,000 of excess tax benefits accounted in the Company’s additional paid-in capital in the year ended June 30, 2011, 2010 and 2009, respectively. The Company had excess tax benefits that are classified as cash from financing activities of $2,401,000 and $1,484,000 in the year ended June 30, 2011 and 2010, respectively, and had no amount in the year ended June 30, 2009 for options issued since July 1, 2006. Excess tax benefits for stock options issued prior to July 1, 2006 continue to be classified as cash from operating activities.
76
Table of Contents
SUPER MICRO COMPUTER, INC.
NOTES TO CONSOLIDATED FINANCIAL STATEMENTS—(Continued)
Stock Option Activity
The following table summarizes stock option activity during the years ended June 30, 2011, 2010 and 2009 under all stock option plans:
| Options Available for Grant |
Options Outstanding |
Weighted Average Exercise Price per Share |
Weighted Average Remaining Contractual Term (in Years) |
Aggregate Intrinsic Value (in thousands) |
||||||||||||||||
| Balance as of July 1, 2008 (10,639,860 shares exercisable at weighted average exercise price of $2.23 per share) |
3,106,747 | 13,300,972 | $ | 3.48 | ||||||||||||||||
| Authorized |
980,062 | — | ||||||||||||||||||
| Granted (weighted average fair value of $2.87) |
(3,442,652 | ) | 3,442,652 | 7.05 | ||||||||||||||||
| Exercised |
— | (2,549,553 | ) | 0.81 | ||||||||||||||||
| Exercised and exchanged for restricted stock awards |
— | (1,202,894 | ) | 0.25 | ||||||||||||||||
| Forfeited |
255,952 | (318,532 | ) | 8.57 | ||||||||||||||||
|
|
|
|
|
|||||||||||||||||
| Balance as of June 30, 2009 (8,297,505 shares exercisable at weighted average exercise price of $3.86 per share) |
900,109 | 12,672,645 | 5.17 | |||||||||||||||||
| Authorized |
1,056,549 | — | ||||||||||||||||||
| Granted (weighted average fair value of $5.34) |
(1,581,230 | ) | 1,581,230 | 12.23 | ||||||||||||||||
| Exercised |
— | (1,958,652 | ) | 3.24 | ||||||||||||||||
| Forfeited |
147,273 | (170,278 | ) | 9.13 | ||||||||||||||||
|
|
|
|
|
|||||||||||||||||
| Balance as of June 30, 2010 (8,264,920 shares exercisable at weighted average exercise price of $5.00 per share) |
522,701 | 12,124,945 | 6.34 | |||||||||||||||||
| Authorized |
3,124,806 | — | ||||||||||||||||||
| Granted (weighted average fair value of $6.43) |
(2,172,920 | ) | 2,172,920 | 14.02 | ||||||||||||||||
| Exercised |
(3,560,570 | ) | 3.27 | |||||||||||||||||
| Forfeited |
239,703 | (256,510 | ) | 10.85 | ||||||||||||||||
|
|
|
|
|
|||||||||||||||||
| Balance as of June 30, 2011 |
1,714,290 | 10,480,785 | $ | 8.86 | 6.77 | $ | 78,146 | |||||||||||||
|
|
|
|
|
|||||||||||||||||
| Options vested and expected to vest at June 30, 2011 |
10,011,472 | $ | 8.73 | 6.67 | $ | 75,858 | ||||||||||||||
| Options vested at June 30, 2011 |
6,617,414 | $ | 7.18 | 5.64 | $ | 59,303 | ||||||||||||||
The total pretax intrinsic value of options exercised during the years ended June 30, 2011, 2010 and 2009 was $42,630,000, $17,018,000 and $26,716,000, respectively. In fiscal year 2011, 961,000 shares of non-qualified expiring stock options were net-share exercised such that the Company withheld 413,906 shares with value equivalent to the officers’ minimum statutory obligation for the applicable income and other employment taxes, and remitted the cash to the appropriate taxing authorities. The total shares withheld for taxes were based on the value of the option exercised as determined by the Company’s closing stock price. The payments for the employees’ tax obligations to the taxing authorities were $6,990,000 and are reflected as a
77
Table of Contents
SUPER MICRO COMPUTER, INC.
NOTES TO CONSOLIDATED FINANCIAL STATEMENTS—(Continued)
financing activity within the Consolidated Statements of Cash Flows. These net-share settlements had the effect of share repurchases by the Company as they reduced and retired the number of shares that would have otherwise been issued as a result of the exercising and did not represent an expense to the Company.
Stock-based compensation expense in the years ended June 30, 2011, 2010 and 2009 was $8,056,000, $6,347,000 and $5,099,000, respectively. As of June 30, 2011, the Company’s total unrecognized compensation cost related to non-vested stock-based awards granted since July 1, 2006 to employees and non-employee directors was $18,176,000, which will be recognized over a weighted-average vesting period of approximately 2.42 years.
Additional information regarding options outstanding as of June 30, 2011, is as follows:
| Options Outstanding | Options Vested and Exercisable | |||||||||||||||||||
| Range of |
Number Outstanding |
Weighted- Average Remaining Contractual Term (Years) |
Weighted- Average Exercise Price Per Share |
Number Exercisable |
Weighted- Average Exercise Price Per Share |
|||||||||||||||
| $1.25 - 2.60 |
1,083,977 | 2.23 | $ | 1.92 | 1,083,977 | $ | 1.92 | |||||||||||||
| 2.80 - 3.25 |
1,050,720 | 3.76 | 3.11 | 1,050,720 | 3.11 | |||||||||||||||
| 3.50 - 6.14 |
1,684,480 | 7.41 | 5.62 | 955,066 | 5.55 | |||||||||||||||
| 6.21 - 8.00 |
1,222,895 | 6.55 | 7.79 | 1,042,322 | 7.81 | |||||||||||||||
| 8.36 - 10.03 |
1,105,581 | 7.20 | 8.84 | 785,711 | 9.01 | |||||||||||||||
| 10.19 - 10.68 |
1,320,084 | 8.07 | 10.62 | 648,865 | 10.56 | |||||||||||||||
| 11.81 - 13.61 |
1,451,618 | 9.14 | 12.83 | 302,894 | 12.51 | |||||||||||||||
| 13.70 - 15.54 |
638,080 | 5.46 | 13.93 | 616,080 | 13.87 | |||||||||||||||
| 18.59 |
539,670 | 9.82 | 18.59 | 947 | 18.59 | |||||||||||||||
| 18.89 |
383,680 | 8.82 | 18.89 | 130,832 | 18.89 | |||||||||||||||
|
|
|
|
|
|||||||||||||||||
| $1.25 - $18.89 |
10,480,785 | 6.77 | $ | 8.86 | 6,617,414 | $ | 7.18 | |||||||||||||
|
|
|
|
|
|||||||||||||||||
The following table summarizes the Company’s restricted stock award activity for the year ended June 30, 2011 and 2010:
| Restricted Stock Awards | ||||||||
| Number of Shares |
Weighted Average Grant Date Fair Value Per Share |
|||||||
| Nonvested stock at July 1, 2009 |
1,172,121 | $ | 9.39 | |||||
| Granted |
— | — | ||||||
| Vested |
(316,598 | ) | 8.32 | |||||
| Forfeited |
— | — | ||||||
|
|
|
|
|
|||||
| Nonvested stock at June 30, 2010 |
855,523 | 9.79 | ||||||
| Granted |
— | — | ||||||
| Vested |
(316,600 | ) | 8.32 | |||||
| Forfeited |
— | — | ||||||
|
|
|
|
|
|||||
| Nonvested stock at June 30, 2011 |
538,923 | $ | 10.66 | |||||
|
|
|
|
|
|||||
78
Table of Contents
SUPER MICRO COMPUTER, INC.
NOTES TO CONSOLIDATED FINANCIAL STATEMENTS—(Continued)
The total pretax intrinsic value of restricted stock awards vested was $3,066,000, $2,633,000 and $0 for the years ended June 30, 2011, 2010 and 2009, respectively. In fiscal year 2011, upon vesting, 316,600 shares of restricted stock awards were net share-settled such that the Company withheld 147,977 shares with value equivalent to the officers’ minimum statutory obligation for the applicable income and other employment taxes, and remitted the cash to the appropriate taxing authorities. The total shares withheld were based on the value of the restricted stock awards on their vesting date as determined by the Company’s closing stock price. Total payments for the officers’ tax obligations to the taxing authorities were $1,434,000 and are reflected as a financing activity within the Consolidated Statements of Cash Flows. These net-share settlements had the effect of share repurchases by the Company as they reduced and retired the number of shares that would have otherwise been issued as a result of the vesting and did not represent an expense to the Company.
The total intrinsic value of the outstanding restricted stock awards was $8,671,000 as of June 30, 2011. There is no incremental fair value to be recognized as compensation expense in connection with the unvested restricted stock awards of 538,923 shares.
Note 12. Income Taxes
The components of income before income tax provision for the years ended June 30, 2011, 2010 and 2009 are as follows (in thousands):
| Years Ended June 30, | ||||||||||||
| 2011 | 2010 | 2009 | ||||||||||
| United States |
$ | 53,187 | $ | 39,103 | $ | 21,674 | ||||||
| Foreign |
4,886 | 1,362 | 1,125 | |||||||||
|
|
|
|
|
|
|
|||||||
| Income before income tax provision |
$ | 58,073 | $ | 40,465 | $ | 22,799 | ||||||
|
|
|
|
|
|
|
|||||||
The income tax provision for the years ended June 30, 2011, 2010 and 2009, consists of the following (in thousands):
| Years Ended June 30, | ||||||||||||
| 2011 | 2010 | 2009 | ||||||||||
| Current: |
||||||||||||
| Federal |
$ | 16,240 | $ | 15,460 | $ | 6,388 | ||||||
| State |
313 | 2,023 | 980 | |||||||||
| Foreign |
816 | 474 | 326 | |||||||||
|
|
|
|
|
|
|
|||||||
| 17,369 | 17,957 | 7,694 | ||||||||||
|
|
|
|
|
|
|
|||||||
| Deferred: |
||||||||||||
| Federal |
304 | (3,044 | ) | (464 | ) | |||||||
| State |
187 | (1,363 | ) | (538 | ) | |||||||
|
|
|
|
|
|
|
|||||||
| 491 | (4,407 | ) | (1,002 | ) | ||||||||
|
|
|
|
|
|
|
|||||||
| Income tax provision |
$ | 17,860 | $ | 13,550 | $ | 6,692 | ||||||
|
|
|
|
|
|
|
|||||||
79
Table of Contents
SUPER MICRO COMPUTER, INC.
NOTES TO CONSOLIDATED FINANCIAL STATEMENTS—(Continued)
The Company’s net deferred tax assets as of June 30, 2011 and 2010, consist of the following (in thousands):
| June 30, | ||||||||
| 2011 | 2010 | |||||||
| Warranty accrual |
$ | 1,730 | $ | 1,695 | ||||
| Marketing fund accrual |
1,095 | 874 | ||||||
| Inventory valuation |
5,508 | 5,677 | ||||||
| Stock-based compensation |
2,488 | 2,031 | ||||||
| Research and development credit |
1,085 | 1,460 | ||||||
| Other |
3,138 | 3,906 | ||||||
|
|
|
|
|
|||||
| Total deferred income tax assets |
15,044 | 15,643 | ||||||
| Deferred tax liabilities-depreciation and other |
(1,984 | ) | (1,062 | ) | ||||
|
|
|
|
|
|||||
| Deferred income tax assets-net |
$ | 13,060 | $ | 14,581 | ||||
|
|
|
|
|
|||||
Undistributed earnings of our foreign subsidiaries of $5,753,000 at June 30, 2011 are considered to be indefinitely reinvested and accordingly, no provisions for federal and state income taxes have been provided thereon. Upon distribution of those earnings in the form of dividends or otherwise, the Company would be subject to both U.S. income taxes (subject to an adjustment for foreign tax credits) and withholding taxes payable to various foreign countries.
Income tax benefits resulting from stock option transactions of $12,440,000, $5,759,000 and $5,306,000 were credited to stockholders’ equity in the years ended June 30, 2011, 2010 and 2009, respectively.
The following is a reconciliation for the years ended June 30, 2011, 2010 and 2009, of the statutory rate to the Company’s effective federal tax rate:
| Years Ended June 30, | ||||||||||||
| 2011 | 2010 | 2009 | ||||||||||
| Tax at statutory rate |
35.0 | % | 35.0 | % | 35.0 | % | ||||||
| State income tax-net of federal benefit |
4.4 | 3.5 | 5.2 | |||||||||
| Foreign losses not deductible and tax rate differences |
(1.1 | ) | (0.5 | ) | (0.5 | ) | ||||||
| Research and development tax credit |
(8.7 | ) | (5.8 | ) | (12.4 | ) | ||||||
| Other |
1.2 | 1.3 | 2.1 | |||||||||
|
|
|
|
|
|
|
|||||||
| Effective tax rate |
30.8 | % | 33.5 | % | 29.4 | % | ||||||
|
|
|
|
|
|
|
|||||||
As of June 30, 2011, the Company had state research and development tax credit carryforwards of $4,793,000. The state research and development tax credits will carryforward to offset future state income taxes. $3,124,000 of the state research and development tax credit carryforwards were attributable to excess tax deductions from stock options exercises, and were not included in the deferred tax assets shown above. The benefit of these carryforwards will be credited to equity when realized.
The Company’s policy is to include interest and penalties related to unrecognized tax benefits within the provision for taxes on the consolidated statements of operations. As of June 30, 2011 and 2010, the Company had accrued $604,000 and $551,000 for the payment of interest and penalties relating to unrecognized tax benefits, respectively.
80
Table of Contents
SUPER MICRO COMPUTER, INC.
NOTES TO CONSOLIDATED FINANCIAL STATEMENTS—(Continued)
The following table summarizes the activity related to the unrecognized tax benefits (in thousands):
| Gross* Unrecognized Income Tax Benefits |
||||
| Balance at July 1, 2008 |
$ | 4,669 | ||
| Gross increases: |
||||
| For current year’s tax positions |
726 | |||
| For prior years’ tax positions |
— | |||
| Gross decreases: |
||||
| Settlements and releases due to the lapse of statutes of limitations |
(1,396 | ) | ||
|
|
|
|||
| Balance at June 30, 2009 |
3,999 | |||
| Gross increases: |
||||
| For current year’s tax positions |
1,059 | |||
| For prior years’ tax positions |
1,084 | |||
| Gross decreases: |
||||
| Settlements and releases due to the lapse of statutes of limitations |
(313 | ) | ||
|
|
|
|||
| Balance at June 30, 2010 |
5,829 | |||
| Gross increases: |
||||
| For current year’s tax positions |
2,010 | |||
| For prior years’ tax positions |
216 | |||
| Gross decreases: |
||||
| Settlements and releases due to the lapse of statutes of limitations |
(1,108 | ) | ||
| For prior years’ tax positions |
(398 | ) | ||
|
|
|
|||
| Balance at June 30, 2011 |
$ | 6,549 | ||
|
|
|
|||
| * | excludes interest, penalties, federal benefit of state reserves |
The total amount of unrecognized tax benefits that would affect the effective tax rate, if recognized, is $5,546,000 and $4,838,000 as of June 30, 2011 and 2010, respectively.
The Company files U.S. federal, U.S. state, and foreign income tax returns. The Company is generally no longer subject to tax examinations for years prior to the fiscal year beginning July 1, 2003.
In connection with the regular examination of the Company’s California tax returns for the fiscal years ended June 30, 2003 and 2004, the Company has come to a settlement with the Franchise Tax Board in May 2011 and released the reserves related to tax positions taken on the California tax returns.
It is reasonably possible that the total amount of unrecognized tax benefits will increase or decrease in the next 12 months. Such changes could occur based on the normal expiration of various statues of limitations or the possible conclusion of ongoing tax examinations in various jurisdictions in the United States. If such events occur within the next 12 months, the Company does not believe that the change in unrecognized tax benefits will be material.
Note 13. Commitments and Contingencies
Litigation and Claims—The Company was a defendant in a lawsuit with Digitechnic, S.A. (“Digitechnic”), a former customer, before the Bobigny Commercial Court in Paris, France, in which Digitechnic alleged that certain products purchased from the Company were defective. In September 2003, the Bobigny Commercial
81
Table of Contents
SUPER MICRO COMPUTER, INC.
NOTES TO CONSOLIDATED FINANCIAL STATEMENTS—(Continued)
Court found in favor of Digitechnic and awarded damages totaling $1,178,000 and the matter was subsequently appealed. In October 2009, the Paris Court of Appeals awarded damages of $1,089,000 against the Company. The Company entered into a settlement agreement with Digitechnic, pursuant to which the Company made a payment of $1,055,000 with $34,000 of foreign exchange gain in December 2009 and a provision of $1,089,000 for litigation loss was recorded.
In addition to the above, the Company is involved in various legal proceedings arising from the normal course of business activities. In management’s opinion, resolution of these matters is not expected to have a material adverse impact on the Company’s consolidated results of operations, cash flows or the Company’s financial position. However, depending on the amount and timing, an unfavorable resolution of a matter could materially affect the Company’s future results of operations, cash flows or financial position in a particular period.
Lease Commitments—The Company leases offices and equipment under noncancelable operating leases which expire at various dates through 2016. In addition, the Company leases certain of its equipment under capital leases. The future minimum lease commitments under all leases are as follows (in thousands):
| As of June 30, 2011 | ||||||||
| Capital Leases |
Operating Leases |
|||||||
| Year ending June 30, 2012 |
$ | 41 | $ | 3,210 | ||||
| Year ending June 30, 2013 |
37 | 2,366 | ||||||
| Year ending June 30, 2014 |
14 | 2,243 | ||||||
| Year ending June 30, 2015 |
4 | 2,244 | ||||||
| Year ending June 30, 2016 |
1 | 615 | ||||||
| Thereafter |
— | 32 | ||||||
|
|
|
|
|
|||||
| Total minimum lease payments |
97 | $ | 10,710 | |||||
|
|
|
|||||||
| Less amounts representing interest |
11 | |||||||
|
|
|
|||||||
| Present value of minimum lease payments |
86 | |||||||
| Less long-term portion |
50 | |||||||
|
|
|
|||||||
| Current portion |
$ | 36 | ||||||
|
|
|
|||||||
Rent expense for the years ended June 30, 2011, 2010 and 2009, was $3,084,000, $2,545,000 and $2,550,000, respectively.
Note 14. Retirement Plan
The Company sponsors a 401(k) savings plan for eligible US employees and their beneficiaries. Contributions by the Company are discretionary, and no contributions have been made by the Company for the years ended June 30, 2011, 2010 and 2009.
Beginning in March 2003, employees of Super Micro Computer, B.V. have the option to deduct a portion of their gross wages and invest the amount in a pension plan. The Company has agreed to match 10% of the amount that is deducted monthly from employees’ wages. For the years ended June 30, 2011, 2010 and 2009, the Company’s matching contribution was $93,000, $66,000 and $55,000, respectively.
The Company maintains a defined benefit pension plan of Super Micro Computer, Taiwan that covers all eligible employees within Taiwan. Pension plan benefits are based primarily on participants’ compensation and years of service credited as specified under the terms of Taiwan’s plan. The funding policy is consistent with the
82
Table of Contents
SUPER MICRO COMPUTER, INC.
NOTES TO CONSOLIDATED FINANCIAL STATEMENTS—(Continued)
local requirements of Taiwan. Plan assets of the funded defined benefit pension plan are deposited into a government-managed account in which the Company has no control over investment strategy. For the years ended June 30, 2011, 2010 and 2009, the Company’s contribution was $350,000, $234,000 and $219,000, respectively.
Note 15. Segment Reporting
The Company operates in one operating segment that develops and provides high performance server solutions based upon an innovative, modular and open-standard architecture. The Company’s chief operating decision maker is the Chief Executive Officer.
International net sales are based on the country and region to which the products were shipped. The following is a summary for the years ended June 30, 2011, 2010 and 2009, of net sales by geographic region (in thousands):
| Years Ended June 30, | ||||||||||||
| 2011 | 2010 | 2009 | ||||||||||
| Net sales: |
||||||||||||
| United States |
$ | 549,755 | $ | 433,618 | $ | 325,582 | ||||||
| Europe |
201,518 | 156,268 | 108,605 | |||||||||
| Asia |
159,457 | 106,973 | 56,819 | |||||||||
| Other |
31,852 | 24,579 | 14,603 | |||||||||
|
|
|
|
|
|
|
|||||||
| $ | 942,582 | $ | 721,438 | $ | 505,609 | |||||||
|
|
|
|
|
|
|
|||||||
Net sales amounts previously disclosed by geography have been combined to conform to the current presentation.
The following is a summary of long-lived assets, excluding financial instruments, deferred tax assets, other assets, goodwill and intangible assets (in thousands):
| June 30, | ||||||||
| 2011 | 2010 | |||||||
| Long-lived assets: |
||||||||
| United States |
$ | 59,531 | $ | 59,129 | ||||
| Asia |
14,382 | 3,032 | ||||||
| Europe |
525 | 530 | ||||||
|
|
|
|
|
|||||
| $ | 74,438 | $ | 62,691 | |||||
|
|
|
|
|
|||||
Long-lived asset amounts previously disclosed by geography have been combined to conform to the current presentation.
83
Table of Contents
SUPER MICRO COMPUTER, INC.
NOTES TO CONSOLIDATED FINANCIAL STATEMENTS—(Continued)
The following is a summary of net sales by product type (in thousands):
| Years Ended June 30, | ||||||||||||||||||||||||
| 2011 | 2010 | 2009 | ||||||||||||||||||||||
| Amount | Percent of Net Sales |
Amount | Percent of Net Sales |
Amount | Percent of Net Sales |
|||||||||||||||||||
| Server systems |
$ | 351,282 | 37.3 | % | $ | 245,209 | 34.0 | % | $ | 196,656 | 38.9 | % | ||||||||||||
| Subsystems and accessories |
591,300 | 62.7 | % | 476,229 | 66.0 | % | 308,953 | 61.1 | % | |||||||||||||||
|
|
|
|
|
|
|
|
|
|
|
|
|
|||||||||||||
| Total |
$ | 942,582 | 100.0 | % | $ | 721,438 | 100.0 | % | $ | 505,609 | 100.0 | % | ||||||||||||
|
|
|
|
|
|
|
|
|
|
|
|
|
|||||||||||||
Subsystems and accessories are comprised of serverboards, chassis and accessories. Server systems constitute an assembly of subsystems and accessories done by the Company. No customer represented greater than 10% of the Company’s total net sales nor did net sales in any country other than the United States represent greater than 10% of the Company’s total net sales as of June 30, 2011 and 2010. No customer accounted for 10% or more of accounts receivable as of June 30, 2011, and one customer accounted for 10.2% of the Company’s accounts receivable as of June 30, 2010.
Note 16. Quarterly Financial Data (Unaudited)
The following table presents the Company’s unaudited quarterly financial data. This information has been prepared on a basis consistent with that of the audited consolidated financial statements. The Company believes that all necessary adjustments, consisting of normal recurring accruals and adjustments, have been included to present fairly the quarterly financial data. The Company’s quarterly results of operations for these periods are not necessarily indicative of future results of operations.
| Three Months Ended | ||||||||||||||||
| Sep. 30, 2010 |
Dec. 31, 2010 |
Mar. 31, 2011 |
Jun. 30, 2011 |
|||||||||||||
| (In thousands, except per share data) | ||||||||||||||||
| Net Sales |
$ | 207,178 | $ | 240,813 | $ | 234,288 | $ | 260,303 | ||||||||
| Gross profit |
33,037 | 40,179 | 37,856 | 40,032 | ||||||||||||
| Net income |
$ | 7,217 | $ | 11,569 | $ | 10,696 | $ | 10,731 | ||||||||
| Net income per common share: |
||||||||||||||||
| Basic |
$ | 0.19 | $ | 0.30 | $ | 0.28 | $ | 0.27 | ||||||||
| Diluted |
$ | 0.17 | $ | 0.27 | $ | 0.25 | $ | 0.24 | ||||||||
| Three Months Ended | ||||||||||||||||
| Sep. 30, 2009 |
Dec. 31, 2009 |
Mar. 31, 2010 |
Jun. 30, 2010 |
|||||||||||||
| (In thousands, except per share data) | ||||||||||||||||
| Net Sales |
$ | 148,521 | $ | 181,977 | $ | 189,276 | $ | 201,664 | ||||||||
| Gross profit |
24,509 | 30,309 | 29,265 | 30,909 | ||||||||||||
| Net income |
$ | 3,863 | $ | 7,604 | $ | 7,733 | $ | 7,715 | ||||||||
| Net income per common share: |
||||||||||||||||
| Basic |
$ | 0.11 | $ | 0.21 | $ | 0.21 | $ | 0.20 | ||||||||
| Diluted |
$ | 0.10 | $ | 0.19 | $ | 0.18 | $ | 0.18 | ||||||||
84
Table of Contents
| Item 9. | Changes in and Disagreements with Accountants on Accounting and Financial Disclosure |
None.
| Item 9A. | Controls and Procedures |
Conclusions Regarding the Effectiveness of Disclosure Controls and Procedures
Our management, with the participation of our Chief Executive Officer and Chief Financial Officer, evaluated the effectiveness of our disclosure controls and procedures as defined in Rule 13a-15(e) under the Securities Exchange Act of 1934 as amended (the “Exchange Act”) as of the end of the period covered by this Annual Report on Form 10-K. In designing and evaluating the disclosure controls and procedures, management recognizes that any controls and procedures, no matter how well designed and operated, can provide only reasonable assurance of achieving the desired control objectives. In addition, the design of disclosure controls and procedures must reflect the fact that there are resource constraints and that management is required to apply its judgment in evaluating the benefits of possible controls and procedures relative to their costs.
Based on our evaluation, our Chief Executive Officer and Chief Financial Officer concluded that, as of June 30, 2011, our disclosure controls and procedures were designed at a reasonable assurance level and were effective to provide reasonable assurance that information we are required to disclose in reports that we file or submit under the Exchange Act is recorded, processed, summarized and reported within the time periods specified in Securities and Exchange Commission rules and forms, and that such information is accumulated and communicated to our management, including our Chief Executive Officer and Chief Financial Officer, as appropriate, to allow for timely decisions regarding required disclosure.
Changes in Internal Control over Financial Reporting
There were no changes in our internal control over financial reporting (as defined in Rule 13a-15(f) and 15d-15(f) under the Securities Exchange Act of 1934, as amended) identified in connection with the evaluation described in this Item 9A that occurred during the fourth quarter of fiscal year 2011 that have materially affected, or are reasonably likely to materially affect, our internal control over financial reporting.
Management’s Report on Internal Control over Financial Reporting
Our management is responsible for establishing and maintaining adequate internal control over financial reporting (as defined in Rules 13a-15(f) and 15d-15(f) under the Securities Exchange Act of 1934, as amended). Under the supervision and with the participation of our management, including our Chief Executive Officer and Chief Financial Officer, we conducted an evaluation of the effectiveness of our internal control over financial reporting based on the framework in Internal Control—Integrated Framework issued by the Committee of Sponsoring Organizations of the Treadway Commission, or COSO. Based on our evaluation, our management has concluded that our internal control over financial reporting was effective as of June 30, 2011. The effectiveness of our internal control over financial reporting as of June 30, 2011 has been audited by Deloitte & Touche LLP, an independent registered public accounting firm, and their opinion is stated in their report which is included in this Annual Report on Form 10-K.
85
Table of Contents
REPORT OF INDEPENDENT REGISTERED PUBLIC ACCOUNTING FIRM
To the Board of Directors and Stockholders of
Super Micro Computer, Inc.:
We have audited the internal control over financial reporting of Super Micro Computer, Inc. and subsidiaries (the “Company”) as of June 30, 2011, based on criteria established in Internal Control—Integrated Framework issued by the Committee of Sponsoring Organizations of the Treadway Commission. The Company’s management is responsible for maintaining effective internal control over financial reporting and for its assessment of the effectiveness of internal control over financial reporting, included in the accompanying Management’s Report on Internal Control over Financial Reporting. Our responsibility is to express an opinion on the Company’s internal control over financial reporting based on our audit.
We conducted our audit in accordance with the standards of the Public Company Accounting Oversight Board (United States). Those standards require that we plan and perform the audit to obtain reasonable assurance about whether effective internal control over financial reporting was maintained in all material respects. Our audit included obtaining an understanding of internal control over financial reporting, assessing the risk that a material weakness exists, testing and evaluating the design and operating effectiveness of internal control based on that assessed risk, and performing such other procedures as we considered necessary in the circumstances. We believe that our audit provides a reasonable basis for our opinion.
A company’s internal control over financial reporting is a process designed by, or under the supervision of, the company’s principal executive and principal financial officers, or persons performing similar functions, and effected by the company’s board of directors, management, and other personnel to provide reasonable assurance regarding the reliability of financial reporting and the preparation of financial statements for external purposes in accordance with generally accepted accounting principles. A company’s internal control over financial reporting includes those policies and procedures that (1) pertain to the maintenance of records that, in reasonable detail, accurately and fairly reflect the transactions and dispositions of the assets of the company; (2) provide reasonable assurance that transactions are recorded as necessary to permit preparation of financial statements in accordance with generally accepted accounting principles, and that receipts and expenditures of the company are being made only in accordance with authorizations of management and directors of the company; and (3) provide reasonable assurance regarding prevention or timely detection of unauthorized acquisition, use, or disposition of the company’s assets that could have a material effect on the financial statements.
Because of the inherent limitations of internal control over financial reporting, including the possibility of collusion or improper management override of controls, material misstatements due to error or fraud may not be prevented or detected on a timely basis. Also, projections of any evaluation of the effectiveness of the internal control over financial reporting to future periods are subject to the risk that the controls may become inadequate because of changes in conditions, or that the degree of compliance with the policies or procedures may deteriorate.
In our opinion, the Company maintained, in all material respects, effective internal control over financial reporting as of June 30, 2011, based on the criteria established in Internal Control—Integrated Framework issued by the Committee of Sponsoring Organizations of the Treadway Commission.
We have also audited, in accordance with the standards of the Public Company Accounting Oversight Board (United States), the consolidated financial statements as of and for the year ended June 30, 2011 of the Company and our report dated September 2, 2011 expressed an unqualified opinion on those financial statements and included an explanatory paragraph relating to significant related party transactions.
/s/ Deloitte & Touche, LLP
San Jose, California
September 2, 2011
| Item 9B. | Other Information |
None.
86
Table of Contents
PART III
| Item 10. | Directors, Executive Officers and Corporate Governance |
Executive Officers and Directors
Our executive officers and their ages and their positions as of August 22, 2011, are as follows:
| Name |
Age | Position(s) | ||||
| Charles Liang |
53 | Chairman of the Board, President and Chief Executive Officer | ||||
| Howard Hideshima |
52 | Chief Financial Officer | ||||
| Phidias Chou |
53 | Vice President, Worldwide Sales | ||||
| Chiu-Chu (Sara) Liu Liang |
49 | Vice President of Operations, Treasurer and Director | ||||
| Yih-Shyan (Wally) Liaw |
56 | Vice President of International Sales, Secretary and Director | ||||
| Hwei-Ming (Fred) Tsai(1)(2)(3)(4) |
55 | Director | ||||
| Edward J. Hayes, Jr.(1)(4) |
56 | Director | ||||
| Sherman Tuan(2)(3)(4) |
57 | Director | ||||
| Gregory K. Hinckley(1)(4) |
64 | Director | ||||
| (1) | Member of the Audit Committee |
| (2) | Member of the Compensation Committee |
| (3) | Member of the Nominating and Corporate Governance Committee |
| (4) | Determined by the Board of Directors to be “independent” as defined by applicable listing standards of The Nasdaq Stock Market |
Executive Officers
Charles Liang founded Super Micro and has served as our President, Chief Executive Officer and Chairman of the Board since our inception in September 1993. Mr. Liang has been developing server system architectures and technologies for the past two decades. From July 1991 to August 1993, Mr. Liang was President and Chief Design Engineer of Micro Center Computer Inc., a high-end motherboard design and manufacturing company. From January 1988 to April 1991, Mr. Liang was Senior Design Engineer and Project Leader for Chips & Technologies, Inc., a chipset technology company, and Suntek Information International Group, a system and software development company. Mr. Liang has been granted many server technology patents. Mr. Liang holds an M.S. in Electrical Engineering from the University of Texas at Arlington and a B.S. in Electrical Engineering from National Taiwan University of Science & Technology in Taiwan. Our Nominating and Corporate Governance Committee (“Governance Committee”) concluded that Mr. Liang should serve on the Board based on his skills, experience and qualifications in managing technology businesses, his technical expertise, and his long familiarity with the Company’s business.
Howard Hideshima has served as our Chief Financial Officer since May 2006. From November 2005 to May 2006, Mr. Hideshima was Vice President of Finance at Force10 Networks, Inc., a network equipment company, and from July 2004 to November 2005, he served as Director of Finance for that company. From April 2001 to June 2004, Mr. Hideshima was Chief Financial Officer and Vice President of Finance and Administration at Virtual Silicon Technology, Inc., a semiconductor intellectual property company. From January 2000 to March 2001, he served as Chief Financial Officer at Internet Corporation, an Internet services company. From January 1999 to December 1999, he was Vice President of Finance and from July 1997 to December 1999 Chief Accounting Officer at ESS Technology, Inc., a fabless semiconductor company. Mr. Hideshima holds an M.B.A. from San Francisco State University and a B.S. in Business Administration from the University of California at Berkeley.
Phidias Chou has served as our Vice President, Worldwide Sales since September 2008. Mr. Chou served as our Vice President of Sales, Regional and Strategic Account from July 2006 to August 2008 and served as our
87
Table of Contents
Senior Director of Sales from August 2000 to July 2006. From April 1996 to August 2000, Mr. Chou was General Manager at US Sertek, a subsidiary of Acer, Inc., a PC and server company. From July 1992 to April 1996, he was Director of Sales and from October 1987 to July 1992, he was PC Product Manager at Acer Taiwan. Mr. Chou received an M.B.A. from Chung Yuan Christian University and a B.S. in Mechanical Engineering from National Chung Hsing University.
Chiu-Chu (Sara) Liu Liang co-founded Super Micro and has served as Vice President of Operations, Treasurer and a member of our board of directors since our inception in September 1993. From 1985 to 1993, Ms. Liang held finance and operational positions for several companies, including Micro Center Computer Inc. Ms. Liang holds a B.S. in Accounting from Providence University in Taiwan. Ms. Liang is married to Mr. Charles Liang, our Chairman, President and Chief Executive Officer. Our Governance Committee concluded that Ms. Liang should serve on the Board based on her skills, experience, her general expertise in business and accounting and her long familiarity with the Company’s business.
Yih-Shyan (Wally) Liaw co-founded Super Micro and has served as Vice President of International Sales, Corporate Secretary and a member of our board of directors since our inception in September 1993. From 1988 to 1991, Mr. Liaw was Vice President of Engineering at Great Tek, a computer company. Mr. Liaw holds an M.S. in Computer Engineering from University of Arizona, an M.S. in Electrical Engineering from Tatung Institute of Technology in Taiwan, and a B.S. degree from Taiwan Provincial College of Marine and Oceanic Technology. Our Governance Committee concluded that Mr. Liaw should serve on the Board based on his skills, experience and qualifications in managing technology businesses, his technical expertise and his long familiarity with the Company’s business.
Non-Management Directors
Hwei-Ming (Fred) Tsai has been a member of our board of directors since August 2006. Mr. Tsai is an independent business consultant since January 2010. Mr. Tsai served as Executive Vice President and Chief Financial Officer of SinoPac Bancorp, a financial holding company based in Los Angeles, California from February 2001 and August 2005, respectively, to December 2009. He also served as Senior Executive Vice President of Far East National Bank, a commercial bank that is held by SinoPac Bancorp from December 2002 to December 2009. Mr. Tsai received a Master in Professional Accounting from the University of Texas at Austin and a B.A. in Accounting from National Taiwan University in Taiwan. Our Governance Committee concluded that Mr. Tsai should serve on the Board based on his skills, experience and qualifications in capital finance, his financial literacy and his familiarity with the Company’s business.
Edward J. Hayes, Jr. has been a member of our board of directors since February 2007. Mr. Hayes has served as Chief Financial Officer of Pillar Data Systems, Inc., a privately-held data storage company, since August 2006. In June 2011, Oracle Corporation acquired Pillar Data Systems, Inc. From July 2004 to August 2006, he served as Executive Vice President and Chief Financial Officer of Quantum Corporation, a data storage company publicly traded on NYSE. From March 2003 to July 2004, Mr. Hayes was an independent consultant and private investor. From April 2001 to March 2003, he was President and Chief Executive Officer of DirecTV Broadband, Inc., an internet service provider. From January 2000 to April 2001, he served as Executive Vice President and Chief Financial Officer of Telocity, Inc., an internet service provider which the management team took public in March 2000. Mr. Hayes is an independent director and non-executive Chairman of the Board of publicly-traded Alaska Communications Systems Group, Inc., a telecommunications service provider. Mr. Hayes holds a B.A. degree from Colgate University and conducted his graduate studies in Accounting and Finance at the New York University Graduate School of Business. Our Governance Committee concluded that Mr. Hayes should serve on the Board based on his skills, experience and qualifications in managing technology businesses, his experience and qualifications in finance, his general expertise in business and accounting, his financial literacy and his familiarity with the Company’s business.
Sherman Tuan has been a member of our board of directors since February 2007. Mr. Tuan is founder of PurpleComm, Inc. (doing business as 9x9Network), a provider of new media for internet TV services, where he
88
Table of Contents
has served as Chief Executive Officer since January 2005 and Chairman of the Board since June 2003. He has served as Chief Executive Officer of Purple Communications Limited, an investment holding company since April 2002. From September 1999 to May 2002, he was director of Metromedia Fiber Network, Inc., a fiber optical networking infrastructure provider. Mr. Tuan was co-founder of AboveNet Communications, Inc., an internet connectivity solutions provider, where he served as President from March 1996 to January 1998, Chief Executive Officer from March 1996 to May 2002 and director from March 1996 to September 1999. Mr. Tuan received a B.S. degree in Electrical Engineering from Feng-Chia University in Taiwan. Our Governance Committee concluded that Mr. Tuan should serve on the Board based on his skills, experience and qualifications in managing technology businesses, his technical expertise and his familiarity with the Company’s business.
Gregory K. Hinckley has been a member of our board of directors since January 2009. Mr. Hinckley is currently the President and interim Chief Financial Officer of Mentor Graphics Corporation, a publicly traded provider of electronic design automation solutions. He began at Mentor Graphics in January 1997 as Executive Vice President, Chief Operating Officer and Chief Financial Officer. In November 2000, he became President and Chief Financial Officer. In July 2007, his position became President and Chief Operating Officer. Prior to Mentor Graphics, he served as Chief Financial Officer for two other publicly traded companies—VLSI Technology, Inc. and Bio-Rad Laboratories, Inc. Mr. Hinckley is a director of SI-Bone, Inc. (a privately-held orthopedic device company), a director and member of audit and compensation committees of Intermec, Inc. (a publicly traded provider of automated identification and data collection (AIDC) solutions), and is an advisory director of Portland State University Engineering School. Mr. Hinckley holds a Bachelor of Arts degree in physics from Claremont McKenna College, a Master of Science degree in applied physics from University of California, an MBA degree from Harvard Business School, and was a Fullbright Scholar in applied mathematics at Nottingham University in England. He is also a Certified Public Accountant. Our Governance Committee concluded that Mr. Hinckley should serve on the Board based on his skills, experience and qualifications in managing technology businesses, his technical expertise, his experience and qualifications in finance and operations and his financial literacy.
Composition of the Board
The authorized number of directors of the Company is seven. There are currently seven directors. Our amended and restated certificate of incorporation provides for a classified board of directors divided into three classes. The members of each class are elected to serve a three-year term with the term of office for each class ending in consecutive years. Vacancies may be filled by a majority of the directors then in office, although less than a quorum, or by a sole remaining director. Alternatively, the board of directors, at its option, may reduce the number of directors.
The current composition of the board is:
| Class I Directors (terms expiring at the 2013 annual meeting) | Charles Liang Sherman Tuan | |
| Class II Directors (terms expiring at the 2011 annual meeting) | Yih-Shyan (Wally) Liaw Edward J. Hayes, Jr Gregory K. Hinckley | |
| Class III Directors (terms expiring at the 2012 annual meeting) | Chiu-Chu (Sara) Liu Liang Hwei-Ming (Fred) Tsai | |
89
Table of Contents
CORPORATE GOVERNANCE
Corporate Governance Guidelines
We have adopted “Corporate Governance Guidelines” to help ensure that the board of directors is independent from management, appropriately performs its function as the overseer of management, and that the interests of the board of directors and management align with the interests of the stockholders. The “Corporate Governance Guidelines” are available at www.Supermicro.com by first clicking on “About Us” and then “Investor Relations” and then “Corporate Governance,” and are also available in print to any stockholder who requests a copy.
Code of Ethics
We have adopted a “Code of Business Conduct and Ethics” that is applicable to all directors and employees and embodies our principles and practices relating to the ethical conduct of our business and our long-standing commitment to honesty, fair dealing and full compliance with all laws affecting our business. The “Code of Business Conduct and Ethics” is available at www.Supermicro.com by first clicking on “About Us” and then “Investor Relations” and then “Corporate Governance,” and is also available in print without charge to any stockholder who requests it. Any substantive amendment or waiver of the Code relating to executive officers or directors will be made only after approval by a committee comprised of a majority of our independent directors and will be promptly disclosed on our website within four business days.
Director Independence
The board affirmatively determines the independence of each director and nominee for election as a director in accordance with guidelines it has adopted, which include all elements of independence set forth in applicable Nasdaq listing standards. Our director independence standards are set forth in our “Corporate Governance Guidelines” available at the website noted above.
Based on these standards, our board of directors has determined that four of its current seven members are independent directors under the applicable listing standards of the NASDAQ Global Select Market, namely Sherman Tuan, Edward J. Hayes, Jr., Gregory K. Hinckley and Hwei-Ming (Fred) Tsai.
Executive Sessions
Non-management directors meet in executive session without management present each time the board holds its regularly scheduled meetings.
Communications with the Board of Directors
The board of directors welcomes the submission of any comments or concerns from stockholders or other interested parties. If you wish to send any communications to the board of directors, you may use one of the following methods:
| • | Write to the board at the following address: |
Board of Directors
Super Micro Computer, Inc.
c/o Robert Aeschiman, General Counsel
980 Rock Avenue
San Jose, California 95131
| • | E-mail the board of directors at BODInquiries@supermicro.com |
90
Table of Contents
MEETINGS AND COMMITTEES OF THE BOARD
Board Meetings
Each director is expected to devote sufficient time, energy and attention to ensure diligent performance of his or her duties and to attend all board and committee meetings. We encourage, but do not require, each board member to attend our annual meeting of stockholders. The board of directors held five meetings during fiscal year 2011, of which four were regularly scheduled meetings and one was specially scheduled meeting. The independent directors met five times in executive sessions without any of our officers present. All directors attended at least 75% of the meetings of the board of directors and of the committees on which they served during the time they served as a director in fiscal year 2011.
Board Leadership Structure
Our Chairman, Charles Liang, is also our CEO. The Board and our Governance Committee believe that it is appropriate for Mr. Liang to serve as both the CEO and Chairman due to the relatively small size of the Company and our Board, and the fact that Mr. Liang is the founder of the Company with extensive experience in our industry.
Board Role in the Oversight of Risk
Our Board exercises oversight over our risk management activities, requesting and receiving reports from management. Our Board has delegated primary responsibility for oversight of risks relating to financial controls and reporting to our Audit Committee, which in turn reports to the full Board on such matters as appropriate. The Audit Committee also assists the Board in oversight of certain Company risks, particularly in the areas of internal controls, financial reporting and review of related party transactions.
Our management with oversight from our Compensation Committee, has reviewed its compensation policies and practices with respect to risk-taking incentives and risk management, and does not believe that potential risks arising from its compensation polices or practices are reasonably likely to have a material adverse effect on the Company.
Committees of the Board of Directors
The board has three standing committees to facilitate and assist the board of directors in discharging its responsibilities: the Audit Committee, the Compensation Committee and the Nominating and Corporate Governance Committee. In accordance with applicable Nasdaq listing standards, each of these committees is comprised solely of non-employee, independent directors. The Charter for each committee is available at www.Supermicro.com by first clicking on “About Us” and then “Investor Relations” and then “Corporate Governance”. The charter of each committee also is available in print to any stockholder who requests it. The following table shows the current members of each of the standing board committees:
| Audit Committee |
Compensation Committee |
Nominating and Corporate Governance Committee | ||
| Edward J. Hayes, Jr.(1) |
Sherman Tuan(1) | Hwei-Ming (Fred) Tsai(1) | ||
| Hwei-Ming (Fred) Tsai |
Hwei-Ming (Fred) Tsai | Sherman Tuan | ||
| Gregory K. Hinckley |
| (1) | Committee Chairperson |
Audit Committee
The Audit Committee has three members. The Audit Committee met five times in fiscal year 2011, of which four were regularly scheduled quarterly meetings and one was a specially scheduled meeting. Our board has
91
Table of Contents
determined that each member of our Audit Committee meets the requirements for independence under the applicable listing standards of Nasdaq and the rules of the SEC. Our board has also determined that each member of our Audit Committee is a “financial expert” as defined under applicable SEC rules.
As outlined more specifically in the Audit Committee charter, the Audit Committee has, among other duties, the following responsibilities:
| • | The appointment, compensation and retention of our independent auditors, and the review and evaluation of the auditors’ qualifications, independence and performance; |
| • | Oversees the auditors’ audit work and reviews and pre-approves all audit and non-audit services that may be performed by them; |
| • | Reviews and approves the planned scope of our annual audit; |
| • | Monitors the rotation of partners of the independent auditors on our engagement team as required by law; |
| • | Reviews our financial statements and discusses with management and the independent auditors the results of the annual audit and the review of our quarterly financial statements; |
| • | Reviews our critical accounting policies and estimates; |
| • | Oversees the adequacy of our financial controls; |
| • | Reviews annually the audit committee charter and the committee’s performance; |
| • | Reviews and approves all related-party transactions; and |
| • | Establishes and oversees procedures for the receipt, retention and treatment of complaints regarding accounting, internal controls or auditing matters and oversees enforcement, compliance and remedial measures under our Code of Business Conduct and Ethics. |
Compensation Committee
The Compensation Committee has two members and met four times in fiscal year 2011. The Compensation Committee is comprised solely of non-employee directors. Our board has determined that each member of our Compensation Committee meets the requirements for independence under the applicable listing standards of Nasdaq.
As outlined more specifically in the Compensation Committee charter, the Compensation Committee has, among other duties, the following responsibilities:
| • | Reviews and approves corporate goals and objectives relevant to compensation of the chief executive officer and other executive officers; |
| • | Evaluates the performance of the chief executive officer and other executive officers in light of those goals and objectives; |
| • | Sets compensation of the chief executive officer and other executive officers; |
| • | Administers the issuance of restricted stock grants, stock options and other awards to executive officers and directors under our stock plans; and |
| • | Reviews and evaluates, at least annually, the performance of the compensation committee and its members, including compliance of the compensation committee with its charter. |
92
Table of Contents
Nominating and Corporate Governance Committee
The Governance Committee has two members and met five times in fiscal year 2011. The Governance Committee is comprised solely of non-employee directors. Our board has determined that each member of our Governance Committee meets the requirements for independence under the applicable listing standards of Nasdaq.
As outlined more specifically in the Governance Committee charter, the Governance Committee has, among other duties, the following responsibilities:
| • | Identifies individuals qualified to become directors; |
| • | Recommends to our board of directors director nominees for each election of directors; |
| • | Develops and recommends to our board of directors criteria for selecting qualified director candidates; |
| • | Considers committee member qualifications, appointment and removal; |
| • | Recommends corporate governance guidelines applicable to us; |
| • | Provides oversight in the evaluation of our board of directors and each committee; |
| • | Reviews and monitors our Code of Business Conduct and Ethics and reviews and approves any waivers of our Code of Business Conduct and Ethics; and |
| • | Coordinates and reviews board and committee charters for consistency and adequacy under applicable rules, and make recommendations to the board for any proposed changes. |
Compensation Committee Interlocks and Insider Participation
None of the members of the Compensation Committee is a current or former officer or employee of the Company or had any relationship with the Company requiring disclosure. In addition, during fiscal year 2011, none of our executive officers served as a member of the board of directors or compensation committee of any other entity that has one or more executive officers who served on our board of directors or Compensation Committee.
Section 16(a) Beneficial Ownership Reporting Compliance
The members of our board of directors, our executive officers and persons who hold more than 10% of our outstanding common stock are subject to the reporting requirements of Section 16(a) of the Exchange Act, which require them to file reports with respect to their ownership of our common stock and their transactions in our common stock. Based upon (i) the copies of Section 16(a) reports that we received from such persons for their fiscal year 2011 transactions in our common stock and their common stock holdings and (ii) the written representations received from one or more of such persons that no annual Form 5 reports were required to be filed by them for fiscal year 2011, we believe that all reporting requirements under Section 16(a) were met in a timely manner by the persons who were executive officers, members of the board of directors or greater than 10% stockholders during such fiscal year, other than (i) one late report by Howard Hideshima reporting one untimely transaction; (ii) three late reports by Charles Liang reporting a total of three untimely transactions; (iii) three late reports by Chiu-Chu (Sara) Liu Liang reporting a total of three untimely transactions; (iv) three late reports by Hwei-Ming (Fred) Tsai reporting a total of eleven untimely transactions; and (v) six late reports by Yih-Shyan (Wally) Liaw reporting a total of twelve untimely transactions.
93
Table of Contents
| Item 11. | Executive Compensation |
EXECUTIVE COMPENSATION
Compensation Discussion and Analysis
Process Overview
The Compensation Committee of the board of directors discharges the board of directors’ responsibilities relating to compensation of all of our executive officers. The Compensation Committee is comprised of two non-employee directors, both of whom are independent pursuant to the applicable listing rules of Nasdaq, Rule 16b-3 under the Exchange Act, and Section 162(m) of the Internal Revenue Code (“Code”).
The agenda for meetings is determined by the Chair of the Compensation Committee with the assistance of Charles Liang, our President and Chief Executive Officer, and Howard Hideshima, our Chief Financial Officer. Committee meetings are regularly attended by one or more of Mr. Liang, Mr. Hideshima and Robert Aeschiman, our General Counsel. However, Messrs. Liang and Hideshima do not attend the portion of meetings during which their own performance or compensation is being discussed. Mr. Liang, Mr. Hideshima and Mr. Aeschiman support the Compensation Committee in its work by providing information relating to our financial plans, performance assessments of our executive officers and other personnel-related data. In addition, the Compensation Committee has the authority under its charter to hire, terminate and approve fees for advisors, consultants and agents as it deems necessary to assist in the fulfillment of its responsibilities. In October 2009, as part of making an overall assessment of each individual’s role and performance, and structuring our compensation programs for fiscal year 2010, the Committee reviewed recommendations of management as well as publicly available peer group compensation data.
Compensation Philosophy and Objectives
It is the Compensation Committee’s philosophy to link the named executive officers’ compensation to corporate performance. The base salary, quarterly bonuses and stock option grants of the named executive officers are determined in part by the Compensation Committee reviewing data on prevailing compensation practices of comparable technology companies with whom we compete for executive talent, and evaluating such information in connection with our corporate goals and compensation practices.
The Compensation Committee considers various sources of competitive data when determining executive compensation levels, including compensation data from a sampling of public companies and public compensation surveys. For fiscal year 2011, the sample of companies consisted of the following companies:
| 3Par, Inc. |
LSI Corp. | |
| Adaptec Corporation |
Network Appliance, Inc. | |
| Blue Coat Systems, Inc. |
Network Engines, Inc. | |
| Brocade Communications Systems, Inc. |
Quantum Corporation | |
| Compellent Technologies |
RadiSys Corporation | |
| Dot Hill Systems Corp. |
Riverbed Technology, Inc. | |
| Emulex Corp. |
Silicon Graphics International | |
| Extreme Networks, Inc. |
STEC, Inc. | |
| Juniper Network, Inc. |
In selecting the companies for inclusion in the sample, the following factors were considered: industry, net revenues, operating income and whether the company may compete against us for executive talent. These companies ranged in annual revenue from approximately $4.1 million to $3.9 billion. In addition to gathering data specific to the above listed companies, the Compensation Committee also reviewed public surveys of compensation practices.
The Compensation Committee does not seek to specifically benchmark compensation based upon the sample companies reviewed nor does the Compensation Committee employ any other formulaic process in
94
Table of Contents
making compensation decisions. Rather the Compensation Committee uses its subjective judgment based upon a review of all information, including an annual review for each officer of his or her level of responsibility, contributions to our financial results and our overall performance. The Compensation Committee makes a generalized assessment of these factors and this information is not weighted in any specific manner.
We believe that our current compensation arrangements for several of our executive officers, including our Chief Executive Officer, are significantly below typical compensation levels for similar positions at comparable companies. This is principally due to the high level of Company stock ownership held by such persons. As we continue to grow, we may need to increase our recruiting of new executives from outside of the Company. This in turn may require us to pay higher compensation closer to or in excess of that typical paid by comparable companies.
Finally, we believe that creating stockholder value requires not only managerial talent but active participation by all employees. In recognition of this, we try to minimize the number of compensation arrangements that are distinct or exclusive to our executive officers. We currently provide base salary, quarterly bonuses and long-term equity incentive compensation to a considerable number of our domestic employees and international employees, in addition to our executive officers.
Role of Executive Officers in the Compensation Process
Management provides recommendations to the Compensation Committee on issues such as compensation program design, and evaluations of executive and Company performance. In Fiscal year 2010, the Compensation Committee also had access to competitive data collected by management. While the Compensation Committee carefully considers all recommendations made by members of management, ultimate authority for all compensation decisions regarding our executive officers rests with the Compensation Committee.
Fiscal Year 2011 Executive Officer Compensation Components
For fiscal year 2011, the principal components of compensation for our executive officers were:
| • | Base salary; |
| • | Quarterly bonus; and |
| • | Equity-Based Incentive Compensation. |
Base Salary. Base salaries for our executive officers other than the Chief Executive Officer are determined annually by the Compensation Committee based upon recommendations by our chief executive officer, taking into account such factors as salary norms in comparable companies and publicly available data regarding compensation increases in the industry, a subjective assessment of the nature of the position and an annual review of the contribution and experience of each executive officer. For the Chief Executive Officer, the Compensation Committee considers substantially the same sort of information, as well as the size of the company and the chief executive officer’s overall stock ownership.
In August 2010, the Compensation Committee met to review the base salaries of our executive officers for fiscal year 2011. In determining base salaries for fiscal year 2011, the Compensation Committee decided to increase the base salary of our executive officers other than the Chief Executive Officer after taking into account the recommendations of our Chief Executive Officer and taking into account such factors as salary norms in comparable companies and publicly available data regarding compensation increases in the industry, a subjective assessment of the nature of each position and an annual review of the contribution and experience of each executive officer. For the Chief Executive Officer, the Compensation Committee considered substantially the same sort of information, as well as the size of the company and the Chief Executive Officer’s stock ownership, and determined to make no change to the base salary of the Chief Executive Officer. Based upon its review, the
95
Table of Contents
Compensation Committee approved increases in base salaries for our executive officers set forth below. The base salary increases were comparable to the average percentage base salary increases granted to our employees generally except that the increases for Ms. Liang and Mr. Liaw were higher due to their low base salaries.
| Principal Position |
2010 Base Salary |
2011 Base Salary |
Base Salary % Change |
|||||||||||
| Charles Liang |
President, Chief Executive Officer and Chairman of the Board | $ | 286,598 | $ | 286,598 | 0.0 | % | |||||||
| Howard Hideshima |
Chief Financial Officer | $ | 252,206 | $ | 258,511 | 2.5 | % | |||||||
| Phidias Chou |
Vice President, Worldwide Sales | $ | 220,000 | $ | 225,500 | 2.5 | % | |||||||
| Chiu-Chu (Sara) Liu Liang |
Vice President of Operations, Treasurer, and Director | $ | 168,000 | $ | 176,400 | 5.0 | % | |||||||
| Yih-Shyan (Wally) Liaw |
Vice President, International Sales, Corporate Secretary and Director | $ | 169,600 | $ | 178,080 | 5.0 | % | |||||||
Quarterly Bonus. Our cash bonus program seeks to motivate executive officers to work effectively to achieve our financial performance objectives and to reward them when such objectives are met. Quarterly bonuses for executive officers are subject to approval by the Committee. Bonuses are not awarded based upon any specific plan or formula, but are subjectively determined based upon our performance during the quarter and the individual’s contributions. Historically these bonuses have ranged from zero to an amount equal to two weeks of base salary. For fiscal year 2011, quarterly bonuses of $4,850 and $3,250 were granted to Messrs. Hideshima and Chou, respectively, which were generally in line with quarterly bonuses for employees generally. No bonuses were granted to Messrs. Liang or Liaw or Ms. Liang.
Equity-Based Incentive Compensation. Stock options are an important component of the total compensation of executive officers. We believe that stock options align the interests of each executive with those of the shareholders. They also provide executive officers a significant, long-term interest in our success and help retain key executive officers in a competitive market for executive talent. Our 2006 Equity Incentive Plan authorizes the Compensation Committee to grant stock options to executive officers. The number of shares owned by, or subject to options held by, each executive officer is periodically reviewed and additional awards are considered based upon a generalized assessment of past performance of the executive and the relative holdings of other executive officers. The option grants generally utilize four-year vesting periods to encourage executive officers to continue contributing to us, and they generally expire no later than ten years from the date of grant.
In August 2010, the Compensation Committee approved grants of additional options to Messrs. Hideshima, Chou and Liaw as part of the Compensation Committee’s review of all employee grant levels. In April 2011, the Compensation Committee granted an option to Mr. Liang for 132,000 shares with an exercise price equal to $18.59 per share, which was the market value as of the date of grant. The option vests over four years. The Compensation Committee concluded that as Mr. Liang had not received any additional equity for two years, he should be provided with an additional incentive.
Stock Ownership Guidelines
We currently do not require our directors or executive officers to own a particular amount of our common stock. The Committee is satisfied that stock and option holdings among our directors and executive officers are sufficient at this time to provide motivation and to align this group’s interests with those of our stockholders. Our insider trading policy prohibits any of our directors, executive officers, employees or contractors from engaging in any transactions in publicly-traded options, such as puts and calls, and other derivative securities, including any hedging or similar transaction, with respect to our common stock.
96
Table of Contents
Other Benefits
Health and Welfare Benefits
Our executive officers receive the same health and welfare benefits as are offered to our other employees, including medical, dental, vision, life, accidental death and dismemberment, disability, flexible spending accounts and holiday pay. The same contribution amounts, percentages and plan design provisions are applicable to all employees.
Retirement Program
Our executive officers may participate in the same tax-qualified, employee-funded 401(k) plan that is offered to all our other employees. We currently have no Supplemental Executive Retirement Plan, or SERP, obligations. We do not offer any defined benefit retirement plans to our executive officers.
Perquisites
We do not provide special benefits or other perquisites to any of our executive officers, with the exception of an automobile allowance provided to our Chief Executive Officer, as detailed in the “Summary Compensation Table.”
Employment Arrangements, Severance and Change of Control Benefits
We have not entered into employment agreements with any of our named executive officers. Mr. Hideshima, Mr. Chou and Ms. Liang have signed offer letters which provide for at-will employment. The offer letters provide for salary, stock options and right to participate in our employee benefit plans. We do not have any written employment arrangements with Messrs. Liang and Liaw. We do not have any arrangements with any of our executive officers that provide for any severance benefits in the event of termination or change of control.
Tax and Accounting Treatment of Compensation
In our review and establishment of compensation programs and payments, we consider, but do not place great emphasis on, the anticipated accounting and tax treatment of our compensation programs on us and our executive officers. While we may consider accounting and tax treatment, these factors alone are not dispositive. Among other factors that receive greater consideration are the net costs to us and our ability to effectively administer executive compensation in the short and long-term interests of stockholders under a proposed compensation arrangement.
We monitor whether it might be in our best interest to comply with Section 162(m) of the Code, but reserve the right to award future compensation which would not comply with the Section 162(m) requirements for non-deductibility if the Committee concludes that it is in the Company’s best interest to do so. We seek to maintain flexibility in compensating executive officers in a manner designed to promote varying corporate goals and therefore the Committee has not adopted a policy requiring all compensation to be deductible. The Committee will continue to assess the impact of Section 162(m) on its compensation practices and determine what further action, if any, is appropriate.
We account for equity compensation paid to our employees in accordance with Accounting Standards Codification Topic 718, Stock Compensation (“ASC Topic 718”), which requires us to estimate and record expenses for each award of equity compensation over the service period of the award.
We intend that our plans, arrangements and agreements will be structured and administered in a manner that complies with the requirements of Section 409A of the Code. Participation in, and compensation paid under our
97
Table of Contents
plans, arrangements and agreements may, in certain instances, result in the deferral of compensation that is subject to the requirements of Section 409A. If our plans, arrangements and agreements as administered fail to meet certain requirements under Section 409A, compensation earned thereunder may be subject to immediate taxation and tax penalties.
Summary
The Committee believes that our compensation philosophy and programs are designed to foster a performance-oriented culture that aligns our executive officers’ interests with those of our stockholders. The Committee also believes that the compensation of our executive officers is both appropriate and responsive to the goal of building stockholder value.
Compensation Committee Report
The Committee has reviewed and discussed the Compensation Discussion and Analysis (“CD&A”) with the Company’s management. Based on this review and these discussions, the Committee recommended to the board of directors that the CD&A be included in this filing.
This report has been furnished by the Compensation Committee.
Sherman Tuan, Chair
Hwei-Ming (Fred) Tsai
98
Table of Contents
Summary Compensation Table
The following table summarizes the compensation paid to our Chief Executive Officer, our Chief Financial Officer and to our other most highly compensated executive officers who were the only executive officers whose total annual salary and bonus exceeded $100,000 in fiscal year 2011, for services rendered in all capacities to us during fiscal year 2011, 2010 and 2009. We refer to these officers as our “named executive officers.”
SUMMARY COMPENSATION TABLE
| Name and Principal |
Year | Salary ($) |
Bonus ($)(1) |
Stock Awards ($)(2) |
Option Awards ($)(3)(4) |
Non-Equity Incentive Plan Compensation ($) |
Change
in Pension Value and Nonqualified Deferred Compensation Earnings ($)(5) |
All Other Compensation ($) |
Total ($) |
|||||||||||||||||||||||||||
| Charles Liang |
2011 | $ | 286,598 | $ | — | $ | — | $ | 1,116,206 | $ | — | $ | — | $ | 1,546 | (6) | $ | 1,404,350 | ||||||||||||||||||
| President, Chief Executive Officer and Chairman of the Board |
2010 | 286,598 | 4,823 | — | — | — | — | 7,987 | (6) | 299,408 | ||||||||||||||||||||||||||
| 2009 | 285,460 | 5,381 | 9,574,865 | 2,364,466 | — | — | 5,511 | (6) | 12,235,683 | |||||||||||||||||||||||||||
| Howard Hideshima |
2011 | 254,231 | 4,850 | — | 412,361 | — | — | 4,634 | (6) | 676,076 | ||||||||||||||||||||||||||
| Chief Financial Officer |
2010 | 253,331 | 3,638 | — | — | — | — | 5,316 | (6) | 262,285 | ||||||||||||||||||||||||||
| 2009 | 251,205 | 4,735 | — | 133,168 | — | — | 4,850 | (6) | 393,958 | |||||||||||||||||||||||||||
| Phidias Chou |
2011 | 225,271 | 3,250 | — | — | — | — | 5,447 | (6) | 233,968 | ||||||||||||||||||||||||||
| Vice President, Worldwide Sales |
2010 | 214,299 | 4,156 | — | 182,011 | — | — | 4,625 | (6) | 405,091 | ||||||||||||||||||||||||||
| 2009 | 199,981 | 6,101 | — | 57,621 | — | — | 3,855 | (6) | 267,558 | |||||||||||||||||||||||||||
| Chiu-Chu (Sara) Liu Liang |
2011 | 175,900 | — | — | — | — | — | 5,379 | (6) | 181,279 | ||||||||||||||||||||||||||
| Vice President of Operations, Treasurer and Director |
2010 | 168,000 | 2,423 | — | 206,692 | — | — | 673 | (6) | 377,788 | ||||||||||||||||||||||||||
| 2009 | 167,333 | 3,153 | 956,882 | 51,987 | — | — | 3,231 | (6) | 1,182,586 | |||||||||||||||||||||||||||
| Yih-Shyan (Wally) Liaw |
2011 | 177,727 | — | — | 108,436 | — | — | 6,832 | (6) | 292,995 | ||||||||||||||||||||||||||
| Vice President, International Sales, Corporate Secretary and Director |
2010 | 169,600 | 2,854 | — | — | — | — | 3,341 | (6) | 175,795 | ||||||||||||||||||||||||||
| 2009 | 168,800 | 4,754 | — | — | — | — | 3,261 | (6) | 176,815 | |||||||||||||||||||||||||||
| (1) | Amounts disclosed under “Bonus” reflect the cash bonuses earned by the named executive officers. |
| (2) | Restricted stock awards were issued to Charles Liang and Chiu-Chu (Sara) Liu Liang to exchange their exercised options during fiscal year 2009. The Company determined that there is no incremental fair value of the option exchanged for the award. |
| (3) | The dollar amount reported in the Option Awards column represents the grant date fair value of each award calculated in accordance with FASB ASC Topic 718, excluding the estimates of service-based forfeiture and using the Black Scholes option-pricing model. Assumptions used in the calculation of these amounts were included in Item 8, Financial Statements and Supplementary Data, and Note 11 of Notes to our audited Consolidated Financial Statements for the fiscal year 2011 included in our Annual Report on Form 10-K. |
| (4) | In accordance with the adopted SEC rules, the amounts previously reported in the “Option Awards” column for fiscal year 2010 and 2009 have been revised to reflect the grant date fair values of the awards granted in such years, as determined in accordance with FASB ASC Topic 718, excluding the effect of forfeitures. |
| (5) | The Company does not have a defined benefit plan or a non-qualified deferred compensation plan. |
| (6) | Amount reflects vacation and sick pay. |
99
Table of Contents
Grants of Plan-Based Awards
The following table provides information concerning all plan-based awards granted during fiscal year 2011 to our named executive officers:
GRANTS OF PLAN-BASED AWARDS
| Name |
Grant Date | Estimated Possible Payouts Under Non-Equity Incentive Plan Awards |
All Other Stock Awards: Number of Shares of Stock or Units (#) |
All Other Option Awards: Number of Securities Underlying Options (#) |
Exercise or Base Price of Option Awards ($/Sh) |
Grant Date Fair Value of Stock and Option Awards ($)(1) |
||||||||||||||||||||||||||
| Threshold ($) |
Target ($) |
Maximum ($) |
||||||||||||||||||||||||||||||
| Charles Liang |
4/25/2011 | — | — | — | — | 132,000 | (2) | $ | 18.59 | $ | 1,116,206 | |||||||||||||||||||||
| Howard Hideshima |
8/2/2010 | — | — | — | — | 10,886 | (3) | 13.61 | 66,503 | |||||||||||||||||||||||
| 8/2/2010 | — | — | — | — | 56,614 | (4) | 13.61 | 345,858 | ||||||||||||||||||||||||
| Phidias Chou |
— | — | — | — | — | — | — | — | ||||||||||||||||||||||||
| Chiu-Chu (Sara) Liu Liang |
— | — | — | — | — | — | — | — | ||||||||||||||||||||||||
| Yih-Shyan (Wally) Liaw |
8/2/2010 | — | — | — | — | 10,079 | (5) | 13.61 | 61,573 | |||||||||||||||||||||||
| 8/2/2010 | — | — | — | — | 7,671 | (6) | 13.61 | 46,863 | ||||||||||||||||||||||||
| (1) | Represents the fair value of each stock option and award as of the date of grant, computed in accordance with ASC Topic 718. |
| (2) | These non-qualified stock options vest at the rate of 25% on April 25, 2012 and 1/16th per quarter thereafter, such that the shares will be fully vested on April 25, 2015. |
| (3) | These incentive stock options vest at the rate of 25% on May 8, 2011 and 1/16th per quarter thereafter, such that the shares will be fully vested on May 8, 2014. |
| (4) | These non-qualified stock options vest at the rate of 25% on May 8, 2011 and 1/16th per quarter thereafter, such that the shares will be fully vested on May 8, 2014. |
| (5) | These incentive stock options vest at the rate of 25% on August 2, 2011 and 1/16th per quarter thereafter, such that the shares will be fully vested on August 2, 2014. |
| (6) | These non-qualified stock options vest at the rate of 25% on August 2, 2011 and 1/16th per quarter thereafter, such that the shares will be fully vested on August 2, 2014. |
100
Table of Contents
Outstanding Equity Awards at Fiscal Year-End 2011
The following table provides information concerning the outstanding equity-based awards as of June 30, 2011, and the option exercise price and expiration dates for each award, held by each of our named executive officers.
| Option Awards | Stock Awards | |||||||||||||||||||||||
| Name |
Number of Securities Underlying Unexercised Options (#) Exercisable |
Number of Securities Underlying Unexercised Options (#) Unexercisable |
Option Exercise Price ($) |
Option Expiration Date |
Number of shares or units of stock that have not vested (#) |
Market value of shares or units of stock that have not vested ($)(1) |
||||||||||||||||||
| Charles Liang |
600,000 | (2) | — | $ | 3.08 | 12/28/2014 | ||||||||||||||||||
| 450,000 | (3) | 270,000 | (3) | $ | 10.66 | 3/4/2019 | ||||||||||||||||||
| — | 132,000 | (4) | $ | 18.59 | 4/25/2021 | |||||||||||||||||||
| 538,923 | $ | 8,671,000 | ||||||||||||||||||||||
| Howard Hideshima |
19,198 | (5) | — | $ | 13.89 | 11/17/2016 | ||||||||||||||||||
| 110,802 | (5) | — | $ | 13.89 | 11/17/2016 | |||||||||||||||||||
| 32,500 | (6) | — | $ | 10.19 | 4/26/2017 | |||||||||||||||||||
| 9,926 | (7) | 9,927 | (7) | $ | 5.53 | 4/29/2019 | ||||||||||||||||||
| 6,073 | (7) | 16,074 | (7) | $ | 5.53 | 4/29/2019 | ||||||||||||||||||
| 14,153 | (8) | 42,461 | (8) | $ | 13.61 | 8/2/2020 | ||||||||||||||||||
| 2,721 | (8) | 8,165 | (8) | $ | 13.61 | 8/2/2020 | ||||||||||||||||||
| Phidias Chou |
54,000 | (9) | — | $ | 3.25 | 9/30/2015 | ||||||||||||||||||
| 11,250 | (7) | 11,250 | (7) | $ | 5.53 | 4/29/2019 | ||||||||||||||||||
| 13,574 | (10) | 17,456 | (10) | $ | 8.36 | 10/26/2019 | ||||||||||||||||||
| 8,298 | (10) | 10,672 | (10) | $ | 8.36 | 10/26/2019 | ||||||||||||||||||
| Chiu-Chu (Sara) Liu Liang |
200,000 | (11) | — | $ | 1.25 | 12/23/2012 | ||||||||||||||||||
| 64,800 | (12) | — | $ | 3.50 | 12/30/2015 | |||||||||||||||||||
| 10,150 | (7) | 10,150 | (7) | $ | 5.53 | 4/29/2019 | ||||||||||||||||||
| 7,355 | (13) | 12,260 | (13) | $ | 11.81 | 1/25/2020 | ||||||||||||||||||
| 7,869 | (13) | 13,116 | (13) | $ | 11.81 | 1/25/2020 | ||||||||||||||||||
| Yih-Shyan (Wally) Liaw |
90,000 | (14) | — | $ | 2.53 | 3/31/2014 | ||||||||||||||||||
| 24,890 | (15) | 5,745 | (15) | $ | 7.46 | 4/28/2018 | ||||||||||||||||||
| 24,598 | (15) | 5,677 | (15) | $ | 7.46 | 4/28/2018 | ||||||||||||||||||
| — | 10,079 | (16) | $ | 13.61 | 8/2/2020 | |||||||||||||||||||
| — | 7,671 | (16) | $ | 13.61 | 8/2/2020 | |||||||||||||||||||
| (1) | Market value based upon the closing price of our common stock of $16.09 on June 30, 2011 multiplied by the number of restricted stock awards. |
| (2) | Options vested at the rate of 25% on November 1, 2005 and 1/16th per quarter thereafter, such that the shares were fully vested on November 1, 2008. |
| (3) | Options vested at the rate of 25% on November 1, 2009 and 1/16th per quarter thereafter, such that the shares will be fully vested on November 1, 2012. |
| (4) | Options vest at the rate of 25% on April 25, 2012 and 1/16th per quarter thereafter, such that the shares will be fully vested on April 25, 2015. |
| (5) | Options vested at the rate of 25% on May 8, 2007 and 1/16th per quarter thereafter, such that the shares were fully vested on May 8, 2010. |
| (6) | Options vested at the rate of 25% on April 26, 2008 and 1/16th per quarter thereafter, such that the shares were fully vested on April 26, 2011. |
| (7) | Options vested at the rate of 25% on April 29, 2010 and 1/16th per quarter thereafter, such that the shares will be fully vested on April 29, 2013. |
101
Table of Contents
| (8) | Options vested at the rate of 25% on May 8, 2011 and 1/16th per quarter thereafter, such that the shares will be fully vested on May 8, 2014. |
| (9) | Options vested at the rate of 25% on July 1, 2006 and 1/16th per quarter thereafter, such that the shares were fully vested on July 1, 2009. |
| (10) | Options vested at the rate of 25% on July 1, 2010 and 1/16th per quarter thereafter, such that the shares will be fully vested on July 1, 2013. |
| (11) | Options vested at the rate of 25% on December 11, 2002 and 1/16th per quarter thereafter, such that the shares were fully vested on December 11, 2005. |
| (12) | Options vested at the rate of 25% on December 12, 2006 and 1/16th per quarter thereafter, such that the shares were fully vested on December 12, 2009. |
| (13) | Options vested at the rate of 25% on December 12, 2010 and 1/16th per quarter thereafter, such that the shares will be fully vested on December 12, 2013. |
| (14) | Options vested at the rate of 25% on March 30, 2005 and 1/16th per quarter thereafter, such that the shares were fully vested on March 30, 2008. |
| (15) | Options vested at the rate of 25% on March 30, 2009 and 1/16th per quarter thereafter, such that the shares will be fully vested on March 30, 2012. |
| (16) | Options vest at the rate of 25% on August 2, 2011 and 1/16th per quarter thereafter, such that the shares will be fully vested on August 2, 2014. |
Option Exercises and Stock Vested During Fiscal Year 2011
The following table sets forth the dollar amounts realized pursuant to the exercise or vesting of equity-based awards by our named executive officers during fiscal year 2011.
| Option Awards | Stock Awards | |||||||||||||||
| Name |
Number of Shares Acquired on Exercise (#) |
Value Realized on Exercise ($)(1) |
Number of Shares Acquired on Vesting (#) |
Value Realized on Vesting ($)(2) |
||||||||||||
| Charles Liang |
800,000 | $ | 11,020,000 | 179,641 | $ | 1,631,140 | ||||||||||
| Howard Hideshima |
10,000 | $ | 95,752 | — | $ | — | ||||||||||
| Phidias Chou |
27,000 | $ | 347,342 | — | $ | — | ||||||||||
| Chiu-Chu (Sara) Liu Liang |
120,000 | $ | 1,876,800 | 91,306 | $ | 956,887 | ||||||||||
| Yih-Shyan (Wally) Liaw |
226,000 | $ | 3,531,780 | — | $ | — | ||||||||||
| (1) | Based on the difference between the closing price of our common stock on the date of exercise and the exercise price. |
| (2) | The value is the closing price of our common stock on the date of vesting, multiplied by the number of shares vested. |
Director Compensation
Under our director compensation policy, we reimburse non-employee directors for reasonable expenses in connection with attendance at board and committee meetings. Our non-employee directors receive an annual retainer of $40,000, payable quarterly. In addition, the Chairperson of our Audit Committee receives an annual retainer of $25,000, the Chairperson of each of our Compensation Committee and Nominating and Corporate Governance Committee receives an annual retainer of $5,000 and each director serving in a non-chairperson capacity on our standing board committees receives an annual retainer of $2,500 per committee, payable quarterly.
Non-employee directors also are eligible to receive stock options under our 2006 Equity Incentive Plan. Non-employee directors receive nondiscretionary, automatic grants of nonstatutory stock options under our 2006 Equity Incentive Plan. A non-employee director is automatically granted an initial option to purchase 18,000 shares upon first becoming a member of our board of directors. A non-employee director serving as Chairperson of the Audit Committee receives an initial grant of an option to purchase 12,000 shares. Non-employee directors
102
Table of Contents
serving as Chairperson of the Compensation or Nominating and Corporate Governance Committees receive an initial grant of an option to purchase 2,000 shares. Each of these initial options vests and becomes exercisable over four years, with the first 25% of the shares subject to each initial option vesting on the first anniversary of the date of grant and the remainder vesting quarterly thereafter. Immediately after each of our annual meetings of stockholders, each non-employee director is automatically granted an option to purchase 4,500 shares of our common stock, the Audit Committee Chairperson is granted an annual option to purchase 3,000 shares of our common stock and the Chairperson of each of the Compensation and Nominating and Corporate Governance Committees is granted an annual option to purchase 500 shares of our common stock. These options will vest and become exercisable on the first anniversary of the date of grant or immediately prior to our annual meeting of stockholders, if earlier.
The options granted to non-employee directors have a per share exercise price equal to 100% of the fair market value of the underlying shares on the date of grant, and will become fully vested if we are subject to a change of control. Annual grants will be reduced proportionally if the person did not serve for the full year after the annual grant.
103
Table of Contents
The following table shows for the fiscal year ended June 30, 2011 certain information with respect to the compensation of all of our non-employee directors:
DIRECTOR COMPENSATION
| Name |
Fees Earned or Paid in Cash ($)(1) |
Stock Awards ($) |
Option Awards ($)(2) |
Non-Equity Incentive Plan Compensation ($) |
Change
in Pension Value and Non-qualified Deferred Compensation Earnings ($) |
All Other Compensation ($) |
Total ($) |
|||||||||||||||||||||
| Hwei-Ming (Fred) Tsai |
$ | 50,000 | — | $ | 36,626 | — | — | — | $ | 86,626 | ||||||||||||||||||
| Edward J. Hayes, Jr. |
$ | 65,000 | — | $ | 54,939 | — | — | — | $ | 119,939 | ||||||||||||||||||
| Sherman Tuan |
$ | 47,500 | — | $ | 36,626 | — | — | — | $ | 84,126 | ||||||||||||||||||
| Gregory K. Hinckley |
$ | 42,500 | — | $ | 32,963 | — | — | — | $ | 75,463 | ||||||||||||||||||
| (1) | This column represents annual director fees, non-employee committee chairman fees and other committee member fees earned in fiscal year 2011. |
| (2) | The dollar amount in this column represents the grant date fair value of each award calculated in accordance with FASB ASC Topic 718, excluding the estimates of service-based forfeiture and using the Black Scholes option-pricing model. Assumptions used in the calculation of these amounts were included in Item 8, Financial Statements and Supplementary Data, and Note 11 of Notes to our audited Consolidated Financial Statements for the fiscal year 2011 included in our Annual Report on Form 10-K. The table below sets forth the aggregate number of option awards held by our non-employee directors as of June 30, 2011. |
| Name |
Option Awards | |||
| Hwei-Ming (Fred) Tsai |
45,000 | |||
| Edward J. Hayes, Jr. |
60,000 | |||
| Sherman Tuan |
39,500 | |||
| Gregory K. Hinckley |
31,500 | |||
| Item 12. | Security Ownership of Certain Beneficial Owners and Management and Related Stockholder Matters |
Security Ownership of Certain Beneficial Owners and Management
The following table sets forth certain information known to us regarding beneficial ownership of our common stock as of August 22, 2011 by:
| • | each of the named executive officers; |
| • | each of our directors; and |
| • | all directors and executive officers as a group. |
We do not know of any person or entity who beneficially owns more than 5% of our outstanding common stock as of August 22, 2011 except for the named executive officers and directors.
104
Table of Contents
| Name and Address of Beneficial Owner(1) |
Amount and Nature of Beneficial Ownership(2) |
Percent of Common Stock Outstanding(3) |
||||||
| Executive Officers and Directors: |
||||||||
| Charles Liang(4) |
9,822,659 | 23.2 | % | |||||
| Howard Hideshima(5) |
202,840 | * | ||||||
| Phidias Chou(5) |
94,778 | * | ||||||
| Chiu-Chu (Sara) Liang(6) |
9,822,659 | 23.2 | % | |||||
| Yih-Shyan (Wally) Liaw(7) |
3,448,067 | 8.4 | % | |||||
| Hwei-Ming (Fred) Tsai(8) |
369,125 | * | ||||||
| Edward J. Hayes, Jr.(5) |
52,500 | * | ||||||
| Sherman Tuan(5) |
34,125 | * | ||||||
| Gregory K. Hinckley(5) |
20,250 | * | ||||||
| All directors and executive officers as a group (9 persons)(9) |
14,044,344 | 32.8 | % | |||||
| * | Represents beneficial ownership of less than one percent of the outstanding shares of common stock. |
| (1) | Except as otherwise indicated, to our knowledge the persons named in this table have sole voting and investment power with respect to all shares of Common Stock shown as beneficially owned by them, subject to community property laws applicable and to the information contained in the footnotes to this table. |
| (2) | Under the SEC rules, a person is deemed to be the beneficial owner of shares that can be acquired by such person within 60 days upon the exercise of options. |
| (3) | Calculated on the basis of 40,864,327 shares of Common Stock outstanding as of August 22, 2011, provided that any additional shares of Common Stock that a stockholder has the right to acquire within 60 days after August 22, 2011 are deemed to be outstanding for the purposes of calculating that stockholder’s percentage of beneficial ownership. |
| (4) | Includes 1,095,000 shares issuable upon the exercise of options exercisable within 60 days after August 22, 2011. Also includes 3,392,468 shares jointly held by Mr. Liang and his spouse, 29,000 shares held by Green Earth Charitable Trust, for which Mrs. Liang serves as trustee, 4,500 shares held by Mr. Liang’s daughter, 18,000 shares held by Mr. Liang’s children, for which Mrs. Liang serves as custodian, 479,121 shares held directly by Mrs. Liang and 293,979 shares issuable upon the exercise of options held by Mrs. Liang and exercisable within 60 days after August 22, 2011. See footnote 6. |
| (5) | Consists of shares issuable upon the exercise of options exercisable within 60 days after August 22, 2011. |
| (6) | Includes 293,979 shares issuable upon the exercise of options exercisable within 60 days after August 22, 2011. Also includes 29,000 shares held by Green Earth Charitable Trust, 4,500 shares held by Mrs. Liang’s daughter, 18,000 shares held by Mrs. Liang’s children, for which Mrs. Liang serves as custodian, 4,510,591 shares held by Charles Liang, Mrs. Liang’s spouse, and 1,095,000 shares issuable upon the exercise of options held by Mr. Liang and exercisable within 60 days after August 22, 2011. See footnote 4. |
| (7) | Includes 147,731 shares issuable upon the exercise of options exercisable within 60 days after August 22, 2011. 3,208,279 shares held by Liaw Family Trust, for which Mr. Liaw and his spouse serve as trustees, 8,400 shares held by Mr. Liaw’s daughters, 69,807 shares held by Mrs. Liaw, and 13,850 shares issuable upon the exercise of options granted to Mrs. Liaw, exercisable within 60 days after August 22, 2011. |
| (8) | Includes 40,000 shares issuable upon the exercise of options exercisable within 60 days after August 22, 2011. Also includes 295,000 shares held by Tsai Family Trust, for which Mr. Hwei Ming (Fred) Tsai and his spouse serve as trustees. |
| (9) | Includes 1,995,053 shares issuable upon the exercise of options exercisable within 60 days after August 22, 2011. |
105
Table of Contents
Equity Compensation Plan Information
We currently maintain two compensation plans that provide for the issuance of our Common Stock to officers and other employees, directors and consultants. These consist of the 1998 Stock Option Plan and the 2006 Equity Incentive Plan, both of which have been approved by our stockholders. We no longer grant any options under the 1998 Stock Option Plan. The following table sets forth information regarding outstanding options and shares reserved and remaining available for future issuance under the foregoing plans as of June 30, 2011:
| Plan Category |
Number of shares to be issued upon exercise of outstanding options, warrants and rights (a) |
Weighted-average exercise price of outstanding options, warrants and rights (b) |
Number of shares remaining available for future issuance under equity compensation plans (excluding shares reflected in column (a)) (c) |
|||||||||
| Equity compensation plans approved by stockholders |
10,480,785 | $ | 8.86 | 1,714,290 | (1) | |||||||
| Equity compensation plans not approved by stockholders |
— | — | — | |||||||||
|
|
|
|
|
|||||||||
| Total |
10,480,785 | $ | 8.86 | 1,714,290 | ||||||||
|
|
|
|
|
|||||||||
| (1) | The number of shares that are reserved for issuance under the 2006 Equity Incentive Plan are automatically increased on July 1 of each year through 2016 by a number of shares equal to the smaller of (a) 3% of our outstanding shares as of the close of business on the immediately preceding June 30 or (b) a lesser amount determined by the board of directors. In January 2011, the Board of Directors approved an amendment to the 2006 Equity Incentive Plan that increases by 2,000,000 the aggregate maximum number of shares that may be issued under the 2006 Plan. The amendment to the 2006 Plan was approved by our stockholders in February 2011. |
| Item 13. | Certain Relationships and Related Transactions and Director Independence |
CERTAIN RELATIONSHIPS AND RELATED TRANSACTIONS AND DIRECTOR INDEPENDENCE
Procedures for Approval of Related Person Transactions
Pursuant to our Audit Committee charter, the Audit Committee has the responsibility for the review, approval or ratification of any related person transactions; provided that if the matter or transaction involves employment or compensation terms for services to our company, including retention or payment provisions relating to expert services, then it is presented to the Compensation Committee. In approving or rejecting a proposed transaction, our Audit Committee will consider the relevant facts and circumstances available and deemed relevant, including, but not limited to the risks, costs and benefits to us, the terms of the transaction, the availability of other sources for comparable services or products, and, if applicable, the impact on a director’s independence. Our Audit Committee shall approve only those transactions that, in light of known circumstances are not inconsistent with the Company’s best interests, as the Audit Committee determines in the good faith exercise of its discretion. In addition, we annually require each of our directors and executive officers to complete a directors’ and officers’ questionnaire that elicits information about related party transactions as such term is defined by SEC rules and regulations. These procedures are intended to determine whether any such related party transaction impairs the independence of a director or presents a conflict of interest on the part of a director, employee or officer.
106
Table of Contents
Transactions with Related Parties, Promoters and Certain Control Persons
Director and Officer Indemnification
We have entered into agreements to indemnify our directors and executive officers to the fullest extent permitted under Delaware law. In addition, our certificate of incorporation contains provisions limiting the liability of our directors and our bylaws contain provisions requiring us to indemnify our officers and directors.
Stock Option Awards
Please see the “Grants of Plan-Based Awards” table and the “Director Compensation” table above for information on stock option grants to our directors and named executive officers in fiscal 2011.
Transactions with Ablecom Technology Inc.
Ablecom Technology Inc.—Ablecom, a Taiwan corporation, together with one of its subsidiaries, Compuware (collectively “Ablecom”), is one of our major contract manufacturers. Ablecom’s ownership of Compuware is below 50% but Compuware remains a related party as Ablecom still has significant influence over the operations. Ablecom’s chief executive officer, Steve Liang, is the brother of Charles Liang, our President, Chief Executive Officer and Chairman of the Board of Directors, and owns approximately 1.1% of our common stock. Charles Liang served as a Director of Ablecom during our fiscal 2006, but is no longer serving in such capacity. In addition, Charles Liang and his wife, also an officer of us, collectively own approximately 10.5% of Ablecom , while Steve Liang and other family members own approximately 35.9% of Ablecom at June 30, 2011 and 2010.
We have product design and manufacturing services agreements (“product design and manufacturing agreements”) and a distribution agreement (“distribution agreement”) with Ablecom.
Under the product design and manufacturing agreements, we outsource a portion of its design activities and a significant part of its manufacturing of components such as server chassis to Ablecom. Ablecom agrees to design products according to our specifications. Additionally, Ablecom agrees to build the tools needed to manufacture the products. Under the product design and manufacturing agreements, we commit to purchase a minimum quantity over a set period. The purchase price of the products manufactured by Ablecom is negotiated on a purchase order by purchase order basis at each purchase date. However, a fixed charge is added to the price of each unit purchased until the agreed minimum number of units is purchased. In August 2007, we entered into a new product development, manufacturing and service agreement with Ablecom. Under the new agreement, we have agreed to pay for the cost of blade server tooling and engineering services and will pay for those items when the work has been completed. In this case no fixed charge is added to future purchases for reimbursement of tooling costs. In September 2009, we entered into a similar product development agreement with Ablecom. Under this agreement, we have agreed to pay for the cost of chassis and related product tooling and engineering services and will pay for those items when the work has been completed. In this case no fixed charge is added to future purchases for reimbursement of tooling costs.
Under the distribution agreement, Ablecom purchases server products from us for distribution in Taiwan. We believe that the pricing and terms under the distribution agreement are similar to the pricing and terms of distribution arrangements we have with similar, third party distributors.
Ablecom’s net sales to us and its net sales of our products to others comprise a substantial majority of Ablecom’s net sales. For fiscal year 2011, 2010 and 2009, we purchased products from Ablecom totaling $155,430,000, $124,466,000 and $91,954,000. For fiscal year 2011, 2010 and 2009, we sold products to Ablecom totaling $11,017,000, $10,190,000 and $6,025,000, respectively.
107
Table of Contents
Amounts owed to us by Ablecom as of June 30, 2011 and 2010, were $527,000 and $1,201,000, respectively. Amounts owed to Ablecom by us as of June 30, 2011 and 2010, were $34,210,000 and $19,464,000, respectively. Historically, we have paid Ablecom the majority of invoiced dollars between 53 and 100 days of invoice. For the years ended June 30, 2011, 2010 and 2009, we received $55,000, $164,000 and $2,000, respectively, from Ablecom for penalty charges and paid $4,052,000 $3,352,000 and $2,918,000, respectively, in tooling assets and miscellaneous costs to Ablecom. Penalty charges are assessments relating to delayed deliveries or quality issues.
Our exposure to loss as a result of its involvement with Ablecom is limited to (a) potential losses on its purchase orders in the event of an unforeseen decline in the market price and/or demand of our products such that we incur a loss on the sale or cannot sell the products and (b) potential losses on outstanding accounts receivable from Ablecom in the event of an unforeseen deterioration in the financial condition of Ablecom such that Ablecom defaults on its payable to us. Outstanding purchase orders with Ablecom were $38,326,000 and $35,266,0000 at June 30, 2011 and 2010, respectively, representing the maximum exposure to loss relating to (a) above. We do not have any direct or indirect guarantees of losses of Ablecom.
In fiscal year 2011, Ablecom paid for a land deposit in Taiwan on behalf of the Company in the amount of $4,510,000 which the Company repaid Ablecom in March 2011. The amount paid to Ablecom of $4,510,000 represented Ablecom’s cost and the fair market value of the land.
| Item 14. | Principal Accounting Fees and Services |
The Audit Committee appointed Deloitte & Touche LLP as our independent registered public accounting firm for the fiscal year 2011.
Independent Registered Public Accounting Firm Fees and Services
The following table sets forth the aggregate audit fees billed to us by our independent registered public accounting firm, Deloitte & Touche LLP, the member firms of Deloitte Touche Tohmatsu, and their respective affiliates (collectively, “Deloitte”), and fees paid to Deloitte for services in the fee categories indicated below during the fiscal years 2011 and 2010. The Audit Committee has considered the scope and fee arrangements for all services provided by Deloitte, taking into account whether the provision of non-audit services is compatible with maintaining Deloitte’s independence, and has pre-approved 100% of the services described below.
| Fiscal Year Ended 6/30/11 |
Fiscal Year Ended 6/30/10 |
|||||||
| Audit Fees(1) |
$ | 1,190,000 | $ | 1,063,000 | ||||
| Audit-Related Fees |
— | — | ||||||
| Tax Fees |
— | — | ||||||
| All Other Fees |
— | — | ||||||
|
|
|
|
|
|||||
| Total |
$ | 1,190,000 | $ | 1,063,000 | ||||
|
|
|
|
|
|||||
| (1) | Audit fees consist of the aggregate fees for professional services rendered for the audit of our fiscal 2011 and 2010 consolidated financial statements, review of interim consolidated financial statements and certain statutory audits. |
Audit Committee Pre-Approval Policies and Procedures
The Audit Committee’s policy on approval of services performed by the independent registered public accounting firm is to pre-approve all audit and permissible non-audit services to be provided by the independent registered public accounting firm during the fiscal year. The Audit Committee reviews each non-audit service to be provided and assesses the impact of the service on the firm’s independence.
108
Table of Contents
PART IV
| Item 15. | Exhibits and Financial Statement Schedules |
(a) 1. Financial Statements
See Index to Consolidated Financial Statements in Item 8 of this Annual Report on Form 10-K, which is incorporated herein by reference.
2. Financial Statement Schedules
All other financial statement schedules have been omitted because they are either not applicable or the required information is shown in the consolidated financial statements or notes thereto.
3. Exhibits
See the Exhibit Index which follows the signature page of this Annual Report on Form 10-K, which is incorporated herein by reference.
(b) Exhibits
See Item 15(a)(3) above.
(c) Financial Statement Schedules
See Item 15(a)(2) above.
109
Table of Contents
Pursuant to the requirements of Section 13 or 15(d) of the Securities Exchange Act of 1934, as amended, the registrant has duly caused this report to be signed on its behalf by the undersigned, thereunto duly authorized.
SUPER MICRO COMPUTER, INC.
| Date: September 2, 2011 |
/s/ CHARLES LIANG | |||
| Charles Liang President, Chief Executive Officer and Chairman of the (Principal Executive Officer) |
110
Table of Contents
POWER OF ATTORNEY
KNOW ALL PERSONS BY THESE PRESENTS, that each person whose signature appears below constitutes and appoints Charles Liang and Howard Hideshima, jointly and severally, his attorney-in-fact, each with the full power of substitution, for such person, in any and all capacities, to sign any and all amendments to this Annual Report on Form 10-K, and to file the same, with all exhibits thereto and other documents in connection therewith, with the Securities and Exchange Commission, granting unto said attorney-in-fact and agent full power and authority to do and perform each and every act and thing requisite and necessary to be done in connection therewith, as fully to all intents and purposes as he might do or could do in person hereby ratifying and confirming all that each of said attorneys-in-fact and agents, or his substitute, may do or cause to be done by virtue hereof.
Pursuant to the requirements of the Securities Exchange Act of 1934, this report has been signed below by the following persons on behalf of the registrant and in the capacities indicated and on the dates indicated.
| Signature |
Title |
Date | ||
| /s/ CHARLES LIANG Charles Liang |
President, Chief Executive Officer and Chairman of the Board (Principal Executive Officer) | September 2, 2011 | ||
| /s/ HOWARD HIDESHIMA Howard Hideshima |
Chief Financial Officer (Principal Financial and Accounting Officer) | September 2, 2011 | ||
| /s/ CHIU-CHU (SARA) LIU LIANG Chiu-Chu (Sara) Liu Liang |
Vice President of Operations, Treasurer and Director | September 2, 2011 | ||
| /s/ YIH-SHYAN (WALLY) LIAW Yih-Shyan (Wally) Liaw |
Vice President of International Sales, Secretary and Director | September 2, 2011 | ||
| /s/ HWEI-MING (FRED) TSAI Hwei-Ming (Fred) Tsai |
Director | September 2, 2011 | ||
| /s/ EDWARD J. HAYES , JR Edward J. Hayes, Jr |
Director | September 2, 2011 | ||
| /s/ SHERMAN TUAN Sherman Tuan |
Director | September 2, 2011 | ||
| /s/ GREGORY K. HINCKLEY Gregory K. Hinckley |
Director | September 2, 2011 | ||
111
Table of Contents
EXHIBIT INDEX
| Exhibit |
Description | |
| 3.3 | Amended and Restated Certificate of Incorporation of Super Micro Computer, Inc.(1) | |
| 3.4 | Amended and Restated Bylaws of Super Micro Computer, Inc.(1) | |
| 4.1 | Specimen stock certificate for shares of common stock of Super Micro Computer, Inc.(1) | |
| 10.1* | 1998 Stock Option Plan, as amended(1) | |
| 10.2* | Form of Incentive Stock Option Agreement under 1998 Stock Option Plan(1) | |
| 10.3* | Form of Nonstatutory Stock Option Agreement under 1998 Stock Option Plan(1) | |
| 10.4* | Form of Nonstatutory Stock Option Agreement outside the 1998 Stock Option Plan(1) | |
| 10.5* | 2006 Equity Incentive Plan(1) | |
| 10.6* | Form of Option Agreement under Super Micro Computer, Inc. 2006 Equity Incentive Plan(1) | |
| 10.7* | Form of Restricted Stock Agreement under Super Micro Computer, Inc. 2006 Equity Incentive Plan(1) | |
| 10.8* | Form of Restricted Stock Unit Agreement under Super Micro Computer, Inc. 2006 Equity Incentive Plan(1) | |
| 10.9* | Form of directors’ and officers’ Indemnity Agreement(1) | |
| 10.10* | Offer Letter for Chiu-Chu (Sara) Liu Liang(1) | |
| 10.11* | Offer Letter for Alex Hsu(1) | |
| 10.12* | Offer Letter for Howard Hideshima(1) | |
| 10.13* | Director Compensation Policy(1) | |
| 10.14 | Product Manufacturing Agreement dated January 8, 2007 between Super Micro Computer, Inc. and Ablecom Technology Inc.(1) | |
| 10.15* | Form of Notice of Grant of Stock Option under 2006 Equity Incentive Plan(2) | |
| 10.16* | Form of Notice of Grant of Restricted Stock under 2006 Equity Incentive Plan(2) | |
| 10.17* | Form of Notice of Grant of Restricted Stock Unit under 2006 Equity Incentive Plan(2) | |
| 10.18 | Agreement of Purchase and Sale(3) | |
| 10.19* | Stock Option Exercise Notice and Restricted Stock Purchase Agreement—Charles Liang(4) | |
| 10.20* | Stock Option Exercise Notice and Restricted Stock Purchase Agreement—Chiu-Chu Liang(5) | |
| 10.21* | Stock Option Exercise Notice and Restricted Stock Purchase Agreement—Shiow-Meei Liaw(5) | |
| 10.22 | Agreement of Purchase and Sale of Properties on Fox Lane and Fox Drive, San Jose, California(6) | |
| 10.23 | Business Loan Agreement dated as of June 17, 2010, by and between Super Micro Computer, Inc. and Bank of America(7) | |
| 10.24* | 2006 Equity Incentive Plan, as amended(8) | |
| 21.1 | Subsidiaries of Super Micro Computer, Inc.(1) | |
| 23.1+ | Consent of Independent Registered Public Accounting Firm | |
| 24.1+ | Power of Attorney (included in signature pages) | |
| 31.1+ | Certification of Charles Liang, President and CEO Pursuant to Section 302 of the Sarbanes-Oxley Act of 2002 | |
Table of Contents
| Exhibit |
Description | |
| 31.2+ | Certification of Howard Hideshima, CFO and Secretary Pursuant to Section 302 of the Sarbanes-Oxley Act of 2002 | |
| 32.1+ | Certification of Charles Liang, President and CEO Pursuant to Section 906 of the Sarbanes-Oxley Act of 2002(9) | |
| 32.2+ | Certification of Howard Hideshima, CFO and Secretary Pursuant to Section 906 of the Sarbanes-Oxley Act of 2002(9) | |
| + | Filed herewith |
| (1) | Incorporated by reference to the same number exhibit filed with the Registrant’s Registration Statement on Form S-1 (Registration No. 333-138370), declared effective by the Securities and Exchange Commission on March 28, 2007. |
| (2) | Incorporated by reference to the Company’s Registration Statement on Form S-8 (Commission File No. 333-142404) filed with the Securities and Exchange Commission on April 27, 2007. |
| (3) | Incorporated by reference to Exhibit 10.1 from the Company’s current report on Form 8-K (Commission File No. 001-33383) filed with the Securities and Exchange Commission on June 29, 2007. |
| (4) | Incorporated by reference to the Company’s Annual Report on Form 10-K (Commission File No. 001-33383) filed with the Securities and Exchange Commission on September 2, 2008. |
| (5) | Incorporated by reference to the Company’s current report on Form 8-K (Commission File No. 001-33383) filed with the Securities and Exchange Commission on December 2, 2008. |
| (6) | Incorporated by reference to the Company’s Quarterly Report on Form 10-Q (Commission File No. 001-33383) filed with the Securities and Exchange Commission on May 7, 2010. |
| (7) | Incorporated by reference to Exhibit 10.34 from the Company’s Annual Report on Form 10-K (Commission File No. 011-33383) filed with the Securities and Exchange Commission on September 7, 2010. |
| (8) | Incorporated by reference to Appendix A from the Company’s Definitive Proxy Statement on Schedule 14A (Commission File No. 011-33383) filed with the Securities and Exchange Commission on January 18, 2011. |
| (9) | The certifications attached as Exhibit 32.1 and 32.2 accompany the Annual Report on Form 10-K pursuant to Section 906 of the Sarbanes-Oxley Act of 2002 and shall not be deemed “filed” by Super Micro Computer, Inc. for purposes of Section 18 of the Securities Exchange Act of 1934, as amended. |
| * | Management contract, or compensatory plan or arrangement |