Attached files
| file | filename |
|---|---|
| 8-K - FORM 8-K - MEDCO HEALTH SOLUTIONS INC | c94944e8vk.htm |
Exhibit 99.1
| Strategy Jefferies 2010 Global Healthcare Services Conference Brian T. Griffin Group President, Health Plans Execution Results |
| Forward-Looking Statements This presentation contains "forward-looking statements" as that term is defined in the Private Securities Litigation Reform Act of 1995. These statements involve risks and uncertainties that may cause results to differ materially from those set forth in the statements. No forward-looking statement can be guaranteed, and actual results may differ materially from those projected. We undertake no obligation to publicly update any forward-looking statement, whether as a result of new information, future events or otherwise. The forward-looking statements are not historical facts, but rather are based on current expectations, estimates, assumptions and projections about the business and future financial results of the pharmacy benefit management ("PBM") and specialty pharmacy industries, and other legal, regulatory and economic developments. We use words such as "anticipates," "believes," "plans," "expects," "projects," "future," "intends," "may," "will," "should," "could," "estimates," "predicts," "potential," "continue," "guidance" and similar expressions to identify these forward-looking statements. Medco's actual results could differ materially from the results contemplated by these forward-looking statements due to a number of factors. Forward-looking statements in this presentation should be evaluated together with the risks and uncertainties that affect our business, particularly those mentioned in the Risk Factors section of the Company's Annual Report on Form 10-K, Quarterly Reports on Form 10-Q and other documents filed from time to time with the Securities and Exchange Commission. |
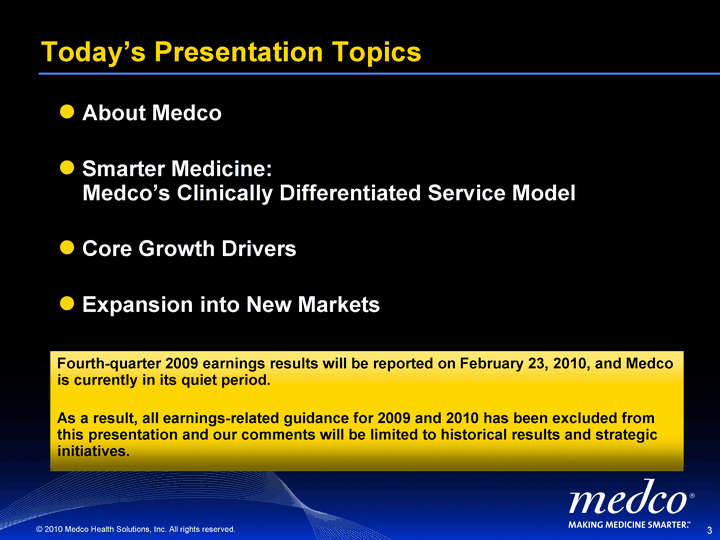
| Today's Presentation Topics About Medco Smarter Medicine: Medco's Clinically Differentiated Service Model Core Growth Drivers Expansion into New Markets Fourth-quarter 2009 earnings results will be reported on February 23, 2010, and Medco is currently in its quiet period. As a result, all earnings-related guidance for 2009 and 2010 has been excluded from this presentation and our comments will be limited to historical results and strategic initiatives. |
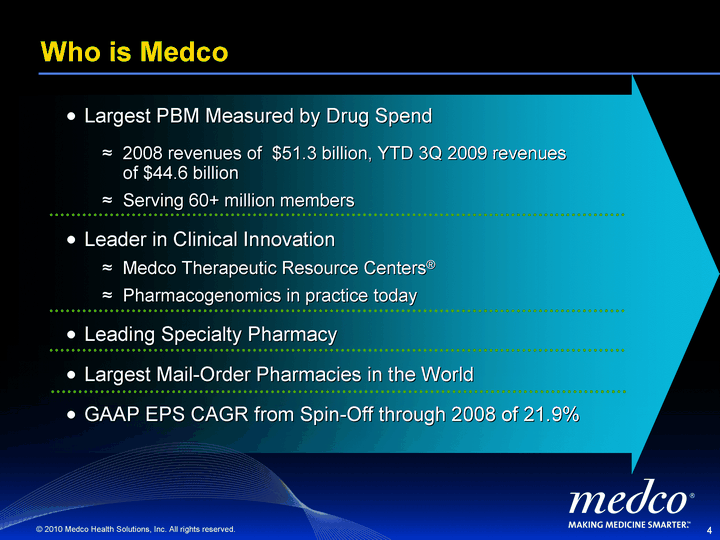
| Who is Medco Largest PBM Measured by Drug Spend 2008 revenues of $51.3 billion, YTD 3Q 2009 revenues of $44.6 billion Serving 60+ million members Leader in Clinical Innovation Medco Therapeutic Resource Centers(r) Pharmacogenomics in practice today Leading Specialty Pharmacy Largest Mail-Order Pharmacies in the World GAAP EPS CAGR from Spin-Off through 2008 of 21.9% |
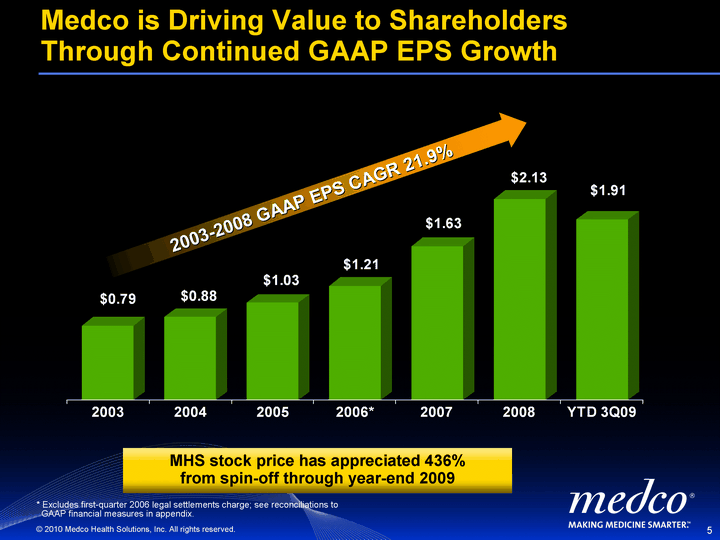
| 2003 2004 2005 2006* 2007 2008 YTD 3Q09 2010E GAAP EPS 0.79 0.88 1.03 1.21 1.63 2.13 1.91 3.1 Medco is Driving Value to Shareholders Through Continued GAAP EPS Growth * Excludes first-quarter 2006 legal settlements charge; see reconciliations to GAAP financial measures in appendix. 2003-2008 GAAP EPS CAGR 21.9% MHS stock price has appreciated 436% from spin-off through year-end 2009 |
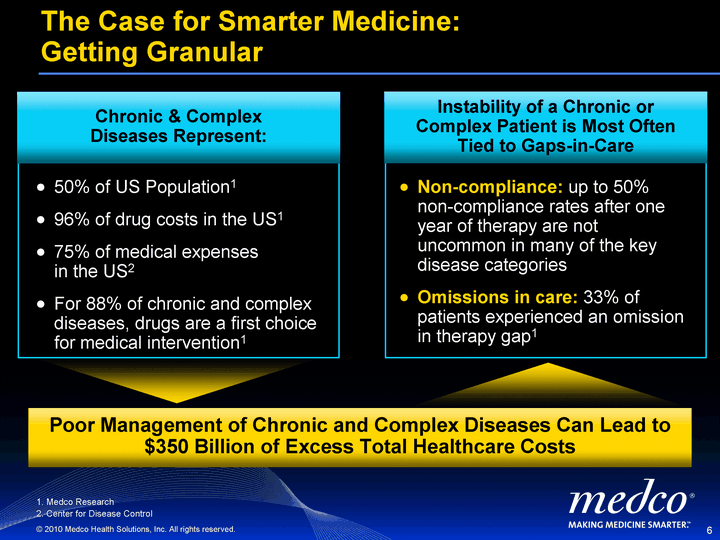
| The Case for Smarter Medicine: Getting Granular Poor Management of Chronic and Complex Diseases Can Lead to $350 Billion of Excess Total Healthcare Costs 1. Medco Research 2. Center for Disease Control 50% of US Population1 96% of drug costs in the US1 75% of medical expenses in the US2 For 88% of chronic and complex diseases, drugs are a first choice for medical intervention1 Chronic & Complex Diseases Represent: Non-compliance: up to 50% non-compliance rates after one year of therapy are not uncommon in many of the key disease categories Omissions in care: 33% of patients experienced an omission in therapy gap1 Instability of a Chronic or Complex Patient is Most Often Tied to Gaps-in-Care |
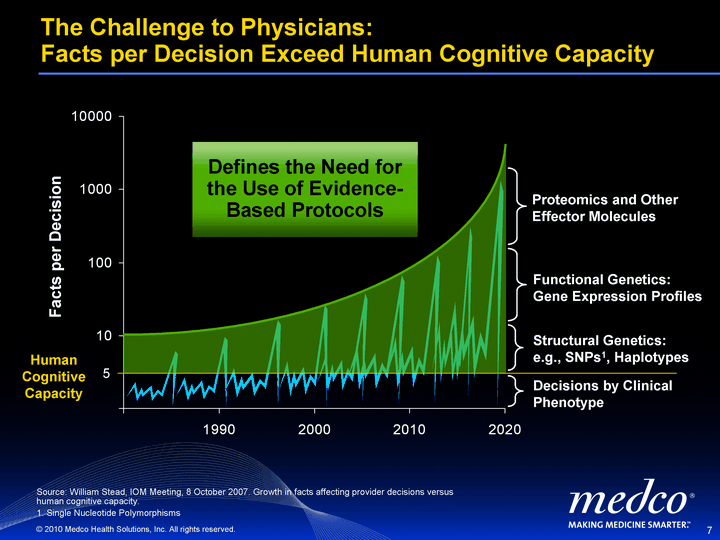
| The Challenge to Physicians: Facts per Decision Exceed Human Cognitive Capacity Source: William Stead, IOM Meeting, 8 October 2007. Growth in facts affecting provider decisions versus human cognitive capacity. 1. Single Nucleotide Polymorphisms Facts per Decision Structural Genetics: e.g., SNPs1, Haplotypes Functional Genetics: Gene Expression Profiles Proteomics and Other Effector Molecules Defines the Need for the Use of Evidence- Based Protocols 5 Human Cognitive Capacity Decisions by Clinical Phenotype |
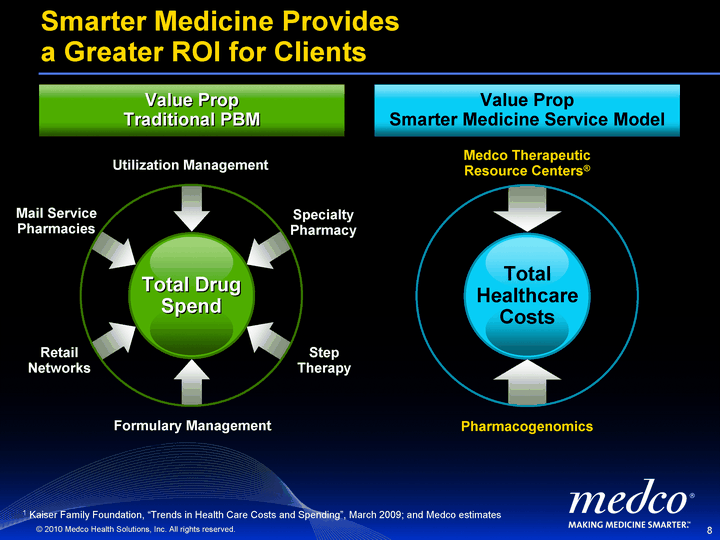
| Total Drug Spend Smarter Medicine Provides a Greater ROI for Clients Value Prop Traditional PBM Utilization Management Mail Service Pharmacies Formulary Management Step Therapy Retail Networks Specialty Pharmacy Value Prop Smarter Medicine Service Model Medco Therapeutic Resource Centers(r) 1 Kaiser Family Foundation, "Trends in Health Care Costs and Spending", March 2009; and Medco estimates Total Healthcare Costs Total Drug Spend Total Drug Spend Pharmacogenomics |
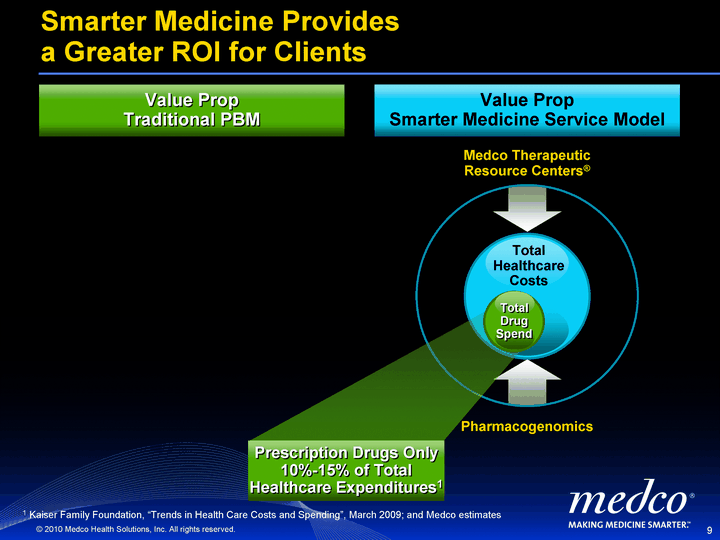
| Smarter Medicine Provides a Greater ROI for Clients Value Prop Traditional PBM Value Prop Smarter Medicine Service Model Medco Therapeutic Resource Centers(r) 1 Kaiser Family Foundation, "Trends in Health Care Costs and Spending", March 2009; and Medco estimates Total Healthcare Costs Prescription Drugs Only 10%-15% of Total Healthcare Expenditures1 Total Drug Spend Pharmacogenomics |
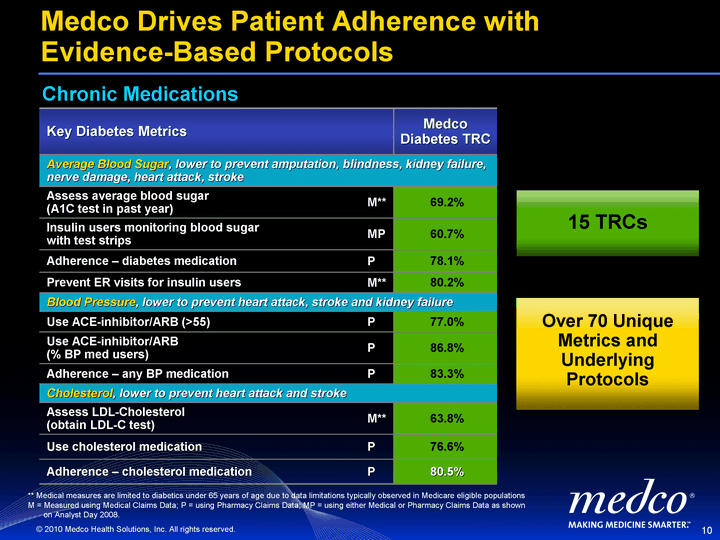
| Medco Drives Patient Adherence with Evidence-Based Protocols ** Medical measures are limited to diabetics under 65 years of age due to data limitations typically observed in Medicare eligible populations M = Measured using Medical Claims Data; P = using Pharmacy Claims Data; MP = using either Medical or Pharmacy Claims Data as shown on Analyst Day 2008. Key Diabetes Metrics Key Diabetes Metrics Medco Diabetes TRC Average Blood Sugar, lower to prevent amputation, blindness, kidney failure, nerve damage, heart attack, stroke Average Blood Sugar, lower to prevent amputation, blindness, kidney failure, nerve damage, heart attack, stroke Average Blood Sugar, lower to prevent amputation, blindness, kidney failure, nerve damage, heart attack, stroke Assess average blood sugar (A1C test in past year) M** 69.2% Insulin users monitoring blood sugar with test strips MP 60.7% Adherence - diabetes medication P 78.1% Prevent ER visits for insulin users M** 80.2% Blood Pressure, lower to prevent heart attack, stroke and kidney failure Blood Pressure, lower to prevent heart attack, stroke and kidney failure Blood Pressure, lower to prevent heart attack, stroke and kidney failure Use ACE-inhibitor/ARB (>55) P 77.0% Use ACE-inhibitor/ARB (% BP med users) P 86.8% Adherence - any BP medication P 83.3% Cholesterol, lower to prevent heart attack and stroke Cholesterol, lower to prevent heart attack and stroke Cholesterol, lower to prevent heart attack and stroke Assess LDL-Cholesterol (obtain LDL-C test) M** 63.8% Use cholesterol medication P 76.6% Adherence - cholesterol medication P 80.5% 15 TRCs Over 70 Unique Metrics and Underlying Protocols Chronic Medications |
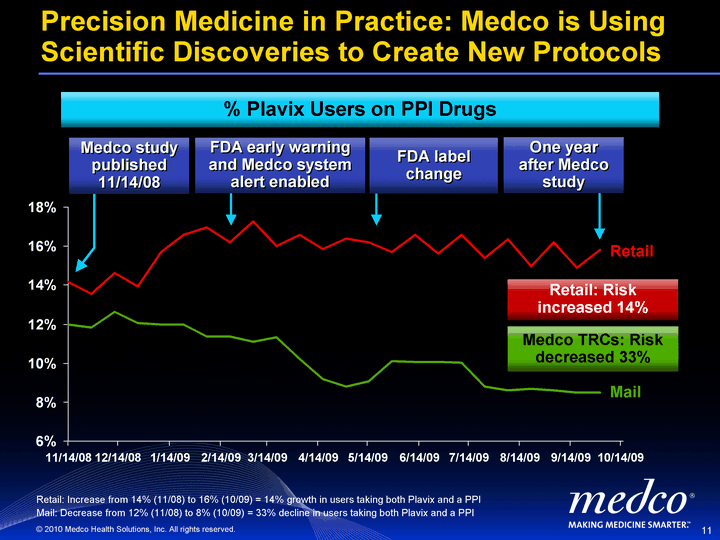
| Precision Medicine in Practice: Medco is Using Scientific Discoveries to Create New Protocols % Plavix Users on PPI Drugs Medco study published 11/14/08 FDA early warning and Medco system alert enabled FDA label change One year after Medco study Mail Retail 11/14/08 11/28/08 12/14/08 12/28/08 1/14/09 1/28/09 2/14/09 2/28/09 3/14/09 3/28/09 4/14/09 4/28/09 5/14/09 5/28/09 6/14/09 6/28/09 7/14/09 7/28/09 8/14/09 8/28/09 9/14/09 9/28/09 10/14/09 East 0.1417 0.1357 0.1461 0.1395 0.1569 0.1657 0.1698 0.1621 0.1728 0.1602 0.1657 0.1585 0.164 0.1621 0.1569 0.1657 0.1561 0.166 0.1539 0.1635 0.1497 0.1621 0.1489 0.158 West 0.1197 0.1181 0.1263 0.1206 0.12 0.12 0.1137 0.1137 0.1109 0.1131 0.1021 0.0919 0.0878 0.0908 0.101 0.1007 0.1007 0.1002 0.0878 0.0859 0.087 0.0859 0.0848 0.0848 11/14/08 12/14/08 1/14/09 2/14/09 3/14/09 4/14/09 5/14/09 6/14/09 7/14/09 8/14/09 9/14/09 10/14/09 Medco TRCs: Risk decreased 33% Retail: Risk increased 14% Retail: Increase from 14% (11/08) to 16% (10/09) = 14% growth in users taking both Plavix and a PPI Mail: Decrease from 12% (11/08) to 8% (10/09) = 33% decline in users taking both Plavix and a PPI |
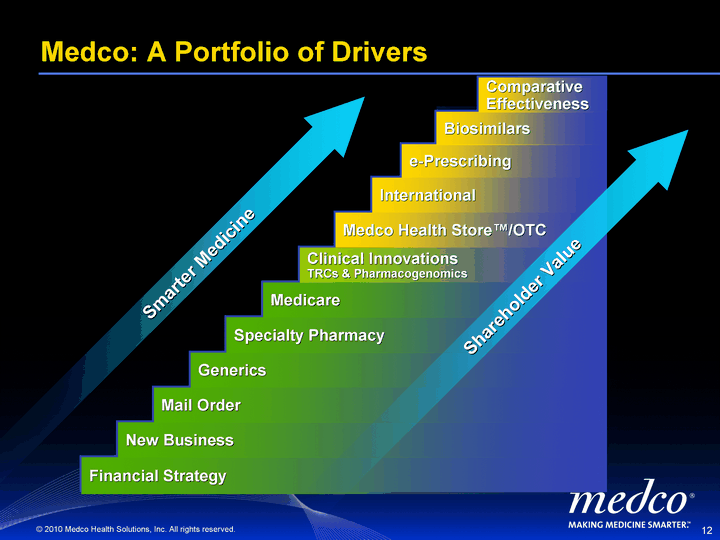
| Financial Strategy New Business Mail Order Generics Specialty Pharmacy Medicare Clinical Innovations TRCs & Pharmacogenomics Medco Health Store(tm)/OTC International e-Prescribing Biosimilars Medco: A Portfolio of Drivers Shareholder Value Smarter Medicine Comparative Effectiveness |
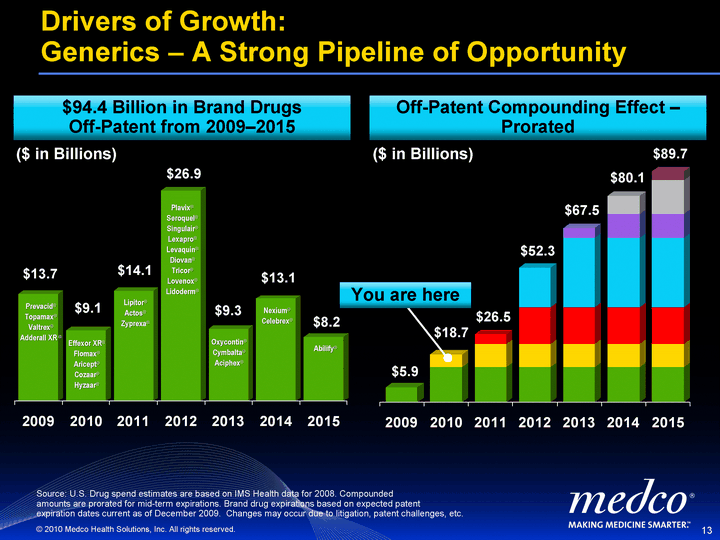
| 2009 2010 2011 2012 2013 2014 2015 Acute Chronic/Complex 13.7 9.1 14.1 26.9 9.3 13.1 8.2 Drivers of Growth: Generics - A Strong Pipeline of Opportunity Prevacid(r) Topamax(r) Valtrex(r) Adderall XR (r) Effexor XR(r) Flomax(r) Aricept(r) Cozaar(r) Hyzaar(r) Lipitor(r) Actos(r) Zyprexa(r) Plavix(r) Seroquel(r) Singulair(r) Lexapro(r) Levaquin(r) Diovan(r) Tricor(r) Lovenox(r) Lidoderm(r) $13.7 $9.1 $14.1 $26.9 $9.3 $13.1 $8.2 Oxycontin(r) Cymbalta(r) Aciphex(r) Nexium(r) Celebrex(r) Abilify(r) 2009 2010 2011 2012 2013 2014 2015 5.9 13.7 13.7 13.7 13.7 13.7 13.7 5 9.1 9.1 9.1 9.1 9.1 3.6 14.1 14.1 14.1 14.1 15.3 26.9 26.9 26.9 3.7 9.3 9.3 7 13.1 3.4 $5.9 $18.7 $26.5 $52.3 $67.5 $80.1 $89.7 Source: U.S. Drug spend estimates are based on IMS Health data for 2008. Compounded amounts are prorated for mid-term expirations. Brand drug expirations based on expected patent expiration dates current as of December 2009. Changes may occur due to litigation, patent challenges, etc. $94.4 Billion in Brand Drugs Off-Patent from 2009-2015 Off-Patent Compounding Effect - Prorated ($ in Billions) ($ in Billions) You are here |
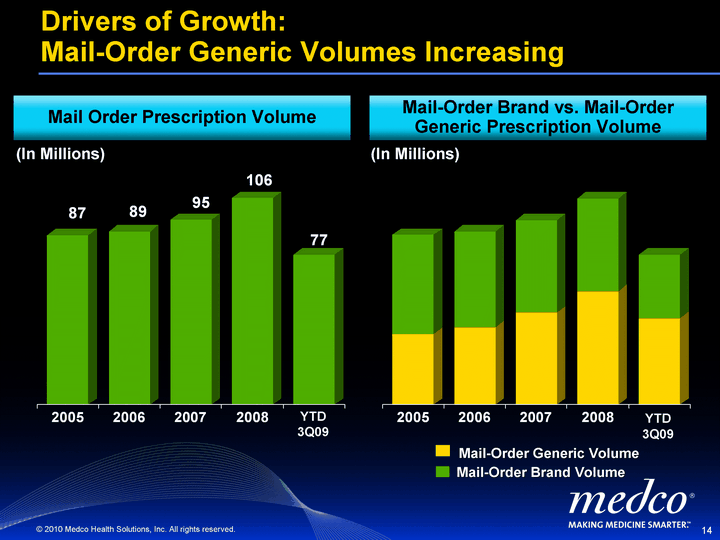
| 2005 2006 2007 2008 2010E Mail-Order Generic 36.4 39.9 47.4 58.2 44.5 65 Mail-Order Brand 50.9 49.1 47.4 47.6 32.6 43 Drivers of Growth: Mail-Order Generic Volumes Increasing 2005 2006 2007 2008 2010E New Business 4 4.7 2.9 Mail-Order Volume 87 89 95 106 77.1 108 Mail-Order Generic Volume Mail-Order Brand Volume Mail Order Prescription Volume Mail-Order Brand vs. Mail-Order Generic Prescription Volume (In Millions) (In Millions) YTD 3Q09 YTD 3Q09 |
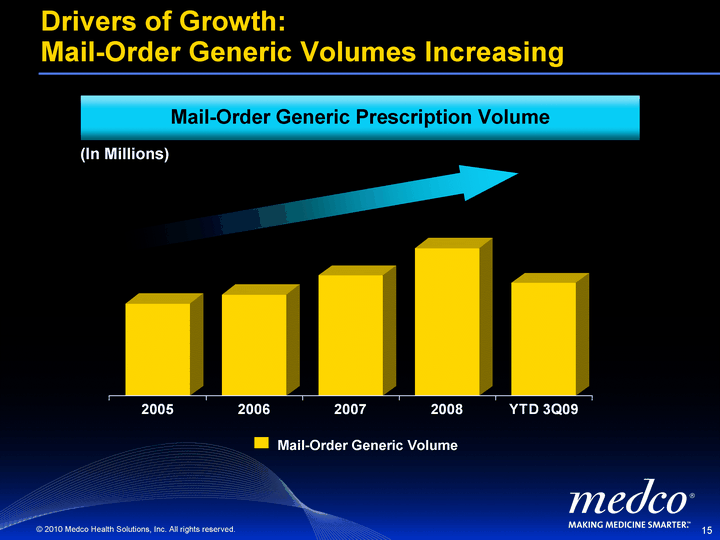
| 2005 2006 2007 2008 YTD 3Q09 2010E Mail-Order Generic 36.4 39.9 47.4 58.2 44.5 65 Mail-Order Brand 50.9 49.1 47.4 47.6 32.6 43 Drivers of Growth: Mail-Order Generic Volumes Increasing Mail-Order Generic Volume (In Millions) Mail-Order Generic Prescription Volume |
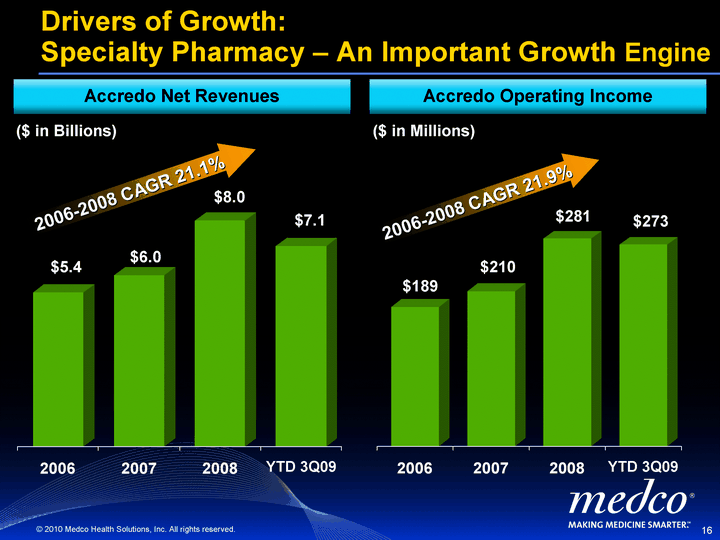
| 2006 2007 2008 Acute Chronic/Complex 5437 6043 7974.2 7071.1 Drivers of Growth: Specialty Pharmacy - An Important Growth Engine $5.4 $7.1 $8.0 $6.0 2006 2007 2008 189 210 281.2 273 $189 $281 $273 $210 Accredo Net Revenues Accredo Operating Income 2006-2008 CAGR 21.9% 2006-2008 CAGR 21.1% ($ in Billions) ($ in Millions) YTD 3Q09 YTD 3Q09 |
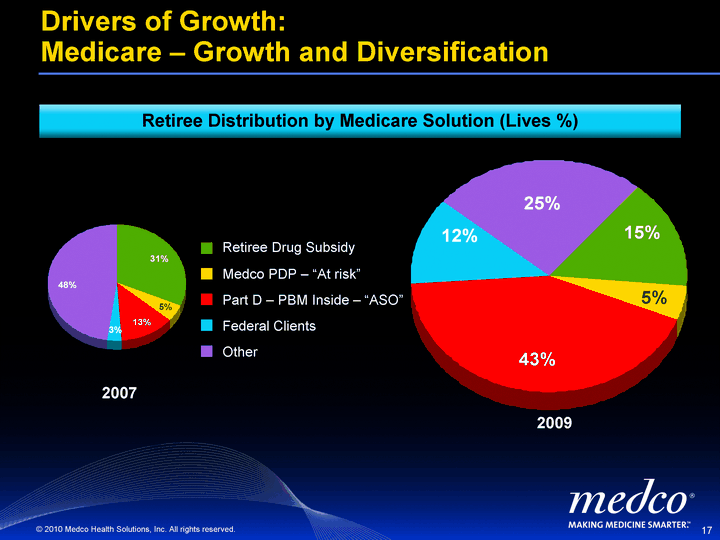
| Drivers of Growth: Medicare - Growth and Diversification Retiree Distribution by Medicare Solution (Lives %) RDS PDP Part D Federal Other 2.12 0.33 0.86 0.23 3.23 2007 RDS PDP Part D Federal Other 1.89 0.59 5.27 1.49 3.1 2009 Retiree Drug Subsidy Federal Clients Part D - PBM Inside - "ASO" Medco PDP - "At risk" Other |
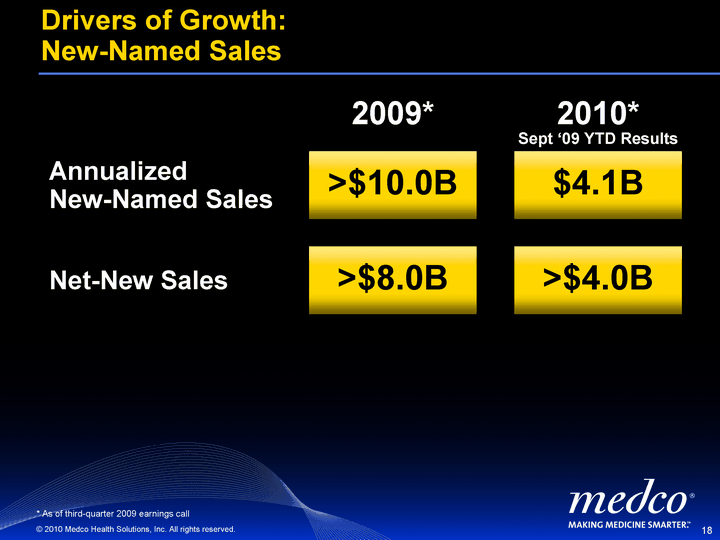
| Drivers of Growth: New-Named Sales Annualized New-Named Sales 2009* Net-New Sales 2010* * As of third-quarter 2009 earnings call >$10.0B $4.1B >$8.0B >$4.0B Sept '09 YTD Results |
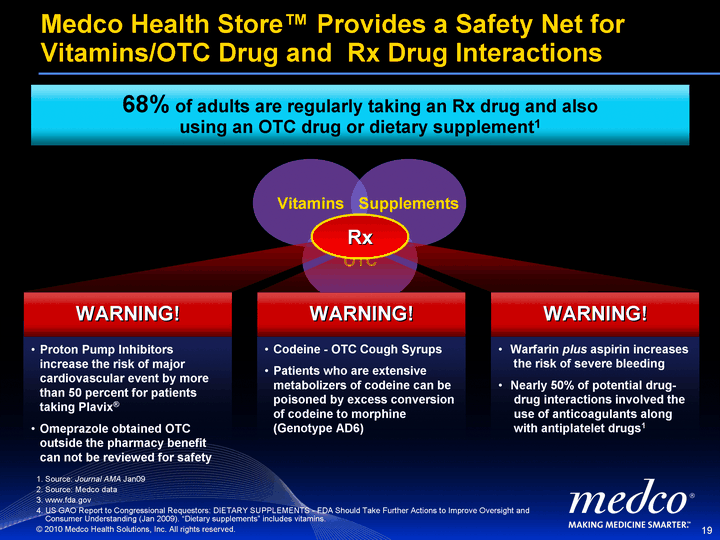
| OTC Vitamins Supplements Rx Rx Medco Health Store(tm) Provides a Safety Net for Vitamins/OTC Drug and Rx Drug Interactions 68% of adults are regularly taking an Rx drug and also using an OTC drug or dietary supplement1 Proton Pump Inhibitors increase the risk of major cardiovascular event by more than 50 percent for patients taking Plavix(r) Omeprazole obtained OTC outside the pharmacy benefit can not be reviewed for safety WARNING! Codeine - OTC Cough Syrups Patients who are extensive metabolizers of codeine can be poisoned by excess conversion of codeine to morphine (Genotype AD6) WARNING! Warfarin plus aspirin increases the risk of severe bleeding Nearly 50% of potential drug- drug interactions involved the use of anticoagulants along with antiplatelet drugs1 WARNING! 1. Source: Journal AMA Jan09 2. Source: Medco data 3. www.fda.gov 4. US GAO Report to Congressional Requestors: DIETARY SUPPLEMENTS - FDA Should Take Further Actions to Improve Oversight and Consumer Understanding (Jan 2009). "Dietary supplements" includes vitamins. |
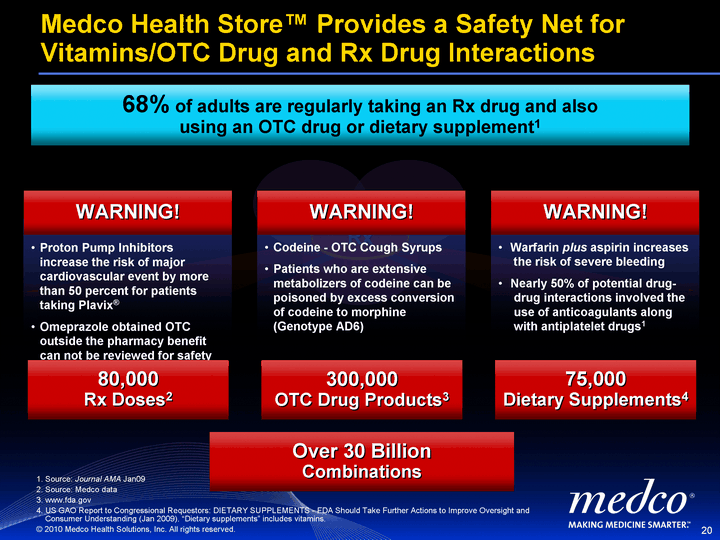
| OTC Vitamins Supplements Rx Rx Rx Rx Medco Health Store(tm) Provides a Safety Net for Vitamins/OTC Drug and Rx Drug Interactions 68% of adults are regularly taking an Rx drug and also using an OTC drug or dietary supplement1 Proton Pump Inhibitors increase the risk of major cardiovascular event by more than 50 percent for patients taking Plavix(r) Omeprazole obtained OTC outside the pharmacy benefit can not be reviewed for safety WARNING! Codeine - OTC Cough Syrups Patients who are extensive metabolizers of codeine can be poisoned by excess conversion of codeine to morphine (Genotype AD6) WARNING! Warfarin plus aspirin increases the risk of severe bleeding Nearly 50% of potential drug- drug interactions involved the use of anticoagulants along with antiplatelet drugs1 WARNING! 80,000 Rx Doses2 300,000 OTC Drug Products3 75,000 Dietary Supplements4 1. Source: Journal AMA Jan09 2. Source: Medco data 3. www.fda.gov 4. US GAO Report to Congressional Requestors: DIETARY SUPPLEMENTS - FDA Should Take Further Actions to Improve Oversight and Consumer Understanding (Jan 2009). "Dietary supplements" includes vitamins. Over 30 Billion Combinations |
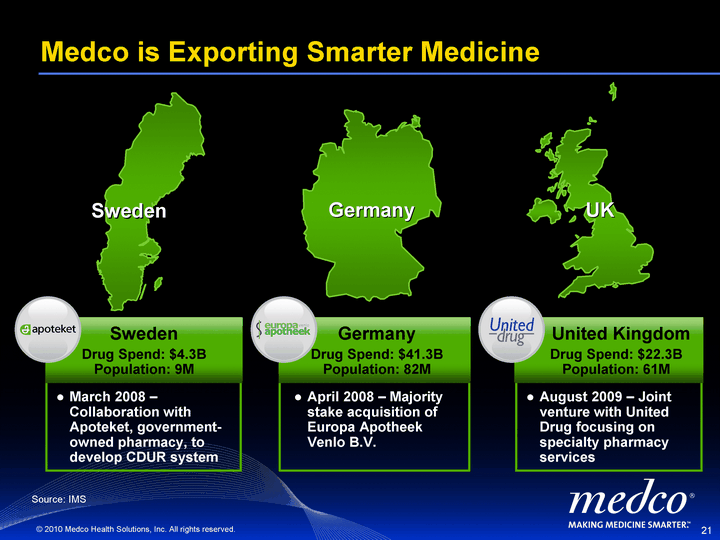
| Medco is Exporting Smarter Medicine Germany Sweden UK August 2009 - Joint venture with United Drug focusing on specialty pharmacy services United Kingdom Drug Spend: $22.3B Population: 61M March 2008 - Collaboration with Apoteket, government- owned pharmacy, to develop CDUR system Sweden Drug Spend: $4.3B Population: 9M April 2008 - Majority stake acquisition of Europa Apotheek Venlo B.V. Germany Drug Spend: $41.3B Population: 82M Source: IMS |
| Smarter Medicine through e-Prescribing Strong industry momentum in 2009 26% of U.S. prescribers are now active e-prescribers Number of e-prescribers more than doubled from 2008 MIPPA and ARRA incentives should fuel sustained momentum Very promising signs for a long-term Medco advantage Medco has the largest share of e-prescribed mail prescriptions Medco is raising the bar, being the first to roll out real-time co-pay information in 2010 - additional smart advances to come Medco saves $2 in administrative costs for every new e-prescribed mail prescription, and earns even more from higher generics and formulary compliance Medco's 2009 e-prescribed mail prescriptions more than tripled over 2008, but still relatively small - at 1.5% of mail prescriptions in 2009 |
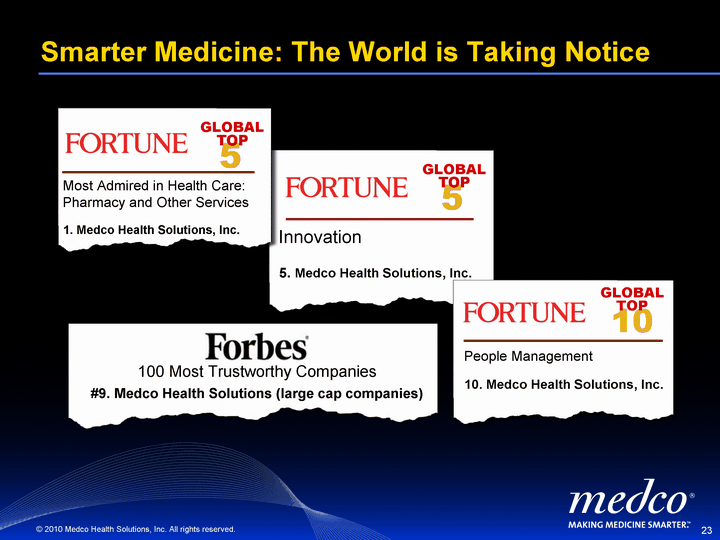
| Smarter Medicine: The World is Taking Notice Innovation 5. Medco Health Solutions, Inc. Most Admired in Health Care: Pharmacy and Other Services 1. Medco Health Solutions, Inc. 100 Most Trustworthy Companies #9. Medco Health Solutions (large cap companies) GLOBAL GLOBAL People Management 10. Medco Health Solutions, Inc. 10 GLOBAL TOP |

| Appendix |
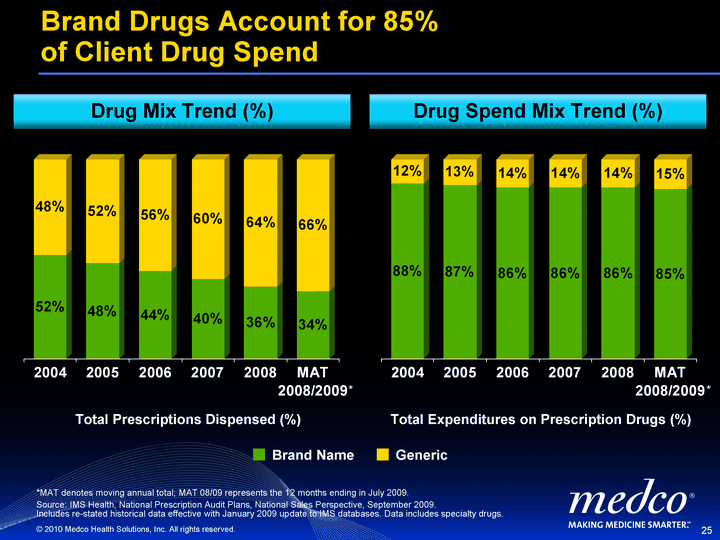
| Drug Mix Trend (%) Brand Drugs Account for 85% of Client Drug Spend Brand Name Generic Total Prescriptions Dispensed (%) 2004 0.52 0.48 2005 0.48 0.52 2006 0.44 0.56 2007 0.4 0.6 2008 0.36 0.64 MAT 2008/2009 0.34 0.66 2004 0.88 0.12 2005 0.87 0.13 2006 0.86 0.14 2007 0.86 0.14 2008 0.86 0.14 MAT 2008/2009 0.85 0.15 Total Expenditures on Prescription Drugs (%) * * *MAT denotes moving annual total; MAT 08/09 represents the 12 months ending in July 2009. Source: IMS Health, National Prescription Audit Plans, National Sales Perspective, September 2009. Includes re-stated historical data effective with January 2009 update to IMS databases. Data includes specialty drugs. Drug Spend Mix Trend (%) |
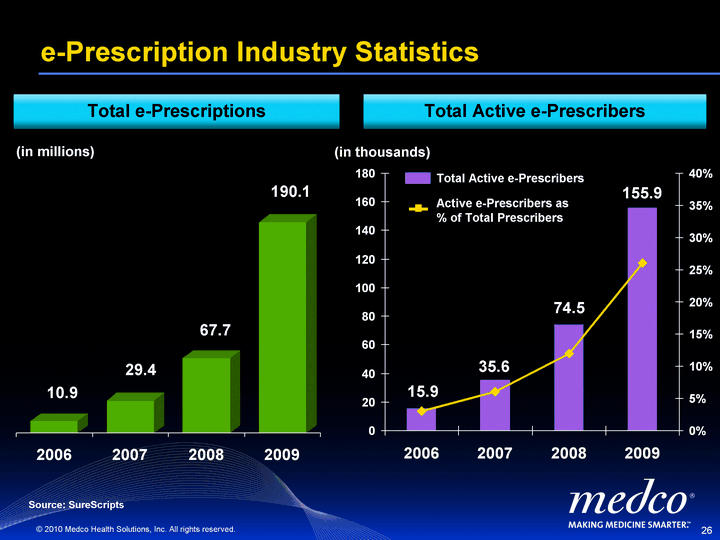
| 2006 2007 2008 2009 Acute e-Rx's 10949896 29447150 67749689 190068527 e-Prescription Industry Statistics 2006 2007 2008 2009 Active e-Prescribers 15.868 35.597 74.487 155.917 Active e-Prescribers as % of Total 0.03 0.06 0.12 0.26 Total e-Prescriptions Total Active e-Prescribers (in millions) Source: SureScripts 10.9 67.7 29.4 190.1 Total Active e-Prescribers Active e-Prescribers as % of Total Prescribers (in thousands) 15.9 35.6 74.5 155.9 |
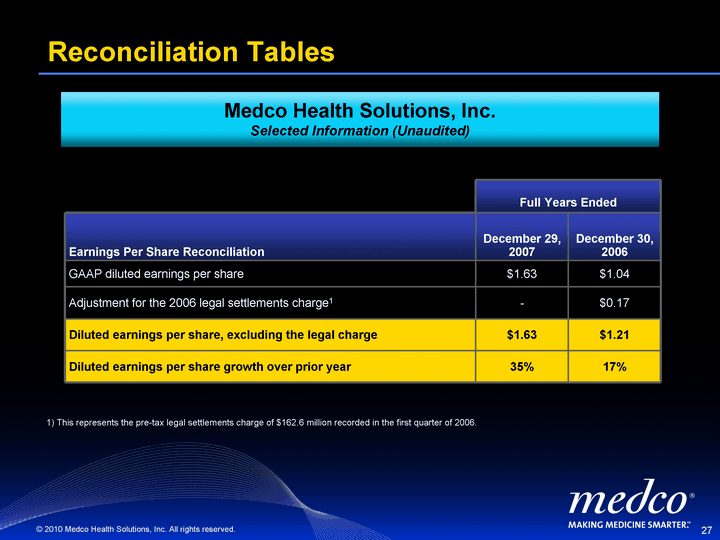
| Reconciliation Tables Full Years Ended Full Years Ended Earnings Per Share Reconciliation December 29, 2007 December 30, 2006 GAAP diluted earnings per share $1.63 $1.04 Adjustment for the 2006 legal settlements charge1 - $0.17 Diluted earnings per share, excluding the legal charge $1.63 $1.21 Diluted earnings per share growth over prior year 35% 17% 1) This represents the pre-tax legal settlements charge of $162.6 million recorded in the first quarter of 2006. Medco Health Solutions, Inc. Selected Information (Unaudited) |
