Attached files
| file | filename |
|---|---|
| 8-K - FORM 8-K - VWR Funding, Inc. | c94463e8vk.htm |
Exhibit 99.1
| John M. Ballbach Chairman, President and CEO 28th Annual J.P. Morgan Healthcare Conference January 11, 2010 |
| Safe Harbor / Non-GAAP Measures Any statements made in this presentation about future operating results or other future events are forward-looking statements under the Safe Harbor Provisions of the Private Securities Litigation Reform Act of 1995. Actual results may differ materially from such forward-looking statements. A discussion of factors that could cause actual results or events to vary is contained in the Appendix to this presentation and in the SEC filings of VWR International's parent company, VWR Funding, Inc. During this presentation, we will be referring to certain financial measures not prepared in accordance with accounting principles generally accepted in the United States of America ("GAAP") including Adjusted EBITDA and Net Debt. Reconciliations of these non-GAAP financial measures to the most closely comparable GAAP presentation are contained in the Appendix to this presentation. 2 |
| About VWR VWR enables the advancement of the world's most critical research through the distribution of a highly diversified product line to most of the world's top pharmaceutical and biotech companies, as well as industrial, educational and governmental organizations. With 150 years of industry experience, VWR offers a well-established distribution network that reaches thousands of specialized labs and facilities spanning the globe. VWR has over 6,500 associates around the world working to streamline the way researchers across North America, Europe, and Asia stock and maintain their labs. In addition, VWR further supports its customers by providing onsite services, storeroom management, product procurement, supply chain systems integration and technical services. 3 |
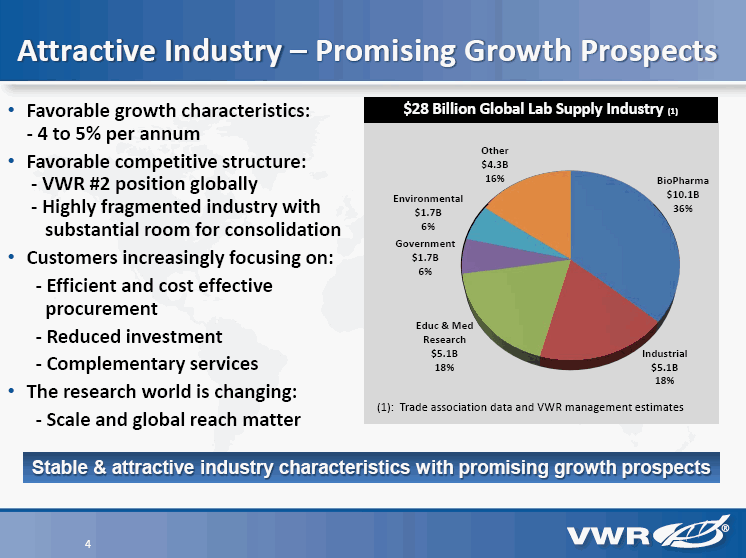
| Attractive Industry - Promising Growth Prospects Favorable growth characteristics: - 4 to 5% per annum Favorable competitive structure: - VWR #2 position globally - Highly fragmented industry with substantial room for consolidation Customers increasingly focusing on: - Efficient and cost effective procurement - Reduced investment - Complementary services The research world is changing: - Scale and global reach matter $28 Billion Global Lab Supply Industry (1) (1): Trade association data and VWR management estimates 4 Stable & attractive industry characteristics with promising growth prospects |
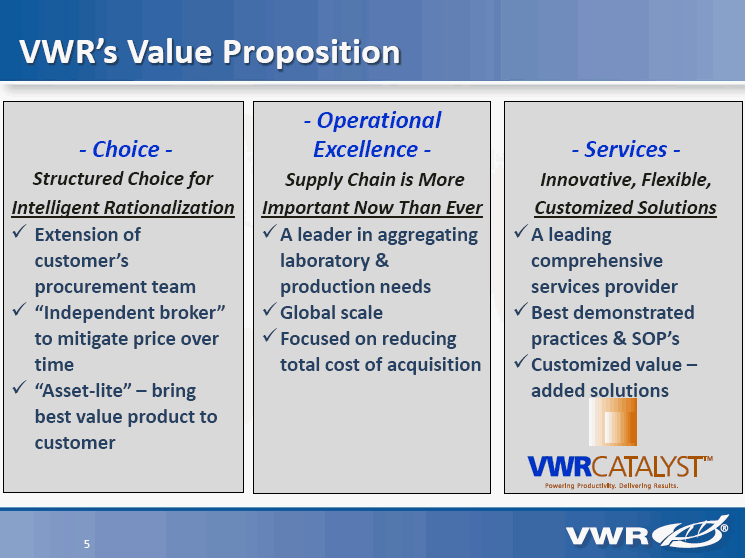
| VWR's Value Proposition - Choice - Structured Choice for Intelligent Rationalization Extension of customer's procurement team "Independent broker" to mitigate price over time "Asset-lite" - bring best value product to customer - Operational Excellence - Supply Chain is More Important Now Than Ever A leader in aggregating laboratory & production needs Global scale Focused on reducing total cost of acquisition - Services - Innovative, Flexible, Customized Solutions A leading comprehensive services provider Best demonstrated practices & SOP's Customized value - added solutions 5 |
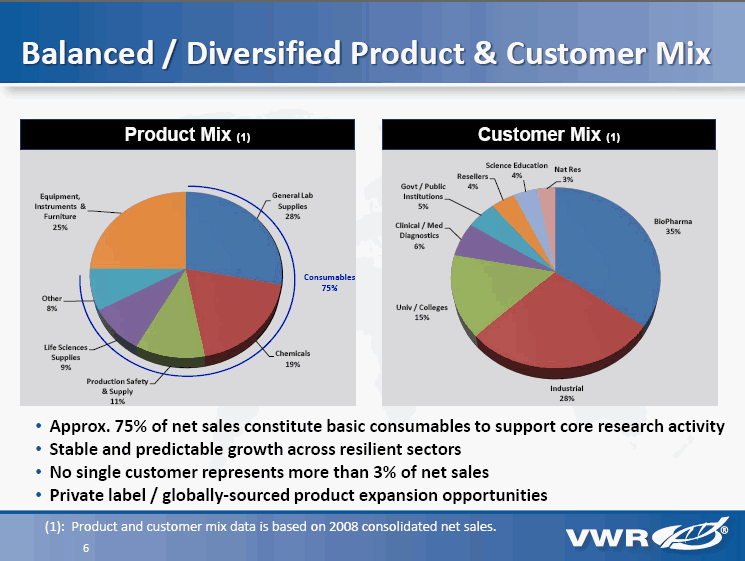
| Approx. 75% of net sales constitute basic consumables to support core research activity Stable and predictable growth across resilient sectors No single customer represents more than 3% of net sales Private label / globally-sourced product expansion opportunities 6 Product Mix (1) Customer Mix (1) Consumables 75% (1): Product and customer mix data is based on 2008 consolidated net sales. Balanced / Diversified Product & Customer Mix |
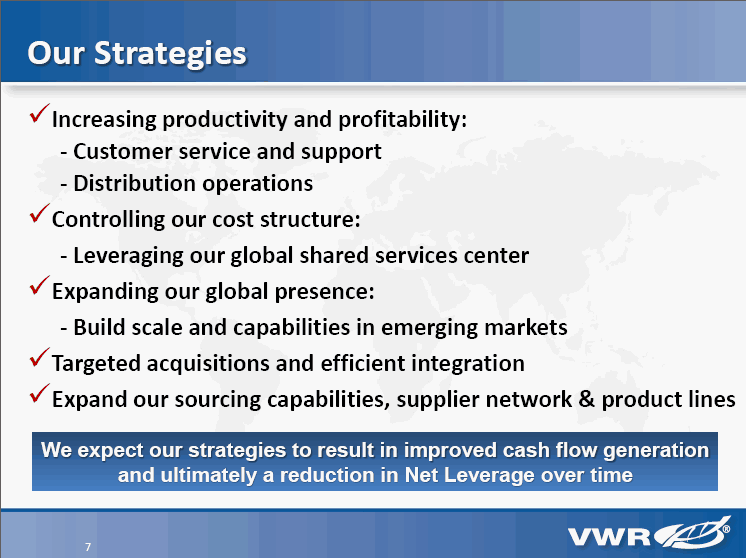
| Increasing productivity and profitability: - Customer service and support - Distribution operations Controlling our cost structure: - Leveraging our global shared services center Expanding our global presence: - Build scale and capabilities in emerging markets Targeted acquisitions and efficient integration Expand our sourcing capabilities, supplier network & product lines 7 Our Strategies We expect our strategies to result in improved cash flow generation and ultimately a reduction in Net Leverage over time |
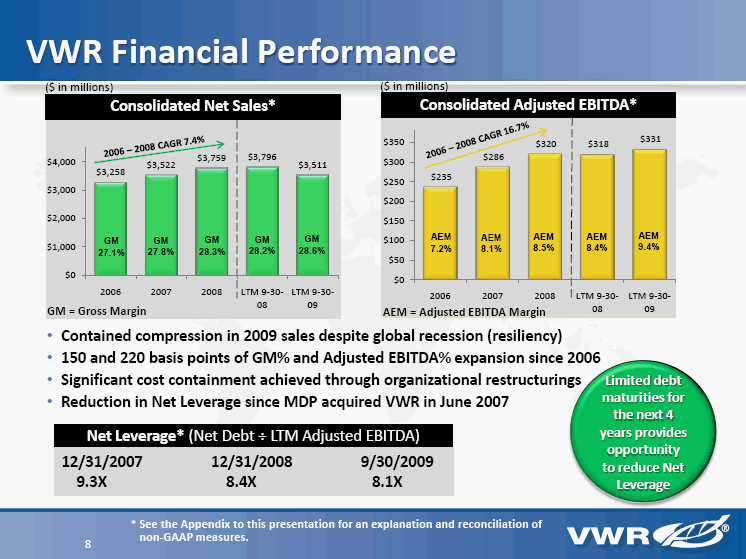
| VWR Financial Performance 8 Contained compression in 2009 sales despite global recession (resiliency) 150 and 220 basis points of GM% and Adjusted EBITDA% expansion since 2006 Significant cost containment achieved through organizational restructurings Reduction in Net Leverage since MDP acquired VWR in June 2007 Net Leverage* (Net Debt ÷ LTM Adjusted EBITDA) * See the Appendix to this presentation for an explanation and reconciliation of non-GAAP measures. Consolidated Net Sales* GM 27.1% GM 28.3% 2006 - 2008 CAGR 7.4% GM = Gross Margin Consolidated Adjusted EBITDA* AEM 7.2% AEM 8.5% 2006 - 2008 CAGR 16.7% AEM 8.1% AEM 8.4% AEM 9.4% AEM = Adjusted EBITDA Margin Limited debt maturities for the next 4 years provides opportunity to reduce Net Leverage 12/31/2007 12/31/2008 9/30/2009 9.3X 8.4X 8.1X ($ in millions) ($ in millions) |
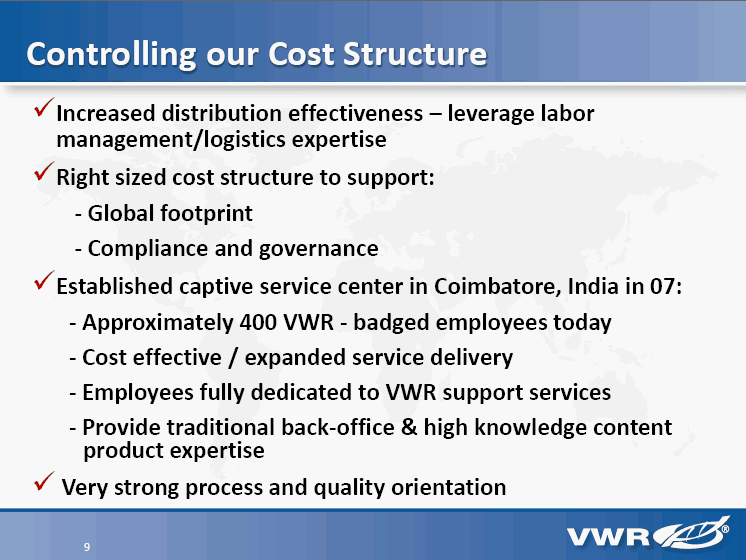
| 9 Increased distribution effectiveness - leverage labor management/logistics expertise Right sized cost structure to support: - Global footprint - Compliance and governance Established captive service center in Coimbatore, India in 07: - Approximately 400 VWR - badged employees today - Cost effective / expanded service delivery - Employees fully dedicated to VWR support services - Provide traditional back-office & high knowledge content product expertise Very strong process and quality orientation Controlling our Cost Structure |
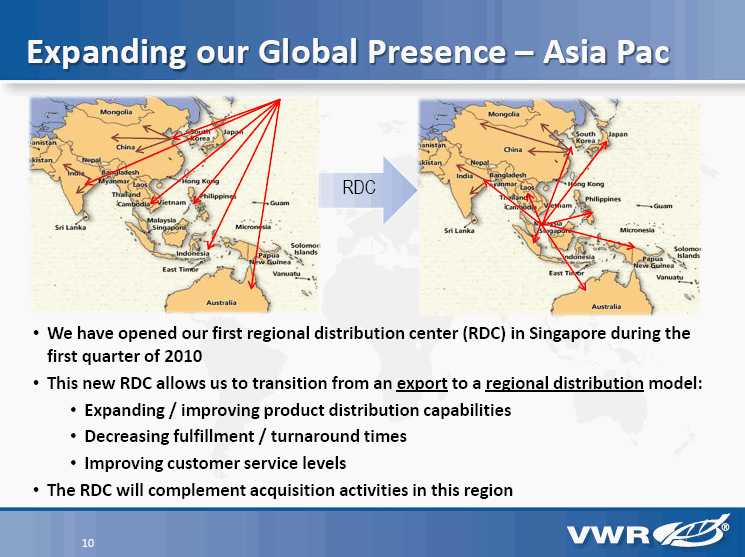
| RDC We have opened our first regional distribution center (RDC) in Singapore during the first quarter of 2010 This new RDC allows us to transition from an export to a regional distribution model: Expanding / improving product distribution capabilities Decreasing fulfillment / turnaround times Improving customer service levels The RDC will complement acquisition activities in this region 10 Expanding our Global Presence - Asia Pac |
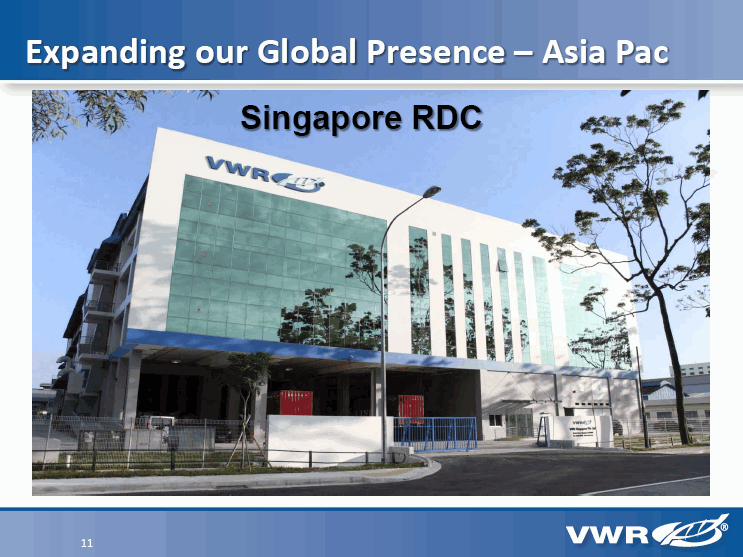
| Singapore RDC Expanding our Global Presence - Asia Pac 11 |
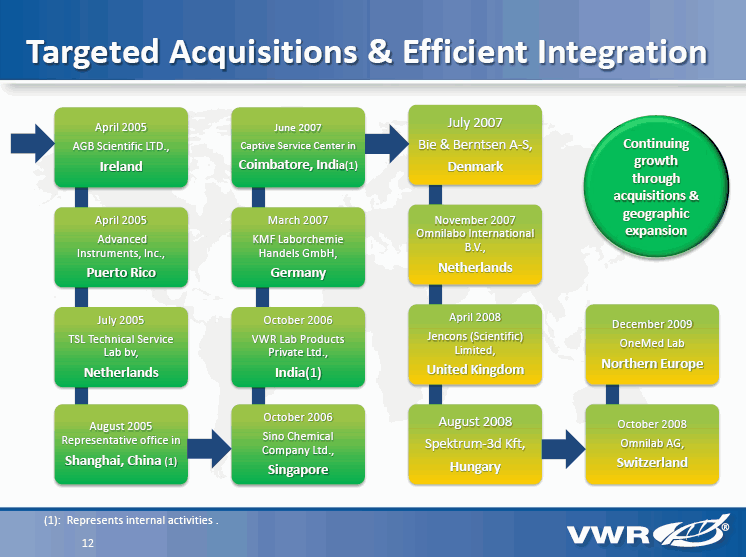
| Continuing growth through acquisitions & geographic expansion (1): Represents internal activities . 12 Targeted Acquisitions & Efficient Integration |
| Key Take-Aways Proven industry leader with increasingly global reach History of growth & profitability with considerable resilience to current broader market turmoil Delivering value to customers through a structured choice of branded and private label offerings Aggressively managing costs with global sourcing potential Focused on reinforcing competitive position through acquisitions and global expansion Enjoy covenant - lite capital structure and attractive debt maturity profile in difficult credit market conditions 13 |
| Appendix |
| Appendix A-1 A-1 Forward-Looking Information Statement All statements included in or made during this presentation other than statements of historical fact may constitute forward-looking statements within the meaning of the federal securities laws. Although we believe that our assumptions made in connection with the forward-looking statements are reasonable, there can be no assurances that the assumptions and expectations will prove to be correct. The following are among the factors that could affect our future results and could cause those results or other outcomes to differ materially from those expressed or implied in our forward-looking statements: actions by, and our ability to maintain existing business relationships and practices with, suppliers, customers, carriers and other third parties; loss of our key executive officers; our ability to consummate and integrate potential acquisitions; the effect of political and economic conditions, inflation and interest rates worldwide; the effect of changes in laws and regulations, including changes in accounting standards, trade, tax, price controls and other regulatory matters; increased competition from other companies in our industry and our ability to retain or increase our market shares in the principal geographical areas in which we operate; and our ability to generate sufficient funds to meet our debt service obligations, capital expenditure program requirements, ongoing operating costs, acquisition financing and working capital needs. Any such forward-looking statements should be considered in light of such important factors and in conjunction with VWR Funding, Inc.'s SEC filings, including its Annual Report on Form 10-K for the year ended December 31, 2008 and its Quarterly Report on Form 10-Q for the quarterly periods ended September 30, June 30 and March 31, 2009. |
| Appendix A-2 A-2 This presentation contains a discussion of certain financial measures which are not in conformity with generally accepted accounting principles in the United States of America ("GAAP"), as described below. References to "Adjusted EBITDA" This presentation contains a discussion of earnings before interest, taxes, depreciation and amortization ("EBITDA"), as adjusted for certain items described below ("Adjusted EBITDA"). Adjusted EBITDA is a non-GAAP financial measure, and should not be considered as an alternative to net income (loss) or any other GAAP measure of performance or liquidity. Net income (loss) is the most comparable GAAP measure of our operating results presented in the Company's condensed consolidated financial statements. The table presented on Appendix A-5 & A-6 reconciles Adjusted EBITDA to net income (loss) for the periods covered in this presentation. Our calculation of Adjusted EBITDA eliminates the effect of charges primarily associated with financing decisions, tax regulations and capital investments and certain other items as further described on Appendix A-5 & A-6. Adjusted EBITDA is a key financial metric used by the Company's investors and management to evaluate and measure the Company's operating performance. |
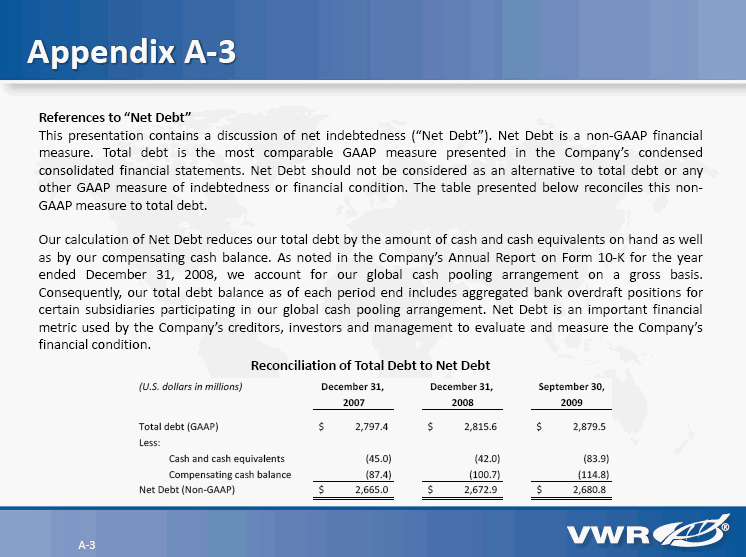
| Appendix A-3 A-3 References to "Net Debt" This presentation contains a discussion of net indebtedness ("Net Debt"). Net Debt is a non-GAAP financial measure. Total debt is the most comparable GAAP measure presented in the Company's condensed consolidated financial statements. Net Debt should not be considered as an alternative to total debt or any other GAAP measure of indebtedness or financial condition. The table presented below reconciles this non- GAAP measure to total debt. Our calculation of Net Debt reduces our total debt by the amount of cash and cash equivalents on hand as well as by our compensating cash balance. As noted in the Company's Annual Report on Form 10-K for the year ended December 31, 2008, we account for our global cash pooling arrangement on a gross basis. Consequently, our total debt balance as of each period end includes aggregated bank overdraft positions for certain subsidiaries participating in our global cash pooling arrangement. Net Debt is an important financial metric used by the Company's creditors, investors and management to evaluate and measure the Company's financial condition. Reconciliation of Total Debt to Net Debt |
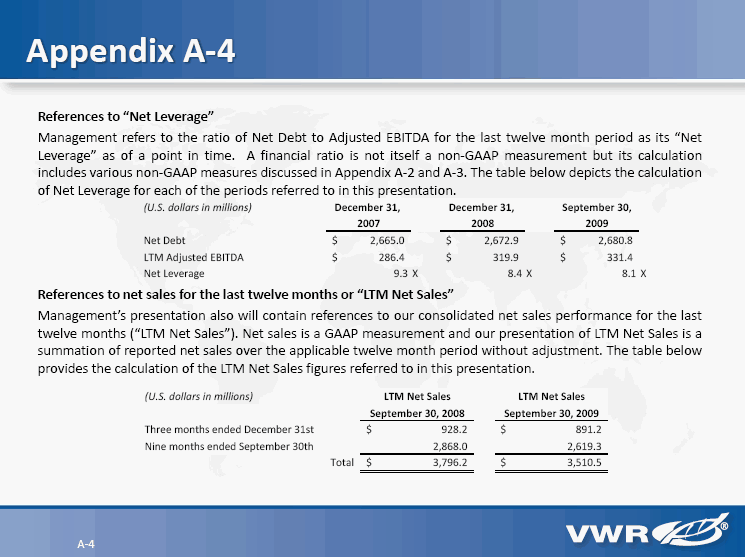
| Appendix A-4 A-4 References to "Net Leverage" Management refers to the ratio of Net Debt to Adjusted EBITDA for the last twelve month period as its "Net Leverage" as of a point in time. A financial ratio is not itself a non-GAAP measurement but its calculation includes various non-GAAP measures discussed in Appendix A-2 and A-3. The table below depicts the calculation of Net Leverage for each of the periods referred to in this presentation. References to net sales for the last twelve months or "LTM Net Sales" Management's presentation also will contain references to our consolidated net sales performance for the last twelve months ("LTM Net Sales"). Net sales is a GAAP measurement and our presentation of LTM Net Sales is a summation of reported net sales over the applicable twelve month period without adjustment. The table below provides the calculation of the LTM Net Sales figures referred to in this presentation. |
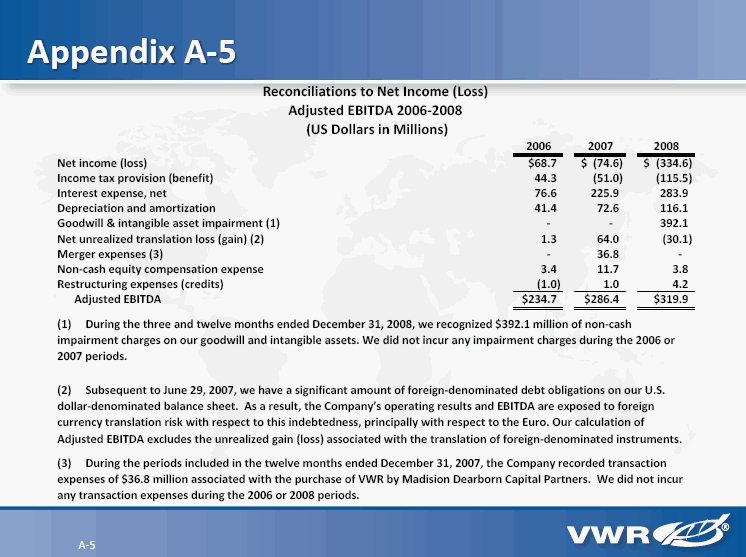
| Appendix A-5 A-5 |
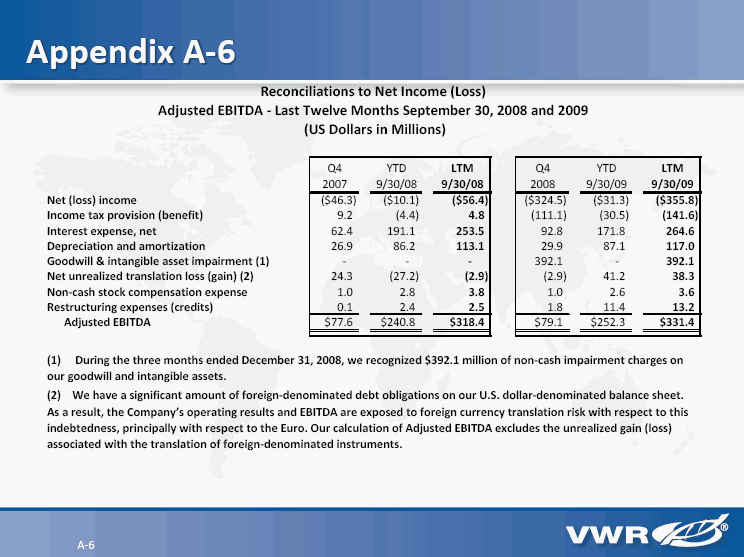
| Appendix A-6 A-6 |
