Attached files
| file | filename |
|---|---|
| 8-K - FORM 8-K - DANA INC | l38285e8vk.htm |
Exhibit 99.1
| December 17, 2009 Dana Holding Corporation 2010 Outlook |

| Safe Harbor Statement Certain statements and projections contained in this presentation are, by their nature, forward-looking within the meaning of the Private Securities Litigation Reform Act of 1995. These forward-looking statements are based on our current expectations, estimates and projections about our industry and business, management's beliefs, and certain assumptions made by us, all of which are subject to change. Forward-looking statements can often be identified by words such as "anticipates," "expects," "intends," "plans," "predicts," "believes," "seeks," "estimates," "may," "will," "should," "would," "could," "potential," "continue," "ongoing," similar expressions, and variations or negatives of these words. These forward-looking statements are not guarantees of future results and are subject to risks, uncertainties and assumptions that could cause our actual results to differ materially and adversely from those expressed in any forward- looking statement. Dana's Annual Report on Form 10-K, subsequent Quarterly Reports on Form 10-Q, recent Current Reports on Form 8-K, and other Securities and Exchange Commission filings discuss important risk factors that could affect our business, results of operations and financial condition. The forward-looking statements in this presentation speak only as of this date. Dana does not undertake any obligation to revise or update publicly any forward-looking statement for any reason. |
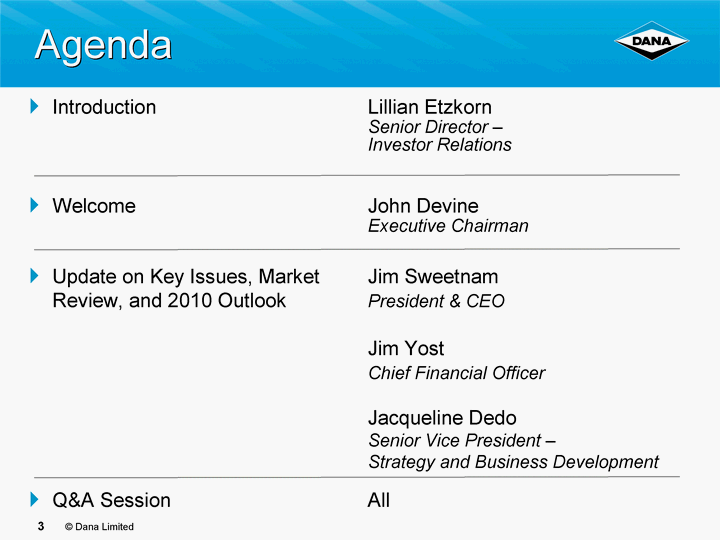
| Agenda Introduction Lillian Etzkorn Senior Director - Investor Relations Welcome John Devine Executive Chairman Update on Key Issues, Market Jim Sweetnam Review, and 2010 Outlook President & CEO Jim Yost Chief Financial Officer Jacqueline Dedo Senior Vice President - Strategy and Business Development Q&A Session All |
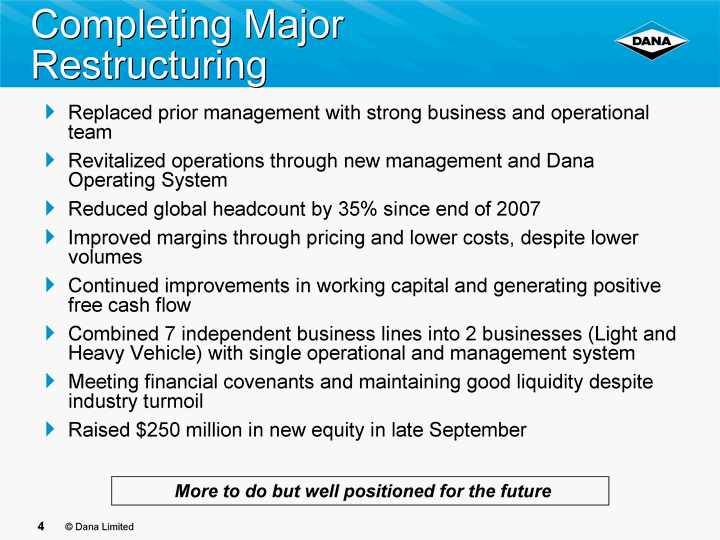
| Completing Major Restructuring Replaced prior management with strong business and operational team Revitalized operations through new management and Dana Operating System Reduced global headcount by 35% since end of 2007 Improved margins through pricing and lower costs, despite lower volumes Continued improvements in working capital and generating positive free cash flow Combined 7 independent business lines into 2 businesses (Light and Heavy Vehicle) with single operational and management system Meeting financial covenants and maintaining good liquidity despite industry turmoil Raised $250 million in new equity in late September More to do but well positioned for the future |

| Product Innovation Highlights Focus on improving fuel economy for driveline products Reduced mass Improved friction, spin losses Higher power density Creating Driveline Systems which feature enhanced fuel economy |

| New Product Introductions Launching industry's first eco-friendly cylinder-head cover, providing significant cost and environmental benefits - used on the 2010 Ford Fusion and 2010 Ford Escape vehicles Jointly developed all-new Thermoplastic oil pan for the 2011 F-Series Super Duty Trucks Developed industry-first battery cooling technology for electric vehicles - featured on the 2010 Tesla Motors' Roadster Sport Launching Victor Reinz (r) sealing products and thermal- acoustical protective shielding (TAPS) on the Mercedes- Benz S400 Hybrid Creating Sealing/Thermal Technologies driving "green" value |
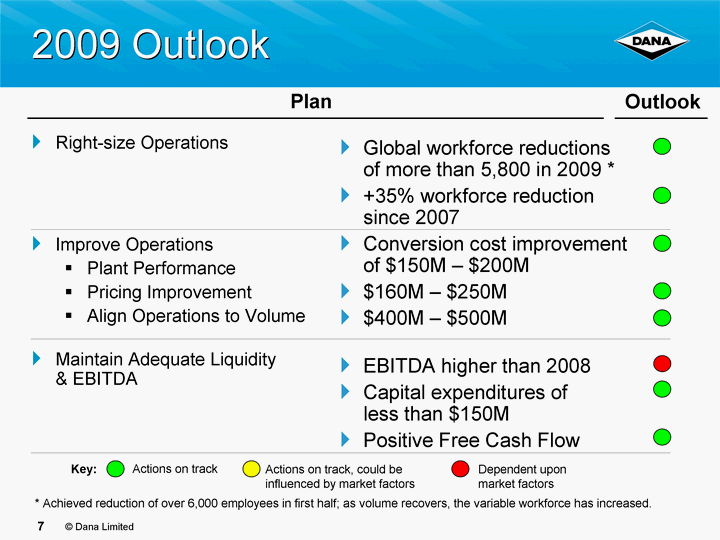
| 2009 Outlook Right-size Operations Improve Operations Plant Performance Pricing Improvement Align Operations to Volume Maintain Adequate Liquidity & EBITDA Global workforce reductions of more than 5,800 in 2009 * +35% workforce reduction since 2007 Conversion cost improvement of $150M - $200M $160M - $250M $400M - $500M EBITDA higher than 2008 Capital expenditures of less than $150M Positive Free Cash Flow Actions on track Actions on track, could be influenced by market factors Dependent upon market factors Key: Outlook Plan * Achieved reduction of over 6,000 employees in first half; as volume recovers, the variable workforce has increased. |
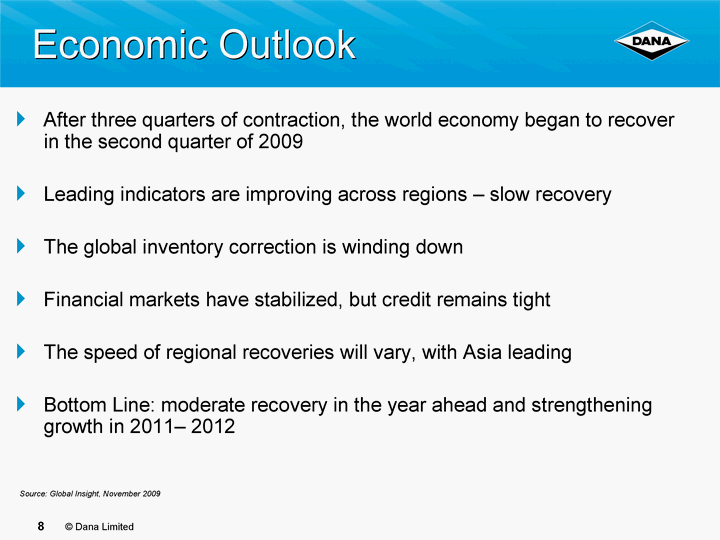
| Economic Outlook After three quarters of contraction, the world economy began to recover in the second quarter of 2009 Leading indicators are improving across regions - slow recovery The global inventory correction is winding down Financial markets have stabilized, but credit remains tight The speed of regional recoveries will vary, with Asia leading Bottom Line: moderate recovery in the year ahead and strengthening growth in 2011- 2012 Source: Global Insight, November 2009 |

| Global Market Outlook Light Vehicle Market appears to be improving U.S. Dealer inventory of platforms key to Dana may soften near-term production levels Production on platforms Dana supports expected to modestly increase (less than the overall market improvement) Commercial Vehicle Market has stabilized Pre-buy accelerating production requirements - expected to flatten / decline in the first quarter of 2010 Improvement expected in second half of 2010 Off-Highway Market expected to remain flat - no near term recovery Light Vehicle Driveline Structures Sealing Thermal Commercial Vehicle Off-Highway East 38 11 10 3 21 17 Dana Global Revenues By Product/Business Line (year-to-date as of 9/30/09) Market Assumptions are still very volatile - could materially change if economic recovery slows or declines |
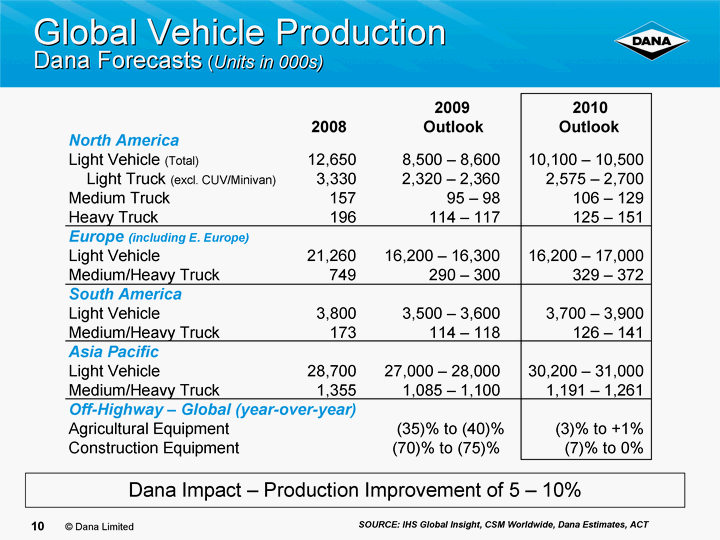
| Global Vehicle Production Dana Forecasts (Units in 000s) North America Light Vehicle (Total) 12,650 8,500 - 8,600 10,100 - 10,500 Light Truck (excl. CUV/Minivan) 3,330 2,320 - 2,360 2,575 - 2,700 Medium Truck 157 95 - 98 106 - 129 Heavy Truck 196 114 - 117 125 - 151 Europe (including E. Europe) Light Vehicle 21,260 16,200 - 16,300 16,200 - 17,000 Medium/Heavy Truck 749 290 - 300 329 - 372 South America Light Vehicle 3,800 3,500 - 3,600 3,700 - 3,900 Medium/Heavy Truck 173 114 - 118 126 - 141 Asia Pacific Light Vehicle 28,700 27,000 - 28,000 30,200 - 31,000 Medium/Heavy Truck 1,355 1,085 - 1,100 1,191 - 1,261 Off-Highway - Global (year-over-year) Agricultural Equipment (35)% to (40)% (3)% to +1% Construction Equipment (70)% to (75)% (7)% to 0% SOURCE: IHS Global Insight, CSM Worldwide, Dana Estimates, ACT 2009 2010 2008 Outlook Outlook Dana Impact - Production Improvement of 5 - 10% |

| Our Top North American Light Vehicle Platforms * Large Pick-ups Ford F-250 / F-350 SUV / Crossover Jeep Wrangler Ford Escape / Mercury Mariner / Mazda Tribute Jeep Liberty / Dodge Nitro Vans Ford E-Series Passenger Cars Ford Fusion / Mercury Milan / Lincoln MKZ * Based on year-to-date Driveline Revenue as of September 30, 2009 About 70% of Dana's North America Light Vehicle Driveline* Revenue Comprised of Several Key Platforms (13% of total Dana revenue) Dana Revenues by Product/Business Line (Year-to-date as of 9/30/09) Global Light Vehicle Driveline 38% of Dana Revenue - North America about 50% of Light Vehicle Driveline Light Vehicle Driveline (Global) Structures Sealing Thermal Commercial Vehicle Off-Highway East 38 11 10 3 21 17 N.A. Driveline ROW Driveline |

| Opportunities & Headwinds in 2010 Opportunities Improving economic and market conditions Full-year impact of 2009 aggressive cost reductions and resizing of operations and further cost reductions ($75 - $100 million year-over year favorable EBITDA impact) Further improvements to working capital - continued focus on inventory improvement Headwinds Pension ($25 - $30 million year-over year EBITDA impact) Further cash restructuring of about $100 million Reinstatement of competitive compensation & benefits ($40 - $45 million year-over-year EBITDA impact) |
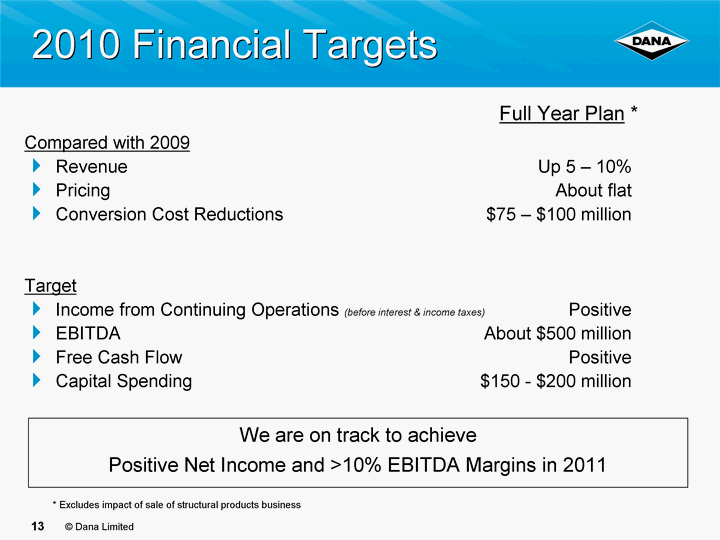
| 2010 Financial Targets Compared with 2009 Revenue Up 5 - 10% Pricing About flat Conversion Cost Reductions $75 - $100 million Target Income from Continuing Operations (before interest & income taxes) Positive EBITDA About $500 million Free Cash Flow Positive Capital Spending $150 - $200 million Full Year Plan * We are on track to achieve Positive Net Income and >10% EBITDA Margins in 2011 * Excludes impact of sale of structural products business |
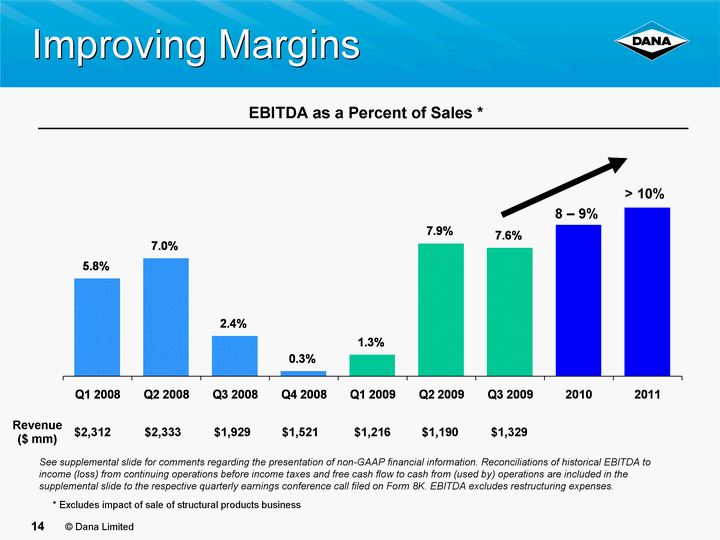
| Improving Margins EBITDA as a Percent of Sales * Q1 2008 Q2 2008 Q3 2008 Q4 2008 Q1 2009 Q2 2009 Q3 2009 2010 2011 East 0.058 0.07 0.024 0.003 0.013 0.079 0.076 0.09 0.1 West 30.6 38.6 34.6 31.6 North 45.9 46.9 45 43.9 See supplemental slide for comments regarding the presentation of non-GAAP financial information. Reconciliations of historical EBITDA to income (loss) from continuing operations before income taxes and free cash flow to cash from (used by) operations are included in the supplemental slide to the respective quarterly earnings conference call filed on Form 8K. EBITDA excludes restructuring expenses. $2,312 Revenue ($ mm) $2,333 $1,929 $1,521 $1,216 $1,190 $1,329 > 10% 8 - 9% * Excludes impact of sale of structural products business |

| Sale of Structural Products Business Divestiture of Dana's ongoing global Structures business to Metalsa Full perimeter frames for light trucks; frames and side rails for trucks and buses 11 Facilities in 6 countries (U.S., South America, Australia, UK) Approximately 2,800 people Longview, Texas plant excluded Transaction value of up to $150 million 10% subject to 2010 volumes; management confident in achievement Divestiture rationale Continuing market consolidation Non-strategic to Dana's core driveline businesses Buyer is an established, capable supplier whose core business is frames Closing expected in 2010 |

| Revenue $ 625 - $ 690 million EBITDA $ 55 - $ 60 million Free Cash Flow $ 35 - $ 40 million Capital Spending About $ 20 million Transaction Value * $ 150 million * Dana will recognize a pre-tax loss of $150 - $180 million (primarily non-cash), most of which will be recognized in the 4th Quarter 2009 2010 Annualized Pro Forma Impact Sale of Structural Products Business |
| Future Focus Continue operational improvements and restructuring Manufacturing footprint, supply chain Reduce complexity in the product and supply chain Focus Dana on growing profitably Reinvigorate product portfolios Pursue attractive business opportunities, primarily in Asia Pacific Seek geographic growth opportunities Continue to improve profits and maintain strong balance sheet |
| Summary Managed through difficult environment in 2009 Benefiting from the significant operational improvement Growing net new business Continued focus on the "basics", but increasing efforts on product development and future growth opportunities |

| Q&A Session |
| Supplemental Slide Non-GAAP Financial Information The preceding slides refer to EBITDA, which we've defined to be earnings before interest, taxes, depreciation, amortization, non-cash equity grant expense, restructuring expense and other nonrecurring items (gain/loss on debt extinguishment or divestitures, impairment, etc.). EBITDA is a non-GAAP financial measure and is the measure currently being used by Dana as the primary measure of its operating segment performance. The most significant impact to Dana's ongoing results of operations as a result of applying fresh start accounting following our emergence from bankruptcy in January of 2008 is higher depreciation and amortization. By using EBITDA, which is a performance measure that excludes depreciation and amortization, the comparability of results is enhanced. Management also believes that EBITDA is an important measure since the financial covenants of our primary debt agreements are EBITDA-based, and our management incentive performance programs are based, in part, on EBITDA. The nearest GAAP measure to EBITDA is Income from continuing operations before interest and income taxes, with the differences being principally the items identified above in the definition of EBITDA. The projection of positive Income from continuing operations before interest and income taxes assumes no significant nonrecurring items. Free cash flow is also a non-GAAP financial measure. which we have defined as Cash provided by operations (a GAAP measure) exclusive of any bankruptcy claim-related payments included therein, less capital spending. This measure is useful in evaluating the operational cash flow of the company inclusive of the spending required to maintain the operations. Because these are non-GAAP measures, EBITDA and Free cash flow should not be considered a substitute for Income from continuing operations before interest and income taxes, Net income, Cash provided by operations or other reported results prepared in accordance with GAAP. |

