Attached files
| file | filename |
|---|---|
| EX-31.1 - EXHIBIT 31.1 - RGC RESOURCES INC | dex311.htm |
| EX-31.2 - EXHIBIT 31.2 - RGC RESOURCES INC | dex312.htm |
| EX-21 - EXHIBIT 21 - RGC RESOURCES INC | dex21.htm |
| EX-23 - EXHIBIT 23 - RGC RESOURCES INC | dex23.htm |
| EX-32.1 - EXHIBIT 32.1 - RGC RESOURCES INC | dex321.htm |
| EX-32.2 - EXHIBIT 32.2 - RGC RESOURCES INC | dex322.htm |
| 10-K - FORM 10-K - RGC RESOURCES INC | d10k.htm |
Exhibit 13

CORPORATE PROFILE
RGC Resources, Inc., provides superior customer service and shareholder value as a preferred provider of energy and diversified products and services in its selected market areas.
At RGC Resources, Inc., we’re committed to our customers. In this past year we have focused on the basics of our business. Every area of our business is undergoing constant improvement – from the customer service department that answers customer calls – to the service team that takes care of their needs – to the pipeline that delivers gas to meet energy requirements. We are constantly working to enhance our energy distribution infrastructure in anticipation of our customers’ future requirements.
We’re planning and executing solutions – before they are required.
| Years Ended September 30, |
2009 | 2008 | 2007 | |||||||
| Operating Revenue - Natural Gas |
$ | 80,786,228 | $ | 93,606,593 | $ | 89,175,661 | ||||
| Other Revenue |
$ | 1,398,245 | $ | 1,030,233 | $ | 725,640 | ||||
| Net Income - Continuing Operations |
$ | 4,869,010 | $ | 4,257,824 | $ | 3,765,669 | ||||
| Net Loss - Discontinued Operations |
$ | — | $ | (36,690 | ) | $ | 40,540 | |||
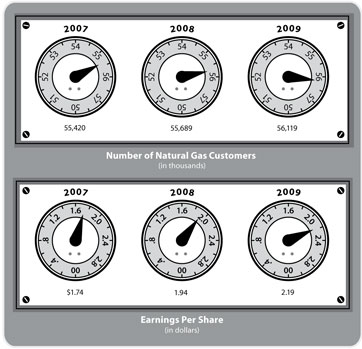
| Basic Earnings Per Share - Continuing Operations |
$ | 2.19 | $ | 1.94 | $ | 1.74 | ||||
| Basic Earnings Per Share - Discontinued Operations |
— | (0.02 | ) | 0.02 | ||||||
| Regular Dividend Per Share - Cash |
$ | 1.28 | $ | 1.25 | $ | 1.22 | ||||
| Number of Customers - Natural Gas |
56,119 | 55,689 | 55,420 | |||||||
| Total Natural Gas Deliveries - DTH |
9,260,469 | 9,251,254 | 9,538,229 | |||||||
| Total Additions to Plant |
$ | 5,752,780 | $ | 6,539,369 | $ | 6,004,190 | ||||
Downtown illustration adapted from an image provided courtesy of Kurt Konrad.


RGC Resources 9 2009 Annual Report
OFFICERS AND BOARD OF DIRECTORS
| OFFICERS | DIRECTORS | Raymond D. Smoot, Jr. | ||
| Chief Operating Officer and | ||||
| John B. Williamson, III | Nancy H. Agee | Secretary-Treasurer | ||
| Chairman of the Board, President and | Chief Operating Officer/Executive | Virginia Tech Foundation, Inc. | ||
| Chief Executive Officer (1)(2)(3)(4) | Vice President | Director: (1) | ||
| Carilion Clinic | ||||
| John S. D’Orazio | Director: (1)(2) | John B. Williamson, III | ||
| Vice President and | Chairman of the Board, President and | |||
| Chief Operating Officer (2)(3)(4) | Abney S. Boxley, III | Chief Executive Officer | ||
| President and | Director: (1)(2)(3)(4) | |||
| Howard T. Lyon | Chief Executive Officer | |||
| Vice President, Treasurer and | Boxley Materials Company | |||
| Chief Financial Officer (1)(2)(3)(4) | Director: (1) | SUBSIDIARY BOARDS OF | ||
| DIRECTORS: | ||||
| Dale P. Lee | Frank T. Ellett | |||
| Vice President and | President | John S. D’Orazio | ||
| Secretary (1)(2)(3)(4) | Virginia Truck Center, Inc. | Vice President and | ||
| Director: (1)(2) | Chief Operating Officer | |||
| Robert L. Wells | Roanoke Gas Company | |||
| Vice President, | Maryellen F. Goodlatte | Director: (3)(4) | ||
| Information Technology, | Attorney and Principal | |||
| Assistant Secretary and | Glenn Feldmann Darby & Goodlatte | Howard T. Lyon | ||
| Assistant Treasurer (1)(2)(3)(4) | Director: (1)(2) | Vice President, Treasurer and | ||
| Chief Financial Officer | ||||
| J. Allen Layman | RGC Resources, Inc. | |||
| Private Investor | Director: (3)(4) | |||
| Director: (1)(2) | ||||
| Dale P. Lee | ||||
| George W. Logan | Vice President and Secretary | |||
| (1) RGC Resources, Inc. |
Chairman of the Board | RGC Resources, Inc. | ||
| (2) Roanoke Gas Company |
Valley Financial Corporation | Director: (3)(4) | ||
| (3) Diversified Energy Company |
Principal | |||
| (4) RGC Ventures of Virginia, Inc. |
Pine Street Partners | Robert L. Wells | ||
| Faculty | Vice President, | |||
| University of Virginia | Information Technology, | |||
| Darden Graduate School of Business | Assistant Secretary and | |||
| Director: (1)(2) | Assistant Treasurer | |||
| RGC Resources, Inc. | ||||
| S. Frank Smith | Director: (3)(4) | |||
| Vice President Industrial Sales | ||||
| Alpha Coal Sales Company, LLC | ||||
| Director: (1)(2) |
RGC Resources 10 2009 Annual Report
SELECTED FINANCIAL DATA
| Years Ended September 30, |
2009 | 2008 | 2007 | 2006 | 2005 | |||||||||||
| Operating Revenues |
$ | 82,184,473 | $ | 94,636,826 | $ | 89,901,301 | $ | 94,590,872 | $ | 88,600,836 | ||||||
| Gross Margin |
27,075,924 | 25,913,612 | 25,221,776 | 23,208,272 | 22,206,395 | |||||||||||
| Operating Income |
9,844,516 | 8,838,026 | 7,958,279 | 6,677,500 | 6,395,564 | |||||||||||
| Net Income - Continuing Operations |
4,869,010 | 4,257,824 | 3,765,669 | 2,961,802 | 2,916,798 | |||||||||||
| Net Income (Loss) - Discontinued Operations |
— | (36,690 | ) | 40,540 | 549,729 | 590,108 | ||||||||||
| Basic Earnings Per Share - Continuing Operations |
$ | 2.19 | $ | 1.94 | $ | 1.74 | $ | 1.40 | $ | 1.40 | ||||||
| Basic Earnings Per Share - Discontinued Operations |
— | (0.02 | ) | 0.02 | 0.26 | 0.29 | ||||||||||
| Cash Dividends Declared Per Share |
$ | 1.28 | $ | 1.25 | $ | 1.22 | $ | 1.20 | $ | 1.18 | ||||||
| Book Value Per Share |
20.01 | 19.79 | 19.38 | 18.94 | 18.18 | |||||||||||
| Average Shares Outstanding |
2,223,727 | 2,201,263 | 2,162,803 | 2,120,267 | 2,079,851 | |||||||||||
| Total Assets |
118,801,892 | 118,127,714 | 116,332,455 | 114,662,572 | 113,563,416 | |||||||||||
| Long-Term Debt (Less Current Portion) |
28,000,000 | 23,000,000 | 23,000,000 | 28,000,000 | 28,000,000 | |||||||||||
| Stockholders’ Equity |
44,799,871 | 43,723,058 | 42,365,233 | 40,494,868 | 38,157,357 | |||||||||||
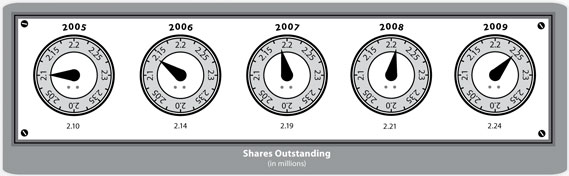
| Shares Outstanding at Sept. 30 |
2,238,987 | 2,209,471 | 2,186,143 | 2,138,595 | 2,098,935 | |||||||||||
RGC Resources 11 2009 Annual Report
RGC Resources 12 2009 Annual Report
RGC Resources 13 2009 Annual Report
RGC Resources 14 2009 Annual Report
RESULTS OF OPERATIONS – CONTINUING OPERATIONS
Fiscal Year 2009 Compared with Fiscal Year 2008
Delivered Volumes - The table below reflects volume activity and heating degree-days.
| Year Ended September 30, |
2009 | 2008 | Increase/ (Decrease) |
Percentage | ||||||
| Regulated Natural Gas (DTH) |
||||||||||
| Residential and Commercial |
6,697,738 | 6,342,950 | 354,788 | 6 | % | |||||
| Transportation and Interruptible |
2,562,731 | 2,908,304 | (345,573 | ) | -12 | % | ||||
| Total |
9,260,469 | 9,251,254 | 9,215 | 0 | % | |||||
| Heating Degree-Days (Unofficial) |
3,914 | 3,624 | 290 | 8 | % |
Operating Revenues - The table below reflects operating revenues.
| Year Ended September 30, |
2009 | 2008 | Increase/ (Decrease) |
Percentage | |||||||||
| Gas Utility |
$ | 80,786,228 | $ | 93,606,593 | $ | (12,820,365 | ) | -14 | % | ||||
| Other |
1,398,245 | 1,030,233 | 368,012 | 36 | % | ||||||||
| Total Operating Revenues |
$ | 82,184,473 | $ | 94,636,826 | $ | (12,452,353 | ) | -13 | % | ||||
RGC Resources 15 2009 Annual Report
Gross Margin - The table below reflects gross margins.
| Year Ended September 30, |
2009 | 2008 | Increase/ (Decrease) |
Percentage | ||||||||
| Gas Utilities |
$ | 26,377,450 | $ | 25,323,464 | $ | 1,053,986 | 4 | % | ||||
| Other |
698,474 | 590,148 | 108,326 | 18 | % | |||||||
| Total Gross Margin |
$ | 27,075,924 | $ | 25,913,612 | $ | 1,162,312 | 4 | % | ||||
RGC Resources 16 2009 Annual Report
RGC Resources 17 2009 Annual Report
RGC Resources 18 2009 Annual Report
RGC Resources 19 2009 Annual Report
RGC Resources 20 2009 Annual Report
RGC Resources 21 2009 Annual Report
The following schedule reflects the sensitivity of pension costs to changes in certain actuarial assumptions, assuming that the other components of the calculation remain constant.
| Actuarial Assumption |
Change in Assumption |
Impact on Pension Cost |
Impact on Projected Benefit Obligation | ||||||
| Discount rate |
-0.25 | % | $ | 118,000 | $ | 690,000 | |||
| Rate of return on plan assets |
-0.25 | % | 28,000 | N/A | |||||
| Rate of increase in compensation |
0.25 | % | 44,000 | 238,000 | |||||
The following schedule reflects the sensitivity of postretirement benefit costs from changes in certain actuarial assumptions, while the other components of the calculation remain constant.
| Actuarial Assumption |
Change in Assumption |
Impact on Postretirement Benefit Cost |
Impact on Accumulated Postretirement Benefit Obligation | ||||||
| Discount rate |
-0.25 | % | $ | 24,000 | $ | 313,000 | |||
| Rate of return on plan assets |
-0.25 | % | 16,000 | N/A | |||||
| Health care cost trend rate |
0.25 | % | 25,000 | 323,000 | |||||
RGC Resources 22 2009 Annual Report
RGC Resources 23 2009 Annual Report
RGC Resources 24 2009 Annual Report
RGC Resources 25 2009 Annual Report
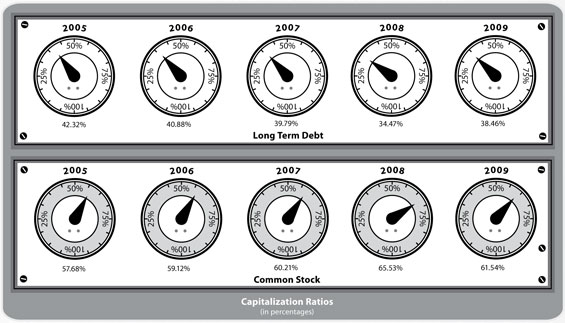
CAPITALIZATION RATIOS
| Years Ended September 30, |
2009 | 2008 | 2007 | 2006 | 2005 | |||||||||||||||
| COMMON STOCK: |
||||||||||||||||||||
| Shares Issued |
2,238,987 | 2,209,471 | 2,186,143 | 2,138,595 | 2,098,935 | |||||||||||||||
| Continuing Operations: |
||||||||||||||||||||
| Basic Earnings Per Share |
$ | 2.19 | $ | 1.94 | $ | 1.74 | $ | 1.40 | $ | 1.40 | ||||||||||
| Diluted Earnings Per Share |
$ | 2.18 | $ | 1.93 | $ | 1.73 | $ | 1.39 | $ | 1.39 | ||||||||||
| Discontinued Operations: |
||||||||||||||||||||
| Basic Earnings Per Share |
$ | 0.00 | $ | (0.02 | ) | $ | 0.02 | $ | 0.26 | $ | 0.29 | |||||||||
| Diluted Earnings Per Share |
$ | 0.00 | $ | (0.02 | ) | $ | 0.02 | $ | 0.26 | $ | 0.29 | |||||||||
| Dividends Paid Per Share (Cash) |
$ | 1.28 | $ | 1.25 | $ | 1.22 | $ | 1.20 | $ | 1.18 | ||||||||||
| Dividends Paid Out Ratio |
58.4 | % | 65.1 | % | 69.3 | % | 72.3 | % | 69.8 | % | ||||||||||
| CAPITALIZATION RATIOS: |
||||||||||||||||||||
| Long-Term Debt, Including Current Maturities |
38.5 | 34.5 | 39.8 | 40.9 | 42.3 | |||||||||||||||
| Common Stock and Surplus |
61.5 | 65.5 | 60.2 | 59.1 | 57.7 | |||||||||||||||
| Total |
100.0 | 100.0 | 100.0 | 100.0 | 100.0 | |||||||||||||||
| Long-Term Debt, Including Current Maturities |
$ | 28,000,000 | $ | 23,000,000 | $ | 28,000,000 | $ | 28,000,000 | $ | 28,000,000 | ||||||||||
| Common Stock and Surplus |
44,799,871 | 43,723,058 | 42,365,233 | 40,494,868 | 38,157,357 | |||||||||||||||
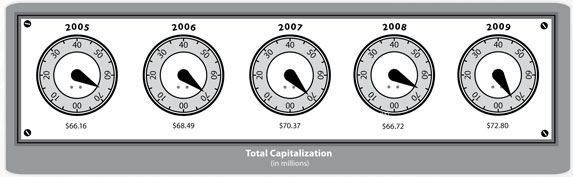
| Total Capitalization Plus Current Maturities |
$ | 72,799,871 | $ | 66,723,058 | $ | 70,365,233 | $ | 68,494,868 | $ | 66,157,357 | ||||||||||
RGC Resources 26 2009 Annual Report
MARKET PRICE AND DIVIDEND INFORMATION
RGC Resources’ common stock is listed on the NASDAQ National Market under the trading symbol RGCO. Payment of dividends is within the discretion of the Board of Directors and will depend on, among other factors, earnings, capital requirements, and the operating and financial condition of the Company. The Company’s long-term indebtedness contains restrictions on dividends based on cumulative net earnings and dividends previously paid.
| Range of Bid Prices | Cash Dividends Declared | ||||||||
| Fiscal Year Ended September 30, |
High | Low | |||||||
| 2009 |
|||||||||
| First Quarter |
$ | 30.07 | $ | 24.15 | $ | 0.320 | |||
| Second Quarter |
28.00 | 21.92 | 0.320 | ||||||
| Third Quarter |
27.38 | 22.95 | 0.320 | ||||||
| Fourth Quarter |
30.78 | 24.94 | 0.320 | ||||||
| 2008 |
|||||||||
| First Quarter |
$ | 33.35 | $ | 26.02 | $ | 0.3125 | |||
| Second Quarter |
31.43 | 27.25 | 0.3125 | ||||||
| Third Quarter |
29.25 | 27.13 | 0.3125 | ||||||
| Fourth Quarter |
32.50 | 26.68 | 0.3125 | ||||||
RGC Resources 27 2009 Annual Report
SUMMARY OF GAS SALES AND STATISTICS
| Years Ended September 30, |
2009 | 2008 | 2007 | 2006 | 2005 | |||||||||||
| REVENUES: |
||||||||||||||||
| Residential Sales |
$ | 47,544,448 | $ | 52,927,761 | $ | 50,791,195 | $ | 52,274,204 | $ | 49,332,645 | ||||||
| Commercial Sales |
29,909,205 | 36,507,326 | 34,566,385 | 36,159,320 | 33,059,542 | |||||||||||
| Interruptible Sales |
635,301 | 1,509,193 | 1,379,870 | 3,054,240 | 3,029,697 | |||||||||||
| Transportation Gas Sales |
2,506,958 | 2,428,656 | 2,254,594 | 2,067,929 | 2,110,002 | |||||||||||
| Backup Services |
300 | 3,600 | 3,600 | 3,600 | 62,756 | |||||||||||
| Late Payment Charges |
56,718 | 55,410 | 55,438 | 70,191 | 55,109 | |||||||||||
| Miscellaneous Gas Utility Revenue |
133,298 | 174,647 | 124,579 | 116,924 | 102,918 | |||||||||||
| Other |
1,398,245 | 1,030,233 | 725,640 | 844,464 | 848,167 | |||||||||||
| Total |
$ | 82,184,473 | $ | 94,636,826 | $ | 89,901,301 | $ | 94,590,872 | $ | 88,600,836 | ||||||
| NET INCOME |
||||||||||||||||
| Continuing Operations |
$ | 4,869,010 | $ | 4,257,824 | $ | 3,765,669 | $ | 2,961,802 | $ | 2,916,798 | ||||||
| Discontinued Operations |
— | (36,690 | ) | 40,540 | 549,729 | 590,108 | ||||||||||
| Net Income |
$ | 4,869,010 | $ | 4,221,134 | $ | 3,806,209 | $ | 3,511,531 | $ | 3,506,906 | ||||||
| DTH DELIVERED: |
||||||||||||||||
| Residential |
3,866,956 | 3,557,249 | 3,778,194 | 3,588,364 | 3,987,368 | |||||||||||
| Commercial |
2,830,782 | 2,785,701 | 2,886,403 | 2,793,988 | 2,859,471 | |||||||||||
| Interruptible |
75,061 | 128,875 | 138,176 | 278,535 | 321,860 | |||||||||||
| Transportation Gas |
2,487,670 | 2,779,429 | 2,735,456 | 2,853,500 | 3,202,923 | |||||||||||
| Backup Service |
— | — | — | — | 5,531 | |||||||||||
| Total |
9,260,469 | 9,251,254 | 9,538,229 | 9,514,387 | 10,377,153 | |||||||||||
| HEATING DEGREE DAYS |
3,914 | 3,624 | 3,735 | 3,714 | 3,783 | |||||||||||
| NUMBER OF CUSTOMERS: |
||||||||||||||||
| Natural Gas |
||||||||||||||||
| Residential |
51,069 | 50,630 | 50,371 | 49,649 | 49,178 | |||||||||||
| Commercial |
5,018 | 5,026 | 5,017 | 4,948 | 4,939 | |||||||||||
| Interruptible and Interruptible |
||||||||||||||||
| Transportation Service |
32 | 33 | 32 | 32 | 36 | |||||||||||
| Total |
56,119 | 55,689 | 55,420 | 54,629 | 54,153 | |||||||||||
| GAS ACCOUNT (DTH): |
||||||||||||||||
| Natural Gas Available |
9,549,231 | 9,528,890 | 9,744,431 | 9,703,011 | 10,546,259 | |||||||||||
| Natural Gas Deliveries |
9,260,469 | 9,251,254 | 9,538,229 | 9,514,387 | 10,377,153 | |||||||||||
| Storage - LNG |
124,925 | 122,874 | 65,279 | 98,936 | 89,896 | |||||||||||
| Company Use and Miscellaneous |
39,697 | 45,180 | 28,862 | 36,321 | 47,568 | |||||||||||
| System Loss |
124,140 | 109,582 | 112,061 | 53,367 | 31,642 | |||||||||||
| Total Gas Available |
9,549,231 | 9,528,890 | 9,744,431 | 9,703,011 | 10,546,259 | |||||||||||
| TOTAL ASSETS |
$ | 118,801,892 | $ | 118,127,714 | $ | 116,332,455 | $ | 114,662,572 | $ | 113,563,416 | ||||||
| LONG-TERM OBLIGATIONS |
$ | 28,000,000 | $ | 23,000,000 | $ | 23,000,000 | $ | 28,000,000 | $ | 28,000,000 | ||||||
RGC Resources 28 2009 Annual Report
RGC Resources, Inc. and Subsidiaries
Consolidated Financial Statements
for the Years Ended September 30, 2009
and 2008, and Report of Independent
Registered Public Accounting Firm
RGC RESOURCES, INC. AND SUBSIDIARIES
TABLE OF CONTENTS
| Page | ||
| REPORT OF INDEPENDENT REGISTERED PUBLIC ACCOUNTING FIRM |
1 | |
| CONSOLIDATED FINANCIAL STATEMENTS FOR THE YEARS ENDED SEPTEMBER 30, 2009 AND 2008: |
||
| Consolidated Balance Sheets |
2-3 | |
| Consolidated Statements of Income and Comprehensive Income |
4-5 | |
| Consolidated Statements of Stockholders’ Equity |
6 | |
| Consolidated Statements of Cash Flows |
7-8 | |
| Notes to Consolidated Financial Statements |
9-35 | |

REPORT OF INDEPENDENT REGISTERED PUBLIC ACCOUNTING FIRM
Board of Directors and Stockholders
RGC Resources, Inc.
Roanoke, Virginia
We have audited the accompanying consolidated balance sheets of RGC Resources, Inc. and Subsidiaries (“the Company”) as of September 30, 2009 and 2008, and the related consolidated statements of income and comprehensive income, stockholders’ equity, and cash flows for the years then ended. The Company’s management is responsible for these financial statements. Our responsibility is to express an opinion on these consolidated financial statements based on our audits.
We conducted our audit in accordance with the standards of the Public Company Accounting Oversight Board (United States). Those standards require that we plan and perform the audit to obtain reasonable assurance about whether the financial statements are free of material misstatement. The Company is not required to have, nor were we engaged to perform, an audit of its internal control over financial reporting. Our audits included consideration of internal control over financial reporting as a basis for designing audit procedures that are appropriate in the circumstances, but not for the purpose of expressing an opinion on the effectiveness of the Company’s internal control over financial reporting. Accordingly, we express no such opinion. An audit also includes examining, on a test basis, evidence supporting the amounts and disclosures in the financial statements, assessing the accounting principles used and significant estimates made by management, as well as evaluating the overall financial statement presentation. We believe that our audit provides a reasonable basis for our opinion.
In our opinion, the financial statements referred to above present fairly, in all material respects, the financial position of RGC Resources, Inc. and Subsidiaries as of September 30, 2009 and 2008, and the consolidated results of its operations and its cash flows for the years then ended in conformity with accounting principles generally accepted in the United States of America.
 |
| CERTIFIED PUBLIC ACCOUNTANTS |
319 McClanahan Street, S.W.
Roanoke, Virginia
December 16, 2009
RGC RESOURCES, INC. AND SUBSIDIARIES
CONSOLIDATED BALANCE SHEETS
AS OF SEPTEMBER 30, 2009 AND 2008
| 2009 | 2008 | |||||||
| ASSETS |
||||||||
| CURRENT ASSETS: |
||||||||
| Cash and cash equivalents |
$ | 7,422,360 | $ | 875,436 | ||||
| Short-term investments |
— | 500,000 | ||||||
| Accounts receivable, less allowance for doubtful accounts of $50,687 in 2009 and $63,791 in 2008 |
3,562,837 | 5,086,790 | ||||||
| Note receivable |
87,000 | 87,000 | ||||||
| Materials and supplies |
587,815 | 553,604 | ||||||
| Gas in storage |
16,072,911 | 26,122,686 | ||||||
| Prepaid income taxes |
1,974,917 | 1,479,693 | ||||||
| Deferred income taxes |
3,424,628 | 2,187,795 | ||||||
| Under-recovery of gas costs |
— | 1,013,087 | ||||||
| Other |
985,110 | 505,761 | ||||||
| Total current assets |
34,117,578 | 38,411,852 | ||||||
| UTILITY PROPERTY: |
||||||||
| In service |
118,009,532 | 113,533,184 | ||||||
| Accumulated depreciation and amortization |
(41,104,408 | ) | (39,038,120 | ) | ||||
| In service, net |
76,905,124 | 74,495,064 | ||||||
| Construction work in progress |
1,604,046 | 1,113,008 | ||||||
| Utility plant, net |
78,509,170 | 75,608,072 | ||||||
| OTHER ASSETS: |
||||||||
| Note receivable |
1,126,000 | 1,213,000 | ||||||
| Regulatory assets |
4,989,347 | 2,762,241 | ||||||
| Other |
59,797 | 132,549 | ||||||
| Total other assets |
6,175,144 | 4,107,790 | ||||||
| TOTAL ASSETS |
$ | 118,801,892 | $ | 118,127,714 | ||||
(Continued)
- 2 -
RGC RESOURCES, INC. AND SUBSIDIARIES
CONSOLIDATED BALANCE SHEETS
AS OF SEPTEMBER 30, 2009 AND 2008
| 2009 | 2008 | |||||||
| LIABILITIES AND STOCKHOLDERS’ EQUITY |
||||||||
| CURRENT LIABILITIES: |
||||||||
| Borrowings under lines-of-credit |
$ | — | $ | 13,960,000 | ||||
| Dividends payable |
716,556 | 690,538 | ||||||
| Accounts payable |
4,449,735 | 8,215,319 | ||||||
| Customer credit balances |
4,204,556 | 4,237,043 | ||||||
| Income taxes payable |
— | 3,206 | ||||||
| Customer deposits |
1,601,206 | 1,522,480 | ||||||
| Accrued expenses |
2,219,587 | 2,111,614 | ||||||
| Over-recovery of gas costs |
5,651,847 | — | ||||||
| Fair value of marked-to-market transactions |
2,451,055 | 875,487 | ||||||
| Total current liabilities |
21,294,542 | 31,615,687 | ||||||
| LONG-TERM DEBT |
28,000,000 | 23,000,000 | ||||||
| DEFERRED CREDITS AND OTHER LIABILITIES: |
||||||||
| Asset retirement obligations |
2,735,735 | 2,608,995 | ||||||
| Regulatory cost of retirement obligations |
7,401,024 | 6,843,338 | ||||||
| Benefit plan liabilities |
7,970,074 | 4,768,785 | ||||||
| Deferred income taxes |
6,534,621 | 5,471,667 | ||||||
| Deferred investment tax credits |
66,025 | 96,184 | ||||||
| Total deferred credits and other liabilities |
24,707,479 | 19,788,969 | ||||||
| COMMITMENTS AND CONTINGENCIES (Notes 10 and 11) |
||||||||
| CAPITALIZATION: |
||||||||
| Stockholders’ Equity: |
||||||||
| Common Stock, $5 par value; authorized 10,000,000 shares; issued and outstanding 2,238,987 and 2,209,471 shares in 2009 and 2008, respectively |
11,194,935 | 11,047,355 | ||||||
| Preferred stock, no par; authorized 5,000,000 shares; no shares issued and outstanding in 2009 and 2008 |
— | — | ||||||
| Capital in excess of par value |
16,607,897 | 15,990,961 | ||||||
| Retained earnings |
19,881,745 | 17,909,134 | ||||||
| Accumulated other comprehensive loss |
(2,884,706 | ) | (1,224,392 | ) | ||||
| Total stockholders’ equity |
44,799,871 | 43,723,058 | ||||||
| TOTAL LIABILITIES AND STOCKHOLDERS’ EQUITY |
$ | 118,801,892 | $ | 118,127,714 | ||||
(Concluded)
See notes to consolidated financial statements.
- 3 -
RGC RESOURCES, INC. AND SUBSIDIARIES
CONSOLIDATED STATEMENTS OF INCOME AND COMPREHENSIVE INCOME
YEARS ENDED SEPTEMBER 30, 2009 AND 2008
| 2009 | 2008 | |||||||
| OPERATING REVENUES: |
||||||||
| Gas utilities |
$ | 80,786,228 | $ | 93,606,593 | ||||
| Other |
1,398,245 | 1,030,233 | ||||||
| Total operating revenues |
82,184,473 | 94,636,826 | ||||||
| COST OF SALES: |
||||||||
| Gas utilities |
54,408,778 | 68,283,129 | ||||||
| Other |
699,771 | 440,085 | ||||||
| Total cost of sales |
55,108,549 | 68,723,214 | ||||||
| GROSS MARGIN |
27,075,924 | 25,913,612 | ||||||
| OTHER OPERATING EXPENSES: |
||||||||
| Operations |
10,565,267 | 10,107,242 | ||||||
| Maintenance |
1,765,511 | 1,470,212 | ||||||
| General taxes |
1,240,209 | 1,167,293 | ||||||
| Depreciation and amortization |
3,660,421 | 4,330,839 | ||||||
| Total other operating expenses |
17,231,408 | 17,075,586 | ||||||
| OPERATING INCOME |
9,844,516 | 8,838,026 | ||||||
| OTHER INCOME (EXPENSE), Net |
(70,091 | ) | 34,622 | |||||
| INTEREST EXPENSE |
1,918,106 | 2,033,082 | ||||||
| INCOME FROM CONTINUING OPERATIONS BEFORE INCOME TAXES |
7,856,319 | 6,839,566 | ||||||
| INCOME TAX EXPENSE FROM CONTINUING OPERATIONS |
2,987,309 | 2,581,742 | ||||||
| INCOME FROM CONTINUING OPERATIONS |
4,869,010 | 4,257,824 | ||||||
| DISCONTINUED OPERATIONS: |
||||||||
| Loss from discontinued operations, net of income tax benefit of ($14,628) |
— | (36,690 | ) | |||||
| NET INCOME |
4,869,010 | 4,221,134 | ||||||
| OTHER COMPREHENSIVE LOSS, NET OF TAX |
(1,671,535 | ) | (749,137 | ) | ||||
| COMPREHENSIVE INCOME |
$ | 3,197,475 | $ | 3,471,997 | ||||
(Continued)
- 4 -
RGC RESOURCES, INC. AND SUBSIDIARIES
CONSOLIDATED STATEMENTS OF INCOME AND COMPREHENSIVE INCOME
YEARS ENDED SEPTEMBER 30, 2009 AND 2008
| 2009 | 2008 | ||||||
| BASIC EARNINGS PER COMMON SHARE: |
|||||||
| Income from continuing operations |
$ | 2.19 | $ | 1.94 | |||
| Discontinued operations |
— | (0.02 | ) | ||||
| Net income |
$ | 2.19 | $ | 1.92 | |||
| DILUTED EARNINGS PER COMMON SHARE: |
|||||||
| Income from continuing operations |
$ | 2.18 | $ | 1.93 | |||
| Discontinued operations |
— | (0.02 | ) | ||||
| Net income |
$ | 2.18 | $ | 1.91 | |||
| WEIGHTED AVERAGE NUMBER OF SHARES OUTSTANDING: |
|||||||
| Basic |
2,223,727 | 2,201,263 | |||||
| Diluted |
2,231,040 | 2,211,226 | |||||
(Concluded)
See notes to consolidated financial statements.
- 5 -
RGC RESOURCES, INC. AND SUBSIDIARIES
CONSOLIDATED STATEMENTS OF STOCKHOLDERS’ EQUITY
YEARS ENDED SEPTEMBER 30, 2009 AND 2008
| Common Stock |
Capital in Excess of Par Value |
Retained Earnings |
Accumulated Other Comprehensive Income (Loss) |
Total Stockholders’ Equity |
||||||||||||||
| Balance - September 30, 2007 |
$ | 10,930,715 | $ | 15,466,756 | $ | 16,443,017 | $ | (475,255 | ) | $ | 42,365,233 | |||||||
| Net income |
— | — | 4,221,134 | — | 4,221,134 | |||||||||||||
| Losses on hedging activities, net of tax |
— | — | — | (466,300 | ) | (466,300 | ) | |||||||||||
| Change in net loss and transition obligation of defined benefit plans, net of tax |
— | — | — | (282,837 | ) | (282,837 | ) | |||||||||||
| Cash dividends declared ($1.25 per share) |
— | — | (2,755,017 | ) | — | (2,755,017 | ) | |||||||||||
| Issuance of common stock (23,328 shares) |
116,640 | 524,205 | — | — | 640,845 | |||||||||||||
| Balance - September 30, 2008 |
$ | 11,047,355 | $ | 15,990,961 | $ | 17,909,134 | $ | (1,224,392 | ) | $ | 43,723,058 | |||||||
| Change in measurement date - benefit plans, net of tax |
— | — | (44,931 | ) | 11,221 | (33,710 | ) | |||||||||||
| Net income |
— | — | 4,869,010 | — | 4,869,010 | |||||||||||||
| Losses on hedging activities, net of tax |
— | — | — | (1,000,965 | ) | (1,000,965 | ) | |||||||||||
| Change in net loss and transition obligation of defined benefit plans, net of tax |
— | — | — | (670,570 | ) | (670,570 | ) | |||||||||||
| Tax benefits from stock option exercise |
— | 16,407 | — | — | 16,407 | |||||||||||||
| Cash dividends declared ($1.28 per share) |
— | — | (2,851,468 | ) | — | (2,851,468 | ) | |||||||||||
| Issuance of common stock (29,516 shares) |
147,580 | 600,529 | — | — | 748,109 | |||||||||||||
| Balance - September 30, 2009 |
$ | 11,194,935 | $ | 16,607,897 | $ | 19,881,745 | $ | (2,884,706 | ) | $ | 44,799,871 | |||||||
See notes to consolidated financial statements.
- 6 -
RGC RESOURCES, INC. AND SUBSIDIARIES
CONSOLIDATED STATEMENTS OF CASH FLOWS
YEARS ENDED SEPTEMBER 30, 2009 AND 2008
| 2009 | 2008 | |||||||
| CASH FLOWS FROM OPERATING ACTIVITIES: |
||||||||
| Net income from continuing operations |
$ | 4,869,010 | $ | 4,257,824 | ||||
| Adjustments to reconcile net income to net cash provided by operations: |
||||||||
| Depreciation and amortization |
3,815,009 | 4,526,670 | ||||||
| Cost of removal of utility plant, net |
(263,446 | ) | (202,843 | ) | ||||
| Loss on disposal of property |
— | 7,304 | ||||||
| Change in over/under-recovery of gas costs |
6,627,084 | (1,542,532 | ) | |||||
| Deferred taxes and investment tax credits |
812,532 | (730,442 | ) | |||||
| Other noncash items, net |
39,111 | 28,329 | ||||||
| Changes in assets and liabilities which provided (used) cash: |
||||||||
| Accounts receivable and customer deposits, net |
1,602,679 | (556,147 | ) | |||||
| Inventories and gas in storage |
10,015,564 | (7,003,735 | ) | |||||
| Other current assets |
(781,945 | ) | 310,119 | |||||
| Accounts payable, customer credit balances and accrued expenses, net |
(4,029,786 | ) | 1,403,231 | |||||
| Total adjustments |
17,836,802 | (3,760,046 | ) | |||||
| Net cash provided by continuing operating activities |
22,705,812 | 497,778 | ||||||
| Net cash used in discontinued operations |
— | (277,913 | ) | |||||
| Net cash provided by operating activities |
22,705,812 | 219,865 | ||||||
| CASH FLOWS FROM INVESTING ACTIVITIES: |
||||||||
| Expenditures for utility property |
(5,752,780 | ) | (6,539,369 | ) | ||||
| Proceeds from disposal of utility property |
27,826 | 17,540 | ||||||
| Proceeds from sale of Bluefield Operations |
— | 3,855,323 | ||||||
| Proceeds from sale of short-term investments |
500,000 | — | ||||||
| Purchase of short-term investments |
— | (500,000 | ) | |||||
| Net cash used in continuing investing activities |
(5,224,954 | ) | (3,166,506 | ) | ||||
| Net cash used in discontinued investing activities |
— | (12,360 | ) | |||||
| Net cash used in investing activities |
(5,224,954 | ) | (3,178,866 | ) | ||||
(Continued)
- 7 -
RGC RESOURCES, INC. AND SUBSIDIARIES
CONSOLIDATED STATEMENTS OF CASH FLOWS
YEARS ENDED SEPTEMBER 30, 2009 AND 2008
| 2009 | 2008 | |||||||
| CASH FLOWS FROM FINANCING ACTIVITIES: |
||||||||
| Proceeds from issuance of long-term debt |
$ | 5,000,000 | $ | — | ||||
| Retirement of long-term debt |
— | (5,000,000 | ) | |||||
| Proceeds on collection of note |
87,000 | — | ||||||
| Net borrowings (repayments) under line-of-credit agreements |
(13,960,000 | ) | 9,152,000 | |||||
| Proceeds from issuance of common stock |
764,516 | 640,845 | ||||||
| Cash dividends paid |
(2,825,450 | ) | (2,731,725 | ) | ||||
| Net cash provided by (used in) continuing financing activities |
(10,933,934 | ) | 2,061,120 | |||||
| Net cash provided by discontinued financing activities |
— | 365,000 | ||||||
| Net cash provided by (used in) financing activities |
(10,933,934 | ) | 2,426,120 | |||||
| NET INCREASE (DECREASE) IN CASH AND CASH EQUIVALENTS |
6,546,924 | (532,881 | ) | |||||
| CASH AND CASH EQUIVALENTS AT BEGINNING OF YEAR |
875,436 | 1,408,317 | ||||||
| CASH AND CASH EQUIVALENTS AT END OF YEAR |
$ | 7,422,360 | $ | 875,436 | ||||
| SUPPLEMENTAL DISCLOSURE OF CASH FLOWS INFORMATION: |
||||||||
| Cash paid during the year for: |
||||||||
| Interest |
$ | 1,897,818 | $ | 2,188,420 | ||||
| Income taxes, net of refunds |
2,629,308 | 3,094,944 | ||||||
| Non-cash transactions: | ||||||||
| A note in the amount of $1,300,000 was received as partial payment for the sale of the assets of the Bluefield division of Roanoke Gas Company in November 2007. |
||||||||
(Concluded)
See notes to consolidated financial statements.
- 8 -
RGC RESOURCES, INC. AND SUBSIDIARIES
NOTES TO CONSOLIDATED FINANCIAL STATEMENTS
YEARS ENDED SEPTEMBER 30, 2009 AND 2008
| 1. | SUMMARY OF SIGNIFICANT ACCOUNTING POLICIES |
General—RGC Resources, Inc. is an energy services company engaged in the sale and distribution of natural gas. The consolidated financial statements include the accounts of RGC Resources, Inc. and its wholly owned subsidiaries (“Resources” or the “Company”); Roanoke Gas Company (“Roanoke Gas”); Diversified Energy Company; and RGC Ventures of Virginia, Inc., operating as Application Resources. Roanoke Gas is a natural gas utility, which distributes and sells natural gas to approximately 56,100 residential, commercial and industrial customers within its service areas in Roanoke, Virginia and the surrounding localities. The Company’s business is seasonal in nature and weather dependent as a majority of natural gas sales are for space heating during the winter season. Roanoke Gas is regulated by the Virginia State Corporation Commission (“SCC” or “Virginia Commission”). Application Resources provides information system services to software providers in the utility industry. Diversified Energy Company is currently inactive.
Effective October 31, 2007, Resources sold all of the capital stock of Bluefield Gas Company and Roanoke Gas sold the natural gas distribution assets located in the Town of Bluefield and the County of Tazewell, Virginia. See Note 2 for additional information on the sale and corresponding discontinued operations.
The Company follows accounting standards set by the Financial Accounting Standards Board (“FASB”) and the Securities and Exchange Commission (“SEC”). The FASB sets Generally Accepted Accounting Principles (“GAAP”) that ensure consistent reporting of financial condition, results of operations and cash flows. Effective for reporting periods ending on or after September 15, 2009, the FASB recognized the FASB Accounting Standards Codification, also referred to as the Codification or ASC, as the authoritative source of U.S. accounting and reporting standards for use in the preparation of financial statements of nongovernmental entities that are presented in conformity with GAAP. The Codification was a result of a project of FASB to organize and simplify all authoritative GAAP literature into one source. References to GAAP issued by FASB contained in the footnotes to these financial statements are to the Codification. References to prior FASB accounting standards, interpretations, and guidance have been replaced with references to the particular topics in the Codification.
Resources has only one reportable segment as defined under FASB ASC No. 280 – Segment Reporting. All intercompany transactions have been eliminated in consolidation.
Rate Regulated Basis of Accounting—The Company’s regulated operations follow the accounting and reporting requirements of FASB ASC No. 980, Regulated Operations. The economic effects of regulation can result in a regulated company deferring costs that have been or are expected to be recovered from customers in a period different from the period in which the costs would be charged to expense by an unregulated enterprise. When this situation occurs, costs are deferred as assets in the consolidated balance sheet (regulatory assets) and recorded as expenses when such amounts are reflected in rates. Additionally, regulators can impose liabilities upon a regulated company for amounts previously collected from customers and for current collection in rates of costs that are expected to be incurred in the future (regulatory liabilities). In the event that the provisions of FASB ASC No. 980 no longer apply to any or all regulatory assets or liabilities, the Company would write off such amounts and include them in the consolidated statement of income and comprehensive income for the period in which FASB ASC No. 980 no longer applied.
- 9 -
Regulatory assets and liabilities included in the Company’s consolidated balance sheets as of September 30, 2009 and 2008 are as follows:
| September 30 | ||||||
| 2009 | 2008 | |||||
| Regulatory Assets: |
||||||
| Current Assets: |
||||||
| Under-recovery of gas costs |
$ | — | $ | 1,013,087 | ||
| Other: |
||||||
| Accrued pension and postretirement medical |
442,062 | 187,134 | ||||
| Utility Property: |
||||||
| In service: |
||||||
| Other |
11,945 | 11,945 | ||||
| Other Assets: |
||||||
| Regulatory assets: |
||||||
| Premium on early retirement of debt |
187,324 | 217,701 | ||||
| Accrued pension and postretirement medical |
4,802,023 | 2,544,540 | ||||
| Total regulatory assets |
$ | 5,443,354 | $ | 3,974,407 | ||
| Regulatory Liabilities: |
||||||
| Current Liabilities: |
||||||
| Over-recovery of gas costs |
$ | 5,651,847 | $ | — | ||
| Deferred Credits and Other Liabilities: |
||||||
| Asset retirement obligations |
2,735,735 | 2,608,995 | ||||
| Regulatory cost of retirement obligations |
7,401,024 | 6,843,338 | ||||
| Total regulatory liabilities |
$ | 15,788,606 | $ | 9,452,333 | ||
As of September 30, 2009, the Company had regulatory assets in the amount of $5,120,973 on which the Company did not earn a return during the recovery period. These assets pertain to the net funded position of the Company’s benefit plans related to the regulated operations. As such, the amortization period is not specifically defined.
Utility Plant and Depreciation—Utility plant is stated at original cost. The cost of additions to utility plant includes direct charges and overhead. The cost of depreciable property retired is charged to accumulated depreciation. The cost of asset removals, less salvage, is charged to “regulatory cost of retirement obligations” or “asset retirement obligations” as explained under Asset Retirement Obligations below. Maintenance, repairs, and minor renewals and betterments of property are charged to operations and maintenance.
- 10 -
Provisions for depreciation are computed principally at composite straight-line rates as determined by depreciation studies required to be performed on the regulated utility assets of Roanoke Gas Company every five years. The Company completed its most recent depreciation study in July 2009 and received notification from the SCC to implement these new rates retroactive to October 1, 2008. The composite weighted-average depreciation rate under the new depreciation study was 3.31% for the year ended September 30, 2009 compared to 4.12% of average depreciable property for the year ended September 30, 2008. The effect on depreciation expense is considered a change in accounting estimate and is recorded in the period in which the Company received approval from the SCC. The effect of this change in estimate was to reduce depreciation expense by $888,466, increase income from continuing operations and net income by $551,204 and increase earnings per share by $0.25 for the year ended September 30, 2009.
The composite rates are comprised of two components, one based on average service life and one based on cost of retirement. Therefore, the Company accrues the estimated cost of retirement of long-lived assets through depreciation expense. Retirement costs are not a legal obligation but rather the result of cost-based regulation and are accounted for under the provisions of FASB ASC No. 980. Therefore, such amounts are classified as a regulatory liability.
The Company reviews long-lived assets and certain identifiable intangibles for impairment whenever events or changes in circumstances indicate that the carrying amount of an asset may not be recoverable. These reviews have not identified an impairment which would cause a material effect on results of operations or financial condition.
Asset Retirement Obligations—FASB ASC No. 410, Asset Retirement and Environmental Obligations, requires entities to record the fair value of a liability for an asset retirement obligation when there exists a legal obligation for the retirement of the asset. When the liability is initially recorded, the entity capitalizes the cost, thereby increasing the carrying amount of the underlying asset. In subsequent periods, the liability is accreted, and the capitalized cost is depreciated over the useful life of the underlying asset. The Company recorded asset retirement obligations for its future legal obligations related to purging and capping its distribution mains and services upon retirement, although the timing of such retirements is uncertain.
The Company’s composite depreciation rates include a component to provide for the cost of retirement of assets. As a result, the Company accrues estimated cost of retirement of its utility plant through depreciation expense and creates a corresponding regulatory liability in accordance with the provisions of FASB ASC No. 980. The costs of retirement considered in the development of the depreciation component include those costs associated with the legal liability. Therefore, the Company reclassified a portion of its regulatory liability for cost of retirement to asset retirement obligations for the legal liability as determined above. The accretion of the asset retirement obligation is reclassified from the regulatory cost of retirement obligation. If the legal obligations would exceed the regulatory liability provided for in the depreciation rates, the Company would establish a regulatory asset for such difference with the anticipation of future recovery through rates charged to customers.
- 11 -
The following is a summary of the asset retirement obligation:
| Years Ended September 30 | ||||||||
| 2009 | 2008 | |||||||
| Balance, beginning of year |
$ | 2,608,995 | $ | 2,499,345 | ||||
| Accretion |
141,816 | 121,982 | ||||||
| Additions |
16,312 | 27,766 | ||||||
| Retirements |
(31,388 | ) | (40,098 | ) | ||||
| Balance, end of year |
$ | 2,735,735 | $ | 2,608,995 | ||||
Cash, Cash Equivalents and Short-Term Investments—From time to time, the Company will have on deposit at banks balances in excess of the amount insured by the Federal Deposit Insurance Corporation (“FDIC”). The Company has not experienced any losses on these accounts and does not consider these amounts to be at credit risk. As of September 30, 2009, the Company did not have any bank deposits in excess of the FDIC insurance limits of $250,000. For purposes of the consolidated statements of cash flows, the Company considers all highly liquid debt instruments purchased with an original maturity of three months or less to be cash equivalents.
Customer Receivables and Allowance for Doubtful Accounts—The accounts receivable consist of amounts billed to customers for natural gas sales and related services. The Company provides an estimate for losses on these receivables by utilizing historical information, current account balances, account aging and current economic conditions. Customer accounts are charged off annually when deemed uncollectible or when turned over to a collection agency for action.
A reconciliation of changes in the allowance for doubtful accounts is as follows:
| Years Ended September 30 | ||||||||
| 2009 | 2008 | |||||||
| Balance, beginning of year |
$ | 63,791 | $ | 46,710 | ||||
| Additions charged to bad debt expense |
202,892 | 197,272 | ||||||
| Recoveries of accounts written off |
196,982 | 199,210 | ||||||
| Accounts written off |
(412,978 | ) | (379,401 | ) | ||||
| Balance, end of year |
$ | 50,687 | $ | 63,791 | ||||
Inventories—Inventories, consisting of natural gas in storage and materials and supplies, are recorded at average cost. Injections into storage are priced at the purchase cost at the time of injection and withdrawals from storage are priced at the weighted average price in storage. Materials and supplies are removed from inventory at average cost.
Unbilled Revenues—The Company bills its natural gas customers on a monthly cycle basis; however, the billing cycle period for most customers does not coincide with the accounting periods used for financial reporting. Therefore, an accrual is made to estimate revenues for natural gas delivered to customers but not billed during the accounting period. The Company recognizes revenue when gas is delivered. The amounts of unbilled revenue receivable included in accounts receivable on the consolidated balance sheets at September 30, 2009 and 2008 were $1,173,561 and $1,475,406, respectively.
- 12 -
Income Taxes—Income taxes are accounted for using the asset and liability method. Under the asset and liability method, deferred tax assets and liabilities are recognized for the estimated future tax consequences attributable to differences between the financial statement carrying amounts of existing assets and liabilities and their respective tax bases. Deferred tax assets and liabilities are measured using enacted tax rates in effect for the years in which those temporary differences are expected to be recovered or settled. A valuation allowance against deferred tax assets is provided if it is more likely than not the deferred tax asset will not be realized. The Company and its subsidiaries file a consolidated income tax return.
Debt Expenses—Debt issuance expenses are amortized over the lives of the debt instruments.
Over/Under-Recovery of Natural Gas Costs—Pursuant to the provisions of the Company’s Purchased Gas Adjustment (“PGA”) clause, increases or decreases in natural gas costs incurred by regulated operations, including gains and losses on natural gas derivative hedging instruments, are passed through to customers. Accordingly, the difference between actual costs incurred and costs recovered through the application of the PGA is reflected as a regulatory asset or liability. At the end of the deferral period, the balance of the net deferred charge or credit is amortized over an ensuing 12-month period as amounts are reflected in customer billings.
Use of Estimates—The preparation of financial statements in conformity with Generally Accepted Accounting Principles in the United States of America requires management to make estimates and assumptions that affect the reported amounts of assets and liabilities, disclosure of contingent liabilities at the date of the financial statements and the reported amounts of revenues and expenses during the reporting period. Actual results could differ from those estimates.
Excise and Sales Taxes—Certain excise and sales taxes imposed by the state and local governments in the Company’s service territory are collected by the Company from its customers. These taxes are accounted for on a net basis and therefore are not included as revenues in the Company’s Consolidated Statements of Income and Comprehensive Income.
Earnings Per Share—Basic earnings per share and diluted earnings per share are calculated by dividing net income by the weighted average common shares outstanding during the period and the weighted average common shares outstanding during the period plus dilutive potential common shares, respectively. Dilutive potential common shares are calculated in accordance with the treasury stock method, which assumes that proceeds from the exercise of all options are used to repurchase common stock at market value. The amount of shares remaining after the proceeds are exhausted represents the potentially dilutive effect of the securities. A reconciliation of the weighted average common shares to diluted average common shares is provided below:
| Years Ended September 30 | ||||
| 2009 | 2008 | |||
| Weighted average common shares |
2,223,727 | 2,201,263 | ||
| Effect of dilutive securities: |
||||
| Options to purchase common stock |
7,313 | 9,963 | ||
| Diluted average common shares |
2,231,040 | 2,211,226 | ||
- 13 -
Business and Credit Concentrations—The primary business of the Company is the distribution of natural gas to residential, commercial and industrial customers in its service territories.
No regulated sales to individual customers accounted for more than 5% of total revenue in any period or amounted to more than 5% of total accounts receivable.
Roanoke Gas currently holds the only franchises and/or certificates of public convenience and necessity to distribute natural gas in its Virginia service area. These franchises are effective through January 1, 2016. Certificates of public convenience and necessity in Virginia are exclusive and are intended for perpetual duration.
Roanoke Gas is served directly by two primary pipelines. These two pipelines provide 100% of the natural gas supplied to the Company’s customers. Depending upon weather conditions and the level of customer demand, failure of one or both of these transmission pipelines could have a major adverse impact on the Company.
Derivative and Hedging Activities—FASB ASC No. 815, Derivatives and Hedging, requires the recognition of all derivative instruments as assets or liabilities in the Company’s balance sheet and measurement of those instruments at fair value.
The Company’s hedging and derivatives policy allows management to enter into derivatives for the purpose of managing commodity and financial market risks of its business operations. The Company’s hedging and derivatives policy specifically prohibits the use of derivatives for speculative purposes. The key market risks that RGC Resources, Inc. hedges against include the price of natural gas and the cost of borrowed funds.
The Company enters into collars, swaps and caps for the purpose of hedging the price of natural gas in order to provide price stability during the winter months. The fair value of these instruments is recorded in the balance sheet with the offsetting entry to either under-recovery of gas costs or over-recovery of gas costs. Net income and other comprehensive income are not affected by the change in market value as any cost incurred or benefit received from these instruments is recoverable or refunded through the PGA as the SCC allows for full recovery of prudent costs associated with natural gas purchases. At September 30, 2009, the Company has collar agreements outstanding for the winter period to hedge 800,000 decatherms of natural gas. As the current market value of natural gas falls between the floor and ceiling prices of the collar agreements, there is no fair value reflected in the financial statements at September 30, 2009. If the fair value of these instruments had fallen below the floor or risen above the ceiling price of the collar, the fair value would have been recorded in the balance sheet under the caption “Fair value of marked-to-market transactions” with the offsetting entry to either under-recovery of gas costs or over-recovery of gas costs. At September 30, 2008, the Company had collar agreements outstanding to hedge 370,000 decatherms of natural gas with a fair value liability of $37,850.
The Company also has two interest rate swaps associated with its variable rate notes. The first swap relates to the $15,000,000 note issued in November 2005. This swap essentially converts the floating rate note based upon LIBOR into fixed rate debt with a 5.74% effective interest rate. The second swap relates to the $5,000,000 variable rate note issued in October 2008. This swap converts the variable rate note based on LIBOR into a fixed rate debt with a 5.79% effective interest rate. Both swaps qualify as cash flow hedges with changes in fair value reported in other comprehensive income.
No derivative instruments were deemed to be ineffective for any period presented.
- 14 -
The table below reflects the fair values of the derivative instruments and their corresponding classification in the consolidated balance sheets under the current liabilities caption of “Fair value of marked-to-market transactions” as of September 30, 2009 and 2008, respectively:
Fair Value of Derivative Instruments
| September 30 | ||||||
| 2009 | 2008 | |||||
| Derivatives designated as hedging instruments: |
||||||
| Interest rate swaps |
$ | 2,451,055 | $ | 837,637 | ||
| Natural gas collar arrangement |
— | 37,850 | ||||
| Total derivatives designated as hedging instruments |
$ | 2,451,055 | $ | 875,487 | ||
Based on the interest rate environment as of September 30, 2009, approximately $900,000 of the fair value on the interest rate hedges will be reclassified from other comprehensive loss into interest expense on the income statement over the next 12 months. Changes in LIBOR rates during that period could significantly change the estimated amount to be reclassified to income as well as the fair value of the interest rate hedges.
- 15 -
Other Comprehensive Income (Loss)—A summary of other comprehensive income (loss) and financial instrument activity, including the effect of adopting the change in measurement date provisions of FASB ASC No. 715, Compensation – Retirement Benefits, is provided below:
| Year Ended September 30 | ||||||||
| 2009 | 2008 | |||||||
| Interest Rate SWAPs |
||||||||
| Unrealized losses |
$ | (2,369,923 | ) | $ | (994,914 | ) | ||
| Income tax |
899,623 | 377,669 | ||||||
| Net unrealized losses |
(1,470,300 | ) | (617,245 | ) | ||||
| Transfer of realized losses to interest expense |
756,505 | 243,302 | ||||||
| Income tax |
(287,170 | ) | (92,357 | ) | ||||
| Net transfer of realized losses to interest expense |
469,335 | 150,945 | ||||||
| Defined Benefit Plans |
||||||||
| Unrecognized net loss arising during the period |
(1,153,897 | ) | (503,411 | ) | ||||
| Income tax |
438,481 | 191,296 | ||||||
| Net unrecognized loss arising during the period |
(715,416 | ) | (312,115 | ) | ||||
| Transfer of realized losses to income |
25,252 | — | ||||||
| Income tax |
(9,599 | ) | — | |||||
| Net transfer of realized losses to income |
15,653 | — | ||||||
| Amortization of transition obligation |
47,093 | 47,223 | ||||||
| Income tax |
(17,900 | ) | (17,945 | ) | ||||
| Net amortization of transition obligation |
29,193 | 29,278 | ||||||
| Net other comprehensive loss |
$ | (1,671,535 | ) | $ | (749,137 | ) | ||
| Change in measurement date |
11,221 | — | ||||||
| Accumulated comprehensive loss - beginning of period |
(1,224,392 | ) | (475,255 | ) | ||||
| Accumulated comprehensive loss - end of period |
$ | (2,884,706 | ) | $ | (1,224,392 | ) | ||
- 16 -
The components of accumulated comprehensive loss as of September 30, 2009 and 2008 include:
| September 30 | ||||||||
| 2009 | 2008 | |||||||
| Interest rate swaps |
$ | (1,520,635 | ) | $ | (519,670 | ) | ||
| Pension plan |
(954,797 | ) | (372,501 | ) | ||||
| Postretirement benefit plan |
(409,274 | ) | (332,221 | ) | ||||
| Total accumulated comprehensive loss |
$ | (2,884,706 | ) | $ | (1,224,392 | ) | ||
Newly Adopted Accounting Standards—On October 1, 2008, the Company adopted the change in measurement date provision of SFAS No. 158, Employers’ Accounting for Defined Benefit Pension and other Postretirement Plans, an amendment of FASB Statements No. 87, 88, 106, and 132R (FASB ASC No. 715). FASB ASC No. 715 requires an employer to measure the funded status of each plan as of the Company’s fiscal year end. The Company previously used a June 30 measurement date for its benefit plans. The change in measurement date eliminated the three month lag in recognizing expense between the measurement date and the end of the Company’s fiscal year. The Company recorded a reduction to retained earnings, net of tax, of $44,931 for the effect of the change in measurement date on unregulated operations and a regulatory asset in the amount of $177,284 for the portion attributable to the regulated operations of Roanoke Gas Company. The Company has begun a three year amortization of the regulatory asset, consistent with the Company’s latest rate filing and order.
In September 2006, the FASB issued SFAS No. 157, Fair Value Measurements (FASB ASC No. 820). FASB ASC No. 820 defines fair value, establishes a framework for measuring fair value, and expands disclosures about fair value methods. No new fair value measurements are required. Instead, it provides for increased consistency and comparability in fair value measurements and for expanded disclosure surrounding the fair value measurements. Disclosures regarding nonfinancial assets and liabilities, except for items that are recognized or disclosed at fair value in the financial statements on a recurring basis, were delayed for one year. The Company adopted the fair value provisions of FASB ASC No. 820 effective October 1, 2008. The adoption had no material impact on the Company’s financial position, results of operations or cash flows. The disclosures required by FASB ASC No. 820 are included in Note 12.
In March 2008, the FASB issued SFAS No. 161, Disclosures about Derivative Instruments and Hedging Activities – an amendment of FASB Statement No. 133 (FASB ASC No. 815). FASB ASC No. 815 enhanced the current disclosure framework by requiring entities to disclose (a) how and why an entity uses derivative instruments, (b) how derivative instruments and related hedged items are accounted for, and (c) how derivative instruments and related hedged items affect an entity’s financial position, financial performance and cash flow. The adoption of the additional disclosure provisions of FASB ASC No. 815 had no material impact on the Company’s financial position, results of operations or cash flows. The additional disclosures required by FASB No. 815 are included in Notes 1 and 12.
- 17 -
In May 2009, the FASB issued SFAS No. 165, Subsequent Events (FASB ASC No. 855). FASB ASC No. 855 establishes general standards of accounting for and disclosure of events that occur subsequent to the balance sheet date but before financial statements are issued. The statement defines two types of subsequent events (1) recognized subsequent events, which provide additional evidence about conditions that existed at the balance sheet date, and (2) non-recognized subsequent events, which provide evidence about conditions that did not exist at the balance sheet date, but arose before the financial statements were issued. Recognized subsequent events are required to be recognized in the financial statements, and non-recognized subsequent events are required to be disclosed. FASB ASC No. 855 requires entities to disclose the date through which subsequent events have been evaluated and the basis for the date. The adoption of FASB ASC No. 855 had no material impact on the Company’s financial position, results of operations or cash flows. The disclosures required for subsequent events are included in Note 13.
Recently Issued Accounting Standards Pending Adoption—In December 2008, the FASB issued FASB Staff Position No 132(R)-1, (FSP 132(R)-1), Employers’ Disclosures about Postretirement Benefit Plan Assets (FASB ASC No. 715). FASB’s objective of these changes is to improve disclosures about plan assets in employers’ defined benefit pension or other post-retirement plans by providing users of financial statements with an understanding of: (a) How investment allocation decisions are made, including the factors that are pertinent to an understanding of investment policies and strategies; (b) The major categories of plan assets; (c) The inputs and valuation techniques used to measure the fair value of plan assets; (d) The effect of fair value measurements using significant unobservable inputs on changes in plan assets for the period; and (e) Significant concentrations of risk within plan assets. The new disclosure requirements under FASB ASC No. 715 are effective for fiscal years ending after December 15, 2009. Although the Company has not completed its evaluation, management does not anticipate these changes to have a material impact on its financial position, results of operations or cash flows.
Other accounting standards that have been issued or proposed by the FASB or other standard-setting bodies are not expected to have a material impact on the Company’s financial position, results of operations and cash flows.
| 2. | DISCONTINUED OPERATIONS |
Effective October 31, 2007, Resources closed on the sale of the stock of Bluefield Gas Company to ANGD, LLC, and Roanoke Gas completed the sale of its natural gas distribution assets located in the Town of Bluefield and the County of Tazewell, Virginia to Appalachian Natural Gas Company, a subsidiary of ANGD, LLC. The sale of both the stock and the assets was essentially at book value and included the receipt of a $1,300,000 note from ANGD to partially finance the transaction. The note has a 5-year term with a 15-year amortization schedule with annual principal payments and quarterly interest payments at a rate of 10%.
-18 -
The components of the discontinued operations are summarized below:
| Year Ended September 30 2008 |
||||
| Total Revenues |
$ | 457,777 | ||
| Pretax Operating Loss |
(105,216 | ) | ||
| Continuing Costs |
53,898 | |||
| Income Tax Benefit |
14,628 | |||
| Discontinued Operations |
$ | (36,690 | ) | |
| 3. | REGULATORY MATTERS |
The SCC exercises regulatory authority over the natural gas operations of Roanoke Gas. Such regulation encompasses terms, conditions and rates to be charged to customers for natural gas service, safety standards, extensions of service, accounting and depreciation.
On November 1, 2008, Roanoke Gas placed into effect new base rates that were designed to produce $1,198,000 in additional annual revenues. The Company received a final order from the SCC on June 10, 2009 approving the additional annual revenue effective November 1, 2008.
Also included as part of the final order was an agreement to modify the Weather Normalization Adjustment (“WNA”) mechanism, which mitigates the impact of temperature volatility on the Company’s margin due to weather. The order approved a request to reduce the current weather band from approximately 6% to 3% of the most recent 30-year average with the WNA period that began in April 2009. The implementation of this new weather band will further reduce the downside exposure that the Company has to warmer than normal weather. In addition, the new weather band will also limit the upside benefit from colder than normal weather to a 3% level.
The Company also filed with the SCC on July 1, 2009 the results of an updated depreciation study, which is required every 5 years. The depreciation study, which is based on average remaining service life, extended the expected life of the Company’s LNG plant, natural gas service lines and computer equipment resulting in a reduction in the overall composite weighted average depreciation rate from 4.12% to 3.31%, based on September 30, 2008 utility plant balances. The SCC approved the depreciation study filing and instructed the Company to implement the new rates effective as of October 1, 2008. As a result, the Company recorded the full effect of the change in depreciation rates for the fiscal year ended September 30, 2009 in the Company’s fourth quarter results of operations. The effect of the change in depreciation rates on the Company’s Consolidated Statement of Income and Comprehensive Income is included in Note 1.
- 19 -
| 4. | BORROWINGS UNDER LINE-OF-CREDIT |
The Company has available an unsecured line-of-credit with a bank which will expire March 31, 2010. The Company anticipates being able to extend or replace this line-of-credit. The Company’s available unsecured line-of-credit varies during the year to accommodate its seasonal borrowing demands. Generally, the Company’s borrowing needs are at their lowest in spring, increase during the summer and fall due to gas storage purchases and construction expenditures and reach their maximum levels in winter. Available limits under this agreement for the remaining term are as follows:
| Effective |
Available Line-of-Credit | ||
| September 30, 2009 |
$ | 3,000,000 | |
| October 24, 2009 |
18,000,000 | ||
| November 25, 2009 |
15,000,000 | ||
| January 23, 2010 |
8,000,000 | ||
| February 25, 2010 |
5,000,000 | ||
Subsequent to year end, the Company requested a reduction in the available line-of-credit to $7,000,000 for the period October 24, 2009 through January 22, 2010. The Company requested the change due to its cash position and to minimize fees associated with the unused portion of the line-of-credit.
A summary of the line-of-credit follows:
| 2009 | 2008 | |||||||
| Line-of-credit at year-end |
$ | 3,000,000 | $ | 27,000,000 | ||||
| Outstanding balance at year-end |
— | 13,960,000 | ||||||
| Highest month-end balance outstanding |
16,145,000 | 13,960,000 | ||||||
| Average daily balance |
3,758,000 | 3,660,000 | ||||||
| Average rate of interest during year |
2.44 | % | 4.25 | % | ||||
| Average rate of interest at year-end |
1.25 | % | 4.43 | % | ||||
- 20 -
| 5. | LONG-TERM DEBT |
Long-term debt consists of the following:
| September 30 | ||||||
| 2009 | 2008 | |||||
| Unsecured note payable, with variable interest rate based on 30-day LIBOR (0.25% at September 30, 2009) plus 69 basis point spread, with provision for retirement on December 1, 2010 |
$ | 15,000,000 | $ | 15,000,000 | ||
| Unsecured note payable, with variable interest rate based on three month LIBOR (0.29% at September 30, 2009) plus 125 basis point spread, with provision for retirement on December 1, 2015 |
5,000,000 | — | ||||
| Unsecured senior note payable, at 7.66%, with provision for retirement of $1,600,000 each year beginning December 1, 2014 through December 1, 2018 |
8,000,000 | 8,000,000 | ||||
| Total long-term debt |
28,000,000 | 23,000,000 | ||||
| Less current maturities |
— | — | ||||
| Total long-term debt |
$ | 28,000,000 | $ | 23,000,000 | ||
The above debt obligations contain various provisions, including a minimum interest charge coverage ratio, limitations on debt as a percentage of total capitalization and a provision restricting the payment of dividends, primarily based on the earnings of the Company and dividends previously paid. The Company was in compliance with these provisions at September 30, 2009 and 2008. At September 30, 2009, approximately $10,882,000 of retained earnings was available for dividends.
The Company may request an extension of the maturity date of the $15,000,000 unsecured variable rate note anytime subsequent to the first anniversary subject to approval by the Bank. The Company also has an interest rate swap related to the $15,000,000 note. The swap essentially converted the variable rate note into fixed rate debt with a 5.74% effective interest rate. The swap has a maturity date of December 1, 2015. The Company has had preliminary negotiations with the Bank regarding the Company’s desire to annually extend the $15,000,000 note at terms comparable to the note currently in place until such time as both the note and the corresponding swap matures.
On October 31, 2008, the Company issued a $5,000,000 variable rate note at three-month LIBOR plus 125 basis points. This note refinanced a first mortgage note that matured in July 2008 and had since been funded through the Company’s line-of-credit. Simultaneous with the execution of the variable rate note, the Company entered into an interest rate swap to convert the variable rate note into a fixed rate debt with a 5.79% effective interest rate. Both the variable rate note and the interest rate swap mature on December 1, 2015.
- 21 -
The aggregate annual maturities of long-term debt for the next five years ending after September 30, 2009 and thereafter are as follows:
| Years Ended September 30 |
Maturities | ||
| 2010 |
$ | — | |
| 2011 |
15,000,000 | ||
| 2012 |
— | ||
| 2013 |
— | ||
| 2014 |
— | ||
| Thereafter |
13,000,000 | ||
| Total |
$ | 28,000,000 | |
| 6. | INCOME TAXES |
The details of income tax expense (benefit) from continuing operations are as follows:
| Years Ended September 30 | ||||||||
| 2009 | 2008 | |||||||
| Current income taxes: |
||||||||
| Federal |
$ | 1,700,418 | $ | 2,385,856 | ||||
| State |
430,460 | 508,082 | ||||||
| Total current income taxes |
2,130,878 | 2,893,938 | ||||||
| Deferred income taxes: |
||||||||
| Federal |
842,379 | (192,741 | ) | |||||
| State |
44,210 | (89,288 | ) | |||||
| Total deferred income taxes |
886,589 | (282,029 | ) | |||||
| Amortization of investment tax credits |
(30,158 | ) | (30,167 | ) | ||||
| Total income tax expense |
$ | 2,987,309 | $ | 2,581,742 | ||||
- 22 -
Income tax expense for the years ended September 30, 2009 and 2008 differed from amounts computed by applying the U.S. Federal income tax rate of 34% to earnings before income taxes due to the following:
| Years Ended September 30 | ||||||||
| 2009 | 2008 | |||||||
| Income before income taxes |
$ | 7,856,319 | $ | 6,839,566 | ||||
| Income tax expense computed at the federal statutory rate |
$ | 2,671,148 | $ | 2,325,452 | ||||
| State income taxes, net of federal income tax benefit |
313,282 | 276,404 | ||||||
| Amortization of investment tax credits |
(30,158 | ) | (30,167 | ) | ||||
| Other, net |
33,037 | 10,053 | ||||||
| Total income tax expense |
$ | 2,987,309 | $ | 2,581,742 | ||||
The tax effects of temporary differences that give rise to the deferred tax assets and deferred tax liabilities are as follows:
| September 30 | ||||||
| 2009 | 2008 | |||||
| Deferred tax assets: |
||||||
| Allowance for uncollectibles |
$ | 19,241 | $ | 24,215 | ||
| Accrued pension and postretirement medical benefits |
2,148,874 | 1,888,963 | ||||
| Accrued vacation |
204,615 | 195,733 | ||||
| Over-recovery of gas costs |
2,145,442 | — | ||||
| Costs of gas held in storage |
907,937 | 933,035 | ||||
| Accrued gas costs |
— | 676,389 | ||||
| Deferred compensation |
491,107 | 417,224 | ||||
| Interest rate swap |
930,420 | 317,967 | ||||
| Other |
227,831 | 184,318 | ||||
| Total deferred tax assets |
7,075,467 | 4,637,844 | ||||
| Deferred tax liabilities: |
||||||
| Utility plant |
8,907,926 | 7,551,517 | ||||
| Accrued gas costs |
1,277,534 | — | ||||
| Under-recovery of gas costs |
— | 370,199 | ||||
| Total deferred tax liabilities |
10,185,460 | 7,921,716 | ||||
| Net deferred tax liability |
$ | 3,109,993 | $ | 3,283,872 | ||
FASB ASC No. 740, Income Taxes, provides for the determination of whether tax benefits claimed or expected to be claimed on a tax return should be recognized in the financial statements. During the prior year, the Company had an unrecognized tax benefit of $23,276 associated with line pack gas. The Company filed for a change in method of accounting in its fiscal 2008 tax return and the tax is being paid over a four year period. The Company has evaluated its tax positions and has not identified any additional uncertain tax positions. The Company’s policy is to classify interest associated with uncertain tax positions as interest expense in the financial statements. Penalties are classified under other income (expense).
- 23 -
The Company files a consolidated federal income tax return and state income tax returns in Virginia and West Virginia. An audit of the Company’s federal income tax return was completed for the year ended September 30, 2006. The federal returns and the state returns for both Virginia and West Virginia for the tax years ended prior to September 30, 2006 are no longer subject to examination.
| 7. | EMPLOYEE BENEFIT PLANS |
The Company sponsors both a noncontributory defined benefit pension plan and a postretirement benefit plan (“Plans”). The defined benefit pension plan covers substantially all employees and benefits fully vest after five years of credited service. Benefits paid to retirees are based on age at retirement, years of service and average compensation. The postretirement benefit plan provides certain healthcare, supplemental retirement and life insurance benefits to retired employees who meet specific age and service requirements. Employees hired prior to January 1, 2000 are eligible to participate in the plan. Employees must have a minimum of ten years of service and retire after attaining the age of 55 in order to vest in the postretirement plan. Retiree contributions to the plan are based on the number of years of service to the Company as determined under the defined benefit plan.
FASB ASC No. 715, Compensation – Retirement Benefits requires employers who sponsor defined benefit plans to recognize the funded status of defined benefit pension and other postretirement plans as an asset or liability in its statement of financial position and to recognize changes in that funded status in the year in which the changes occur through comprehensive income. For pension plans, the benefit obligation is the projected benefit obligation, and for other postretirement plans, the benefit obligation is the accumulated benefit obligation. The Company applied the provisions of FASB ASC No. 980, Regulated Operations and established a regulatory asset for the portion of the obligation expected to be recovered in rates in future periods. The regulatory asset is adjusted for the amortization of the transition obligation and recognition of actuarial gains and losses. The portion of the obligation attributable to the unregulated operations of the holding company is recognized in comprehensive income.
On October 1, 2008, the Company adopted the change in measurement date provision of the FASB ASC No. 715. FASB ASC No. 715 requires an employer to measure the funded status of each plan as of the Company’s fiscal year end. The Company previously used a June 30 measurement date for its benefit plans. The change in measurement date eliminated the three month lag in recognizing expense between the measurement date and the end of the Company’s fiscal year. The Company recorded a reduction to retained earnings, net of tax, of $44,931 and a reduction in accumulated comprehensive loss of $11,221 for the effect of the change in measurement date on unregulated operations and a regulatory asset in the amount of $177,284 for the portion attributable to the regulated operations of Roanoke Gas.
- 24 -
The following tables set forth the benefit obligation, fair value of plan assets, the funded status of the benefit plans, amounts recognized in the Company’s financial statements and the assumptions used. The information presented for 2009 includes the 15 month period from July 1, 2008 through September 30, 2009 as a result of adopting the change in measurement date provisions.
| Pension Plan | Postretirement Plan | |||||||||||||||
| 2009 | 2008 | 2009 | 2008 | |||||||||||||
| Accumulated benefit obligation |
$ | 12,431,936 | $ | 10,437,064 | $ | 9,569,792 | $ | 8,304,632 | ||||||||
| Change in benefit obligation: |
||||||||||||||||
| Benefit obligation at beginning of year |
$ | 13,755,421 | $ | 12,538,300 | $ | 8,304,632 | $ | 8,427,326 | ||||||||
| Service cost |
504,533 | 429,461 | 154,570 | 140,327 | ||||||||||||
| Interest cost |
1,058,627 | 769,517 | 630,026 | 511,387 | ||||||||||||
| Actuarial (gain) loss |
980,245 | 429,383 | 951,608 | (339,674 | ) | |||||||||||
| Benefit payments, net of retiree contributions |
(556,407 | ) | (411,240 | ) | (471,044 | ) | (434,734 | ) | ||||||||
| Benefit obligation at end of year |
$ | 15,742,419 | $ | 13,755,421 | $ | 9,569,792 | $ | 8,304,632 | ||||||||
| Change in plan assets: |
||||||||||||||||
| Fair value of plan assets at beginning of year |
$ | 11,400,327 | $ | 10,984,155 | $ | 5,190,941 | $ | 5,202,179 | ||||||||
| Actual return on plan assets, net of taxes |
(565,364 | ) | 27,412 | 143,684 | (300,504 | ) | ||||||||||
| Employer contributions |
900,000 | 800,000 | 1,300,000 | 724,000 | ||||||||||||
| Benefit payments, net of retiree contributions |
(556,407 | ) | (411,240 | ) | (471,044 | ) | (434,734 | ) | ||||||||
| Fair value of plan assets at end of year |
$ | 11,178,556 | $ | 11,400,327 | $ | 6,163,581 | $ | 5,190,941 | ||||||||
| Reconciliation of funded status: |
||||||||||||||||
| Funded status |
$ | (4,563,863 | ) | $ | (2,355,094 | ) | $ | (3,406,211 | ) | $ | (3,113,691 | ) | ||||
| Contributions made between the measurement date and fiscal year-end |
— | — | — | 700,000 | ||||||||||||
| Net amount recognized in the balance sheet |
$ | (4,563,863 | ) | $ | (2,355,094 | ) | $ | (3,406,211 | ) | $ | (2,413,691 | ) | ||||
| Amounts recognized in the balance sheets consist of: |
||||||||||||||||
| Noncurrent liabilities |
$ | (4,563,863 | ) | $ | (2,355,094 | ) | $ | (3,406,211 | ) | $ | (2,413,691 | ) | ||||
| Amounts recognized in accumulated other comprehensive loss: |
||||||||||||||||
| Transition obligation, net of tax |
$ | — | $ | — | $ | 109,896 | $ | 146,393 | ||||||||
| Net actuarial loss, net of tax |
954,797 | 372,501 | 299,378 | 185,828 | ||||||||||||
| Total amounts included in other comprehensive loss, net of tax |
$ | 954,797 | $ | 372,501 | $ | 409,274 | $ | 332,221 | ||||||||
| Amounts deferred to a regulatory asset: |
||||||||||||||||
| Transition obligation |
$ | — | $ | — | $ | 531,096 | $ | 708,345 | ||||||||
| Net actuarial loss |
3,203,563 | 1,607,687 | 1,386,314 | 415,642 | ||||||||||||
| Amounts recognized as regulatory assets |
$ | 3,203,563 | $ | 1,607,687 | $ | 1,917,410 | $ | 1,123,987 | ||||||||
- 25 -
The Company expects that approximately $150,000, before tax, of accumulated other comprehensive loss will be recognized as a portion of net periodic benefit costs in fiscal 2010 and approximately $442,000 of amounts deferred as regulatory assets will be amortized and recognized in net periodic benefit costs in fiscal 2010.
The Company amortizes the unrecognized transition obligation over 20 years.
The following table details the actuarial assumptions used in determining the projected benefit obligations and net benefit cost of the pension and the accumulated benefit obligations and net benefit cost of the postretirement plan for 2009 and 2008.
| Pension Plan | Postretirement Plan | |||||||||||
| 2009 | 2008 | 2009 | 2008 | |||||||||
| Assumptions related to benefit obligations: |
||||||||||||
| Discount rate |
5.50 | % | 6.25 | % | 5.50 | % | 6.25 | % | ||||
| Expected rate of compensation increase |
4.00 | % | 5.00 | % | N/A | N/A | ||||||
| Assumptions related to benefit costs: |
||||||||||||
| Discount rate |
6.25 | % | 6.25 | % | 6.25 | % | 6.25 | % | ||||
| Expected long-term rate of return on plan assets |
7.50 | % | 7.50 | % | 5.18 | % | 5.22 | % | ||||
| Expected rate of compensation increase |
5.00 | % | 5.00 | % | N/A | N/A | ||||||
To develop the expected long-term rate of return on assets assumption, the Company considered the historical returns and the future expectations for returns for each asset class, as well as the target asset allocation of each plan’s portfolio. This resulted in the selection of the corresponding long-term rate of return assumptions used for each plan’s assets.
Components of net periodic benefit cost are as follows:
| Pension Plan | Postretirement Plan | |||||||||||||||
| 2009 | 2008 | 2009 | 2008 | |||||||||||||
| Service cost |
$ | 504,533 | $ | 429,461 | $ | 154,570 | $ | 140,327 | ||||||||
| Interest cost |
1,058,627 | 769,517 | 630,026 | 511,387 | ||||||||||||
| Expected return on plan assets |
(1,077,687 | ) | (821,381 | ) | (345,893 | ) | (286,504 | ) | ||||||||
| Amortization of unrecognized transition obligation |
— | — | 236,115 | 188,892 | ||||||||||||
| Recognized loss |
88,233 | — | — | — | ||||||||||||
| Net periodic benefit cost |
$ | 573,706 | $ | 377,597 | $ | 674,818 | $ | 554,102 | ||||||||
- 26 -
The components of net periodic benefit costs shown above for 2009 reflect the 15 month expense from July 1, 2008 through September 30, 2009. The tables below segregate the 15 month expense into the three-month period associated with the change in measurement date that was recorded in retained earnings and regulatory asset and the 12 month expense for the year ended September 30, 2009 reflected in benefit expense.
| Pension | ||||||||||||
| Change in Measurement Date |
12 Months 9/30/2009 |
2009 | ||||||||||
| Service cost |
$ | 100,908 | $ | 403,625 | $ | 504,533 | ||||||
| Interest cost |
211,726 | 846,901 | 1,058,627 | |||||||||
| Expected return on plan assets |
(215,538 | ) | (862,149 | ) | (1,077,687 | ) | ||||||
| Amortization of unrecognized transition obligation |
— | — | — | |||||||||
| Recognized loss |
17,646 | 70,587 | 88,233 | |||||||||
| Net periodic benefit cost |
$ | 114,742 | $ | 458,964 | $ | 573,706 | ||||||
| Postretirement | ||||||||||||
| Change in Measurement Date |
12 Months 9/30/2009 |
2009 | ||||||||||
| Service cost |
$ | 30,914 | $ | 123,656 | $ | 154,570 | ||||||
| Interest cost |
126,005 | 504,021 | 630,026 | |||||||||
| Expected return on plan assets |
(69,178 | ) | (276,715 | ) | (345,893 | ) | ||||||
| Amortization of unrecognized transition obligation |
47,223 | 188,892 | 236,115 | |||||||||
| Recognized loss |
— | — | — | |||||||||
| Net periodic benefit cost |
$ | 134,964 | $ | 539,854 | $ | 674,818 | ||||||
The adjustment for the change in measurement date is classified in the balance sheet as follows:
| Pension | Postretirement | Total | |||||||
| Regulatory asset |
$ | 75,690 | $ | 101,594 | $ | 177,284 | |||
| Unregulated operations |
39,052 | 33,370 | 72,422 | ||||||
| Total |
$ | 114,742 | $ | 134,964 | $ | 249,706 | |||
| Retained earnings |
$ | 24,228 | $ | 20,703 | $ | 44,931 | |||
- 27 -
The assumed health care cost trend rates used in measuring the accumulated benefit obligation for the postretirement medical plan as of September 30, 2009 and 2008 are presented below:
| 2009 | 2008 | |||||
| Health care cost trend rate assumed for next year |
10.00 | % | 8.00 | % | ||
| Rate to which the cost trend is assumed to decline (the ultimate trend rate) |
4.75 | % | 5.00 | % | ||
| Year that the rate reaches the ultimate trend rate |
2016 | 2011 |
The health care cost trend rate assumptions could have a significant effect on the amounts reported. A change of 1% would have the following effects:
| 1% Increase | 1% Decrease | ||||||
| Effect on total service and interest cost components |
$ | 101,609 | $ | (82,420 | ) | ||
| Effect on accumulated postretirement benefit obligation |
1,290,478 | (1,063,561 | ) | ||||
The Company’s target and actual asset allocation in the pension and postretirement benefit plans as of September 30, 2009 and June 30, 2008 were:
| Pension Plan |
Postretirement Plan |
|||||||||||||||
| Target | 2009 | 2008 | Target | 2009 | 2008 | |||||||||||
| Asset category: |
||||||||||||||||
| Equity securities |
50%-70% | 58 | % | 56 | % | 40%-60% | 33 | % | 49 | % | ||||||
| Debt securities |
30%-50% | 33 | % | 30 | % | 40%-60% | 14 | % | 45 | % | ||||||
| Cash |
0% | 9 | % | 14 | % | 0% | 53 | % | 6 | % | ||||||
The primary objectives of the Company’s investment policy are to maintain investment portfolios that diversify risk through prudent asset allocation parameters, achieve asset returns that meet or exceed the plans’ actuarial assumptions, achieve asset returns that are competitive with like institutions employing similar investment strategies and meet expected future benefits. The investment policy is periodically reviewed by the Company and a third-party fiduciary for investment matters. The investment manager has taken a temporary defensive position in the postretirement plan with a more conservative investment allocation.
The Company expects to contribute $800,000 to its pension plan and $600,000 to its postretirement benefit plan in fiscal 2010.
- 28 -
The following table reflects expected future benefit payments:
| Fiscal year ending September 30 |
Pension Plan |
Postretirement Plan | ||||
| 2010 |
$ | 449,000 | $ | 476,000 | ||
| 2011 |
450,000 | 487,000 | ||||
| 2012 |
470,000 | 511,000 | ||||
| 2013 |
498,000 | 519,000 | ||||
| 2014 |
501,000 | 535,000 | ||||
| 2015-2019 |
3,309,000 | 2,937,000 | ||||
The Company also sponsors a defined contribution plan (“401k Plan”) covering all employees who elect to participate. Employees may contribute from 1% to 50% of their annual compensation to the 401k Plan, limited to a maximum annual amount as set periodically by the Internal Revenue Service. The Company makes matching contributions to the 401k plan with a 100% match on the participants’ first 3% of contributions and 50% on the next 3% of contributions. Company matching contributions were $246,186 and $246,338 for 2009 and 2008, respectively.
| 8. | COMMON STOCK OPTIONS |
The Company’s stockholders approved the RGC Resources, Inc. Key Employee Stock Option Plan (“KESOP”). The KESOP provides for the issuance of common stock options to officers and certain other full-time salaried employees to acquire a maximum of 100,000 shares of the Company’s common stock. The KESOP requires each option’s exercise price per share to equal the fair value of the Company’s common stock as of the date of the grant. As of September 30, 2009, the number of shares available for future grants under the KESOP was 2,000 shares.
FASB ASC No. 718, Compensation-Stock Compensation, requires that compensation expenses be recognized for the issuance of equity instruments to employees. However, all options granted under the KESOP were issued prior to this requirement and fell under the provisions prescribed under Accounting Principles Board (“APB”) Opinion No. 25., Accounting for Stock Issued to Employees. Under APB Opinion No. 25, the Company did not recognize stock-based employee compensation expense related to its KESOP in net income as all options granted under the KESOP had an exercise price equal to the market value of the underlying common stock on the date of the grant. The Company adopted the provisions of FASB ASC No. 718 using the modified prospective application. Under the modified prospective application, only new grants and grants that have been modified, cancelled or have not yet vested require recognition of compensation cost.
- 29 -
The aggregate number of shares under option pursuant to the KESOP are as follows:
| Number of Shares |
Weighted- Average Exercise Price |
Option Price Per Share | |||||||
| Options outstanding, September 30, 2007 |
31,500 | $ | 19.508 | $ | 18.100-$20.875 | ||||
| Options exercised |
(2,000 | ) | $ | 20.875 | |||||
| Options expired |
— | ||||||||
| Options outstanding, September 30, 2008 |
29,500 | $ | 19.416 | $ | 18.100-$20.875 | ||||
| Options exercised |
(7,500 | ) | $ | 20.767 | |||||
| Options expired |
— | ||||||||
| Options outstanding, September 30, 2009 |
22,000 | $ | 18.955 | $ | 18.100-$19.360 | ||||
The intrinsic value of the options exercised during fiscal 2009 and 2008 were $43,218 and $14,251, respectively.
Under the terms of the KESOP, the options become exercisable six months from the grant date and expire ten years subsequent to the grant date. All options outstanding were fully vested and exercisable at September 30, 2009 and 2008. No options were granted in 2009 and 2008. The Company received $155,750 and $41,750 from the exercise of options in 2009 and 2008, respectively.
| Options Outstanding and Exercisable | ||||||||||
| Shares | Remaining Life (Years) |
Exercise Price |
Intrinsic Value | |||||||
| 6,500 | 1.2 | $ | 19.250 | $ | 50,180 | |||||
| 9,000 | 2.2 | 19.360 | 68,490 | |||||||
| 6,500 | 3.2 | 18.100 | 57,655 | |||||||
| Weighted average |
22,000 | 2.2 | $ | 18.955 | $ | 176,325 | ||||
| 9. | OTHER STOCK PLANS |
Dividend Reinvestment and Stock Purchase Plan
The Company offers a Dividend Reinvestment and Stock Purchase Plan (“DRIP”) to shareholders of record for the reinvestment of dividends and the purchase of additional investments of up to $40,000 per year in shares of common stock of the Company. Under the DRIP plan, the Company issued 16,696 and 16,715 shares in 2009 and 2008, respectively. As of September 30, 2009, the Company had 253,990 shares available for issuance.
- 30 -
Restricted Stock Plan
The Board of Directors of the Company implemented the Restricted Stock Plan for Outside Directors (“Plan”) effective January 27, 1997. The Plan is applicable to not more than 50,000 shares of Resources’ common stock. Under the Plan, a minimum of 40% of the monthly retainer fee paid to each non-employee director of Resources is paid in shares of common stock (“Restricted Stock”). The number of shares of Restricted Stock is calculated each month based on the closing sales price of Resources’ common stock on the NASDAQ National Market on the first day of the month, if the first day of the month is a trading day, or if not, the first trading day prior to the first day of the month. Beginning in fiscal 1998, a participant can, subject to approval of the Board, elect to receive up to 100% of his retainer fee for the fiscal year in Restricted Stock. Such election cannot be revoked or amended during the fiscal year.
The shares of Restricted Stock of Resources issued under the Plan will vest only in the case of a participant’s death, disability, retirement (including not standing for reelection to the Board), or in the event of a change in control of Resources. There is no option to take cash in lieu of stock upon vesting of shares under the Plan. The Restricted Stock may not be sold, transferred, assigned or pledged by the participant until the shares have vested under the terms of the Plan. At the time the Restricted Stock vests, a certificate for vested shares will be delivered to the participant or the participant’s beneficiary.
The shares of Restricted Stock will be forfeited to Resources by a participant’s voluntary resignation during his term on the Board or removal for cause as a director. Subject to the terms of the Plan, a participant, as owner of the Restricted Stock, has all rights of a shareholder, including but not limited to, voting rights and the right to participate in any capital adjustment of Resources. Resources requires that all dividends or other distributions paid on shares of Restricted Stock be automatically sequestered and reinvested on an immediate or deferred basis in additional Restricted Stock.
The directors received a total of 4,802 shares of Restricted Stock in fiscal 2009, representing $91,410 in compensation and $37,087 in dividends reinvested. The directors also received a total of 4,232 shares of Restricted Stock in fiscal 2008, representing $89,980 in compensation and $30,707 in dividends reinvested. As of September 30, 2009, the Company had 11,430 shares available for issuance.
Stock Bonus Plan
Under the Stock Bonus Plan, executive officers are encouraged to own a position in the Company’s common stock of at least 50% of the value of their annual salary. To promote this policy, the Plan provides that all officers with stock ownership positions below 50% of the value of their annual salaries must, unless approved by the Committee, receive no less than 50% of any performance bonus in the form of Company common stock. Shares from the Stock Bonus Plan may also be issued to certain employees and management personnel in recognition of their performance and service. Under the Stock Bonus Plan, the Company issued 848 and 781 shares valued at $21,880 and $22,163, respectively, in 2009 and 2008. As of September 30, 2009 the Company had 22,151 shares available for issuance.
- 31 -
| 10. | ENVIRONMENTAL MATTERS |
Both Roanoke Gas Company and Bluefield Gas Company operated manufactured gas plants (MGPs) as a source of fuel for lighting and heating until the late 1940s or early 1950s. A by-product of operating MGPs was coal tar, and the potential exists for on-site tar waste contaminants at the former plant sites. Should the Company be required to remediate either site, the Company will pursue all prudent and reasonable means to recover any related costs, including insurance claims and regulatory approval for rate case recognition of expenses associated with any work required. While the Company sold the stock of Bluefield Gas Company to ANGD, LLC in 2007, it retained ownership of the former MGP site and entered into an Indemnification and Cost Sharing Agreement with ANGD to seek rate recovery of any remediation costs through rate recovery and under any applicable insurance policies or from any third party for reimbursement to the Company for 25% of any such costs to the extent they are not otherwise recovered. If the Company incurs costs associated with a required clean-up of the Roanoke Gas Company MGP site, the Company anticipates recording a regulatory asset for such clean-up costs to be recovered in future rates.
| 11. | COMMITMENTS |
Due to the nature of the natural gas distribution business, the Company has entered into agreements with both suppliers and pipelines to contract for natural gas commodity purchases, storage capacity and pipeline delivery capacity.
The Company obtains most of its regulated natural gas supply from the asset management contract between Roanoke Gas Company and the asset manager. The Company uses an asset manager to assist in optimizing the use of its transportation, storage rights, and gas supply inventories to provide a secure and reliable source of natural gas supply.
Under the same asset management contract mentioned above, the Company designated the asset manager as agent for their storage capacity and all gas balances in storage. The asset manager provides agency service and manages the utilization of storage assets and the corresponding withdrawals from and injections into storage. The Company retains physical ownership of storage. Under the provision of the asset management contract, the Company has an obligation to purchase its winter storage requirements during the spring and summer injection periods at market price.
The Company also has contracts for pipeline and storage capacity extending for various periods. These capacity costs and related fees are valued at tariff rates in place as of September 30, 2009. These rates may increase or decrease in the future based upon rate filings and rate orders granting a rate change to the pipeline or storage operator.
- 32 -
The following table reflects the financial and volumetric obligations as of September 30, 2009 for each of the next five years and thereafter.
| Fixed Price Contracts | Market Price Contracts | |||||||
| Fiscal Year Ending September 30, |
Pipeline and Storage Capacity |
Natural Gas | Natural Gas Contracts (Decatherms) | |||||
| 2010 |
$ | 9,914,260 | $ | 6,722,520 | 2,225,059 | |||
| 2011 |
9,914,260 | — | 317,864 | |||||
| 2012 |
9,914,260 | — | — | |||||
| 2013 |
9,280,119 | — | — | |||||
| 2014 |
7,544,149 | — | — | |||||
| Thereafter |
9,878,812 | — | — | |||||
The Company purchased approximately $42,520,000 and $71,838,000 of gas under the asset management contracts in fiscal year 2009 and 2008 respectively.
The Company has historically entered into derivative financial contracts for the purpose of hedging the price on natural gas. As of September 30, 2009, the Company has contracted to hedge, through fixed price arrangements and derivative collar arrangements, a set amount of decatherms of natural gas for each month in the winter period. The fixed price arrangement reflects a total of 1,057,000 decatherms at a price of $6.36 per decatherm. The collar arrangement reflects a total of 800,000 decatherms. All decatherm amounts have a ceiling price of $8.00 per decatherm and a floor price of $4.40 per decatherm. See Derivative and Hedging Activities in Note 1 for more information.
| 12. | FAIR VALUE MEASUREMENTS |
Effective October 1, 2008, the Company adopted FASB ASC No. 820, Fair Value Measurements and Disclosures, for financial assets and liabilities that are measured and reported on a fair value basis. FASB ASC No. 820 defines fair value as the price that would be received to sell an asset or paid to transfer a liability in an orderly transaction between market participants at the measurement date. FASB ASC No. 820 also establishes a fair value hierarchy that prioritizes each input to the valuation method used to measure fair value into one of the following three broad levels:
Level 1 – Unadjusted quoted prices in active markets for identical assets or liabilities that the Company has the ability to access at the measurement date.
Level 2 – Inputs other than quoted prices in Level 1 that are either for similar assets or liabilities in active markets, quoted prices for identical or similar assets or liabilities in markets that are not active, inputs other than quoted prices that are observable for the asset or liability, or inputs that are derived principally from or corroborated by observable market data by correlation or other means.
Level 3 – Unobservable inputs for the asset or liability where there is little, if any, market activity for the asset or liability at the measurement date.
- 33 -
The fair value hierarchy gives the highest priority to unadjusted quoted prices in active markets (Level 1) and the lowest priority to unobservable inputs (Level 3).
The following table summarizes the Company’s financial assets and liabilities that are measured at fair value on a recurring basis and the fair value measurements by level within the fair value hierarchy as of September 30, 2009:
| Fair Value Measurements | ||||||||||||
| Fair Value | Quoted Prices in Active Markets (Level 1) |
Significant Other Observable Inputs (Level 2) |
Significant Unobservable Inputs (Level 3) | |||||||||
| Liabilities: |
||||||||||||
| Interest rate swaps |
$ | 2,451,055 | $ | — | $ | 2,451,055 | $ | — | ||||
| Total |
$ | 2,451,055 | $ | — | $ | 2,451,055 | $ | — | ||||
The following table summarizes the fair value of the Company’s financial assets and liabilities that are not adjusted to fair value in the financial statements. The carrying value of cash and cash equivalents, accounts receivable, accounts payable, customer credit balances and customer deposits are a reasonable estimate of fair value due to the short-term nature of these financial instruments.
| Fair Value Measurements | |||||||||||||||
| Carrying Amount |
Fair Value | Quoted Prices in Active Markets (Level 1) |
Significant Other Observable Inputs (Level 2) |
Significant Unobservable Inputs (Level 3) | |||||||||||
| Assets: |
|||||||||||||||
| Note receivable |
$ | 1,213,000 | $ | 1,173,749 | $ | — | $ | — | $ | 1,173,749 | |||||
| Liabilities: |
|||||||||||||||
| Long-term debt |
28,000,000 | 29,382,055 | — | — | 29,382,055 | ||||||||||
The fair value of the note receivable is estimated by discounting future cash flows based on a range of rates for similar investments adjusted for management’s expectation of credit and other risks. The fair value of long-term debt is estimated by discounting the future cash flows of the fixed rate debt at rates extrapolated based on current market conditions. The variable rate long-term debt has interest rate swaps that effectively convert such debt to fixed rate. The values of the swap agreements are included in the first table above.
- 34 -
| 13. | SUBSEQUENT EVENTS |
The Company has evaluated subsequent events through December 16, 2009, the date the financial statements were issued, and there were no items not otherwise disclosed impacting the Company’s consolidated financial statements which required additional disclosure.
* * * * * *
- 35 -
CORPORATE INFORMATION