Attached files
| file | filename |
|---|---|
| 8-K - FORM 8-K - Solo Cup CO | d8k.htm |
 Exhibit 99.1 December 3, 2009 ©2008 Solo Cup Operating Corporation |
 2 This presentation contains forward-looking statements. The words ‘‘anticipate,’’ ‘‘intend,’’ ‘‘plan,’’ ‘‘estimate,’’ ‘‘believe,’’ ‘‘expect,’’ ‘‘predict,’’ ‘‘potential,’’ ‘‘project,’’ ‘‘could,’’ ‘‘will,’’ ‘‘should,’’ ‘‘may,’’ ‘‘would’’ and similar expressions are intended to identify forward-looking statements, although not all forward-looking
statements contain such identifying words. All statements in this
presentation, other than statements of historical fact, including statements regarding our business strategy, future operations, financial position, cost savings, prospects, plans and objectives, as well as information concerning industry trends and expected actions of third parties, are forward-looking statements. All
forward-looking statements speak only as of the date on which
they are made. Such statements reflect our current assumptions concerning future events and are subject to a number of risks and uncertainties, many of which are outside our control and could cause
actual results to differ materially from such statements.
For a detailed description of these risks and uncertainties and other factors you should consider, see ‘‘Risk Factors’’ in our most recent Quarterly Report filing on Form 10-Q, our Annual
Report on Form 10-K for the fiscal year ended December 28, 2008
and in our other filings made from time to time with the SEC. Except as required by applicable law, including the securities laws of the United States and the rules and regulations of the SEC, we do not
undertake any obligation to publicly update or revise any
forward-looking statement, whether as a result of new information, future events or otherwise to reflect actual results or changes in factors or assumptions affecting such forward-looking
statements. Statement Regarding use of Non-GAAP Measures:
EBITDA and Adjusted EBITDA, as presented in this presentation, are
supplemental measures of our performance, and net debt, as
presented in this presentation, is a supplemental measure of our financial position. In each case, these measures are not required by, or presented in accordance with, generally accepted accounting principles in the United States (‘‘GAAP’’). EBITDA, Adjusted EBITDA and net debt are not measurements of our financial performance
or financial position under GAAP and should not be considered as
alternatives to net sales, net income (loss) or any other performance measures derived in accordance with GAAP or as alternatives to cash flow from operating activities as measures of
our liquidity. EBITDA is defined as income (loss) from continuing
operations, plus interest expense net of interest income, income tax provision (benefit), depreciation and amortization, as set out in our consolidated
statements of operations and consolidated statements of cash flows
included elsewhere in this offering circular. We present EBITDA because we consider it an important supplemental measure of our performance and believe it is frequently used by securities
analysts, investors and other interested parties in the evaluation
of companies in our industry. ©2008 Solo Cup Operating Corporation
|
 • Leader in Foodservice and Consumer single-use products used to serve food
and beverages in quick-serve restaurants, other foodservice
settings and homes • Manufacture and supply a broad portfolio of products, including cups, lids,
food containers, plates, bowls, portion cups and cutlery
3 Diverse Substrate Platform 1Q ‘09 LTM Sales by End Market Strong Portfolio of Brands • Plastic • Paper • Foam • Post-consumer recycled content • Renewable resources Cups and Lids Plates, Bowls and Cutlery Food Containers and Portion Cups Consumer 18% Foodservice 82% ©2008 Solo Cup Operating Corporation |
 4 Average relationship with top ten customers is over 20 years with no customer
accounting for more than 9.6% of FY2008 net sales ©2008 Solo Cup Operating Corporation |
 ©2008 Solo Cup Operating Corporation 5 1930’s 1940’s 1950’s 1970’s 2004 Today Solo introduced 2-piece waxed cold cups to serve drive-in restaurants Leo J. Hulseman founded The Paper Container Manufacturing Co. in Chicago Solo introduced Bare™ by Solo and a new line of polypropylene cold cups Solo introduced the disposable Cozy Cup and the reusable Cozy Cup holder The Paper Container Manufacturing Co. manufactured a paper cone cup known as the Solo Cup, for which the Company was renamed Debt paydown from sale-leaseback transaction and divestiture of Hoffmaster, Japan subsidiaries and uncoated white paper plate product line In conjunction with Vestar Capital Partners’ preferred equity investment, Solo Cup acquired SF Holdings – including the
Sweetheart, Fonda and Hoffmaster brands 2007 Solo introduced the signature red plastic cold cup 1960’s 1998 Solo acquired Clear Shield National; expanded into straws and disposable cutlery 2008 Divested dairy packaging line; five plant closures announced Vestar assumed control of the Board of Directors (December 2006) and new management team members hired Initiated Performance Improvement Plan |
 ©2008 Solo Cup Operating Corporation Equity Common – SCC Holding LLC Preferred – Vestar Capital Partners IV, L.P. Debt 8.5% Senior Subordinated Notes due 2014 $325 million 10.5% Senior Secured Notes due 2013 $300 million Asset-Based Revolving Credit Facility due 2013 $200 million limit (balance $9.7 million at September 27, 2009) 6 No scheduled principal payments for 4 years Ample Operating Flexibility |
 ©2008 Solo Cup Operating Corporation Improve Profitability Performance Improvement Plan Variable Costs Asset Utilization Network Optimization Fixed Costs Asset Utilization Shed unprofitable commercial arrangements Generate Cash Flow Pay down debt from sale of non-core assets Invest in Innovation New Product introductions Invest in capex Additional efficiencies 7 |
 ©2008 Solo Cup Operating Corporation 8 • Comprehensive effort to improve efficiency on all manufacturing and distribution assets • Reduce fixed costs including consolidating North American manufacturing facilities from 32 in 2004 to 13 today • Broad procurement initiative • Manage SG&A costs Reduce Costs Enhance Operational Productivity Divest Non-Core Assets Improve Profits • Rationalize SKUs • Enforce commercial arrangements • Optimize account and product value • Establish superior customer service • Transform sales and marketing effectiveness • Sale-leaseback • Uncoated white paper plates • Hoffmaster • Japanese subsidiaries • Dairy packaging product line • Improve productivity of existing manufacturing assets • Invest in state-of-the- art manufacturing equipment • Optimize utilization of most efficient manufacturing assets • Increase return on invested capital • Reduce inventory levels From Fiscal Year 2006 to the 52-week period ended September 27, 2009, gross
margin increased from 9.5% to 13.1% |
 ©2008 Solo Cup Operating Corporation 9 3Q YTD ($ in millions) 2007 2008 2009 Net book value of assets sold or taken out of service 8 $ 42 $ 24 $ Plant Closures/Restructuring Costs 2 11 9 Closed Plant Inefficiencies - 7 1 10 $ 60 $ 34 $ Capital Investments 47 $ 80 $ 53 $ Proceeds from asset sales reduced debt: Sale of Hoffmaster business 170 $ Sale and leaseback of manufacturing facilities 130 Sale of Japanese business 42 342 $ |
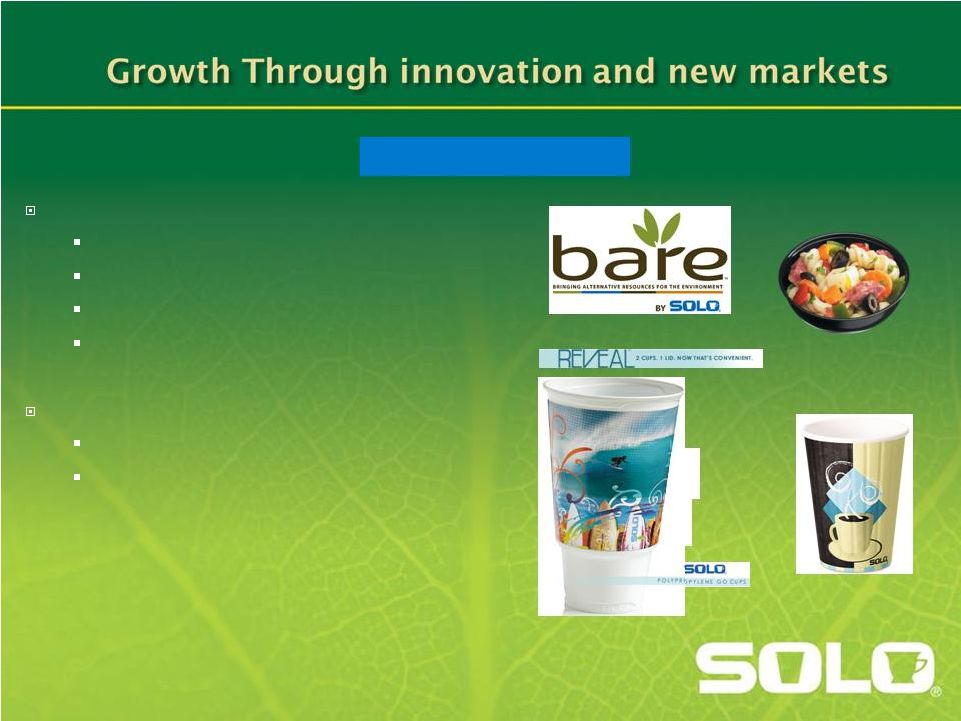 10 New Foodservice Products: Reveal™ polypropylene cups and lids Bare™ by Solo Duo Shield™ insulated hot cup Sauces and sides Continued Channel Expansion: Deli takeout Office supply Foodservice Channel ©2008 Solo Cup Operating Corporation |
 New Consumer Products: Solo Squared™ cups Heavy Duty line of paper products Bare™ by Solo Sesame Street™ kids collection Solo Cares (pink cups / plates for breast cancer awareness) It’s My Solo Cup™ Expanded Channel Areas of Focus: Value channel stores (i.e. dollar stores) Club stores Mass retailers 11 Consumer Channel ©2008 Solo Cup Operating Corporation |
 ©2008 Solo Cup Operating Corporation 12 Recyclable Materials Compostable Materials After-use Uncoated paper, wax- coated paper, plant- based plastic coatings Material Reduction Recycled Content Materials Renewable Materials Pre-use Polystyrene foam 90% air Renewable content, such as sugar cane and paper Recycled paper and plastic content PET and recycled PET plastic Bare™: Bringing Alternative Resources for the Environment • A full line single-use packaging brand for the Foodservice industry with a broad
environmental platform |
 ©2008 Solo Cup Operating Corporation SALES Volume Price Total 1Q09 vs 1Q08 (24%) -% (24%) 2Q09 vs 2Q08 (22%) (2%) (24%) 3Q09 vs 3Q08 (16%) (4%) (20%) YTD09 vs YTD08 (21%) (2%) (23%) 13 Lower unit volumes is a result of overall weakness in demand across the
industry, competitive conditions and continued impact from the implementation of strategic initiatives. |
 ©2008 Solo Cup Operating Corporation Continuous Improvement in Gross Margin 14 Before After Before After Restructuring Restructuring Restructuring Restructuring Costs Costs Costs Costs 2008 2008 2009 2009 1Q 14.7% 15.3% 10.7% 12.0% 2Q 14.7% 15.2% 16.3% 17.1% 3Q 13.0% 14.0% 14.5% 14.8% 4Q 10.8% 11.9% |
 ©2008 Solo Cup Operating Corporation Economic headwinds slows progress 15 Quarterly Adjusted EBITDA (1) ($ in millions) 2009 2008 2007 1Q 28.6 $ 50.5 $ 7.4 $ 2Q 46.0 53.7 46.0 3Q 34.1 41.0 33.9 3Q YTD 108.7 145.2 87.3 4Q 38.9 53.9 Trailing four quarter 147.6 $ 184.1 $ 141.2 $ (1) Refer to Appendix for a reconciliation from Net Income to EBITDA and Adjusted
EBITDA |
 ©2008 Solo Cup Operating Corporation Strong Operating Cash Flow and Debt Reduction 16 ($ in millions) 2008 2009 Operating Cash Flow Q1 19 $ 27 $ Q2 21 58 Q3 38 34 Total 78 $ 119 $ Net Debt (1) Q4 2008 660 $ Q1 2009 650 Q2 2009 605 Q3 2009 607 (1) Refer to Appendix for a reconciliation from Total Debt to Net Debt
|
 ©2008 Solo Cup Operating Corporation 17 Net Debt $1,124 $725 $607 $661 2006 2007 2008 3Q 2009 ($ in millions) (1) Free Cash Flow defined as Operating Cash Flow minus Capital Expenditures (Continuing
Operations). Free Cash Flow (1) ($ in millions) ($108) $40 $96 $53 2006 2007 2008 LTM 3Q '09 Reduced net debt by ~$517 million since FYE 2006, while investing $180 million in the business 17 |
 ©2008 Solo Cup Operating Corporation • Leverage brand name, strong customer relationships and comprehensive product
offerings to generate incremental sales growth • Capitalize on global customer relationships and benefit from their
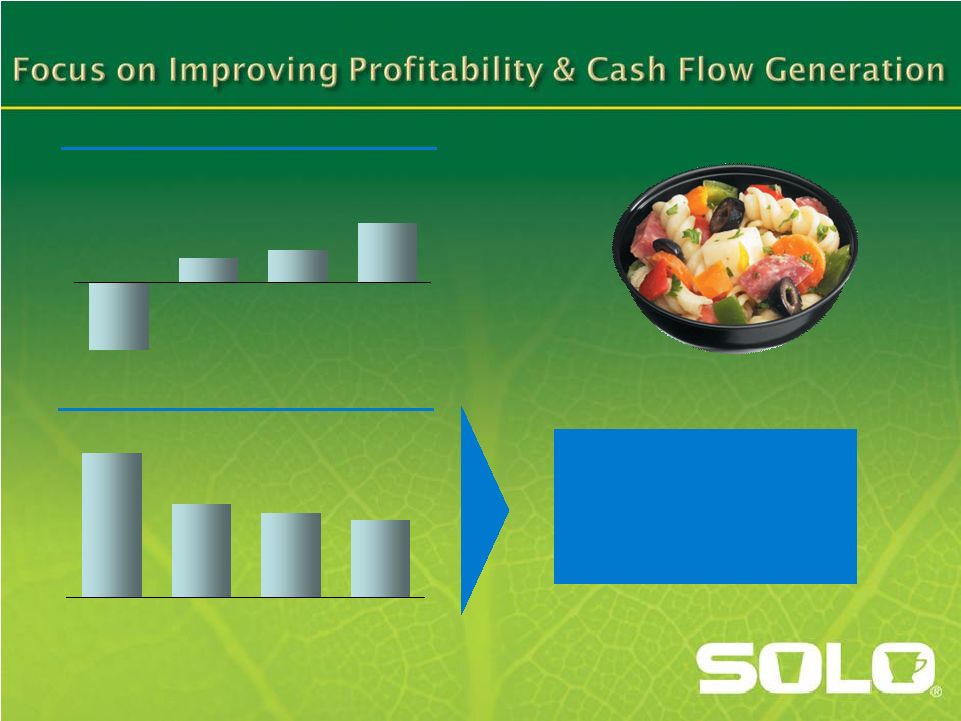
international growth 18 Cultivate Strong Customer Relationships and Broad Product Offering to Generate Sales Growth • Focus on internal projects and investments which will continue to drive performance
improvements • Continue to improve pricing / raw material strategy and inventory management Improve Profitability and Focus on Cash Flow Generation • Prioritize data-based decision-making and results-oriented
measurements • Established the Program Management Office to support the cultural shift of PIP
Sustain a Culture of Continuous Improvement • Creative innovative, value-added products and packaging to target both new and
existing customers • Enhance market position by exploring alternative substrates to create new products and
market opportunities Continue to Grow Through Product Innovation and Entering New Markets
|
 ©2008 Solo Cup Operating Corporation Well Known Branded & Private Label Product offering Leader in Foodservice and Consumer disposables Broad product portfolio using diverse materials Strong customer relationships Improving Margins Cost and efficiency improvement New products Comprehensive manufacturing and distribution system Improved Financial Position Successful refinancing Ample operating flexibility 19 |
 20 ©2008 Solo Cup Operating Corporation Reconciliation of net income to EBITDA and Adjusted EBITDA: Q3 2009 Q2 2009 Q1 2009 Q4 2008 Q3 2008 Q2 2008 Q1 2008 Q4 2007 Q3 2007 Q2 2007 Q1 2007 Net Income (loss) from continuing operations (GAAP measure) (27.9) $ 6.9 $ (10.2) $ (13.5) $ (7.8) $ 8.4 $ 0.6 $ 24.4 $ 3.7 $ 0.7 $ (34.8) $ Interest expense, net 20.0 22.4 14.6 15.3 14.8 15.3 16.2 17.1 19.0 27.9 21.1 Income tax provision (benefit) 0.8 (0.1) (6.0) (2.4) (1.2) 5.5 0.2 (17.9) 0.7 (2.9) 0.6 Depreciation and amortization 17.4 16.6 17.9 18.0 19.1 19.9 20.8 22.9 22.3 22.7 23.0 EBITDA (non-GAAP measure) 10.3 45.8 16.3 17.4 24.9 49.1 37.8 46.5 45.7 48.4 9.9 (Gain)/loss on sale of fixed asset 5.0 0.2 2.3 4.0 6.5 2.0 10.1 3.0 (10.2) (1.7) 0.4 Foreign currency exchange (gain)/loss 0.1 (3.3) 0.9 10.9 4.4 (0.4) (0.8) (0.5) (1.9) (1.3) (0.4) Asset impairment 17.2 - - 0.6 - - - 3.0 - 2.6 - Plant closure expenses and severance cost 1.5 3.1 4.4 3.7 4.8 0.9 1.6 1.8 - - - Closed plant inefficiencies - 0.2 0.8 2.3 0.4 2.1 1.8 - - - - Contractual resolution charge - - 3.9 - - - - - - - - Other expenses - - - - - - - 0.1 0.3 0.7 0.3 Sale/Leaseback Pro-Forma Adjustment - - - - - - - - - (2.7) (2.8) Adjusted EBITDA (non-GAAP measure) 34.1 $ 46.0 $ 28.6 $ 38.9 $ 41.0 $ 53.7 $ 50.5 $ 53.9 $ 33.9 $ 46.0 $ 7.4 $ |
 21 Reconciliation of Total Debt to Net Debt: Q3 2009 Q2 2009 Q1 2009 Q4 2008 Long-Term Debt, net of current maturities 629.8 $ 630.0 $ 628.1 $ 716.8 $ Current maturities of long-term debt 1.1 1.4 68.5 1.4 Total Debt (GAAP measure) 630.9 631.4 696.6 718.2 Less: Cash and cash equivalents (23.6) (26.9) (46.7) (57.5) Net Debt (non-GAAP measure) 607.3 $ 604.5 $ 649.9 $ 660.7 $ ©2008 Solo Cup Operating Corporation |