Attached files
Table of Contents
UNITED STATES
SECURITIES AND EXCHANGE COMMISSION
Washington, D.C. 20549
FORM 10-K
| x | Annual Report Pursuant to Section 13 or 15(d) of the Securities Exchange Act of 1934 |
For the fiscal year ended December 27, 2009
| ¨ | Transition Report Pursuant to Section 13 or 15(d) of the Securities Exchange Act of 1934 |
For the transition period from to
Commission file number 333-116843
SOLO CUP COMPANY
(Exact name of registrant as specified in its charter)
| Delaware | 47-0938234 | |
| (State or other jurisdiction of incorporation or organization) |
(I.R.S. Employer Identification No.) |
| 150 South Saunders Road, Suite 150, Lake Forest, Illinois | 60045 | |
| (Address of principal executive offices) | (Zip Code) |
Registrant’s telephone number, including area code: 847/444-5000
Securities registered pursuant to Section 12(b) of the Act: None.
Securities registered pursuant to Section 12(g) of the Act: None.
Indicate by check mark if the registrant is a well-known seasoned issuer, as defined in Rule 405 of the Securities Act. Yes ¨ No x
Indicate by check mark if the registrant is not required to file reports pursuant to Section 13 or Section 15(d) of the Exchange Act. Yes ¨ No x
Indicate by check mark whether the registrant (1) has filed all reports required to be filed by Section 13 or 15(d) of the Securities Exchange Act of 1934 during the preceding 12 months (or for such shorter period that the registrant was required to file such reports), and (2) has been subject to such filing requirements for the past 90 days. Yes x No ¨
Indicate by check mark whether the registrant has submitted electronically and posted on its corporate Web site, if any, every Interactive Date File required to be submitted and posted pursuant to Rule 405 of Regulation S-T (§232.405 of this chapter) during the preceding 12 months (or such shorter period that the registrant was required to submit and post such files). Yes ¨ No ¨
Indicate by check mark if disclosure of delinquent filers pursuant to Item 405 of Regulation S-K (§229.405 of this chapter) is not contained herein, and will not be contained, to the best of registrant’s knowledge, in definitive proxy or information statements incorporated by reference in Part III of this Form 10-K or any amendment to this Form 10-K. x
Indicate by check mark whether the registrant is a large accelerated filer, an accelerated filer, or a non-accelerated filer, or a smaller reporting company. See the definitions of “large accelerated filer,” “accelerated filer” and “smaller reporting company” in Rule 12b-2 of the Exchange Act.
Large accelerated filer ¨ Accelerated filer ¨
Non-accelerated filer x (Do not check if a smaller reporting company) Smaller reporting company ¨
Indicate by check mark whether the registrant is a shell company (as defined in Rule 12b-2 of the Act). Yes ¨ No x
As of March 25, 2010, 100 shares of Common Stock, $0.01 par value, were outstanding. There is no trading market for the common stock of the registrant. No shares of the registrant were held by non-affiliates.
Table of Contents
i
Table of Contents
| Item 1. | Business. |
Solo Cup Company (“Solo Delaware”) was incorporated in Delaware in January 2004 to be the holding company for Solo Cup Company, an Illinois corporation (“Solo Illinois”), and its subsidiaries, and for SF Holdings Group, Inc. and its subsidiaries, including Sweetheart Cup Company Inc. Effective February 22, 2004, Solo Illinois became a wholly owned subsidiary of Solo Delaware, and Solo Delaware acquired 100% of the outstanding capital stock of SF Holdings. Prior to these transactions, Solo Delaware had no operations other than in connection with its formation and the authorization of the transactions described above.
Solo Illinois was established in 1936. Sweetheart Cup Company’s operating history dated back to the founding of a predecessor company in 1911. In September 2005, Sweetheart Cup Company changed its name to Solo Cup Operating Corporation, and in October 2005, Solo Illinois merged with and into Solo Cup Operating Corporation, with Solo Cup Operating Corporation as the surviving entity. As a result of these transactions, Solo Delaware is a holding company, the material assets of which are 100% of the capital stock of SF Holdings. SF Holdings owns 100% of the capital stock of Solo Cup Operating Corporation.
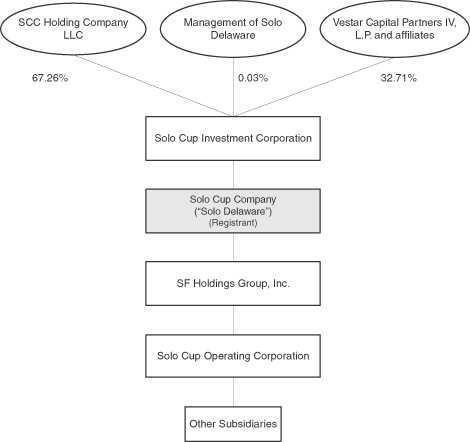
Solo Delaware is a wholly owned subsidiary of Solo Cup Investment Corporation, a Delaware corporation. SCC Holding Company LLC, a Delaware limited liability company, owns 67.26%, Vestar Capital Partners IV, L.P. and certain of its affiliates own 32.71%, and management of Solo Delaware owns the remaining 0.03%, of Solo Cup Investment Corporation as of March 15, 2010.
In this annual report, the terms “we,” “us” and “our” refer to Solo Delaware and its direct and indirect subsidiaries. Our fiscal year is the 52- or 53-week period ending on the last Sunday in December, except that our fiscal year 2005 ended on January 1, 2006. Our fiscal quarters for 2009 were the thirteen weeks ended March 29, June 28, September 27 and December 27, 2009.
1
Table of Contents
Overview of Business
We are a leading producer and marketer of single-use products used to serve food and beverages in the home, quick-service restaurants, and other foodservice settings. We distribute our products globally and have served our industry for more than 70 years. We manufacture and supply a broad portfolio of single-use products, including cups, lids, food containers, plates, bowls, portion cups, cutlery and straws, with products available in plastic, paper, foam, post-consumer recycled content and annually renewable materials. We are recognized for our customer service, and our products are known for their quality, reliability and consistency. Our products are marketed primarily under the Solo® brand, as well as Jack Frost®, Trophy® and Bare™ by Solo. We are one of the leading suppliers of branded single-use cups, plates and bowls in the United States. We also provide a line of products to select customers under private label brands.
We currently operate 15 manufacturing facilities and 13 distribution centers, some of which are combined with a manufacturing facility at a single location, in North America, the United Kingdom and Panama.
We generated approximately $1.5 billion of net sales for fiscal year 2009. Financial information about our two business segments – North America and Europe – is disclosed in Note 19 to our consolidated financial statements included in Item 8 of this annual report.
Products
We produce a broad range of plastic, paper and foam single-use products used to serve food and beverages. Our plastic products include a wide range of cups, lids, food containers, plates, bowls, cutlery and portion cups, as well as food packaging containers. Our paper products include cups, plates, bowls, portion cups and food containers. Our foam products include cups, plates and bowls. Our plastic, paper and foam products are offered in a variety of sizes, designs and colors, and at a range of price points. We also offer an Eco-forward™ product line called Bare by Solo, which includes products made with recycled plastic or paper, compostable products made with wax, plant-based polylactic acid (PLA) or sugarcane, and products made with other renewable resources.
Customers
We serve two primary customer groups: (1) foodservice distributors and operators, referred to collectively in this annual report as foodservice customers; and (2) retailers of consumer products, referred to in this annual report as consumer customers.
Foodservice
Approximately 81% of our net sales for fiscal year 2009 were to foodservice customers, including:
| • | foodservice distributors, including broadline distributors, such as Sysco Corporation, U.S. Foodservice, Inc., Gordon Food Service and Foodservices of America Inc., and specialty distributors, such as Bunzl plc, Network Services Company and UniPro Foodservice, Inc.; and |
| • | foodservice operators, such as Starbucks Corporation, Dunkin’ Donuts, McDonald’s Corporation, YUM! Brands, Inc., Panera Bread Company, ARAMARK Corporation and Sodexo. |
We believe we have strong relationships with our foodservice customers due to our broad array of product offerings, longstanding leadership in the industry and demonstrated capability in product quality, innovation, graphics and customer service.
We sell our products to foodservice customers through our regionally organized, in-house direct sales force, national account direct sales force and, to a lesser extent, select broker networks. We also maintain direct selling relationships with several of our major national accounts for which we provide direct customer service and tailored products for specific customer requirements. Our distributor-customers’ stocking decisions are based on demand from foodservice operators. Consequently, our direct and national account sales force focuses on maintaining both a service-oriented supplier relationship with distributors and on driving end-market demand from foodservice operators by offering a breadth of high-quality products. Our sales force works closely with distributors and their customers to develop unique product offerings and promotional programs.
Consumer
Sales to consumer customers accounted for approximately 19% of our net sales for fiscal year 2009 and are made through various outlets, including:
| • | grocery stores, such as Publix Super Markets, Inc., The Kroger Co. and Albertson’s, Inc.; |
| • | mass merchandisers, such as Target Corporation and Wal-Mart Stores, Inc.; |
| • | warehouse clubs, such as Costco Wholesale Corporation and BJ’s Wholesale Club, Inc.; |
2
Table of Contents
| • | value channel stores, such as Dollar General Corporation, Family Dollar Stores Inc., ALDI Inc. and Sav-A-Lot Foods Inc.; and |
| • | other retail outlets, such as drug and party stores. |
We sell to a diverse group of consumer customers primarily through regional broker networks. In the case of some of our larger consumer customers, such as Costco Wholesale Corporation, we maintain a direct supplier relationship through our in-house direct sales force. Our sales and marketing strategy for consumer customers is designed to support our strong brand names and private label product offerings and includes integrated marketing programs that consist of a combination of in-store, online, television, print and product-placement brand enhancement activities.
Any backlog of orders we may have with our foodservice or consumer customers is not material.
Seasonality
Historically, we have experienced fluctuations in sales by season. We have higher sales volume in the warmer months and realize the majority of our net cash flows from operations during the last nine months of the year. Typically, during the first quarter we build inventory to meet demand in the warmer months. Sales for such periods reflect the high seasonal demands of the summer months when outdoor and away-from-home consumption increases.
Raw Materials
In recent years, including 2009, our industry has experienced volatility in raw material and energy pricing. The principal raw materials we use are various types of resins for our plastic operations and paperboard for our paper operations. The resins include polystyrene, polypropylene and polyethylene terephthalate, or PET. We purchase resins from large petrochemical and resin producers. Resin prices are influenced by other input prices, such as crude oil, natural gas, benzene, ethylene, propylene and paraxylene, as well as availability of supply and changes in demand.
The principal raw material used in our paper operations is solid bleached sulfate paperboard. We purchase coated and uncoated board from a variety of large and small paperboard manufacturers. Paper prices are driven by global supply and demand as well as input costs for energy, fiber, chemicals, polyethylene and transportation.
We believe we have good relationships with our major raw material suppliers. For 2009, our overall supply of raw materials was adequate, and for 2010, we believe it will remain adequate.
Our raw material costs make up a significant portion of our cost of goods sold. Although we generally enter into one- to three-year supply contracts with a number of our raw material suppliers, we continue to have exposure to changes in raw material prices. Historically, we have not hedged our exposure to fluctuations in raw material prices.
Manufacturing
Our manufacturing strategy is to reduce costs through continuous process improvements and innovation, while meeting our customers’ needs and maintaining our standard for quality. We employ many different technologies and strategies to supply a wide product line, including working with third parties to supply manufacturing capability in instances where expertise or economies of scale are not available in-house. We manufacture and supply various products in plastic, paper and foam. Our flexibility and expertise in these technologies enable us to respond quickly to customer needs.
The primary processes that we use to manufacture our products are as follows:
| • | Plastic cups, lids, plates and bowls and foam plates. We use plastic extrusion to convert plastic resin from pellets to a flat extruded sheet. Using a thermoforming process, we convert the extruded sheet into the final product. We then add graphics based on customer specifications and package our products in various quantities depending on customer requirements. We have the capability to use a large variety of resins, including polystyrene, polypropylene and PET. |
| • | Paper cups, plates and food containers, and foam cups. We emboss or print graphics on paperboard according to customer requirements and feed the paperboard through machines that cut, form or fold the material into the final product. Thin wall foam cups are formed using a process similar to paper cups. |
| • | Plastic Cutlery. We utilize injection molding machines to manufacture plastic cutlery. We melt plastic pellets and then inject the molten resin into molds. The parts are automatically cooled, trimmed and ejected from the machines. We then individually wrap or package the product in bulk. We can make our plastic cutlery products with polypropylene or polystyrene. |
3
Table of Contents
Distribution
Our self-managed distribution centers in North America are located in proximity to major population centers, generally consolidating the output of our manufacturing operations. As a result of this strategy, we are able to offer a broad range of products from our distribution centers and provide value to our customers, as we can react to their demand more rapidly and they can carry less inventory. Our foreign subsidiaries operate out of owned or leased warehouses and manage the related distribution and transportation networks.
Competition
We compete in the single-use foodservice products industry. The industry encompasses a wide variety of products, including single-use cups, lids, plates, bowls, containers, cutlery and straws. These products are manufactured from plastic and paper raw materials, such as coated and uncoated paperboard, polystyrene, polypropylene and PET, emerging bio-resins such as PLA, and renewable resources such as sugarcane.
The single-use foodservice products industry is extremely competitive and highly fragmented. We compete for customers based on brand reputation, quality, cost, customer service, breadth of product offering, product differentiation, innovation, marketing programs and value. Our competitors include large multinational companies as well as regional manufacturers. Some of our competitors compete across many of our product lines, while most compete with only some of our products. A few of our competitors are integrated in the manufacturing of single-use foodservice products and related raw materials, which reduces their costs for these materials and gives them greater access to these materials in periods of short supply. Our products also compete with metal, glass and other packaging materials, as well as plastic packaging materials made through different manufacturing processes. We also face competition from foreign competitors who are entering regional U.S. markets in some product categories and are aggressively trying to differentiate their product offerings based on price.
Intellectual Property
We rely on a combination of trade secrets, confidentiality agreements, patents, trademarks, copyrights, licenses, and contractual provisions, as well as various intellectual property and unfair competition laws to protect our intellectual property and other proprietary rights. We own a number of patents and trademarks, which vary in duration depending upon when the application was filed or granted. We believe that, in the aggregate, the rights under our patents and trademarks are generally important to our business; however, no single right is material to our business. Litigation may be necessary to enforce our intellectual property rights and protect our proprietary information, or to defend against claims by third parties related to our intellectual property, and could result in substantial costs and diversion of our resources. Even if our proprietary rights are enforceable, others may be able to design around our patents or independently develop products and processes equivalent to our proprietary and confidential information.
Research and Development
Our research and development strategy has three goals: (1) create innovative, value-added products and packaging that target both new and existing customers; (2) differentiate our products in the marketplace; and (3) explore the use of alternative substrates to create new products and market opportunities and enhance our overall market position. We continue to develop, test and sample new and recycled raw materials for use in paper and plastic products, including those derived from renewable resources. In 2009, we continued our significant investments in manufacturing lines for our core product categories, as well as in support of new products developed in conjunction with our customers.
International
Our international operations consist of operating subsidiaries in the United Kingdom, Canada, Panama and Mexico, as well as international export sales originating in the United States and at our international subsidiaries. Approximately 20% of our net sales for fiscal year 2009 were generated outside of the United States. International operations are subject to additional risks inherent in conducting business outside the United States, such as changes in currency exchange rates, price and currency exchange controls, import restrictions, nationalization and other restrictive governmental actions, as well as volatile economic, social and political conditions in some countries.
4
Table of Contents
Employees
As of December 27, 2009, we had approximately 6,800 employees worldwide, including approximately 5,600 in the United States. Approximately 5,300, or 78%, of our total employees worldwide were hourly employees, and approximately 700, or 13%, of those hourly employees were covered by collective bargaining agreements. We currently have collective bargaining agreements in effect at our facilities in Scarborough, Ontario, Canada; Cuautitlan, Mexico; Springfield, Missouri; Augusta, Georgia; and Juan Diaz, Panama. These agreements cover all hourly-paid production, maintenance and distribution employees at each such facility and contain standard provisions relating to, among other things, management rights, grievance procedures, strikes and lockouts, seniority and union rights. The current expiration dates of the Scarborough, Cuautitlan, Springfield, Augusta, and Juan Diaz agreements are November 30, 2010, December 31, 2010, February 28, 2011, March 31, 2012, and June 30, 2013, respectively. Other than the agreements described above, no employees currently are covered by collective bargaining agreements. We believe that we have good relationships with our employees.
Environmental Regulation
In the normal course of business, we are required to comply with federal, state, foreign and local environmental and occupational health and safety laws and regulations, including those governing emissions of air pollutants, discharges of waste and storm water, and the handling, use, treatment, storage and disposal of, or exposure to, hazardous substances. Historical capital and operating expenditures deemed necessary to remain in compliance have not had a material impact on our financial position. We believe that we are in material compliance with applicable standards and regulations of the various regulatory agencies.
The federal Clean Air Act requires the phase-out of specified refrigerant compounds. Although we are grandfathered in, we must upgrade or retrofit the air conditioning and chilling systems we currently use during the next few years. We have decided to replace units as they become inefficient or unserviceable, and we do not believe that the costs associated with such replacement will be material to our business, financial condition, results of operations or cash flows.
Some of our facilities contain asbestos. We monitor such asbestos on an ongoing basis and maintain and/or remove it as appropriate to prevent the release of friable asbestos. We do not believe the costs associated with this program will be material to our business, financial condition, results of operations or cash flows.
We have received a number of requests for information or notifications of potential liability under the Comprehensive Environmental Response, Compensation and Liability Act of 1980, or CERCLA, regarding the investigation or cleanup of environmental contamination at third-party sites. We have no reason to believe that the final outcome of these matters will have a material adverse effect on our business, financial condition, results of operations or cash flows; however, we can give you no assurance about the ultimate effect, if any, of such matters on us.
Available Information
Our Internet website is www.solocup.com. We are an electronic filer and make available free of charge on our website our Annual Reports on Form 10-K, Quarterly Reports on Form 10-Q, Current Reports on Form 8-K and amendments to our reports filed or furnished pursuant to Section 15(d) of the Securities Exchange Act of 1934, as soon as reasonably practicable after we electronically file such materials with, or furnish such materials to, the Securities and Exchange Commission, or SEC. You may read and copy any materials we file with the SEC at its Public Reference Room at 100 F Street, NE., Washington, DC 20549. Information relating to the operation of the SEC’s Public Reference Room may be obtained by calling 1-800-SEC-0330. The SEC also maintains a website at www.sec.gov that contains our annual, quarterly and current reports, and other information that we file electronically with the SEC.
5
Table of Contents
SPECIAL NOTE REGARDING FORWARD-LOOKING STATEMENTS
This annual report on Form 10-K, including without limitation the statements found in “Management’s Discussion and Analysis of Financial Condition and Results of Operations” in Item 7 below, contain forward-looking statements. The words “anticipate,” “intend,” “plan,” “estimate,” “believe,” “expect,” “predict,” “potential,” “project,” “could,” “will,” “should,” “may,” “would” and similar expressions are intended to identify forward-looking statements, although not all forward-looking statements contain such identifying words. All statements in this report other than statements of historical fact, including statements regarding our business strategy, future operations, financial position, prospects, plans and objectives, as well as information concerning industry trends and expected actions of third parties, are forward-looking statements. All forward-looking statements speak only as of the date on which they are made. Such statements reflect our current assumptions concerning future events and are subject to a number of risks and uncertainties, many of which are outside our control and could cause actual results to differ materially from such statements. These risks and uncertainties include, but are not limited to, the factors listed in “Risk Factors” in Item 1A below. Except as required by applicable law, including the securities laws of the United States and the rules and regulations of the SEC, we do not undertake any obligation to publicly update or revise any forward-looking statement, whether as a result of new information, future events or otherwise, to reflect actual results or changes in factors or assumptions affecting such forward-looking statement.
| Item 1A. | Risk Factors. |
Set forth below and elsewhere in this annual report are risks and uncertainties that could cause our actual results to differ materially from the results contemplated by the forward-looking statements contained in this report and in other documents we file with the SEC. Additional risks and uncertainties not presently known to us, or that we currently deem immaterial, may also impact our business. Any or all of these risks could have a material adverse effect on our business, financial condition, results of operations and cash flows.
Our ability to meet our cash requirements and service our debt is impacted by many factors that are outside our control, including the current global recession and restricted credit markets.
Our future operating performance is dependent on many factors, some of which are beyond our control, including prevailing economic, financial and industry conditions. The sales of our products are primarily dependent on the discretionary income of consumers. If global economic conditions continue to adversely affect employment rates and consumer discretionary spending, our sales could continue to decline or become increasingly concentrated in lower-margin products, and our business, financial condition, results of operations or cash flows could be adversely affected.
The impact of the global recession and credit crisis on our suppliers and customers is also unpredictable, outside of our control and may create additional risks for us, both directly and indirectly. The inability of our raw material suppliers to access financing or the insolvency of one or more of our raw material suppliers, could lead to disruptions in our supply chain, which could adversely affect our sales or increase our costs. Our suppliers may require us to pay cash in advance or obtain letters of credit for their benefit as a condition to selling us their products and services. A number of restaurant chains and consumer product retailers have sought bankruptcy protection. If more than one of our principal customers filed for bankruptcy, our sales could be adversely affected and our ability to collect outstanding accounts receivable from any such customer could be limited. Any of these risks and uncertainties could have a material adverse effect on our business, financial condition, results of operations or cash flows.
Our operating performance is dependent on our continued ability to access funds under our asset-based revolving credit facility and Canadian credit facility, maintain sales volumes, drive profitable growth, realize cost savings and generate cash from operations. The financial institutions that fund our asset-based revolving and Canadian credit facilities are also being affected by the volatility in the credit markets. If one or more of those institutions cannot fulfill one of our revolving credit requests, then our operations may be adversely affected. If we cannot borrow under one of our credit facilities because a lender is unable to fund requested amounts, we do not have a sufficient borrowing base or we otherwise are unable to comply with the terms and conditions under the applicable credit facility, or if we do not meet our cost, sales or growth initiatives within the time frame we expect, our business, financial condition, results of operations and cash flows could be materially adversely affected.
A material decline in our cash flows also could cause us to fail to pay interest or principal when due under our asset-based revolving or Canadian credit facility, the indenture for our senior secured or senior subordinated notes or under our other debt agreements. A payment default or a default under any of the other covenants in our debt agreements could restrict or terminate our access to borrowings and materially impair our ability to meet our obligations as they come due. If we do not comply with our payment or other covenants under our debt agreements and we do not obtain a waiver or amendment that otherwise addresses that non-compliance, the lenders who participate in our asset-based revolving and Canadian credit facilities may accelerate payment of all amounts outstanding under the credit facilities, which amounts would immediately become due and payable, together with accrued interest. Such an acceleration would cause a default under the indentures governing our senior secured and senior subordinated notes, under our lease agreement with iStar SCC Financial Distribution Centers LLC covering six of our facilities and under other agreements that provide us with access to funding. Our ability to generate sufficient cash flow to service our debt and meet our other needs, or a default of any of the covenants under our debt agreements, may require us to reduce expenditures that we deem necessary to our business, refinance all or a portion of our debt or obtain additional financing. We cannot assure you that any refinancing of this kind would be possible or that any additional financing could be obtained on acceptable terms or at all. The inability to refinance existing debt or obtain additional financing could have a material adverse effect on our business, financial condition, results of operations and cash flows, and on our ability to meet our obligations under our credit facilities, indentures and other agreements as they become due. See “Management’s Discussion and Analysis of Financial Condition and Results of Operations — Liquidity and Capital Resources” in Item 7 of this annual report.
6
Table of Contents
Our significant level of debt could limit cash flows available for our operations, adversely affect our financial health and prevent us from fulfilling our obligations under our credit facilities, indentures and other debt agreements.
We have a significant amount of debt. As of December 27, 2009, we had total debt of $636.1 million, which included $325.0 million of our 8.5% senior subordinated notes, $294.3 million of our 10.5% senior secured notes (reflecting $300.0 million in aggregate principal amount less $5.7 million of unamortized original issue discount), $15.0 million of borrowings under our asset-based revolving credit facility, $0.4 million of borrowings under our Canadian credit facility and $1.4 million of capital lease obligations. We also had additional borrowing capacity, subject to borrowing base limitations and other specified terms and conditions, of $172.5 million under our asset-based revolving credit facility and $15.3 million under our Canadian credit facility, in each case after taking into account outstanding letters of credit.
Our significant level of debt could have important consequences for our business, including:
| • | requiring that we use a large portion of our cash flows to pay principal and interest on borrowings under our credit facilities, our senior secured and senior subordinated notes and our other debt, which would reduce the availability of cash to fund working capital, capital expenditures, research and development and other business activities; |
| • | increasing our vulnerability to general adverse economic and industry conditions; |
| • | limiting our flexibility in planning for, or reacting to, changes in our business and the industry in which we operate; |
| • | restricting us from making strategic acquisitions or exploiting business opportunities; |
| • | making it more difficult for us to satisfy our obligations under the credit facilities, the senior secured and senior subordinated notes and our other debt; |
| • | placing us at a competitive disadvantage relative to competitors that have less debt; and |
| • | limiting our ability to borrow additional monies in the future to fund working capital, capital expenditures, research and development and other business activities. |
We may be able to incur significant additional debt that could further exacerbate the risks associated with our substantial leverage.
We may incur additional debt in the future. Although the indentures governing our senior secured and senior subordinated notes and the terms of our asset-based revolving and Canadian credit facilities contain restrictions on our incurrence of additional debt, these restrictions are subject to a number of qualifications and exceptions, and we could incur significant additional debt. As of December 27, 2009, we had available capacity, subject to borrowing base limitations and other specified terms and conditions, of $187.8 million under our asset-based revolving and Canadian credit facilities, in each case after taking into account outstanding letters of credit. If we incur additional debt, the risks described above under “Our significant level of debt could limit cash flows available for our operations, adversely affect our financial health and prevent us from fulfilling our obligations under our credit facilities, indentures and other debt agreements” would intensify.
Covenant restrictions under our debt agreements may limit our ability to operate our business.
The indentures governing our senior secured and senior subordinated notes, the agreements governing our asset-based revolving and Canadian credit facilities and the agreements governing our other existing debt contain covenants that may restrict our ability to finance future operations or capital needs or to engage in other business activities, which restrictions include, among other things, limitations on our ability to:
| • | incur additional debt or issue preferred and other specified classes of stock; |
| • | create liens; |
| • | pay dividends, make investments or make other restricted payments; |
| • | sell assets; |
| • | consolidate, merge, sell or otherwise dispose of all or substantially all of our assets; |
| • | enter into transactions with affiliates; and |
| • | designate subsidiaries as unrestricted under specified agreements governing our indebtedness. |
7
Table of Contents
In addition, if our available capacity under the asset-based revolving credit facility falls below a specified level (the greater of (a) $15,000,000 or (b) 15% of the lesser of our borrowing base or the aggregate amount of commitments under the facility), we will be required to maintain a Fixed Charge Coverage Ratio (as defined in the facility) of 1.1 to 1 for a trailing twelve-month period.
A breach of any of these covenants would result in a default under the loan agreements governing our asset-based revolving and Canadian credit facilities and under the indentures governing our senior secured and senior subordinated notes. If an event of default under the loan agreement governing our asset-based revolving or Canadian credit facility, the indenture governing our senior secured or senior subordinated notes or our other debt agreements, all amounts outstanding under those agreements could be declared immediately due and payable, together with accrued interest. If all or a portion of our debt were accelerated, we cannot assure you that we would have access to sufficient funds or other assets to pay amounts due.
Failure to maintain our credit ratings could limit our access to the capital markets, adversely affect the cost and terms upon which we are able to obtain additional financing and negatively impact our business.
Although we believe existing cash, funds generated by operations and amounts available under our asset-based revolving credit facility will collectively provide adequate resources to fund our ongoing operating requirements, we may be required to seek additional financing to compete effectively. In light of difficulties in the financial markets, there can be no assurance that we will be able to maintain our credit ratings. We have experienced downgrades in the past and may experience further downgrades. Failure to maintain these credit ratings could, among other things, limit our access to the capital markets and adversely affect the cost and terms upon which we are able to obtain additional financing, including any financing from our suppliers, which could negatively affect our business.
We could be adversely affected by raw material availability and pricing or a shortage of supply due to supplier financial difficulties, natural disasters or other causes.
Our principal raw materials include polystyrene, polypropylene, PET and coated and uncoated paperboard. There are currently a limited number of polystyrene suppliers, and periods of short supply may occur if one or more suppliers’ operations are materially affected by financial difficulties, natural disasters or other factors. To the extent that our supply of raw materials becomes restricted and we cannot locate or substitute adequate alternative sources, our business, financial condition, results of operations and cash flows may be materially adversely affected.
In addition, prices for our raw materials fluctuate. When raw material prices decline, we face increased pressure from our customers to reduce our selling prices for products containing that raw material. When raw material prices increase, our selling prices have historically also increased, although often with a time lag. A number of factors affect the impact that raw material price changes have on us, including the underlying cause of price changes (e.g., natural disasters, weather conditions or general economic conditions), the level of our inventories at the time of price changes, the specific timing and frequency of price changes and the lead and lag time that generally accompany the implementation of both raw material price changes and subsequent selling price changes. If raw material prices increase and we are unable to pass the price increases on to our customers or there is a significant time lag in any selling price increases that we are able to implement, our profitability may be adversely affected, which could have a material adverse effect on our business, financial condition, results of operations and cash flows. We have not historically employed hedging strategies to limit our exposure to fluctuations in raw material prices on any meaningful level.
Our ability to successfully operate is dependent on the availability of energy and fuel at anticipated prices.
Sustained increases in global energy prices, particularly for crude oil and electricity, at prices greater than we have anticipated could have a material adverse impact on our operations if we are unable to pass through such increases to our customers in a timely manner. Increases in crude oil prices particularly impact our transportation and production costs and the price we pay for some raw materials. Global energy prices are determined by many factors that are beyond our control and unpredictable. Consequently, we cannot predict whether global energy prices will remain at their current levels, and we cannot predict the impact that these prices will have on our business, financial condition, results of operations or cash flows.
8
Table of Contents
We operate in a highly competitive environment and may not be able to compete successfully.
The single-use foodservice products industry is extremely competitive and highly fragmented. We compete for customers based on brand reputation, quality, cost, customer service, breadth of product offering, product differentiation, innovation, marketing programs and value. A few of our competitors are integrated in the manufacturing of single-use foodservice products and related raw materials, which reduces their costs for these materials and gives them greater access to the materials in periods of short supply. Our current or potential competitors may offer products at a lower price or products and services that are superior to ours. In addition, our competitors may be more effective and efficient in integrating new technologies or emerging raw materials to meet changing consumer demands or legislative mandates. Our success depends upon successful research, development and engineering efforts to utilize emerging and legislatively mandated raw materials, our ability to expand or modify our manufacturing capacity and the extent to which we are able to convince customers and consumers to accept our new products. If we fail to successfully innovate, introduce, market, manufacture and differentiate our products from those of our competitors, our ability to maintain or expand our net sales and to maintain or enhance our industry position or profit margins could be adversely affected. This, in turn, could materially adversely affect our business, financial condition, results of operations or cash flows.
Our products also compete with products that incorporate metal, glass, reusables and other packaging materials. If we are unable to react timely to changing consumer demands, legislative mandates and competitive conditions that favor those or other competing products, we may experience lower prices, sales volume and gross margins, and a reduced ability to attract and retain customers.
Our operations and products are subject to environmental and governmental regulations that could adversely affect our business, financial condition, results of operations or cash flows.
Our operations are subject to comprehensive and frequently changing federal, state, local and foreign environmental and occupational health and safety laws and regulations. These laws and regulations include the federal Food, Drug and Cosmetic Act, which regulates materials that have direct contact with food, and laws governing the use of specified raw materials in our products, emissions of air pollutants, discharges of waste and storm water, and the handling, use, treatment, storage and disposal of, or exposure to, hazardous substances. We are presently, and may in the future be, subject to liability for the investigation and remediation of environmental contamination, including contamination caused by other parties, at properties that we own or operate or formerly owned or operated, and at other properties where we or our predecessors arranged for the disposal of hazardous substances. As a result, we are involved from time to time in administrative and judicial proceedings and inquiries relating to environmental matters. Any present or future investigations, future clean up costs or remedial efforts relating to environmental matters could entail material costs or otherwise result in material liabilities. Under environmental laws applicable to our operations and our properties, we are required to obtain various environmental permits granted by federal, state, local and foreign authorities. There are various risks associated with noncompliance with these permits, including cessation of our operations at the noncompliant facilities and significant fines and penalties.
We cannot predict what environmental legislation or regulations will be enacted in the future, how existing or future laws or regulations will be administered or interpreted or affect the use of our products, or what environmental conditions may be found to exist at our facilities or at third-party sites for which we are liable. Enactment of stricter laws or regulations, stricter interpretation of existing laws and regulations or the requirement to undertake the investigation or remediation of currently unknown environmental contamination at our own or third-party sites may require us to make additional expenditures, some of which could be material.
The single-use foodservice products industry is subject to evolving federal, state, local and foreign legislation and regulations affecting the types of raw materials we may use in our products. Some of the legislation and regulations are designed to reduce solid waste and litter by requiring, among other things, that manufacturers pay for the disposal of products they create or use raw materials that are recyclable, biodegradable or compostable. Other legislation and regulations are intended to promote health and safety by prohibiting, or requiring the disclosure of, the use of specified materials. The legislation passed to date has not had a material adverse effect on our operations; however, if we are unable to procure or substitute raw materials that meet the requirements of future environmental legislation or regulations, our sales may decline in those localities where such laws and regulations have been adopted. Proposed legislation could increase our operating costs as a result of any fees imposed on manufacturers of foodservice products for the disposal of products that are not recyclable or compostable and could increase the cost of our products by prohibiting the use of traditional raw materials and requiring the use of emerging materials that are more expensive. Proposed legislation and regulations also could lower demand for products that include, or are associated with, materials that are the focus of health and safety legislation or regulations.
9
Table of Contents
Our international operations expose us to risks related to conducting business in multiple jurisdictions outside the United States.
Our international operations consist of operating subsidiaries in four countries, as well as international export sales originating in the United States and at our international facilities. The international scope of our operations may lead to volatile financial results and difficulties in managing our business. We generated approximately 20% of our net sales outside the United States during fiscal year 2009. International sales and operations are subject to a number of risks, including the following:
| • | exchange rate fluctuations and limitations on currency convertibility; |
| • | import limitations and export control restrictions; |
| • | social and political turmoil, corruption and civil unrest; |
| • | restrictive governmental actions, such as the imposition of trade quotas and restrictions on transfers of funds; |
| • | changes in non-U.S. labor laws and regulations affecting our ability to hire, retain or dismiss employees; |
| • | violations of U.S. or local laws, including the U.S. Foreign Corrupt Practices Act; |
| • | compliance with multiple and potentially conflicting laws and regulations; |
| • | preference for locally-branded products, and laws and business practices favoring local competition; |
| • | less effective protection of intellectual property; |
| • | difficulties and costs of staffing, managing and accounting for foreign operations; and |
| • | unfavorable business conditions or economic instability in any particular country or region. |
Our exposure to risks associated with currency exchange rate fluctuations results primarily from translation exposure associated with the preparation of our consolidated financial statements, as well as from transaction exposure associated with generating revenues and incurring expenses in different currencies. While our consolidated financial statements are reported in U.S. dollars, the financial statements of our foreign subsidiaries are measured using the local currency as the functional currency and translated into U.S. dollars by applying an appropriate exchange rate. As a result, fluctuations in the exchange rate of the U.S. dollar relative to the local currencies in which our foreign subsidiaries report could cause significant fluctuations in our consolidated results. We record sales and expenses in a variety of currencies. While our expenses with respect to foreign operations are generally denominated in the same currency as the corresponding sales, we have transaction exposure to the extent our receipts and expenditures are not offsetting in any currency. Moreover, the costs of doing business abroad may increase as a result of adverse exchange rate fluctuations. In addition, we may lose customers if exchange rate fluctuations, currency devaluation or economic crises increase the local currency price of our products or reduce our customers’ ability to purchase our products. If we are unable to manage the operational challenges associated with our international activities, our business, financial condition, results of operations or cash flows could be materially adversely affected.
In the event of a catastrophic loss of one of our key manufacturing facilities, our business would be adversely affected.
While we manufacture our products in a number of diversified facilities and maintain insurance covering our facilities, including business interruption insurance, a catastrophic loss of the use of all or a portion of one of our key manufacturing facilities due to accident, weather conditions, natural disaster or otherwise, whether short- or long-term, could have a material adverse effect on our business, financial condition, results of operations or cash flows.
We are controlled by the stockholders of Solo Cup Investment Corporation, the interests of which may conflict with the interests of holders of our senior secured and senior subordinated notes.
All of our outstanding capital stock is owned by our parent company, Solo Cup Investment Corporation. Holders of SCC Holding’s voting interests control 100% of the outstanding common stock of Solo Cup Investment Corporation, and affiliates of Vestar hold 99.9% of Solo Cup Investment Corporation’s outstanding convertible participating preferred stock, or SCIC preferred stock, with the remaining balance of the SCIC preferred stock held by members of our management.
The SCIC preferred stock is currently convertible at any time, at the option of the holders, into 32.71% of the common stock of Solo Cup Investment Corporation. The SCIC preferred stock is entitled to vote on all matters, voting together with the holders of common stock as a single class. In December 2006, Vestar, in its capacity as the significant shareholder of SCIC preferred stock, became entitled to appoint a majority of the director positions of Solo Delaware and Solo Cup Investment Corporation pursuant to a stockholders’ agreement dated as of February 27, 2004, as amended, among Vestar, Solo Cup Investment Corporation, SCC Holding, Solo Delaware and various other parties. If Vestar receives a bona fide offer from a third party to purchase (whether by stock purchase, merger or otherwise) at least 80% of Solo Delaware’s common stock, SCC Holding has agreed at Vestar’s request to vote in favor of such offer.
10
Table of Contents
The interests of SCC Holding and the holders of SCIC preferred stock, including Vestar, could conflict with the interests of holders of our senior secured and senior subordinated notes. For example, if we encounter financial difficulties or are unable to pay our debts as they mature, the interests of these indirect equity holders might conflict with the interests of a holder of our notes. Solo Cup Investment Corporation’s stockholders may also have an interest in pursuing acquisitions, divestitures, financings or other transactions that, in their judgment, could enhance their equity investments, even though the transactions might involve risks to a holder of our senior secured or senior subordinated notes. In addition, SCC Holding and Vestar, or any of their affiliates, may in the future own businesses that directly compete with our business. While we are subject to specified provisions of the Sarbanes-Oxley Act of 2002 and the rules and regulations promulgated thereunder, these provisions do not require us to have independent directors.
The loss of one or more of our principal customers could have a material adverse effect on our business, financial condition, results of operations or cash flows.
We have a number of large customers that account for a significant portion of our net sales. For fiscal year 2009, our five largest customers represented approximately 30% of our net sales, with no one customer accounting for more than 9% of our net sales. The loss of one or more of our large customers could have a material adverse effect on our business, financial condition, results of operations or cash flows. In line with industry practice, we generally do not enter into long-term sales agreements with customers.
We may undertake acquisitions or divestitures and consequently face potential integration, management diversion and other risks.
We may make acquisitions or divestitures in the future. Any future acquisitions or divestitures could be of significant size and may involve U.S. or international parties. To acquire and integrate a separate organization or significant new assets or to divest a portion of our business would divert management attention from other business activities. This diversion, together with other difficulties we may encounter in integrating an acquired business or selling a portion of our business, could have a material adverse effect on our business, financial condition, results of operations or cash flows. In connection with future acquisitions, we may assume undisclosed liabilities of the businesses we acquire. These liabilities could materially adversely affect our business, financial condition, results of operations or cash flows.
We may not be able to adequately protect our intellectual property and other proprietary rights.
We rely on a combination of trade secrets, confidentiality agreements, patents, trademarks, copyrights, licenses, and contractual provisions, as well as various intellectual property and unfair competition laws to protect our intellectual property and other proprietary rights. Such measures may not provide adequate protection and may not prevent our competitors from gaining access to our intellectual property and proprietary information or independently developing technologies that are substantially equivalent or superior to our technology, which could harm our competitive position and could have a material adverse effect on our business, financial condition, results of operations or cash flows. Furthermore, we cannot give you any assurance that any pending patent application or trademark application made by us will result in an issued patent or registered trademark, or that any issued or registered patents or trademarks will not be challenged, invalidated, circumvented or rendered unenforceable.
Litigation may be necessary to enforce our intellectual property rights and protect our proprietary information, or to defend against claims by third parties related to our intellectual property. Any litigation or claims brought by or against us, whether successful or not, could result in substantial costs and diversion of our resources, which could have a material adverse effect on our business, financial condition, results of operations or cash flows. Any intellectual property litigation or claims against us could result in the loss or compromise of our intellectual property and proprietary rights, subject us to significant liabilities, require us to seek licenses on unfavorable terms, if available at all, prevent us from manufacturing or selling products or require us to redesign, relabel or, in the case of trademark claims, rename our products, any of which could have a material adverse effect on our business, financial condition, results of operations or cash flows. We are currently a defendant in a case involving the patent marking statute as applied to certain patent markings on our products. This case was resolved in our favor on summary judgment, and it is currently on appeal at the U.S. Court of Appeals for the Federal Circuit. We believe that the plaintiff’s claims are without merit and we will continue to vigorously defend ourselves on appeal.
Financial market conditions have had a negative impact on the return of plan assets for our pension plans, which may require additional funding and negatively impact our cash flows.
Certain U.S., Canadian and European hourly and salaried employees are covered by our defined benefit pension plans. Between December 31, 1987 and March 31, 2001, the majority of the U.S. plans were frozen to new participants. Our pension expense and required contributions to our pension plan are directly affected by the value of plan assets, the projected rate of return on plan assets, the actual rate of return on plan assets and the actuarial assumptions we use to measure the defined benefit pension plan obligations. Due to the significant financial market downturn that started in 2008 and continued into 2009, the funded status of our pension plans has declined and actual asset returns were below the assumed rate of return used to determine pension expense. Our pension plans were underfunded by approximately $29.3 million and $26.1 million, as of December 27, 2009 and December 28, 2008, respectively. If plan assets continue to perform below expectations, future pension expense and funding obligations will increase, which could have a negative impact on our cash flows from operations, decrease borrowing capacity and increase interest expense. Moreover, under the Pension Protection Act of 2006, it is possible that continued losses to asset values may necessitate accelerated funding of U.S. pension plans in the future to meet minimum federal government requirements.
11
Table of Contents
| Item 1B. | Unresolved Staff Comments. |
None.
| Item 2. | Properties. |
We own, lease and operate manufacturing and distribution facilities in North America, Panama and the United Kingdom. The table below provides summary information regarding our material manufacturing, distribution and office properties that are currently in operation. We believe these properties are being used, and are adequate, for their intended purposes and are well-maintained. A number of our owned properties are mortgaged as collateral under the indenture governing our senior secured notes and under our asset-based revolving credit facility. The table below does not reflect our manufacturing facilities in Belen, New Mexico and Highland Park, Illinois that we closed in 2009. Our Belen facility is currently under contract for sale, and we are currently seeking a buyer for our Highland Park facility. The table also does not reflect our undeveloped land parcel in Chicago, Illinois, which we are also actively marketing for sale. In December 2009, we moved our executive offices from Highland Park, Illinois to a new, leased facility in Lake Forest, Illinois. The table below reflects this leased facility.
| Facilities | ||||||||
| Location |
Function |
Owned/ Leased |
Size (Approximate Square Footage) | |||||
| California |
Rialto | Distribution Center | Leased | 882,230 | ||||
| Georgia |
Augusta | Manufacture | Leased | 364,000 | ||||
| Conyers | Manufacture | Leased | 367,000 | |||||
| Social Circle | Distribution Center | Leased | 1,300,716 | |||||
| Idaho |
Twin Falls | Manufacture | Owned | 130,000 | ||||
| Illinois |
Chicago | Manufacture | Leased | 820,000 | ||||
| Lake Forest | Executive Office | Leased | 133,218 | |||||
| University Park | Distribution Center | Leased | 1,555,720 | |||||
| Urbana | Manufacture | Leased | 269,000 | |||||
| Maryland |
Federalsburg | Manufacture | Leased | 405,000 | ||||
| Hampstead | Distribution Center | Leased | 1,034,470 | |||||
| Owings Mills (2 facilities) | Manufacture/Distribution Center | Owned | 1,703,292 | |||||
| Massachusetts |
North Andover | Manufacture | Leased | 248,500 | ||||
| Missouri |
Springfield | Manufacture | Owned | 941,000 | ||||
| Oklahoma |
Ada | Manufacture | Owned | 267,000 | ||||
| Texas |
Dallas | Manufacture/Distribution Center | Leased | 1,220,000 | ||||
| Grand Prairie | Distribution Center | Leased | 603,354 | |||||
| Washington |
Sumner | Distribution Center | Leased | 401,076 | ||||
| Non-US |
Mississauga, Ontario, Canada | Distribution Center/Office | Leased | 262,087 | ||||
| Toronto, Ontario, Canada | Manufacture/Distribution Center | Owned | 285,000 | |||||
| Cuautitlan, Mexico (4 facilities) |
Manufacture/Distribution Center | 1 Owned/ 3 Leased (1) |
98,425 | |||||
| Panama (2 facilities) |
Manufacture/Distribution Center | 1 Owned/ 1 Leased |
359,773 | |||||
| United Kingdom (5 facilities) |
Manufacture/Distribution Center | Leased (2) | 287,000 | |||||
| (1) | Excludes a lease for a warehouse that expires on April 1, 2010 and will not be renewed. |
| (2) | At one of these facilities we own a building on leased land. |
We also utilize a small number of third-party warehouses on a pay for use basis.
12
Table of Contents
| Item 3. | Legal Proceedings. |
We are involved in various claims and legal actions arising from time to time in the ordinary course of business. We establish reserves for claims and actions when it is probable that we will incur a loss and such loss is capable of being estimated. While we cannot predict the outcome of these claims and actions with certainty, we believe that based on our current assessment of the facts and circumstances we are not a party to any pending legal proceeding, the ultimate disposition of which would have a material adverse effect on our business, financial position, results of operations or cash flows.
| Item 4. | Reserved. |
| Item 5. | Market for Registrant’s Common Equity, Related Stockholder Matters and Issuer Purchases of Equity Securities. |
There is no public trading market for Solo Delaware’s common stock. Solo Cup Investment Corporation is the owner of record of all of the common stock of Solo Delaware. We do not have any equity compensation plans under which Solo Delaware securities may be issued.
Since our formation in January 2004, we have not paid dividends on Solo Delaware’s common stock and we do not anticipate paying cash dividends in the foreseeable future. In addition, our bank credit facilities and the indentures governing our senior secured and senior subordinated notes restrict our ability to pay dividends on Solo Delaware’s common stock.
13
Table of Contents
| Item 6. | Selected Financial Data. |
The following table sets forth our selected historical consolidated financial data. You should read the information in this table in conjunction with “Management’s Discussion and Analysis of Financial Condition and Results of Operations” included in Item 7 of this annual report and our consolidated financial statements, including the related notes, included in Item 8 of this annual report.
| (In millions) |
Year Ended December 27, 2009 |
Year Ended December 28, 2008 |
Year Ended December 30, 2007 |
Year Ended December 31, 2006 |
Year Ended January 1, 2006 |
|||||||||||||||
| Statement of Operations Data: |
||||||||||||||||||||
| Net sales |
$ | 1,502.6 | $ | 1,847.0 | $ | 2,110.1 | $ | 2,124.0 | $ | 2,073.8 | ||||||||||
| Cost of goods sold |
1,296.2 | 1,599.2 | 1,859.7 | 1,921.4 | 1,835.5 | |||||||||||||||
| Gross profit |
206.4 | 247.8 | 250.4 | 202.6 | 238.3 | |||||||||||||||
| Selling, general and administrative expenses |
150.1 | 159.6 | 203.6 | 216.4 | 219.7 | |||||||||||||||
| Impairment of goodwill |
17.2 | — | — | 228.5 | — | |||||||||||||||
| Loss (gain) on asset disposals |
9.0 | 22.6 | (8.5 | ) | 4.4 | (6.4 | ) | |||||||||||||
| Operating income (loss) |
30.1 | 65.6 | 55.3 | (246.7 | ) | 25.0 | ||||||||||||||
| Interest expense, net |
63.1 | 61.6 | 79.8 | 75.3 | 61.1 | |||||||||||||||
| Prepayment penalty |
— | — | 1.3 | — | — | |||||||||||||||
| Loss on debt extinguishment |
2.5 | — | 4.0 | — | — | |||||||||||||||
| Reclassification of unrealized loss on cash flow hedges to interest expense |
9.1 | — | — | — | — | |||||||||||||||
| Foreign currency exchange (gain) loss, net |
(2.6 | ) | 14.1 | (4.1 | ) | (6.9 | ) | 4.1 | ||||||||||||
| Other (income) expense, net |
— | — | (0.2 | ) | 0.1 | — | ||||||||||||||
| Loss from continuing operations before income taxes |
(42.0 | ) | (10.1 | ) | (25.5 | ) | (315.2 | ) | (40.2 | ) | ||||||||||
| Income tax (benefit) provision |
(6.3 | ) | 2.1 | (19.5 | ) | 56.3 | (14.8 | ) | ||||||||||||
| Loss from continuing operations |
(35.7 | ) | (12.2 | ) | (6.0 | ) | (371.5 | ) | (25.4 | ) | ||||||||||
| (Loss) income from discontinued operations, net of income tax provision |
— | (0.7 | ) | (0.1 | ) | (2.9 | ) | 5.6 | ||||||||||||
| Gain on sale of discontinued operations, net of income tax provision |
— | 0.8 | 77.2 | — | — | |||||||||||||||
| Net (loss) income |
$ | (35.7 | ) | $ | (12.1 | ) | $ | 71.1 | $ | (374.4 | ) | $ | (19.8 | ) | ||||||
| Balance Sheet Data (1)(2) : |
||||||||||||||||||||
| Cash and cash equivalents |
$ | 30.0 | $ | 57.5 | $ | 33.6 | $ | 26.4 | $ | 12.1 | ||||||||||
| Total assets |
987.4 | 1,073.8 | 1,203.2 | 1,556.1 | 1,857.5 | |||||||||||||||
| Total debt, including current maturities |
636.1 | 718.2 | 759.0 | 1,150.1 | 1,043.3 | |||||||||||||||
| Total shareholder’s equity |
18.2 | 31.3 | 88.5 | 9.2 | 382.2 | |||||||||||||||
| Other Financial Data (2) : |
||||||||||||||||||||
| Net cash provided by (used in) operating activities |
$ | 137.9 | $ | 131.9 | $ | 95.6 | $ | (51.5 | ) | $ | 2.0 | |||||||||
| Net cash (used in) provided by investing activities |
(65.6 | ) | (68.4 | ) | 305.6 | (33.8 | ) | (30.2 | ) | |||||||||||
| Net cash (used in) provided by financing activities |
(101.1 | ) | (40.3 | ) | (394.9 | ) | 99.8 | 24.5 | ||||||||||||
| Capital expenditures |
71.8 | 79.7 | 49.0 | 60.5 | 52.4 | |||||||||||||||
| Depreciation and amortization |
70.0 | 77.7 | 95.3 | 101.2 | 104.5 | |||||||||||||||
| (1) | Balance sheet data is as of the last day of the relevant fiscal year. |
| (2) | Balance sheet data and other financial data include our continuing and discontinued operations. See Note 3 of our audited consolidated financial statements included in Item 8 of this annual report. |
14
Table of Contents
| Item 7. | Management’s Discussion and Analysis of Financial Condition and Results of Operations. |
Executive Summary
We are a leading producer and marketer of single-use products used to serve food and beverages in the home, quick-service restaurants, and other foodservice settings. We manufacture and supply a broad portfolio of single-use products, including cups, lids, food containers, plates, bowls, portion cups, cutlery and straws, with products available in plastic, paper, foam, post-consumer recycled content and annually renewable materials. We serve two primary customer groups, foodservice and consumer. Sales to foodservice customers accounted for approximately 81% of our net sales in 2009. Sales to consumer customers accounted for the remaining 19%.
Raw materials – In recent years, including 2009, our industry has experienced volatility in raw material and energy pricing. Resin prices are influenced by other input prices such as crude oil, natural gas, benzene, ethylene, propylene and paraxylene, as well as availability of supply and changes in demand. The price of benzene, ethylene and propylene rose significantly throughout 2009.
The principal raw material used in our paper operations is solid bleached sulfate paperboard. Paper prices are driven by global supply and demand as well as input costs for energy, fiber, chemicals, polyethylene and transportation. Although paper prices rose throughout 2008 and the first half of 2009, they stabilized in the last part of the year.
Energy prices – The volatility of global energy prices affects our transportation and production costs. Historically, we have been able to partially mitigate the effect of higher energy-related costs with productivity, utilization of equipment and efficiency improvements. During 2009, we experienced lower transportation and energy costs compared to 2008.
Economic recession – The global economic recession that started late in 2008 and continued in 2009 had a significant impact on our 2009 operating results. The environment in which we do business has quickly changed. Consumers are managing their discretionary spending more conservatively and our customers are managing their businesses differently. As a result, during 2009 we continued to experience a decline in sales volume, although the rate of decline was not as significant as in the fourth quarter of 2008 and moderated in the fourth quarter of the year. We believe the decline was driven by a variety of external factors such as consumers eating out less frequently and higher unemployment rates, both of which tended to contract the market for our foodservice operators. Lower consumer discretionary spending translated into a smaller consumer market, as did a shift from national brands to private label products, which are traditionally offered at lower prices.
Refinancing transactions – In July 2009, we refinanced our debt by issuing $300.0 million of 10.5% senior secured notes due in 2013 and by entering into a new asset-based revolving credit facility providing for borrowings of up to $200.0 million, subject to borrowing base limitations and other specified terms and conditions. We used the initial borrowings under our asset-based revolving credit facility, together with the net proceeds from the issuance of our senior secured notes, to retire our first lien credit facility. As a result, we have no principal payments due on our outstanding debt until November 2013.
Operational improvements – In 2009, we continued our focus on identifying and implementing operational improvements to reduce our controllable costs. Our continued efforts to optimize our supply chain through a consolidated footprint resulted in the closure of two manufacturing facilities during the first half of the year. The impact of these consolidation activities on our 2009 financial statements included approximately $12 million in cost of goods sold related to equipment transfers, ramp-down costs at the closing facilities and start-up expenses at the receiving plants. We continue to evaluate opportunities that may offer further cost structure improvements.
The financial results for 2009 include:
| • | an 18.6% decrease in net sales compared to 2008, driven by a 16.3% decrease in sales volume; |
| • | a 16.7% decrease in gross profit from 2008; however, gross margin, or gross profit as a percentage of net sales, increased to 13.7% compared to 13.4% in 2008; |
| • | $137.9 million of cash flows generated from operating activities for our continuing operations compared to $132.6 million in 2008; |
| • | a decrease in capital expenditures to $71.8 million compared to $79.7 million in 2008; and |
| • | an $82.1 million reduction in outstanding debt to $636.1 million from $718.2 million as of the end of 2008, driven by cash flows from operations and sales of excess assets. |
15
Table of Contents
Results of Operations for Fiscal Years 2009, 2008 and 2007
| 2009 vs. 2008 | 2008 vs. 2007 | |||||||||||||||||||||||||
| Fiscal Year | Favorable / (Unfavorable) | |||||||||||||||||||||||||
| (In millions) |
2009 | 2008 | 2007 | $ | % | $ | % | |||||||||||||||||||
| Net sales |
$ | 1,502.6 | $ | 1,847.0 | $ | 2,110.1 | $ | (344.4 | ) | (18.6 | ) | $ | (263.1 | ) | (12.5 | ) | ||||||||||
| Cost of goods sold |
1,296.2 | 1,599.2 | 1,859.7 | 303.0 | 18.9 | 260.5 | 14.0 | |||||||||||||||||||
| Gross profit |
206.4 | 247.8 | 250.4 | (41.4 | ) | (16.7 | ) | (2.6 | ) | (1.0 | ) | |||||||||||||||
| Selling, general and administrative expenses |
150.1 | 159.6 | 203.6 | 9.5 | 6.0 | 44.0 | 21.6 | |||||||||||||||||||
| Impairment of goodwill |
17.2 | — | — | (17.2 | ) | * | — | — | ||||||||||||||||||
| Loss (gain) on asset disposals |
9.0 | 22.6 | (8.5 | ) | 13.6 | 60.2 | (31.1 | ) | * | |||||||||||||||||
| Operating income |
30.1 | 65.6 | 55.3 | (35.5 | ) | (54.1 | ) | 10.3 | 18.6 | |||||||||||||||||
| Interest expense, net |
63.1 | 61.6 | 79.8 | (1.5 | ) | (2.4 | ) | 18.2 | 22.8 | |||||||||||||||||
| Prepayment penalty |
— | — | 1.3 | — | — | 1.3 | * | |||||||||||||||||||
| Loss on debt extinguishment |
2.5 | — | 4.0 | (2.5 | ) | * | 4.0 | * | ||||||||||||||||||
| Reclassification of unrealized loss on cash flow hedges to interest expense |
9.1 | — | — | (9.1 | ) | * | — | — | ||||||||||||||||||
| Foreign currency exchange (gain) loss, net |
(2.6 | ) | 14.1 | (4.1 | ) | 16.7 | * | (18.2 | ) | * | ||||||||||||||||
| Other income, net |
— | — | (0.2 | ) | — | — | (0.2 | ) | * | |||||||||||||||||
| Loss from continuing operations before income taxes |
(42.0 | ) | (10.1 | ) | (25.5 | ) | (31.9 | ) | (315.8 | ) | 15.4 | 60.4 | ||||||||||||||
| Income tax (benefit) provision |
(6.3 | ) | 2.1 | (19.5 | ) | 8.4 | * | (21.6 | ) | * | ||||||||||||||||
| Loss from continuing operations |
(35.7 | ) | (12.2 | ) | (6.0 | ) | (23.5 | ) | (192.3 | ) | (6.2 | ) | (103.3 | ) | ||||||||||||
| Loss from discontinued operations, net of income tax provision of $0 and $3.0 |
— | (0.7 | ) | (0.1 | ) | 0.7 | * | (0.6 | ) | * | ||||||||||||||||
| Gain on sale of discontinued operations, net of income tax provision of $0 and $17.7 |
— | 0.8 | 77.2 | (0.8 | ) | * | (76.4 | ) | (99.0 | ) | ||||||||||||||||
| Net (loss) income |
$ | (35.7 | ) | $ | (12.1 | ) | $ | 71.1 | $ | (23.5 | ) | * | $ | (83.2 | ) | * | ||||||||||
| * | Not meaningful |
Our fiscal year is the 52- or 53-week period ending on the last Sunday in December. Our fiscal year 2009 ended on December 27, 2009, fiscal year 2008 ended on December 28, 2008, and fiscal year 2007 ended on December 30, 2007. Each was a 52-week period.
Fiscal Year 2009 Compared to Fiscal Year 2008
Net sales
Net sales decreased by $344.4 million, or 18.6%, to $1,502.6 million for fiscal year 2009 compared to $1,847.0 million for fiscal year 2008. The decrease in net sales reflects a 16.3% decrease in sales volume, a 2.1% decrease resulting from foreign currency fluctuations and a slight decrease in average realized sales price compared to the prior year.
Lower sales volumes resulted from the continued softness in demand across the industry, competition in the marketplace and our strategic initiatives. Approximately half of the decrease in sales volume reflects our decision to de-emphasize specified product categories, such as straws and stirrers, which are high-volume commodity products, and other strategic decisions made during 2008 and 2007 to improve commercial arrangements and to exit certain unfavorable relationships. The other half of the decrease reflects the continuing global economic recession, which resulted in a significant contraction in the market for our products and an increasingly competitive marketplace.
The slight decrease in average realized sales price reflects lower pricing during 2009, as a result of lower raw material costs and consumer demand, which were in part due to the impact of the global economic recession. The impact of lower pricing was partially offset by a favorable shift in our product mix.
16
Table of Contents
Gross profit
Gross profit decreased by $41.4 million, or 16.7%, to $206.4 million for fiscal year 2009 from $247.8 million for fiscal year 2008. Gross profit declined by approximately $80 million as a result of lower sales and production volume for our U.S. operations, by approximately $14 million due to the results of our international subsidiaries, which decline was partially driven by foreign currency fluctuations, and by $4 million in connection with the resolution of a contractual dispute during the first quarter of 2009. The decline in gross profit was partially offset by lower operating costs for our U.S. operations of approximately $32 million, driven by the benefit of a consolidated manufacturing footprint (net of related consolidation costs) and lower distribution costs, and an increase of approximately $25 million in the difference between sales prices and raw material costs for our U.S. operations, mostly realized during the first half of the year due to the lag in timing between the decline in raw material costs and the subsequent decrease in sales prices.
As noted above, gross profit includes costs related to the consolidation of our production facilities, which were approximately $12 million in 2009 and $15 million in 2008. In both years, these consolidation costs included equipment transfers, ramp-down costs at the closing facilities and start-up expenses at the receiving plants. In 2008, the consolidation costs also included severance at the closing facilities.
Gross margin, or gross profit as a percentage of net sales, was 13.7% in 2009 versus 13.4% in 2008. The increase in gross margin was primarily driven by a favorable shift in product mix, and to a lesser extent, an increase in the difference between sales prices and raw material costs.
Selling, general and administrative expenses
Selling, general and administrative expenses decreased $9.5 million, or 6.0%, to $150.1 million in fiscal year 2009 compared to $159.6 million in fiscal year 2008. The decrease primarily reflects an approximately $11.0 million reduction in employee-related costs resulting from cost-savings measures implemented in December 2008 and continuing through 2009, and a reduction of approximately $1.5 million in intangible asset amortization expense. The decrease in selling, general and administrative expenses was partially offset by a $1.6 million increase in management advisory fees paid to SCC Holding Company and Vestar. No fees were incurred in 2008 due to December 2008 amendments to our management agreements. In addition, fiscal year 2008 selling, general and administrative expenses included $3.1 million of earnest money forfeited to us and recognized as a reduction of expense as a result of the termination of a sale agreement related to vacant real estate located in Chicago, Illinois. As a percentage of net sales, selling, general and administrative expenses were 10.0% for fiscal year 2009 versus 8.6% for fiscal year 2008.
Impairment of goodwill
We test goodwill for impairment at least annually, as of the end of October, or sooner if a triggering event occurs that suggests possible impairment of the value of our goodwill. During the third quarter of 2009, despite increasing sales in the first and second quarters and the implementation of programs intended to reduce costs and gain manufacturing efficiencies, our Europe reporting unit continued to incur declining margins and lower operating results. These results were in part due to increased competition, a decline in the European economy and higher input costs, such as resin and electricity, which we were unable to pass along through further price increases. We considered this combination of factors to be evidence of a permanent change in the long-term prospects of our European business. As a result, we became uncertain as to whether our European reporting unit’s estimated fair value was substantially in excess of its carrying value and determined that there was a risk that the reporting unit would fail step one of the impairment test. Accordingly, we concluded that sufficient indicators existed to perform an interim goodwill impairment analysis of our Europe reporting unit. Step one of the impairment test was performed as of September 27, 2009. We estimated the fair value of the reporting unit based on the present value of expected future cash flows, assuming a discount rate of 14% and a terminal value growth rate of 3%, and determined that the fair value was less than the carrying value. We consequently performed step two of the impairment test to calculate the amount of impairment, and concluded that the goodwill of our Europe reporting unit was fully impaired. Accordingly, we recorded a goodwill impairment charge of approximately $17.2 million for the thirteen weeks ended September 27, 2009. After this charge, there is no remaining goodwill on our consolidated balance sheet.
Loss on asset disposals
Loss on asset disposals was $9.0 million for fiscal year 2009 compared to $22.6 million for fiscal year 2008. The 2009 loss reflects the disposal of production equipment in connection with plant closures and consolidation, and includes corrections made during the third and fourth fiscal quarters of 2009 to record approximately $5.8 million of equipment retirements that should have been recorded in prior periods. We determined these adjustments were immaterial to our current and prior period consolidated financial statements. During 2010, we continue to refine the controls related to our asset disposal process. The loss during the prior year period primarily reflects the disposal of non-core assets, including the sale of our dairy packaging machinery and equipment in March 2008.
17
Table of Contents
Interest expense, net
Interest expense, net increased $1.5 million, or 2.4%, to $63.1 million for fiscal year 2009 compared to $61.6 million for fiscal year 2008. Higher interest expense is primarily attributable to higher average interest rates compared to the prior year period due to our refinancing transaction in July 2009, partially offset by lower outstanding debt, mainly due to prepayments of the term loan under our first lien credit facility.
Reclassification of unrealized losses on cash flow hedges to interest expense
We reclassified $9.1 million of unrealized losses on our cash flow hedges to interest expense in connection with our July 2009 refinancing. See further discussion under Liquidity and Capital Resources below. We had previously accounted for our interest rate swap agreements as cash flow hedges of the variable-rate interest payments on our first lien term loan borrowings. Due to the repayment of the term loan under the first lien credit facility as part of the refinancing, the hedged forecasted payments of variable-rate interest under our first lien term loan borrowings were no longer probable of occurring. Accordingly, in June 2009, we discontinued hedge accounting prospectively, and reclassified the cumulative mark-to-market loss of $9.1 million associated with these swaps from accumulated other comprehensive loss to interest expense.
Loss on debt extinguishment
During 2009, we incurred a loss on debt extinguishment of $2.5 million, which represents the write-off of unamortized deferred financing fees related to our first lien credit facility in connection with the extinguishment of that facility in July 2009.
Foreign currency exchange (gain) loss, net
We recognized a foreign currency exchange gain of $2.6 million for fiscal year 2009 compared to a loss of $14.1 million for fiscal year 2008. The loss in 2008 was primarily attributable to unfavorable currency fluctuations affecting our Great Britain pound sterling denominated inter-company debt. During 2008, we amended the inter-company loan agreement to change the maturity from a date certain, as settlement of the loan is not planned or anticipated in the foreseeable future. From the effective date of the amendment, we have reflected the currency fluctuations related to the inter-company loan as a component of equity, within accumulated other comprehensive income (loss).
Income tax (benefit) provision
Income tax benefit was $6.3 million for fiscal year 2009 compared to an income tax provision of $2.1 million for fiscal year 2008. The benefit in 2009 includes a $5.1 million adjustment made during the thirteen weeks ended March 29, 2009 to correct an error in our previously reported deferred tax liabilities. We determined that this adjustment was immaterial to our current and prior period financial statements. If the adjustment had been recorded in the corresponding prior period financial statements, it would have increased (decreased) income tax provision by approximately $0.7 million, $2.4 million and $(8.0) million in fiscal years 2008, 2007 and 2006, respectively, and increased other comprehensive income by $0.2 million in fiscal year 2008.
Excluding the $5.1 million adjustment, the remaining income tax benefit of approximately $1.2 million is reflective of a U.S. tax benefit relating to current year pension activity included in other comprehensive income and the acceleration of taxable temporary differences associated with the goodwill impairment charge related to our Europe reporting unit, partially offset by income tax provision related to our foreign entities. Our fiscal year 2008 provision primarily reflects the income tax provision related to our foreign entities. For our U.S. operations, the tax benefit generated from operating losses was offset by a corresponding increase in the valuation allowance; therefore, we recorded a minimal net U.S. tax expense, primarily for state income taxes.
Fiscal Year 2008 Compared to Fiscal Year 2007
Net sales
Net sales decreased $263.1 million, or 12.5%, to $1,847.0 million for fiscal year 2008 compared to $2,110.1 million for fiscal year 2007. The decrease in net sales reflects a 22.2% decrease in sales volume, partially offset by a 9.7% increase in average realized sales price compared to the prior year. Lower sales volumes are the result of various factors including the divestiture of our uncoated white paper plate product line in September 2007 and our dairy packaging product line in March 2008, as well as our de-emphasis of certain product categories, such as straws and stirrers, all of which are high-volume commodity products. In addition, the decline in sales volume reflects our effort to improve commercial arrangements and to exit certain unfavorable relationships. These initiatives collectively contributed to more than half of the volume decline. The remainder of the decline in sales volume reflects the impact of a competitive marketplace and the weakening North American economies.
The increase in average realized sales price reflects the impact of pricing increases we implemented during the last year in response to higher raw material and energy costs, as well as a shift in product mix.
18
Table of Contents
Gross profit
Gross profit decreased $2.6 million, or 1.0%, to $247.8 million for fiscal year 2008 compared to $250.4 million for fiscal year 2007. Gross margin, or gross profit as a percentage of net sales, was 13.4% in 2008 versus 11.9% in 2007. The decrease in gross profit was primarily driven by higher raw material costs, lower sales volumes, the impact of lower production volumes on our fixed cost absorption, costs incurred during 2008 to consolidate production facilities, including severance costs and equipment transfers, and higher diesel fuel costs compared with the prior year. These factors were partially offset by a higher average realized selling price, driven by a shift in product mix, efficiency improvements resulting from ongoing productivity initiatives and, to a lesser extent, lower professional fees, which in 2007 related to our performance improvement plan.
The increase in gross margin reflects the impact from the divestiture of non-core product lines, manufacturing efficiency gains, improved commercial arrangements and the de-emphasis of low margin products.
Selling, general and administrative expenses
Selling, general and administrative expenses decreased $44.0 million, or 21.6%, to $159.6 million in fiscal year 2008 compared to $203.6 million in fiscal year 2007. The decrease primarily reflects (i) $14.9 million of costs incurred during the 2007 period for professional fees related to our performance improvement plan and the implementation of our new order management system, (ii) a $12.3 million decrease in incentive-based compensation costs, (iii) lower intangible asset amortization expense of $5.0 million, (iv) $0.6 million of asset impairment charges in 2008 compared to $5.6 million in 2007, (v) a $3.3 million reduction in management advisory fees, and (vi) $3.1 million of earnest money forfeited to us and recognized in 2008 as a reduction of expense as a result of the termination of a sale of vacant real estate located in Chicago, Illinois. As a percentage of net sales, selling, general and administrative expenses were 8.6% for fiscal year 2008 versus 9.6% for fiscal year 2007.
Loss (gain) on asset disposals
Loss on asset disposals was $22.6 million in fiscal year 2008 compared to a gain on asset disposals of $8.5 million in fiscal year 2007. The current year loss reflects the disposal of production equipment retired as a result of plant closures and consolidation, as well as the disposal of non-core assets including the sale of our dairy packaging machinery and equipment in March 2008. The gain in 2007 primarily relates to the sale of our uncoated white paper plate product line in September 2007.
Interest expense, net
Interest expense, net decreased $18.2 million, or 22.8%, to $61.6 million for fiscal year 2008 compared to $79.8 million for fiscal year 2007. Lower interest expense is primarily attributable to lower outstanding term debt, mainly due to the June 2007 retirement of the $130.0 million second lien term loan from the net proceeds of our June 2007 sale-leaseback transaction. In addition, lower interest expense is a result of lower average interest rates compared to the prior year period and decreased utilization of the revolving credit facility under the first lien credit facility, due to improved operating cash flow and non-core asset sales.
Foreign currency exchange loss (gain), net
Foreign currency exchange loss (gain), net was a loss of $14.1 million for fiscal year 2008 compared to a gain of $4.1 million for fiscal year 2007. This change is primarily attributable to unfavorable currency fluctuations in 2008 in the Great Britain pound sterling denominated inter-company debt.
Prepayment penalty and loss on debt extinguishment
During 2007, we incurred a prepayment penalty of $1.3 million and a loss on debt extinguishment of $4.0 million as a result of the early extinguishment of the second lien term loan. The loss on debt extinguishment represents the write off of unamortized deferred financing fees resulting from the extinguishment of the second lien term loan.
Income tax provision (benefit)
Income tax provision was $2.1 million in fiscal year 2008 compared to an income tax benefit of $19.5 million in fiscal year 2007. The provision in fiscal year 2008 primarily reflects the income tax provision related to our foreign entities. For our U.S. operations, the tax benefit generated from operating losses was offset by a corresponding increase in the valuation allowance; therefore, a minimal net U.S. tax expense was recognized primarily for state income taxes. The benefit in fiscal year 2007 includes a reduction in deferred tax liabilities no longer expected to reverse beyond the carryforward period of the net operating loss, due to the income acceleration from the sale leaseback transaction. This income tax benefit was partially offset by income tax provision primarily related to our foreign jurisdictions.
19
Table of Contents
Liquidity and Capital Resources
Operating Cash Flows
We rely on cash flows from operations and borrowings under our asset-based revolving and Canadian credit facilities to finance our working capital requirements. Net cash provided by operating activities for continuing operations during 2009 was $137.9 million compared to $132.6 million during 2008. The increased cash flows from operations resulted primarily from a greater reduction in working capital during 2009 than 2008, net of lower income. Working capital decreased $95.6 million to $250.9 million at December 27, 2009 from $346.5 million at December 28, 2008. The decrease in working capital primarily reflects lower inventory balances, driven by our focus to reduce inventory levels to align more closely with lower forecasted demand and reduced raw material costs.
Investing Cash Flows
Net cash used in investing activities for continuing operations during 2009 was $65.6 million compared to $68.4 million during 2008. Capital expenditures for our continuing operations during 2009 were $71.8 million compared to $79.7 million during 2008. We funded our capital expenditures in both years with cash flows from operations.
During 2009, investing cash inflows of $16.6 million were mainly proceeds from the September 2009 sale of a distribution center, which we had closed in the fourth quarter of 2008, and the July 2009 sale of a manufacturing plant, which we closed during the fourth quarter of 2007. During 2008, the sale of property, plant and equipment provided investing cash flows of $10.5 million, primarily as a result of the sale of dairy packaging machinery and equipment and of a manufacturing facility that we closed during the first quarter of 2008.
The $10.4 million increase in restricted cash in 2009 represents collateral that the counterparty to our interest rate swaps required us to post against the current market value of the swaps. Our obligation to post collateral will continue through the expiration date of the swaps in February 2011. The amount of collateral that must remain on account with the counterparty will fluctuate based on future changes in the estimated fair value of the swaps.
Financing Cash Flows
Net cash used in financing activities for continuing operations during 2009 was $101.1 million compared to $40.3 million during 2008. The net cash outflows in 2009 resulted primarily from the prepayment of $105.0 million of principal on the term loan under our first lien credit facility that we made from cash on hand at the beginning of the year and cash flows generated from operations during the first half of the year. In addition, the net proceeds we received in July 2009 from the issuance of our 10.5% senior secured notes of approximately $293.8 million (net of approximately $6.2 million of original issue discount) and initial borrowings under our asset-based revolving credit facility of approximately $28.3 million were used to repay the outstanding borrowings and accrued interest due on our first lien credit facility and debt issuance costs for the senior secured notes and asset-based revolving credit facility.
The following is a summary of long-term debt at December 27, 2009 and December 28, 2008 (in thousands):
| December 27, 2009 | December 28, 2008 | ||||||
| Long-term debt: |
|||||||
| 10.5% Senior Secured Notes due 2013 |
$ | 300,000 | $ | — | |||
| Unamortized discount |
(5,703 | ) | — | ||||
| 10.5% Senior Secured Notes due 2013, net |
294,297 | — | |||||
| 8.5% Senior Subordinated Notes due 2014 |
325,000 | 325,000 | |||||
| Asset-based Revolving Credit Facility |
15,000 | — | |||||
| First Lien Credit Facility – Term Loan |
— | 361,954 | |||||
| First Lien Credit Facility – Revolver |
— | 28,000 | |||||
| Canadian Credit Facility – Term Loan |
404 | 1,532 | |||||
| Capital lease obligations |
1,388 | 1,704 | |||||
| Total long-term debt |
636,089 | 718,190 | |||||
| Less: Current maturities of long-term debt |
779 | 1,368 | |||||
| Long-term debt, net of current maturities |
$ | 635,310 | $ | 716,822 | |||
20
Table of Contents
Refinancing Transactions
On July 2, 2009, we issued $300.0 million of 10.5% Senior Secured Notes due 2013, which we refer to as the senior secured notes, and entered into a new asset-based revolving credit facility providing for borrowings of up to $200.0 million, subject to borrowing base limitations and other specified terms and conditions. We used the initial borrowings under our asset-based revolving credit facility of $28.3 million, together with the net proceeds of $293.8 million from the issuance of our senior secured notes to (1) repay the $300.9 million of borrowings outstanding, including accrued interest thereon, under our first lien credit facility, (2) pay $17.3 million of debt issuance costs relating to the senior secured notes and asset-based revolving credit facility, and (3) provide $3.9 million for operating needs. We deferred the debt issuance costs and will amortize them through 2013, when the senior secured notes and borrowings under the asset-based revolving credit facility mature.
In connection with the refinancing transactions, we reclassified $9.1 million of unrealized losses associated with existing interest rate swap agreements from accumulated other comprehensive loss to interest expense in July 2009. These interest rate swap agreements have a total notional amount of $150.0 million. Under the agreements, we receive a variable amount based on the Eurodollar rate and pay a fixed amount based on an interest rate of 5.3765%. The swap agreements, which became effective on August 28, 2007, expire on February 28, 2011.
We also wrote off the remaining $2.5 million of unamortized debt issuance costs related to the first lien credit facility in July 2009 as a result of the refinancing.
Available Capacity
The following is a summary of our committed revolving credit facilities at December 27, 2009 (in thousands):
| Commitment Amount |
Amounts Outstanding |
Letters of Credit (1) |
Available Capacity | |||||||||
| Asset-based revolving credit facility (2) |
$ | 200,000 | $ | 15,000 | $ | 12,470 | $ | 123,409 | ||||
| Canadian credit facility (revolving facility) (3) |
15,713 | — | — | 10,459 | ||||||||
| $ | 215,713 | $ | 15,000 | $ | 12,470 | $ | 133,868 | |||||
| (1) | Availability under the credit facilities is reduced by letters of credit issued under the facilities. |
| (2) | The commitment amount for the asset-based revolving credit facility is $200.0 million; however, available capacity is $123.4 million due to the borrowing base limit of $150.9 million in effect at December 27, 2009. |
| (3) | The commitment amount for the Canadian revolving credit facility is CAD 16.5 million (approximately $15.7 million); however, available capacity is CAD 11.0 million (approximately $10.5 million) due to borrowing base limitations. |
10.5 % Senior Secured Notes
Solo Delaware and Solo Cup Operating Corporation co-issued the senior secured notes under an indenture, dated as of July 2, 2009, with SF Holdings Group, Inc., Solo Manufacturing LLC, P. R. Solo Cup, Inc., Solo Cup Owings Mills Holdings, Lily-Canada Holding Corporation, Solo Cup (UK) Limited, Insulpak Holdings Limited and Solo Cup Europe Limited, as guarantors, and U.S. Bank National Association, as trustee.
The senior secured notes mature on November 1, 2013 and bear interest at a rate of 10.5% per annum. Interest on the senior secured notes is payable semi-annually on May 1 and November 1 of each year. We made our first interest payment on November 1, 2009. The senior secured notes were issued at 97.928% of their aggregate principal amount for gross proceeds of $293.8 million, representing a yield to maturity of 11.125%.
Guarantees and security - The obligations of Solo Delaware and Solo Cup Operating Corporation under the senior secured notes are fully and unconditionally guaranteed, jointly and severally, by the existing guarantors under the indenture and will be so guaranteed by any future domestic subsidiaries of Solo Delaware, subject to specified exceptions. The senior secured notes and related guarantees are secured by a senior lien on substantially all of the assets (other than accounts receivable, specified payment intangibles, inventory, deposit accounts, commodity accounts, securities accounts, lock-boxes, instruments, chattel paper, cash and cash equivalents, general intangibles related to any of the foregoing, proceeds and products of the foregoing and specified assets related thereto, and specifically excluded assets) of the co-issuers and guarantors and by a junior lien on the accounts receivable and other assets identified above that are not subject to the senior lien.
21
Table of Contents
Redemption options
At any time prior to May 1, 2011, we may, on one or more than one occasion, redeem some or all of the senior secured notes at any time at a redemption price equal to 100% of the principal amount of the senior secured notes redeemed, plus a “make-whole” premium as of, and any accrued and unpaid interest to, the applicable redemption date.
In addition, at any time prior to May 1, 2011, we also may redeem up to 35% of the aggregate principal amount of senior secured notes, using the proceeds of qualifying equity offerings, at a redemption price of 110.5% of the principal amount of the notes redeemed and may, not more than once in any 12-month period, redeem up to 10% of the original aggregate principal amount of the senior secured notes at a redemption price of 103%, in each case, plus any accrued and unpaid interest to the applicable redemption date.
On or after May 1, 2011, we may redeem all or a part of the senior secured notes at a redemption price equal to a percentage of the principal amount thereof, plus any accrued and unpaid interest, as follows:
| Period |
Redemption price | ||
| For the twelve-month period beginning May 1, 2011 |
105.250 | % | |
| May 1, 2012 and thereafter |
100.000 | % |
Requirements to repurchase - If specified change of control events occur, we must offer to repurchase the senior secured notes at a repurchase price equal to 101% of the principal amount of the senior secured notes repurchased, plus any accrued and unpaid interest to the applicable repurchase date. If we sell assets under specified circumstances, we must offer to repurchase the senior secured notes at a repurchase price equal to 100% of the principal amount of the senior secured notes repurchased, plus any accrued and unpaid interest to the applicable repurchase date.
Covenants - The indenture for our senior secured notes contains covenants that, among other things, restrict the ability of Solo Delaware, Solo Cup Operating Corporation and their restricted subsidiaries to:
| • | incur additional debt or issue disqualified stock or preferred stock; |
| • | create liens; |
| • | pay dividends, make investments or make other restricted payments; |
| • | sell assets; |
| • | consolidate, merge, sell or otherwise dispose of all or substantially all of the assets of Solo Delaware and its restricted subsidiaries; |
| • | enter into transactions with affiliates; |
| • | designate subsidiaries as unrestricted; and |
| • | undertake specified other business activities. |
These covenants are subject to a number of important limitations and exceptions.
Events of default - The indenture for our senior secured notes provides for customary events of default, including without limitation, cross defaults to specified other debt of Solo Delaware and its subsidiaries. In the case of an event of default arising from specified events of bankruptcy or insolvency, all outstanding notes will become due and payable immediately without further action or notice. If any other event of default under the indenture occurs and is continuing, the trustee or holders of at least 25% in principal amount of the then-outstanding senior secured notes may declare all of the senior secured notes to be due and payable immediately, provided that, if any debt is outstanding under the asset-based revolving credit facility, the acceleration of the senior secured notes will not be effective until the earlier of the acceleration of debt under the asset-based revolving credit facility or five business days after receipt by the issuers and the administrative agent under the related loan agreement of notice of the acceleration.
Asset-Based Revolving Credit Facility
On July 2, 2009, we entered into a loan agreement, with Bank of America, N.A., as administrative agent, co-collateral agent and lender; General Electric Capital Corporation, as co-collateral agent and lender; and Wells Fargo Foothill, LLC and Goldman Sachs Lending Partners LLC, as lenders, providing for revolving credit financing of up to $200.0 million, including a $40.0 million sub-limit for letters of credit, with a maturity date of July 2, 2013.
Guarantors - Subject to specified exceptions, newly-created or acquired direct and indirect domestic subsidiaries of Solo Delaware will be required to become guarantors under the asset-based revolving credit facility. The term “domestic subsidiaries,” as used in this description, includes, in addition to U.S. subsidiaries, non-U.S. subsidiaries (including the Company’s current subsidiaries located in the United Kingdom) other than controlled foreign corporations (as such term is defined under the Internal Revenue Code of 1986, as amended) and subsidiaries of controlled foreign corporations.
22
Table of Contents
Borrowing base and availability - Our ability to borrow under the asset-based revolving credit facility is limited to a borrowing base equal to 85% of eligible accounts receivable plus the lower of (1) 65% of eligible inventory and (2) 85% of the net orderly liquidation value of eligible inventory minus availability reserves, and is subject to other conditions, limitations and reserve requirements.
Under the asset-based revolving credit facility, we have the right to increase the aggregate principal amount of the commitments from time to time, in an aggregate amount not to exceed $100.0 million, without the consent of any lender (other than the lenders participating in such increase), so long as any such increase is at least $25.0 million, subject to borrowing base limitations and other specified terms and conditions.
Security - We are jointly and severally liable for all obligations under the asset-based revolving credit facility and under certain hedging arrangements and bank product and cash management services provided by the asset-based revolving credit facility lenders or their affiliates to us, and such obligations will be guaranteed by the direct and indirect domestic subsidiaries of Solo Delaware that are not borrowers, subject to specified exceptions. These obligations will be secured by:
| • | senior liens on the following assets of the asset-based revolving credit facility borrowers and guarantors, referred to as ABL Collateral: their accounts receivable, specified payment intangibles, inventory, deposit accounts, commodity accounts, securities accounts, lock-boxes, instruments, chattel paper, cash and cash equivalents, general intangibles related to any of the foregoing and proceeds and products of the foregoing and certain assets related thereto, subject to specified exceptions; and |
| • | junior liens on the following assets of the asset-based revolving credit facility borrowers and guarantors, referred to as Notes Collateral, which are subject to senior liens in favor of holders of the senior secured notes and Solo Cup Operating Corporation: substantially all of their tangible and intangible assets, other than ABL Collateral and specified excluded assets. |
Interest - Interest accrues on outstanding borrowings under the asset-based revolving credit facility at a rate of either LIBOR (as defined in the asset-based revolving credit facility) plus a margin of 4% per annum, or a specified base rate plus a margin of 3% per annum, at our option. These interest rate margins are subject to adjustment after July 2, 2010 based on borrowing base availability. Letters of credit issued and outstanding under the asset-based revolving credit facility accrue fees at a per annum rate equal to the LIBOR interest rate margin described above plus a 0.125% per annum fronting fee to the issuing bank on the face amount thereof, in addition to the issuing bank’s customary fees and charges in connection with the issuance, amendment, negotiation, payment, processing, transfer and administration of such letters of credit. An unused line fee of 0.75% per annum accrues on an amount equal to (1) the aggregate lending commitments under the asset-based revolving credit facility less (2) the average daily amount of the outstanding borrowings plus the face amount of any outstanding letters of credit under the asset-based revolving credit facility.
Covenants - The asset-based revolving credit facility contains customary affirmative and negative covenants, including covenants that restrict the ability of each borrower, each guarantor and each subsidiary of the foregoing to, among other things:
| • | incur, assume, guarantee or suffer to exist additional debt or liens; |
| • | make investments or loans or acquire any person or entity; |
| • | enter into transactions with affiliates; |
| • | enter into certain restrictive agreements; |
| • | engage in mergers, acquisitions, consolidations and asset sales; |
| • | prepay, redeem, purchase, defease or otherwise satisfy specified types of debt; |
| • | modify the terms of other debt; and |
| • | declare, pay or make distributions or dividends. |
These covenants are subject to a number of important limitations and exceptions.
In addition, the asset-based revolving credit facility contains a springing covenant that is not currently applicable to us. In the event our available capacity under the facility drops below a specified threshold (the greater of (a) $15,000,000 or (b) 15% of the lesser of our borrowing base or the aggregate amount of commitments under the facility), all cash receipts would be controlled by our lenders and used to pay down outstanding borrowings under the facility. In addition, we would be required to maintain a minimum Fixed Charge Coverage Ratio (as defined in the facility) of 1.1 to 1 for a trailing twelve-month period. The lenders would maintain control over our receipts and the minimum Fixed Charge Coverage Ratio requirement would remain in effect until such time that our available capacity rises to a level that equals or exceeds the above specified threshold for 45 consecutive days.
23
Table of Contents
Events of default - The loan agreement underlying our asset-based revolving credit facility contains customary events of default, including, but not limited to, cross defaults to specified other debt of Solo Delaware and its subsidiaries, and specified change of control events. Failure to maintain the minimum Fixed Charge Coverage Ratio, if applicable in the future as discussed in the immediately preceding paragraph, would also constitute an event of default. If an event of default occurs and is continuing under the loan agreement, the lenders may, among other things, terminate their commitments and require immediate repayment of all amounts owed by the borrowers and the guarantors under the asset-based revolving credit facility.
8.5% Senior Subordinated Notes
On February 27, 2004, we issued $325.0 million of 8.5% Senior Subordinated Notes due 2014, which we refer to as the senior subordinated notes. The senior subordinated notes mature on February 15, 2014 and bear interest at a rate of 8.5% per annum. Interest on the senior subordinated notes is payable semi-annually every February 15 and August 15. We have made all scheduled interest payments to date. Under the indenture governing the senior subordinated notes, subject to exceptions, we must meet a minimum fixed charge coverage ratio to incur additional debt. The senior subordinated notes were not redeemable until February 15, 2009. Starting on that date, we have the option to redeem all or a portion of the senior subordinated notes at a redemption price equal to a percentage of the principal amount thereof plus accrued interest as follows:
| Period |
Redemption price | ||
| For the twelve-month period beginning February 15, 2009 |
104.250 | % | |
| For the twelve-month period beginning February 15, 2010 |
102.833 | % | |
| For the twelve-month period beginning February 15, 2011 |
101.417 | % | |
| February 16, 2012 and thereafter |
100.000 | % |
The senior subordinated notes provide that upon the occurrence of a change in control, as defined, the holders will have an option to require the redemption of the senior subordinated notes at a redemption price equal to 101% of the principal amount thereof plus accrued interest. The indenture governing the senior subordinated notes contains various covenants which, subject to exception, prohibit, or limit, among other things:
| • | asset sales; |
| • | changes of control; |
| • | dividend payments; |
| • | equity repurchases or redemptions; |
| • | the incurrence of additional debt; |
| • | the issuance of disqualified stock; |
| • | certain transactions with affiliates; |
| • | the creation of additional liens; and |
| • | certain other business activities. |
From time to time, and in accordance with any applicable securities laws, Solo Delaware’s principal shareholders or their affiliates may enter the market to purchase or sell senior subordinated notes or senior secured notes.
Canadian Credit Facility
On September 24, 2004, Solo Cup Canada Inc., a Canadian subsidiary of Solo Delaware, entered into a credit agreement with GE Canada Finance Holding Company. The credit agreement was subsequently amended by an agreement dated as of October 19, 2006 and by a second amendment dated as of November 16, 2007. The Canadian credit facility expires September 29, 2011. The maximum amount available under the facility, subject to borrowing base limitations, is CAD 30.0 million (approximately $28.6 million), with a term facility maximum of CAD 17.5 million (approximately $16.7 million) and a revolving credit facility maximum of CAD 12.5 million (approximately $11.9 million) that increases to CAD 16.5 million (approximately $15.7 million), on a dollar for dollar basis, as the term loan’s outstanding balance is reduced.
Solo Cup Canada may use the proceeds from the facilities or cash on hand to make investments in its affiliates or in businesses that are substantially similar to Solo Cup Canada up to a maximum of CAD 10.0 million (approximately $9.5 million). Solo Cup Canada may also make a one-time capital expenditure of CAD 6.0 million (approximately $5.7 million) to provide for increased manufacturing capacity. The minimum fixed charge ratio under the facility is 1.25:1 on a rolling twelve-month basis.
24
Table of Contents
The second amendment provided, among other things, that Solo Cup Canada may issue letters of credit, subject to certain conditions, for up to CAD 11.0 million (approximately $10.5 million) and that up to CAD 10.0 million (approximately $9.5 million) of the CAD 11.0 million (approximately $10.5 million) limit may be issued on Solo Cup Canada’s account on behalf of Solo Delaware to beneficiaries identified by Solo Delaware.
Applicable interest rates under the revolving and term loan facility are the Canadian prime rate plus 0.25%, or the Canadian bankers’ acceptance rate plus 1.5%, at Solo Cup Canada’s option. At December 27, 2009, there was no balance outstanding on the revolving facility, the term loan balance was CAD 0.4 million (approximately $0.4 million) and carried an effective interest rate of approximately 1.90%.
Contractual obligations
The following table summarizes our contractual obligations as of December 27, 2009, and the effect such obligations are expected to have on our liquidity and cash flows in future periods (in thousands):
| Payments due in fiscal year | |||||||||||||||||||||
| Total | 2010 (2) | 2011 | 2012 | 2013 | 2014 | Thereafter | |||||||||||||||
| Long-term debt obligations |
$ | 640,404 | $ | 404 | $ | — | $ | — | $ | 315,000 | $ | 325,000 | $ | — | |||||||
| Capital lease obligations (1) |
1,578 | 351 | 339 | 323 | 323 | 242 | — | ||||||||||||||
| Non-cancelable operating leases |
560,781 | 46,144 | 42,606 | 40,884 | 39,333 | 37,634 | 354,180 | ||||||||||||||
| Interest payments (3) |
259,063 | 61,888 | 61,888 | 61,888 | 59,586 | 13,813 | — | ||||||||||||||
| Total |
$ | 1,461,826 | $ | 108,787 | $ | 104,833 | $ | 103,095 | $ | 414,242 | $ | 376,689 | $ | 354,180 | |||||||
| (1) | We have capital leases of approximately GBP 0.9 million (approximately $1.4 million). Amounts in the table above also include the interest obligation attributable to these leases. |
| (2) | We expect that our contributions in 2010 to our defined benefit plans will be approximately $8 million, which are not included in the contractual obligations table above. |
| (3) | In estimating future interest payments for 2010-2013, we used interest rates in effect as of December 27, 2009 and used our average outstanding borrowings under the asset-based revolving credit facility during 2009 as the estimate of future years’ average outstanding borrowings. |
The above table excludes the liability for unrecognized tax benefits as these are not contractual obligations by nature. We cannot determine with any degree of reliability the years in which these liabilities might ultimately settle.
Government Obligations
We are subject to agreements with the City of Chicago and the State of Illinois relating to our 2001 acquisition of certain property located in Chicago, Illinois. Pursuant to these agreements, the City of Chicago paid a portion of the 2001 purchase price on our behalf in the form of cash and the issuance of a note. The State of Illinois also provided a grant to us. Under these agreements, we are required to fulfill certain obligations relating to development of the property and retention of a certain number of employees. Our intention is no longer to develop the property, but rather to sell the property. We expect that these obligations will either transfer to a new owner or be repaid from the proceeds of a sale. The obligations total approximately $16.2 million, of which approximately $3.0 million is interest bearing, and are included in other current liabilities in the accompanying consolidated balance sheets.
In the first quarter of 2007, we entered into a purchase and sale agreement to sell the property. The agreement provided that, upon the closing of the sale, our obligations to the State of Illinois and City of Chicago would be satisfied or we would otherwise be released from such obligations. The agreement was terminated in December 2008 without a sale of the property. See related discussion of the accounting for these government obligations in Note 18 to our consolidated financial statements included in Item 8 of this annual report.
2010 Outlook
Management believes that cash generated by operations and amounts available under our credit facilities should be sufficient to meet our expected operating needs, planned capital expenditures, payments in conjunction with our lease commitments and debt service requirements during 2010. We expect that our total 2010 capital expenditures will be approximately $80 million. In addition, we expect contributions to our defined benefit plans will be approximately $8 million.
For 2010, we expect raw material and energy costs to be elevated when compared to 2009. Crude oil is expected to be modestly volatile depending on the U.S. dollar valuation against other currencies as well as the ability of world economies to recover from the recession. We currently expect resin input prices to be volatile early in the year, stabilizing in the second half of the year; however, severe supply disruptions of resin feedstocks due to natural disasters, severe weather or outages could further negatively impact this outlook. Paper prices are expected to rise in the second half of 2010 with the timing dependent on the order backlog at the suppliers.
25
Table of Contents
Off-balance sheet arrangements
We have letters of credit that are obtained to ensure performance and payment to third parties in accordance with specified terms and conditions. Under the asset-based revolving credit facility, we have the ability to issue up to $40.0 million in letters of credit, and all issued letters of credit are secured by the asset-based revolving credit facility. As of December 27, 2009, approximately $12.5 million of standby letters of credit were outstanding. These standby letters of credit are used to support our workers’ compensation insurance programs. We are not required to provide cash collateral for letters of credit issued.
In June 2007, we entered into a lease agreement in conjunction with the sale of six of our manufacturing facilities. The sale proceeds of $130.0 million were used to retire our term loan under our senior secured second lien credit facility. Upon the sale of the six properties, we immediately leased them back pursuant to a 20-year term lease. The lease contains four five-year renewal term options and is non-cancelable. Rent for the six properties is payable on a quarterly basis, due on the first day of each calendar quarter, with an annual 2% escalation. Annual rent expense of $14.2 million is recognized on a straight-line basis over the 20-year term of the lease. Payments during fiscal years 2009 and 2008 were $9.1 million and $11.8 million, respectively. We made the fourth quarterly payment in 2009 of approximately $3.0 million subsequent to December 27, 2009, our fiscal year end. The lease is classified as an operating lease in accordance with FASB ASC Topic 840, Leases.
Net Operating Loss Carryforwards
As of December 27, 2009, we had approximately $263.8 million of U.S. federal tax net operating loss carryforwards that expire between 2024 and 2029. There are no carryforwards subject to the provisions of Internal Revenue Code Section 382. During 2006, we assessed the realizability of deferred tax assets, including our net operating loss carryforwards, and concluded that it was more likely than not that we would not fully realize the benefits of our existing deferred tax assets. Accordingly, we increased our valuation allowance by $119.6 million. During 2009 and 2008, the valuation allowance increased by $11.6 million and $14.8 million, respectively, all of which was related to activity from our U.S. continuing operations. The ultimate realization of deferred tax assets is dependent upon the generation of future taxable income during the periods in which those temporary differences become deductible.
Critical Accounting Estimates
In preparing our consolidated financial statements in conformity with accounting principles generally accepted in the United States, we must make decisions that impact the reported amounts of assets, liabilities, revenues and expenses, and related disclosures. Such decisions include the selection of the appropriate accounting principles to be applied and the assumptions on which to base accounting estimates. In reaching such decisions, we apply judgments based on our understanding and analysis of the relevant circumstances, current developments and historical experience. Actual amounts could differ from those estimated at the time the consolidated financial statements are prepared. Management has discussed the development and selection of these critical accounting estimates with the Audit Committee of the Board of Directors and they have reviewed this disclosure.
Our significant accounting policies are described in Note 2 to the consolidated financial statements in Item 8 of this annual report. Some of these significant accounting policies require us to make difficult, subjective or complex judgments or estimates. An accounting estimate is considered to be critical if it meets both of the following criteria: (i) the estimate requires assumptions about matters that are highly uncertain at the time the accounting estimate is made and (ii) different estimates reasonably could have been used or changes in the estimate that are reasonably likely to occur from period to period would have a material impact on the presentation of our financial condition, changes in financial condition or results of operations. Our critical accounting estimates include the following:
Accounts receivable valuation. We value accounts receivable, net of an allowance for doubtful accounts. Each quarter, we estimate our ability to collect outstanding receivables and establish an allowance for doubtful accounts that reflects our best estimate of the amount of probable credit losses in our existing accounts receivable. In doing so, we evaluate the age of our receivables, past collection history, current financial condition of key customers and economic conditions. Based on this evaluation, we establish a reserve for specific accounts receivable that we believe are uncollectible, as well as an estimate of uncollectible receivables not specifically known. Our estimate of the allowance for doubtful accounts is a critical accounting estimate because it is highly susceptible to change from period to period. In addition, it requires management to make judgments about the future financial condition of our customers.
Deterioration in the financial condition of any key customer or a significant slowdown in the economy could have a material negative impact on our ability to collect a portion or all of the accounts receivable. We believe that analysis of historical trends and current knowledge of potential collection problems provides us with sufficient information to establish a reasonable estimate of an allowance for doubtful accounts. However, since we cannot predict with certainty future changes in the financial stability of our customers, our actual future losses from uncollectible accounts may differ from our estimates. In the event we determine that a smaller or larger balance of the allowance for uncollectible accounts was appropriate, we would record a credit or charge to selling, general and administrative expenses in the period in which we made such a determination.
26
Table of Contents
Customer discounts and allowances. We provide allowances for estimated returns and customer incentive programs when the revenue is recognized, based on historical experience, current trends and any notification of pending returns. The customer allowances are, in many instances, subjective and are determined with significant management judgment and reviewed regularly to determine the adequacy of the amounts. Changes in economic conditions, markets and customer relationships may require adjustments to these allowances from period to period. In the event that future trends vary significantly from past or expected trends, our reported net sales may increase or decrease by a material amount.
Certain customer discounts and allowances are earned and payable to customers if a specified level of sales volume is met. We record such customer discounts and allowances based on the estimated and probable allowances for the period. The amounts are recorded as a reduction of net sales based on the actual customers’ sales volume during the period. If actual allowances differ from management estimates, gross margin and operating income could be affected. The most significant allowance reflects our estimates of discounts that certain foodservice customers are entitled to claim based on their distribution activities. Our calculation is based on historical trends of both the discount amounts claimed and length of time between our sale of the product and the customer’s claim.
Vendor incentives. Certain vendor incentives are earned only if a specified level of annual purchases is achieved. We record such incentives during the interim periods based on the actual results achieved on a year-to-date basis compared to targets or specified levels of purchases. The amounts are recorded as a reduction of cost of goods sold based on the purchase volume during the interim period. If actual purchase volume differs from management estimates, gross margin and operating income could be affected.
Inventory reserves. We establish reserves for our inventory to reflect those conditions when the cost of the inventory is not expected to be recovered. We review such circumstances when products are not expected to be saleable based on criteria established by our supply chain organization and estimates based on historical experience. The reserve for these products is equal to all or a portion of the cost of the inventory based on the specific facts and circumstances. We monitor inventory levels on a regular basis and record changes in inventory reserves as part of cost of goods sold.
Impairment of long-lived assets. We test property for recoverability whenever events or changes in circumstances indicate that its carrying value may not be recoverable. Such events include, but are not limited to, significant adverse changes in the business climate, the impact of significant customer losses, current period operating or cash flow losses, forecasted continuing losses, or a current expectation that an asset or asset group will be disposed of before the end of its useful life, for example, as a result of a decision to exit a product line or close a manufacturing facility. Recoverability of property is evaluated by a comparison of the carrying amount of an asset or asset group to future net undiscounted cash flows expected to be generated by the asset or asset group. If these comparisons indicate that an asset is not recoverable, the impairment loss recognized is the amount by which the carrying amount of the asset exceeds the estimated fair value. When an impairment loss is recognized for assets to be held and used, the adjusted carrying amount of those assets is depreciated over its remaining useful life. Restoration of a previously recognized impairment loss is not allowed. There are inherent uncertainties associated with these judgments and estimates relating to long-lived assets.
Income taxes. We account for income taxes in accordance with the asset and liability method under FASB ASC Topic 740, Income Taxes. Deferred income tax assets and liabilities are recognized for the future tax consequences attributed to differences between the financial statement and income tax bases of assets and liabilities and tax credit and operating loss carryforwards using enacted tax rates expected to apply to taxable income in the years in which the differences are expected to be recovered or settled. The effect on deferred income tax assets and liabilities of a change in tax rates is recognized in income in the period that includes the enactment date. The recoverability of deferred tax assets is dependent upon our assessment of whether it is more likely than not that sufficient future taxable income will be generated in the relevant tax jurisdiction to utilize the deferred tax asset. In evaluating our ability to recover our deferred tax assets, in full or in part, we consider all available positive and negative evidence including our past operating results, the existence of cumulative losses in the most recent fiscal years, and our forecast of future taxable income on a jurisdiction by jurisdiction basis. In determining future taxable income, we review the reversal of temporary differences and the implementation of feasible and prudent tax planning strategies. In the event we determine that our future taxable income will not be sufficient to utilize our deferred tax assets, a valuation allowance is recorded. If that assessment changes, a charge or a benefit would be recorded in our statement of operations. We currently do not believe that we will fully realize the benefit of our deferred tax assets in the United States, except for the reversal of deferred tax liabilities, and therefore we have a full valuation allowance against these deferred tax assets.
27
Table of Contents
Impact of Recently Issued Accounting Standards
In July 2009, the Financial Accounting Standards Board (“FASB”) issued Statement of Financial Accounting Standards No. 168, The FASB Accounting Standards Codification and the Hierarchy of Generally Accepted Accounting Principles – a replacement of FASB Statement No. 162. Pursuant to the statement, the FASB Accounting Standards Codification (“ASC”) officially became the single source of authoritative nongovernmental GAAP, superseding existing FASB, American Institute of Certified Public Accountants, Emerging Issues Task Force and related accounting literature. After July 1, 2009, only one level of authoritative GAAP exists. All other accounting literature is considered non-authoritative. The FASB ASC reorganized the thousands of GAAP pronouncements into approximately 90 accounting topics and displays them using a consistent structure. Also included in the FASB ASC is relevant SEC guidance organized using the same topical structure in separate sections. The statement is effective for interim and annual periods ending after September 15, 2009. In accordance with this statement, all references to authoritative accounting literature within our financial statement disclosures are references to the FASB ASC.
| Item 7a. | Quantitative and Qualitative Disclosures About Market Risk. |
In the ordinary course of business, we are exposed to market risk-sensitive instruments, which consist primarily of our variable interest rate debt. On July 2, 2009, we extinguished our first lien credit facility with the net proceeds from the issuance of $300.0 million of 10.5% senior secured notes and initial borrowings of $28.3 million under a new asset-based revolving credit facility.
Interest accrues on outstanding borrowings under the asset-based revolving credit facility at a rate of either LIBOR (as defined in the asset-based revolving credit facility) plus a margin of 4% per annum, or a specified base rate plus a margin of 3% per annum, at our option. These interest rate margins are subject to adjustment after July 2, 2010 based on borrowing base availability. As of December 27, 2009, the asset-based revolving credit facility had an outstanding balance of $15.0 million and carried an effective interest rate of 6.25%.
As of December 27, 2009, we also have a Canadian credit facility which includes revolving and term credit facilities. The Canadian revolving and term loan facilities bear interest at the Canadian prime rate plus 0.25% or the Canadian bankers’ acceptance rate plus 1.50%, at our option. As of December 27, 2009, outstanding borrowings under the term loan carried an effective interest rate of 1.90% and the outstanding debt under the term loan was CAD 0.4 million (approximately $0.4 million). CAD 11.0 million (approximately $10.5 million) is available under the revolving credit facility, after taking into account borrowing base limitations.
We enter into derivative instruments as part of our risk management strategy. As of December 27, 2009, we had three forward-starting receive-variable, pay-fixed interest rate swap agreements with a total notional amount of $150.0 million that were entered into in August 2007 to hedge a portion of our exposure to interest rate risk related to our variable interest rate borrowings under our first lien credit facility. The variable rate of interest received is the Eurodollar rate. The fixed rate of interest paid is 5.3765%. The swap agreements are effective from August 28, 2007 through February 28, 2011. Prior to the refinancing transactions, the interest rate swaps were designated and qualified as highly-effective cash flow hedges. As long as these interest rate swaps were designated as cash flow hedges, the mark-to-market changes on these swaps had been reported as a component of accumulated other comprehensive loss. As a result of the refinancing, the hedged forecasted payments of variable-rate interest on the first lien credit facility borrowings were no longer probable of occurring. Accordingly, we discontinued hedge accounting prospectively, and, as a result, the cumulative mark-to-market loss of $9.1 million associated with these swaps was reclassified from accumulated other comprehensive loss to interest expense in June 2009. In periods subsequent to June 2009 through the expiration of these interest rate swaps, we are exposed to future variations in the fair value of the swaps as three-month LIBOR fluctuates.
Based upon the information above, our annual pre-tax income would increase by approximately $1.3 million for each one-percentage point increase in the interest rates applicable to our variable rate debt and interest rate swap agreements. At the end of 2009, three-month LIBOR was less than one percent; therefore, the maximum decrease in our annual pre-tax income based on a decrease in interest rates applicable to our variable rate debt and interest rate swap agreements would be approximately $0.2 million. The level of our exposure to interest rate movements may fluctuate significantly as a result of changes in the amount of debt outstanding under our credit facilities.
28
Table of Contents
| Item 8. | Financial Statements and Supplementary Data. |
Report of Independent Registered Public Accounting Firm
The Board of Directors and Shareholder
Solo Cup Company:
We have audited the accompanying consolidated balance sheets of Solo Cup Company and subsidiaries (the Company) as of December 27, 2009 and December 28, 2008, and the related consolidated statements of operations, shareholder’s equity and comprehensive income (loss), and cash flows for each of the years in the three-year period ended December 27, 2009. These consolidated financial statements are the responsibility of the Company’s management. Our responsibility is to express an opinion on these consolidated financial statements based on our audits.
We conducted our audits in accordance with the standards of the Public Company Accounting Oversight Board (United States). Those standards require that we plan and perform the audit to obtain reasonable assurance about whether the financial statements are free of material misstatement. An audit includes examining, on a test basis, evidence supporting the amounts and disclosures in the financial statements. An audit also includes assessing the accounting principles used and significant estimates made by management, as well as evaluating the overall financial statement presentation. We believe that our audits provide a reasonable basis for our opinion.
In our opinion, the consolidated financial statements referred to above present fairly, in all material respects, the financial position of Solo Cup Company and subsidiaries as of December 27, 2009 and December 28, 2008, and the results of their operations and their cash flows for each of the years in the three-year period ended December 27, 2009, in conformity with U.S. generally accepted accounting principles.
/s/ KPMG LLP
Chicago, Illinois
March 25, 2010
29
Table of Contents
SOLO CUP COMPANY AND SUBSIDIARIES
CONSOLIDATED BALANCE SHEETS
(In thousands, except share and per share amounts)
| December 27, 2009 | December 28, 2008 | |||||||
| Assets | ||||||||
| Current assets: |
||||||||
| Cash and cash equivalents |
$ | 30,006 | $ | 57,504 | ||||
| Cash in escrow |
— | 50 | ||||||
| Accounts receivable: |
||||||||
| Trade, less allowance for doubtful accounts of $1,114 and $1,453 |
117,203 | 121,002 | ||||||
| Other |
7,662 | 3,039 | ||||||
| Inventories |
232,582 | 283,261 | ||||||
| Deferred income taxes |
19,131 | 21,882 | ||||||
| Prepaid expenses |
6,193 | 5,664 | ||||||
| Assets held for sale |
2,825 | 9,832 | ||||||
| Other current assets |
20,799 | 23,376 | ||||||
| Total current assets |
436,401 | 525,610 | ||||||
| Property, plant and equipment, less accumulated depreciation and amortization of $527,050 and $657,222 |
508,964 | 511,129 | ||||||
| Goodwill |
— | 15,459 | ||||||
| Restricted cash |
10,410 | — | ||||||
| Other assets |
31,643 | 21,597 | ||||||
| Total assets |
$ | 987,418 | $ | 1,073,795 | ||||
| Liabilities and Shareholder’s Equity | ||||||||
| Current liabilities: |
||||||||
| Accounts payable |
$ | 81,990 | $ | 74,759 | ||||
| Accrued payroll and related costs |
25,785 | 31,155 | ||||||
| Accrued customer allowances |
29,810 | 26,322 | ||||||
| Current maturities of long-term debt |
779 | 1,368 | ||||||
| Accrued interest |
19,499 | 14,501 | ||||||
| Other current liabilities |
27,608 | 31,047 | ||||||
| Total current liabilities |
185,471 | 179,152 | ||||||
| Long-term debt, net of current maturities |
635,310 | 716,822 | ||||||
| Deferred income taxes |
22,672 | 30,850 | ||||||
| Pensions and other postretirement benefits |
36,011 | 36,021 | ||||||
| Deferred gain on sale-leaseback |
43,540 | 46,178 | ||||||
| Other liabilities |
46,201 | 33,480 | ||||||
| Total liabilities |
969,205 | 1,042,503 | ||||||
| Shareholder’s equity: |
||||||||
| Common stock – Par value $0.01 per share; 1,000 shares authorized; 100 shares issued and outstanding |
— | — | ||||||
| Additional paid-in capital |
254,995 | 254,995 | ||||||
| Accumulated deficit |
(226,903 | ) | (191,247 | ) | ||||
| Accumulated other comprehensive loss |
(9,879 | ) | (32,456 | ) | ||||
| Total shareholder’s equity |
18,213 | 31,292 | ||||||
| Total liabilities and shareholder’s equity |
$ | 987,418 | $ | 1,073,795 | ||||
See accompanying notes to consolidated financial statements.
30
Table of Contents
SOLO CUP COMPANY AND SUBSIDIARIES
CONSOLIDATED STATEMENTS OF OPERATIONS
(In thousands)
| Year ended December 27, 2009 |
Year ended December 28, 2008 |
Year ended December 30, 2007 |
||||||||||
| Net sales |
$ | 1,502,552 | $ | 1,847,034 | $ | 2,110,102 | ||||||
| Cost of goods sold |
1,296,132 | 1,599,270 | 1,859,683 | |||||||||
| Gross profit |
206,420 | 247,764 | 250,419 | |||||||||
| Selling, general and administrative expenses |
150,139 | 159,606 | 203,643 | |||||||||
| Impairment of goodwill |
17,210 | — | — | |||||||||
| Loss (gain) on asset disposals |
8,969 | 22,560 | (8,507 | ) | ||||||||
| Operating income |
30,102 | 65,598 | 55,283 | |||||||||
| Interest expense, net of interest income of $535, $1,101 and $2,177 |
63,096 | 61,624 | 79,794 | |||||||||
| Prepayment penalty |
— | — | 1,300 | |||||||||
| Loss on debt extinguishment |
2,520 | — | 3,962 | |||||||||
| Reclassification of unrealized loss on cash flow hedges to interest expense |
9,108 | — | — | |||||||||
| Foreign currency exchange (gain) loss, net |
(2,577 | ) | 14,107 | (4,090 | ) | |||||||
| Other income, net |
— | — | (184 | ) | ||||||||
| Loss from continuing operations before income taxes |
(42,045 | ) | (10,133 | ) | (25,499 | ) | ||||||
| Income tax (benefit) provision |
(6,389 | ) | 2,067 | (19,461 | ) | |||||||
| Loss from continuing operations |
(35,656 | ) | (12,200 | ) | (6,038 | ) | ||||||
| Loss from discontinued operations, net of income tax provision of $0 and $3,043 |
— | (628 | ) | (144 | ) | |||||||
| Gain on sale of discontinued operations, net of income tax provision of $0 and $17,671 |
— | 777 | 77,263 | |||||||||
| Net (loss) income |
$ | (35,656 | ) | $ | (12,051 | ) | $ | 71,081 | ||||
See accompanying notes to consolidated financial statements.
31
Table of Contents
SOLO CUP COMPANY AND SUBSIDIARIES
CONSOLIDATED STATEMENTS OF SHAREHOLDER’S EQUITY AND COMPREHENSIVE INCOME (LOSS)
(In thousands, except share amounts)
| Common stock | Additional | Retained earnings |
Accumulated other |
Total | |||||||||||||||||||||
| Shares | Amount | paid-in capital |
(accumulated deficit) |
comprehensive income (loss) |
shareholder’s equity |
Comprehensive income (loss) |
|||||||||||||||||||
| December 31, 2006 |
100 | $ | — | $ | 257,612 | $ | (250,120 | ) | $ | 1,702 | $ | 9,194 | |||||||||||||
| Net income |
— | — | — | 71,081 | — | 71,081 | $ | 71,081 | |||||||||||||||||
| Reversal of compensation expense on CPUs |
— | — | (610 | ) | — | — | (610 | ) | |||||||||||||||||
| Return of capital to parent |
— | — | (2,007 | ) | — | — | (2,007 | ) | |||||||||||||||||
| Adjustment from adoption of new pension accounting rules, net of tax of $(759) |
— | — | — | — | 1,539 | 1,539 | |||||||||||||||||||
| Pension liability adjustments, net of tax of $1,559 |
— | — | — | — | 6,895 | 6,895 | 6,895 | ||||||||||||||||||
| Unrealized investment loss, net of tax of $(639) |
— | — | — | — | (919 | ) | (919 | ) | (919 | ) | |||||||||||||||
| Recognition of realized gain on cash flow hedge, net of tax of $944 |
— | — | — | — | (666 | ) | (666 | ) | (666 | ) | |||||||||||||||
| Unrealized loss on cash flow hedge, net of tax of $0 |
— | — | — | — | (7,023 | ) | (7,023 | ) | (7,023 | ) | |||||||||||||||
| Reclassification of realized gain on cash flow hedges, net of tax of $0 |
— | — | — | — | (47 | ) | (47 | ) | (47 | ) | |||||||||||||||
| Foreign currency translation adjustment |
— | — | — | — | 11,090 | 11,090 | 11,090 | ||||||||||||||||||
| Total comprehensive income |
$ | 80,411 | |||||||||||||||||||||||
| December 30, 2007 |
100 | $ | — | $ | 254,995 | $ | (179,039 | ) | $ | 12,571 | $ | 88,527 | |||||||||||||
| Net loss |
— | — | — | (12,051 | ) | — | (12,051 | ) | $ | (12,051 | ) | ||||||||||||||
| Adjustment to retained earnings resulting from adoption of the measurement date provisions of new pension accounting rules, net of tax of $45 |
— | — | — | (157 | ) | — | (157 | ) | |||||||||||||||||
| Pension liability adjustments, net of tax of $1,021 |
— | — | — | — | (25,397 | ) | (25,397 | ) | (25,397 | ) | |||||||||||||||
| Unrealized investment loss, net of tax of $0 |
— | — | — | — | (13 | ) | (13 | ) | (13 | ) | |||||||||||||||
| Recognition of realized gain on cash flow hedge, net of tax of $153 |
— | — | — | — | (108 | ) | (108 | ) | (108 | ) | |||||||||||||||
| Unrealized loss on cash flow hedge, net of tax of $0 |
— | — | — | — | (8,275 | ) | (8,275 | ) | (8,275 | ) | |||||||||||||||
| Reclassification of realized loss on cash flow hedges, net of tax of $0 |
— | — | — | — | 4,238 | 4,238 | 4,238 | ||||||||||||||||||
| Foreign currency translation adjustment |
— | — | — | — | (15,472 | ) | (15,472 | ) | (15,472 | ) | |||||||||||||||
| Total comprehensive loss |
$ | (57,078 | ) | ||||||||||||||||||||||
| December 28, 2008 |
100 | $ | — | $ | 254,995 | $ | (191,247 | ) | $ | (32,456 | ) | $ | 31,292 | ||||||||||||
(Continued)
See accompanying notes to consolidated financial statements.
32
Table of Contents
SOLO CUP COMPANY AND SUBSIDIARIES
CONSOLIDATED STATEMENTS OF SHAREHOLDER’S EQUITY AND COMPREHENSIVE INCOME (LOSS), CONTINUED
(In thousands, except share amounts)
| Common stock | Additional paid-in capital |
Retained earnings (accumulated deficit) |
Accumulated other comprehensive income (loss) |
Total shareholder’s equity |
Comprehensive income (loss) |
|||||||||||||||||||
| Shares | Amount | |||||||||||||||||||||||
| December 28, 2008 |
100 | $ | — | $ | 254,995 | $ | (191,247 | ) | $ | (32,456 | ) | $ | 31,292 | |||||||||||
| Net loss |
— | — | — | (35,656 | ) | — | (35,656 | ) | $ | (35,656 | ) | |||||||||||||
| Foreign currency translation adjustment |
— | — | — | — | 10,435 | 10,435 | 10,435 | |||||||||||||||||
| Pension liability adjustments, net of tax of $1,050 |
— | — | — | — | 1,174 | 1,174 | 1,174 | |||||||||||||||||
| Unrealized investment loss, net of tax of $0 |
— | — | — | — | 12 | 12 | 12 | |||||||||||||||||
| Recognition of realized gain on cash flow hedge, net of tax of $(215) |
— | — | — | — | (150 | ) | (150 | ) | (150 | ) | ||||||||||||||
| Unrealized loss on cash flow hedges, net of tax of $0 |
— | — | — | — | (1,514 | ) | (1,514 | ) | (1,514 | ) | ||||||||||||||
| Reclassification of realized loss on cash flow hedges to interest expense, net of tax of $0 |
— | — | — | — | 3,512 | 3,512 | 3,512 | |||||||||||||||||
| Reclassification of unrealized loss on cash flow hedges to interest expense upon termination of hedge accounting, net of tax of $0 |
— | — | — | — | 9,108 | 9,108 | 9,108 | |||||||||||||||||
| Total comprehensive loss |
$ | (13,079 | ) | |||||||||||||||||||||
| December 27, 2009 |
100 | $ | — | $ | 254,995 | $ | (226,903 | ) | $ | (9,879 | ) | $ | 18,213 | |||||||||||
See accompanying notes to consolidated financial statements.
33
Table of Contents
SOLO CUP COMPANY AND SUBSIDIARIES
CONSOLIDATED STATEMENTS OF CASH FLOWS
(In thousands)
| Year ended December 27, 2009 |
Year ended December 28, 2008 |
Year ended December 30, 2007 |
||||||||||
| CASH FLOWS FROM OPERATING ACTIVITIES |
||||||||||||
| Net (loss) income |
$ | (35,656 | ) | $ | (12,051 | ) | $ | 71,081 | ||||
| Loss from discontinued operations, net of income tax |
— | 628 | 144 | |||||||||
| Gain on sale of discontinued operations, net of income tax |
— | (777 | ) | (77,263 | ) | |||||||
| Loss from continuing operations |
(35,656 | ) | (12,200 | ) | (6,038 | ) | ||||||
| Adjustments to reconcile loss from continuing operations to net cash provided by operating activities: |
||||||||||||
| Depreciation and amortization |
70,003 | 77,726 | 90,894 | |||||||||
| Deferred financing fee amortization |
6,017 | 4,535 | 5,312 | |||||||||
| Impairment of goodwill |
17,210 | — | — | |||||||||
| Asset impairment |
— | 555 | 5,554 | |||||||||
| Loss (gain) on asset disposals |
8,969 | 22,560 | (8,507 | ) | ||||||||
| Loss on debt extinguishment |
2,520 | — | 3,962 | |||||||||
| Reclassification of unrealized loss on cash flow hedges to interest expense |
9,108 | — | — | |||||||||
| Deferred income taxes |
(8,553 | ) | (808 | ) | (24,604 | ) | ||||||
| Foreign currency exchange (gain) loss, net |
(2,577 | ) | 14,107 | (4,090 | ) | |||||||
| Changes in operating assets and liabilities: |
||||||||||||
| Accounts receivable, net |
1,245 | 43,388 | 16,780 | |||||||||
| Inventories |
54,523 | 8,265 | 43,546 | |||||||||
| Prepaid expenses and other current assets |
5,596 | 3,968 | (1,892 | ) | ||||||||
| Other assets |
1,106 | 1,911 | 10,914 | |||||||||
| Accounts payable |
23 | (4,932 | ) | (33,691 | ) | |||||||
| Accrued expenses and other current liabilities |
493 | (23,213 | ) | (3,007 | ) | |||||||
| Other liabilities |
5,600 | (2,589 | ) | (11,297 | ) | |||||||
| Other, net |
2,310 | (696 | ) | 3,112 | ||||||||
| Net cash provided by operating activities – continuing operations |
137,937 | 132,577 | 86,948 | |||||||||
| Net cash (used in) provided by operating activities – discontinued operations |
— | (638 | ) | 8,630 | ||||||||
| Net cash provided by operating activities |
137,937 | 131,939 | 95,578 | |||||||||
(Continued)
See accompanying notes to consolidated financial statements.
34
Table of Contents
SOLO CUP COMPANY AND SUBSIDIARIES
CONSOLIDATED STATEMENTS OF CASH FLOWS (Continued)
(In thousands)
| Year ended December 27, 2009 |
Year ended December 28, 2008 |
Year ended December 30, 2007 |
||||||||||
| Net cash provided by operating activities |
137,937 | 131,939 | 95,578 | |||||||||
| CASH FLOWS FROM INVESTING ACTIVITIES |
||||||||||||
| Proceeds from sale of property, plant and equipment |
16,610 | 10,503 | 143,469 | |||||||||
| Proceeds from sale of discontinued operations |
— | 850 | 210,043 | |||||||||
| Purchases of property, plant and equipment |
(71,815 | ) | (79,698 | ) | (47,488 | ) | ||||||
| Increase in restricted cash |
(10,410 | ) | — | — | ||||||||
| Decrease (increase) in cash in escrow |
50 | (50 | ) | — | ||||||||
| Net cash (used in) provided by investing activities – continuing operations |
(65,565 | ) | (68,395 | ) | 306,024 | |||||||
| Net cash used in investing activities – discontinued operations |
— | — | (385 | ) | ||||||||
| Net cash (used in) provided by investing activities |
(65,565 | ) | (68,395 | ) | 305,639 | |||||||
| CASH FLOWS FROM FINANCING ACTIVITIES |
||||||||||||
| Net repayments under revolving credit facilities |
(13,000 | ) | (2,100 | ) | (72,594 | ) | ||||||
| Borrowings under the 10.5% Senior Secured Notes |
293,784 | — | — | |||||||||
| Borrowings of term notes |
— | — | 50,000 | |||||||||
| Repayments of term notes |
(363,204 | ) | (38,082 | ) | (167,864 | ) | ||||||
| Repayments of the term notes from net proceeds from sale of discontinued operations |
— | — | (201,800 | ) | ||||||||
| Repayments of other debt |
(344 | ) | (135 | ) | (228 | ) | ||||||
| Return of capital to parent |
— | — | (2,007 | ) | ||||||||
| Debt issuance costs |
(18,314 | ) | — | (380 | ) | |||||||
| Net cash used in financing activities – continuing operations |
(101,078 | ) | (40,317 | ) | (394,873 | ) | ||||||
| Net cash used in financing activities – discontinued operations |
— | — | (72 | ) | ||||||||
| Net cash used in financing activities |
(101,078 | ) | (40,317 | ) | (394,945 | ) | ||||||
| Effect of exchange rate changes on cash |
1,208 | 694 | 920 | |||||||||
| NET (DECREASE) INCREASE IN CASH AND CASH EQUIVALENTS |
(27,498 | ) | 23,921 | 7,192 | ||||||||
| CASH AND CASH EQUIVALENTS, beginning of period |
57,504 | 33,583 | 26,391 | |||||||||
| CASH AND CASH EQUIVALENTS, end of period |
$ | 30,006 | $ | 57,504 | $ | 33,583 | ||||||
| SUPPLEMENTAL CASH FLOW DISCLOSURES: |
||||||||||||
| Interest paid, net of capitalized interest |
$ | 53,139 | $ | 57,877 | $ | 101,617 | ||||||
| Income taxes paid, net of income tax refunds |
$ | 1,912 | $ | 6,908 | $ | 7,264 | ||||||
See accompanying notes to consolidated financial statements.
35
Table of Contents
SOLO CUP COMPANY AND SUBSIDIARIES
NOTES TO CONSOLIDATED FINANCIAL STATEMENTS
| (1) | Nature, Formation and Organization of Business |
Solo Cup Company, a Delaware corporation (“Solo Delaware”) was incorporated in Delaware in January 2004 to be the holding company for Solo Cup Company, an Illinois corporation (“Solo Illinois”), and its subsidiaries, and for SF Holdings Group, Inc., and its subsidiaries, including Sweetheart Cup Company Inc. Effective February 22, 2004, Solo Illinois became a wholly owned subsidiary of Solo Delaware, and Solo Delaware acquired 100% of the outstanding capital stock of SF Holdings.
Solo Illinois was established in 1936. Sweetheart Cup Company’s operating history dated back to the founding of a predecessor company in 1911. In September 2005, Sweetheart Cup Company changed its name to Solo Cup Operating Corporation, and in October 2005, Solo Illinois merged with and into Solo Cup Operating Corporation, with Solo Cup Operating Corporation as the surviving entity. As a result of these transactions, Solo Delaware is a holding company, the material assets of which are 100% of the capital stock of SF Holdings. SF Holdings owns 100% of the capital stock of Solo Cup Operating Corporation. In these financial statements, Solo Delaware and its consolidated subsidiaries are referred to as the “Company”.
Solo Delaware is a wholly owned subsidiary of Solo Cup Investment Corporation. As of December 27, 2009, SCC Holding Company LLC owns 67.25%, Vestar Capital Partners IV, L.P. and certain of its affiliates own 32.71% and management of Solo Delaware owns the remaining 0.04%.
The Company is a leading producer and marketer of single-use products used to serve food and beverages. It distributes its products globally and has served its industry for over 70 years. The Company manufactures and supplies a broad portfolio of single-use products, including cups, lids, food containers, plates, bowls, portion cups, cutlery and straws, with products available in plastic, paper, foam, post-consumer recycled content and annually renewable materials. The Company operates manufacturing facilities and distribution centers in North America, the United Kingdom and Panama.
| (2) | Summary of Significant Accounting Policies |
Consolidation
The consolidated financial statements include the accounts of Solo Delaware and its subsidiaries. As of December 27, 2009 and December 28, 2008, Solo Delaware wholly owned all of its subsidiaries directly or indirectly. All significant intercompany balances and transactions have been eliminated in consolidation.
Assets and liabilities of foreign subsidiaries are translated at current exchange rates with the related translation adjustments reported in shareholder’s equity as a component of accumulated other comprehensive income (loss). Income and expense accounts and cash flows are translated at the average exchange rate during the period. Components of shareholder’s equity are translated at historical exchange rates. Resulting translation gains and losses are recorded in comprehensive income (loss). Gains or losses resulting from foreign currency transactions are recorded in the Consolidated Statements of Operations.
Use of Estimates
The preparation of the consolidated financial statements requires management of the Company to make a number of estimates and assumptions relating to the reported amounts of assets and liabilities and the disclosure of contingent assets and liabilities at the date of the consolidated financial statements, and the reported amounts of revenues and expenses during the period. Financial statement elements subject to significant estimation include, but are not limited to: the realizable value of accounts receivable, inventories, spare parts and deferred tax assets; the carrying value of property, plant, and equipment, goodwill, and intangible and other assets; the measurement of assets and obligations related to employee benefit plans and the long term incentive plan; the determination of the fair value of derivative instruments and debt; and provisions for discounts and allowances provided to customers. Actual results may differ from those estimates.
Cash and Cash Equivalents
Cash equivalents consist of highly liquid securities with original maturities of thirty days or less.
Accounts Receivable
Accounts receivable are stated net of allowances for doubtful accounts and discounts and deductions and do not bear interest. The allowance for doubtful accounts is the Company’s best estimate of the amount of probable credit losses in the Company’s existing accounts receivable. The Company determines the allowance based on a specific analysis of collectability and historical write-off experience. Account balances are charged against the allowance after all reasonable means of collection have been exhausted and the potential for recovery is considered remote.
36
Table of Contents
SOLO CUP COMPANY AND SUBSIDIARIES
NOTES TO CONSOLIDATED FINANCIAL STATEMENTS
Some customer discounts and allowances are earned by, and payable to, customers only if they meet specified levels of sales volume. The Company records such customer discounts and allowances based on the estimated and probable allowances for the period. The amounts are recorded as a reduction of net sales based on the customers’ actual sales volumes for the period. The most significant allowance reflects the Company’s estimates of discounts that some foodservice customers are entitled to claim based on their distribution activities. The calculation is based on historical trends of both the discount amounts claimed and the length of time between the sale of the product and the customer’s claim. Customer accounts and allowances for which a right of offset exists are presented net within accounts receivable. If no right of offset exists, the amounts are included in accrued customer allowances.
Inventories
Inventories are stated at the lower of cost or market, using the first-in, first-out (FIFO) method.
Vendor Incentives
The Company is entitled to certain vendor incentives only if it makes a specified level of annual purchases. The Company records such incentives based on the actual purchases made on a year-to-date basis compared to targets or specified levels of purchases. The amounts are recorded as a reduction of cost of goods sold and inventory based on the purchase volume during the period.
Property, Plant and Equipment
Property, plant and equipment are stated at cost. Plant and equipment held under capital leases are stated at the present value of minimum lease payments. Depreciation on property, plant and equipment is calculated using the straight-line method over the estimated useful lives of the assets. Amortization of assets held under capital leases is included within depreciation expense. Buildings are depreciated over 30 to 50 years, depending upon the construction of the building. Leasehold improvements are amortized over the lives of the corresponding leases. Machinery and equipment are depreciated over three to 10 years. Capitalized software is depreciated over three to five years.
The estimated useful life for building and improvements and machinery and equipment held under capital leases is the lesser of the lease term or the asset’s estimated useful life. Costs for repairs and maintenance are expensed as incurred. Gains and losses on sales of property, plant and equipment are recorded as a component of operating income.
The Company capitalizes interest costs, when appropriate, as a component of construction in progress.
Spare Parts
The Company capitalizes the spare parts that it purchases and expenses them as the parts are used. The carrying value of capitalized spare parts is stated net of an allowance for excess and obsolete parts, and is included in other current assets and other assets in the Company’s Consolidated Balance Sheets.
Goodwill and Other Intangible Assets
Goodwill represents the excess of costs over the fair value of net assets of businesses acquired. Goodwill and intangible assets acquired in a purchase business combination and determined to have an indefinite useful life are not amortized. In accordance with the provisions of the Financial Accounting Standards Board (“FASB”) Accounting Standards Codification (“ASC”) Topic 350, Intangibles – Goodwill and Other, the Company tests goodwill and other intangible assets with indefinite lives for impairment at least annually, at the end of October, or sooner if a triggering event occurs suggesting possible impairment of the values of these assets. Impairment testing for these assets involves a two-step process. In the first step, the fair value of the reporting unit holding the assets is compared to its carrying amount. If the carrying amount of the reporting unit exceeds its fair value, the second step of the impairment test is performed to measure the amount of the impairment loss, if any. In the second step, the fair market value of the reporting unit is allocated to all of its assets and liabilities including intangible assets with indefinite lives. The excess, if any, of the fair market value of the reporting unit over the sum of the fair market values allocated to identified assets and liabilities is the calculated value of goodwill to be compared to its carrying value (Note 7).
37
Table of Contents
SOLO CUP COMPANY AND SUBSIDIARIES
NOTES TO CONSOLIDATED FINANCIAL STATEMENTS
Deferred Financing Fees
Deferred financing fees include costs incurred to obtain financing from lenders. The Company capitalizes debt issuance costs as deferred financing fees and amortizes the fees over the term of the related debt using the effective interest method.
Pre-production Design and Development Costs
The Company expenses design and development costs related to products to be sold under long-term supply arrangements as those costs are incurred, with the exception of costs for molds, dies, and other tools that the Company will own or have non-cancelable rights to use in producing the products under long-term supply arrangements. The Company capitalizes and depreciates those costs as equipment.
Impairment of Long-lived Assets
The Company reviews long-lived assets, such as property, plant, and equipment and purchased intangibles subject to amortization, for impairment whenever events or changes in circumstances indicate that the carrying amount of an asset may not be recoverable. The Company measures the recoverability of an asset to be held and used by comparing the carrying amount of that asset to the estimated undiscounted future cash flows expected to be generated by the asset. If the carrying amount of an asset exceeds its estimated future cash flows, the Company recognizes an impairment charge in the amount by which the carrying amount of the asset exceeds the fair value of the asset. The Company presents assets to be disposed of separately in the Consolidated Balance Sheets and reports them at the lower of the carrying amount or fair value less costs to sell. Such assets are no longer depreciated (Note 4).
Deferred Rent
Some of the Company’s operating leases include rent escalation clauses that provide for scheduled changes in base rentals over their terms, tenant improvement allowances funded by landlord incentives or rent holidays that provide for rental payments commencing at a date other than the date of initial occupancy. For these leases, the Company recognizes the total rental amounts due, net of tenant improvement allowances, over the lease terms as rental expense on a straight-line basis. The difference between the rent due under the stated periods of the lease compared to that of the straight-line basis is recorded as deferred rent. Deferred rent of $24.9 million and $13.6 million is included in other liabilities (non-current) in the Company’s Consolidated Balance Sheets as of December 27, 2009 and December 28, 2008, respectively.
Income Taxes
The Company accounts for income taxes in accordance with the asset and liability method described in FASB ASC Topic 740, Income Taxes. Deferred income tax assets and liabilities are recognized for the future tax consequences attributed to differences between the financial statement and income tax bases of assets and liabilities and tax credit and operating loss carryforwards. These items are recorded using enacted tax rates expected to apply to taxable income in the years in which the differences are expected to be recovered or settled. The effect on deferred income tax assets and liabilities of a change in tax rates is recognized in income in the period in which the rate change is enacted.
A valuation allowance is established whenever management believes that it is more likely than not that deferred tax assets may not be realizable (Note 8).
Derivative Instruments and Hedging Activities
The Company records all derivative instruments on its Consolidated Balance Sheets at their respective fair values.
The Company historically has used interest rate derivative contracts, including interest rate swaps or caps, to manage exposure relating to the variability in interest payments on its outstanding debt. At the inception of a derivative contract, the Company designates the derivative as part of a cash flow hedge or a fair value hedging relationship, depending on the nature of the risk being hedged and whether or not the derivative contract qualifies as a highly-effective hedge of the underlying hedged item. Changes in the fair value of derivative contracts are recorded in earnings or deferred in accumulated other comprehensive income (loss), depending on whether a derivative is effective as a hedge and on the type of hedging transaction.
Derivatives are classified in the Company’s Consolidated Balance Sheets in other assets or other liabilities, as applicable, and are classified as current or long-term based on the scheduled maturity of the instrument.
38
Table of Contents
SOLO CUP COMPANY AND SUBSIDIARIES
NOTES TO CONSOLIDATED FINANCIAL STATEMENTS
Revenue Recognition
The Company recognizes all of its revenue through the sale of manufactured or sourced products and records sales when the sales price is fixed or determinable, products are shipped, title and risk of loss has passed to the customer, and collection is reasonably assured.
The Company records specified costs that relate to promotional programs and incentive cash rebates as a reduction of sales.
Research and Development Costs
Research and development costs are expensed as incurred. Research and development costs amounted to $2.5 million, $3.2 million and $2.6 million for the years ended December 27, 2009, December 28, 2008 and December 30, 2007, respectively.
Advertising Costs
Advertising production costs are expensed as incurred, while advertising media costs are expensed in the period in which the related advertising first takes place. Advertising costs amounted to $7.7 million, $5.0 million and $5.1 million for the years ended December 27, 2009, December 28, 2008 and December 30, 2007, respectively.
Pension and Other Postretirement Benefits
In September 2006, the FASB issued a new standard for accounting for defined benefit pension and other postretirement plans, which amended previous standards. The new standard was effective for fiscal years ending after December 15, 2007, for companies without publicly-traded equity securities. The new standard required the full recognition of the overfunded or underfunded status of a defined benefit postretirement plan as an asset or liability in the Consolidated Balance Sheet. The new standard also requires that subsequent changes in that funded status be recognized during the year of the change through comprehensive income (loss). The Company does not have publicly-traded equity securities and, therefore, recognized the funded status of its benefit plans at December 30, 2007 in accordance with the new recognition provisions. In addition to the recognition provisions, the new standard also required companies to measure the funded status of the plan as of the date of their fiscal year end, effective for fiscal years ending after December 15, 2008. The Company adopted these measurement provisions effective December 28, 2008 for its pension and postretirement plans. As a result, the net periodic benefit cost for the period between the earlier measurement date (September 30, 2007) and the new measurement date (December 28, 2008) was allocated proportionately between amounts recognized as (1) an adjustment of retained earnings and (2) net periodic benefit cost for the 2008 fiscal year. See Note 12 for further information on pension and other postretirement benefits. The provisions of this new standard are included in the FASB ASC under Topic 715, Compensation – Retirement Benefits.
Fair Value Measurements
The Company uses a fair value hierarchy that prioritizes the inputs to techniques used to measure fair value into three broad levels. The level in the fair value hierarchy within which the fair value measurement falls in its entirety is determined based on the lowest level input that is significant to the fair value measurement in its entirety. These levels include:
Level 1 fair values are valuations based on quoted market prices in active markets for identical assets or liabilities that the entity has the ability to access.
Level 2 fair values are those valuations based on quoted prices for similar assets or liabilities, quoted prices in markets that are not active, or other inputs that are observable or can be corroborated by observable data for substantially the full term of the assets or liabilities.
Level 3 fair values are valuations based on inputs that are supported by little or no market activity and that are significant to the fair value of the assets or liabilities.
The Company has applied fair value measurements for either accounting or disclosure purposes, as applicable, to its assets and liabilities, as follows: assets held for sale (Note 4), goodwill (Note 7), 10.5% senior secured notes and 8.5% senior subordinated notes (Note 11), interest rate swap agreements (Note 11), pension plan assets (Note 12), long term incentive plan (Note 15) and an accounting guarantee (Note 16).
39
Table of Contents
SOLO CUP COMPANY AND SUBSIDIARIES
NOTES TO CONSOLIDATED FINANCIAL STATEMENTS
Recently Adopted Accounting Standards
The FASB issued SFAS No. 168, The FASB Accounting Standards Codification and the Hierarchy of Generally Accepted Accounting Principles – a replacement of FASB Statement No. 162 in July 2009. Pursuant to the statement, the FASB Accounting Standards Codification (“ASC”) officially became the single source of authoritative nongovernmental U.S. generally accepted accounting principles (“GAAP”), superseding existing FASB, American Institute of Certified Public Accountants, Emerging Issues Task Force, and related accounting literature. After July 1, 2009, the FASB ASC is the sole level of authoritative GAAP. All other accounting literature is considered non-authoritative. The FASB ASC reorganizes the thousands of GAAP pronouncements into approximately 90 accounting topics and displays them using a consistent structure. Also included in the FASB ASC is relevant SEC guidance organized using the same topical structure in separate sections. The statement is effective for interim and annual periods ending after September 15, 2009. In accordance with this Statement, all references to authoritative accounting literature within the Company’s financial statement disclosures are references to the FASB ASC.
In September 2009, the FASB issued Accounting Standards Update 2009-12, Investments in Certain Entities That Calculate Net Asset Value per Share (or Its Equivalent), to provide guidance on measuring the fair value of investments in entities that calculate net asset value. The update amends FASB ASC Topic 820, Fair Value Measurements and Disclosures. The amendment permits, as a practical expedient, a reporting entity to measure the fair value of an investment, which is within the scope of the standard, on the basis of net asset value per share of the investment (or its equivalent). The amendment also requires disclosures by major category of investment about the attributes of investments, such as the nature of any restrictions on the investor’s ability to redeem its investments at the measurement date, any unfunded commitments and the investment strategies of the investees. The guidance in this update is effective for interim and annual periods ending after December 15, 2009. The Company adopted the new standard beginning with these financial statements. The impact of adoption, which solely related to certain investments within the Company’s defined benefit pension plan assets, was not material.
In March 2008, the FASB issued a new standard regarding disclosure about derivative instruments and hedging activities. The new standard was effective for the Company as of the first quarter of 2009. The provisions of this new standard are included in the FASB ASC under Topic 815, Derivatives and Hedging. In accordance with the new requirements, the Company has expanded its disclosures to explain why it uses derivative instruments, how it accounts for derivative instruments and related hedged items, and the impact of derivative instruments and related hedged items on its financial statements (Note 11).
In September 2006, the FASB issued a new standard that defines fair value, establishes a framework for measuring fair value in accordance with GAAP and expands disclosure about fair value measurements. The provisions of this new standard are included in the FASB ASC under Topic 820, Fair Value Measurements and Disclosures. In February 2008, the FASB issued new guidance that provided a one-year deferral of the effective date of Topic 820 for non-financial assets and non-financial liabilities, except those that are recognized or disclosed in the financial statements at fair value at least annually. In accordance with the new guidance, the Company adopted the provisions of Topic 820 during its 2008 fiscal year only with respect to its financial assets and financial liabilities that are measured at fair value within the financial statements (Note 11). The Company deferred the application of the provisions of Topic 820 to its non-financial assets and non-financial liabilities and adopted these provisions for its 2009 fiscal year. As of December 27, 2009, these provisions are applied to assets held for sale (Note 4), because these non-financial assets are required to be measured at the lower of carrying value or fair value less costs to sell in accordance with the provisions of FASB ASC Topic 360, Property, Plant and Equipment.
40
Table of Contents
SOLO CUP COMPANY AND SUBSIDIARIES
NOTES TO CONSOLIDATED FINANCIAL STATEMENTS
| (3) | Divestitures |
Hoffmaster
In October 2007, the Company sold substantially all of the assets and liabilities of its Hoffmaster business, included in its North American operating segment, for $170 million, including its product portfolio of disposable tableware and special occasions consumer products, associated manufacturing equipment, two manufacturing facilities located in Oshkosh and Appleton, Wisconsin and 100% of the shares of CEGI (Hong Kong) Limited, a Hong Kong entity, that was a subsidiary of SF Holdings. Under the terms of the purchase agreement for the sale, the buyer also assumed the lease for a distribution center located in Indianapolis, Indiana. The net proceeds from the sale of $162.7 million were used to reduce the term loan under the Company’s first lien credit facility. During October 2008, the purchase price for the sale was increased by approximately $0.9 million based on the finalization of the working capital adjustment. Such amount is classified as a component of gain on sale of discontinued operations in the accompanying Consolidated Statement of Operations for the year ended December 28, 2008. The results of the Hoffmaster business are reflected as discontinued operations in the Company’s consolidated financial statements.
Japanese subsidiaries
In November 2007, the Company sold 100% of the capital stock of its Japanese subsidiaries, Yugen Kaisha Solo Cup Asia-Pacific and Solo Cup Japan Co., Ltd. The subsidiaries were previously included in the Company’s Asia Pacific operating segment. Solo Cup Japan primarily manufactured drinking straws. The net proceeds from the sale of $39.1 million were used to reduce the term loan under the Company’s first lien credit facility.
In December 2006, the Company sold assets and certain related liabilities of its Japanese dairy business, which was previously included in the Company’s Asia Pacific operating segment. As a result of the sale of the remaining Japan business in November 2007, the entire Asia Pacific operating segment is now reflected as discontinued operations in the Company’s consolidated financial statements.
Interest expense of approximately $18.6 million for the year ended December 30, 2007, was allocated to the discontinued operations based on debt that was required to be repaid from the net proceeds. Amounts for the prior periods were reclassified to conform to this presentation.
| Year ended December 27, 2009 |
Year ended December 28, 2008 |
Year ended December 30, 2007 | ||||||||
| Sales from discontinued operations |
$ | — | $ | — | $ | 247,027 | ||||
| (Loss) income from discontinued operations before income taxes |
$ | — | $ | (628 | ) | $ | 2,899 | |||
| (4) | Assets Held for Sale |
Assets held for sale of $2.8 million and $9.8 million as of December 27, 2009 and December 28, 2008, respectively, are included within the Company’s North America operating segment and represent properties that the Company intends to sell and that meet the criteria for held for sale as defined by FASB ASC Topic 360, Property, Plant and Equipment. Assets held for sale are recorded at the lower of the assets’ carrying value or fair value less costs to sell. The fair values of the properties were determined using the market approach which includes an analysis of sales prices for similar properties in similar locations. These are considered Level 2 inputs in the fair value hierarchy described in FASB ASC Topic 820, Fair Value Measurements and Disclosures.
As of December 27, 2009, assets held for sale consist of a manufacturing facility in Belen, New Mexico that was closed and subsequently reclassified to assets held for sale during the first quarter of 2009. The facility’s carrying value has not been adjusted as its estimated fair value less costs to sell exceeds carrying value.
As of December 28, 2008, assets held for sale includes the carrying value of a distribution center in Havre de Grace, Maryland which was closed during December 2008 as well as the land and buildings of a manufacturing facility in Leominster, Massachusetts which the Company closed during the first quarter of 2008. During the fourth quarter of 2008, the carrying value of the Leominster property was reduced by an impairment loss of $0.6 million to adjust the carrying value to approximately $0.5 million, representing its estimated fair value less costs to sell. In July 2009, the Leominster property was sold for an amount in excess of its carrying value.
41
Table of Contents
SOLO CUP COMPANY AND SUBSIDIARIES
NOTES TO CONSOLIDATED FINANCIAL STATEMENTS
In February 2009, the Company leased the Havre de Grace property to a related party (Note 16) and in September 2009, the Company completed the sale of the property and simultaneously assigned the lease to the new owner. The property sold for an amount in excess of its carrying value. One of the contractual terms of the purchase agreement requires the Company to lease the property from the new owner for years 8-15 beginning in 2016 in the event the tenant does not renew the lease. The Company recorded a liability equal to the estimated fair value of this guarantee of approximately $1.2 million, in accordance with FASB ASC Topic 460, Guarantees, and, due to the continuing involvement in the property, deferred the gain on the sale.
In March 2007, the Company entered into a purchase and sale agreement with a third party for the sale of an undeveloped land parcel located in Chicago, Illinois. Previously, the Company had entered into agreements with the State of Illinois and the City of Chicago relating to the acquisition and development of the property (Note 18). The purchase and sale agreement with the third party terminated in December 2008, and as a result of the termination, the Company was entitled to retain earnest money from the third party of approximately $3.1 million. Accordingly, the Company recognized $3.1 million of income as a reduction of selling, general and administrative expenses in its Consolidated Statement of Operations for the year ended December 28, 2008. As of December 27, 2009, and December 28, 2008, the property did not meet the criteria to be classified as held for sale in accordance with FASB ASC Topic 360, Property, Plant and Equipment; therefore, the carrying value of this property is included in property, plant and equipment on the Company’s Consolidated Balance Sheet as of December 27, 2009 and December 28, 2008.
The Company recognized an impairment loss of $3.0 million during the fourth quarter of 2007 to adjust the carrying value of certain equipment to fair value, as a result of the Company’s intention to close two production facilities. The impairment is reflected in selling, general and administrative expenses.
| (5) | Inventories |
Inventories consist of the following (in thousands):
| December 27, 2009 |
December 28, 2008 | |||||
| Finished goods |
$ | 164,628 | $ | 202,458 | ||
| Work in process |
12,218 | 10,269 | ||||
| Raw materials and supplies |
55,736 | 70,534 | ||||
| Total inventories |
$ | 232,582 | $ | 283,261 | ||
| (6) | Property, Plant and Equipment |
Property, plant and equipment consists of the following (in thousands):
| December 27, 2009 |
December 28, 2008 |
|||||||
| Land |
$ | 41,718 | $ | 40,673 | ||||
| Buildings and improvements |
163,122 | 163,859 | ||||||
| Machinery and equipment |
762,322 | 907,347 | ||||||
| Construction in progress |
68,852 | 56,472 | ||||||
| Total property, plant and equipment |
1,036,014 | 1,168,351 | ||||||
| Less - accumulated depreciation |
(527,050 | ) | (657,222 | ) | ||||
| Total property, plant and equipment, net |
$ | 508,964 | $ | 511,129 | ||||
Depreciation and amortization of property, plant and equipment for the years ended December 27, 2009, December 28, 2008, and December 30, 2007, was $70.0 million, $76.2 million and $84.4 million, respectively. The Company capitalized approximately $2.9 million, $2.7 million and $1.7 million of interest related to construction in progress for the years ended December 27, 2009, December 28, 2008 and December 30, 2007, respectively.
42
Table of Contents
SOLO CUP COMPANY AND SUBSIDIARIES
NOTES TO CONSOLIDATED FINANCIAL STATEMENTS
The loss on asset disposals of $9.0 million for the year ended December 27, 2009 reflects the disposal of production equipment retired as a result of plant closures and consolidation, and also includes corrections made during the third and fourth fiscal quarters of 2009 to record the retirement of approximately $5.8 million of equipment that should have been recorded in prior periods. The Company determined these adjustments were not material to its current and prior period consolidated financial statements.
The loss on asset disposals of $22.6 million for the year ended December 28, 2008 primarily reflects losses on the disposal of non-core assets, including the March 2008 sale of the Company’s dairy packaging machinery and equipment, as well as outdated production equipment retired as a result of plant closures and consolidation.
| (7) | Goodwill and Intangible Assets |
The changes in the carrying value of goodwill formerly included in the Company’s Europe reporting unit were as follows (in thousands):
| Europe | ||||
| Balance at December 30, 2007 |
$ | 20,958 | ||
| Translation adjustment |
(5,499 | ) | ||
| Balance at December 28, 2008 |
15,459 | |||
| Translation adjustment |
1,751 | |||
| Impairment of goodwill |
(17,210 | ) | ||
| Balance at December 27, 2009 |
$ | — | ||
In the above table, the carrying value of goodwill is presented net of accumulated impairment losses of $37.5 million as of December 27, 2009, and $20.3 million as of December 28, 2008 and December 30, 2007.
The Company tests goodwill for impairment at least annually, as of the end of October, or sooner if a triggering event occurs suggesting possible impairment of the value of the goodwill. The Company’s step-one test performed as of October 2008 resulted in a fair value which exceeded carrying value.
During the third quarter of 2009, despite increasing sales in the first and second quarters and the implementation of programs intended to reduce costs and gain manufacturing efficiencies, the Company’s Europe reporting unit continued to incur declining margins and lower operating results. These results were in part due to increased competition, a decline in the European economy and higher input costs, such as resin and electricity, which were unable to be passed along through further price increases. Management considered this combination of factors evidence of a permanent change in the long-term prospects of the European business. As a result, management determined that it was at risk of failing step one of the impairment test such that the reporting unit’s estimated fair value would not be in excess of its carrying value and concluded that there were sufficient indicators to perform an interim goodwill impairment analysis of the Company’s Europe reporting unit. Step one of the impairment test was performed as of September 27, 2009. Fair value was estimated using a discounted cash flow valuation model. The key assumptions used in the model include the discount rate, terminal growth rate, and cash flow projections. These key assumptions represent significant unobservable inputs, which are considered Level 3 inputs as defined by FASB ASC Topic 820, Fair Value Measurements and Disclosures. The discount rate is set by using the Weighted Average Cost of Capital methodology, which considers market and industry data. The discount rate utilized is indicative of the return an investor would expect to receive for investing in such a business and was 14% for this test. The determination of projected cash flows is based on the business’ strategic plans and long-range planning forecasts and represent management’s best estimates based on current and forecasted market conditions, and the profit margin assumptions are projected based on the current cost structure and anticipated net cost increases and/or reductions. The terminal business value is determined using a common methodology of capturing the present value of perpetual cash flow estimates beyond the last projected period assuming a constant weighted-average cost of capital and terminal growth rate of 3%. Step one of the impairment test resulted in an estimated fair value less than carrying value. Consequently, step two was performed to calculate the amount of impairment, which concluded that the goodwill was fully impaired. As a result, the Company recorded a goodwill impairment charge of approximately $17.2 million during the thirteen weeks ended September 27, 2009. After this charge, there is no remaining goodwill on the Company’s Consolidated Balance Sheet.
For the third quarter of 2009, an impairment analysis of long-lived assets, excluding goodwill, was performed in conjunction with the interim goodwill impairment test for the Company’s Europe reporting unit. An impairment loss would be recognized if the carrying amount of these long-lived assets was not recoverable and exceeded its estimated fair value. The undiscounted future cash flows expected to result from the use and eventual disposition of these assets substantially exceeded their carrying value; therefore, management concluded that the assets were not impaired.
43
Table of Contents
SOLO CUP COMPANY AND SUBSIDIARIES
NOTES TO CONSOLIDATED FINANCIAL STATEMENTS
The amortizable intangible assets owned by the Company were fully amortized as of December 28, 2008. Amortization expense related to amortizable intangible assets was $1.5 million and $6.5 million during the years ended December 28, 2008, and December 30, 2007, respectively.
In October 2007, the Company reversed $7.5 million of reserves which were created in connection with the SF Holdings acquisition and recorded a corresponding reduction of $4.9 million to its manufacturing technology intangible asset and $2.6 million to its trademarks and trade names intangible asset; goodwill related to the acquisition had already been reduced to zero in June 2006. In June 2008, the Company reversed $0.7 million of reserves which were created in connection with the SF Holdings acquisition and recorded a corresponding reduction of $0.6 million to its trademarks and trade names intangible asset and $0.1 million to its patents, licenses and other intangible assets.
| (8) | Income Taxes |
Sources of the loss from continuing operations before income taxes and the components of income tax (benefit) provision are as follows (in thousands):
| For the year ended December 27, 2009 |
For the year ended December 28, 2008 |
For the year ended December 30, 2007 |
||||||||||
| Loss from continuing operations before income taxes: |
||||||||||||
| United States |
$ | (26,049 | ) | $ | (16,803 | ) | $ | (47,421 | ) | |||
| Foreign |
(15,996 | ) | 6,670 | 21,922 | ||||||||
| Total |
$ | (42,045 | ) | $ | (10,133 | ) | $ | (25,499 | ) | |||
| Income tax (benefit) provision: |
||||||||||||
| Current: |
||||||||||||
| U.S. federal |
$ | — | $ | — | $ | — | ||||||
| State |
182 | 276 | — | |||||||||
| Foreign |
1,982 | 2,599 | 5,143 | |||||||||
| Total current |
$ | 2,164 | $ | 2,875 | $ | 5,143 | ||||||
| Deferred: |
||||||||||||
| U.S. federal |
$ | (8,265 | ) | $ | 99 | $ | (21,813 | ) | ||||
| State |
— | — | (2,581 | ) | ||||||||
| Foreign |
(288 | ) | (907 | ) | (210 | ) | ||||||
| Total deferred |
$ | (8,553 | ) | $ | (808 | ) | $ | (24,604 | ) | |||
| Total income tax (benefit) provision |
$ | (6,389 | ) | $ | 2,067 | $ | (19,461 | ) | ||||
The following reconciles the expected U.S. federal statutory income tax benefit based on loss from continuing operations before income taxes with the Company’s income tax (benefit) provision (in thousands):
| For the year ended December 27, 2009 |
For the year ended December 28, 2008 |
For the year ended December 30, 2007 |
||||||||||
| Income tax benefit at U.S. statutory rate |
$ | (14,715 | ) | $ | (3,494 | ) | $ | (9,942 | ) | |||
| Foreign rate differential |
(324 | ) | (176 | ) | (453 | ) | ||||||
| State taxes, net of federal benefit |
151 | (215 | ) | (631 | ) | |||||||
| Impairment of goodwill |
3,904 | — | — | |||||||||
| Change in valuation allowance |
9,267 | 14,758 | (16,665 | ) | ||||||||
| Other |
(4,672 | ) | (8,806 | ) | 8,230 | |||||||
| Income tax (benefit) provision |
$ | (6,389 | ) | $ | 2,067 | $ | (19,461 | ) | ||||
During the first quarter of fiscal year 2009, the Company recorded an adjustment to correct an error in its previously reported deferred tax liabilities. The adjustment increased its income tax benefit and decreased its deferred tax liabilities (noncurrent) by $5.1 million. The Company determined that this adjustment was immaterial to its current and prior period financial statements. If the adjustment had been recorded to the corresponding prior period financial statements, it would have increased (decreased) income tax provision by approximately $0.7 million, $2.4 million and $(8.0) million in fiscal years 2008, 2007 and 2006, respectively, and increased other comprehensive income by $0.2 million in 2008. The $5.1 million benefit is included in Other in the above reconciliation.
44
Table of Contents
SOLO CUP COMPANY AND SUBSIDIARIES
NOTES TO CONSOLIDATED FINANCIAL STATEMENTS
The Company’s deferred tax assets and liabilities are as follows (in thousands):
| December 27, 2009 | December 28, 2008 | |||||||
| Deferred tax assets attributable to: |
||||||||
| Net operating loss and other carryforwards |
$ | 99,731 | $ | 88,706 | ||||
| Pensions and other postretirement benefits |
14,576 | 15,017 | ||||||
| Inventory |
16,221 | 18,198 | ||||||
| Employee benefit accruals |
7,547 | 8,453 | ||||||
| Accounts receivable |
12,016 | 16,266 | ||||||
| Accrued customer allowances |
626 | 1,151 | ||||||
| Intangible assets |
12,155 | 8,910 | ||||||
| Sale-leaseback |
17,547 | 18,550 | ||||||
| Unrealized losses |
290 | — | ||||||
| Other accruals |
17,555 | 7,426 | ||||||
| Gross deferred tax assets |
198,264 | 182,677 | ||||||
| Valuation allowance |
(115,822 | ) | (102,526 | ) | ||||
| Net deferred tax assets |
82,442 | 80,151 | ||||||
| Deferred tax liabilities attributable to: |
||||||||
| Property, plant and equipment |
85,983 | 87,418 | ||||||
| Unrealized gains |
— | 1,701 | ||||||
| Gross deferred tax liabilities |
85,983 | 89,119 | ||||||
| Net deferred tax liabilities |
$ | (3,541 | ) | $ | (8,968 | ) | ||
As of December 27, 2009, the Company had approximately $263.8 million of U.S. federal tax net operating loss carryforwards that expire between 2024 and 2029, none of which is subject to the provisions of Internal Revenue Code Section 382. The Company establishes a valuation allowance for deferred tax assets when the amount of expected future taxable income is not likely to support the use of the deduction or credit. In assessing the realizability of deferred tax assets, management of the Company considers whether it is more likely than not that some portion or all of the deferred tax assets will not be realized. The ultimate realization of deferred tax assets is dependent upon the generation of future taxable income during the periods in which those temporary differences become deductible. Management considers the scheduled reversal of deferred tax liabilities, projected future taxable income, and tax planning strategies in making this assessment.
Based upon the level of historical pre-tax losses and projections for future taxable income over the periods in which the deferred tax assets are deductible, management concluded during 2006 that it was more likely than not that the Company would not fully realize the benefits of its deductible differences. Accordingly, the Company recorded an income tax provision of $119.6 million during 2006 to establish a valuation allowance for its net deferred tax assets, including federal and state net operating loss carryforwards and other deferred tax assets. During the year ended December 27, 2009, the Company’s U.S. valuation allowance increased by $11.6 million, of which all related to activity from continuing operations.
In 2009, the Company assessed the realizability of the deferred tax assets of its European operations and concluded that it was more likely than not that it would not fully realize the benefits of its existing deferred tax assets and established a valuation allowance in the amount of $1.6 million.
It is Solo Delaware’s intention to permanently reinvest undistributed earnings in its foreign subsidiaries with the exception of $5.1 million of undistributed Canadian earnings. In 2007, a provision was recorded for future income taxes related to the U.S. tax consequences of the $5.1 million of undistributed Canadian earnings and as of December 27, 2009, these undistributed Canadian earnings had not been remitted. A provision has not been made for future income taxes for the remaining undistributed earnings of certain foreign subsidiaries, as these earnings are considered indefinitely reinvested in these operations. As of December 27, 2009, such aggregated earnings for which taxes have not been provided were $61.7 million.
In July 2006, the FASB issued new guidance that changed the threshold for recognizing the benefit of an uncertain tax position, prescribed a method for measuring the tax benefit to be recorded and required incremental quantitative and qualitative disclosures about uncertain tax positions. Under the new guidance, a tax position that meets a more likely than not recognition threshold, based solely on the technical merits of the position, is recognized in the consolidated financial statements. A tax position is measured at the largest amount of benefit that is more likely than not to be realized upon ultimate settlement. The Company adopted these provisions on January 1, 2007. The implementation did not result in a change in the estimated liability for unrecognized tax benefits at January 1, 2007. These provisions are included within FASB ASC Topic 740, Income Taxes.
45
Table of Contents
SOLO CUP COMPANY AND SUBSIDIARIES
NOTES TO CONSOLIDATED FINANCIAL STATEMENTS
The Company recognizes interest and penalties related to unrecognized tax benefits as income tax expense. As of December 27, 2009, the Company had accrued approximately $0.2 million for interest and penalties.
Solo Delaware and its subsidiaries file income tax returns in U.S. and Canadian federal jurisdictions, and various states, provinces and foreign jurisdictions. The Company’s U.S. tax returns remain subject to examination for the year ended December 31, 2004 and all subsequent periods. The Company’s Canadian federal tax returns remain subject to examination for the fiscal year ended December 31, 2004 and all subsequent periods. The Company’s United Kingdom returns remain subject to examination for the year ended December 31, 2003, and all subsequent periods.
A reconciliation of the beginning and ending amount of unrecognized tax benefits is as follows:
| For the year ended December 27, 2009 |
For the year ended December 28, 2008 |
|||||||
| Balance at the beginning of the year |
$ | 8,137 | $ | 8,790 | ||||
| Additions related to tax positions taken in the current year |
607 | 1,127 | ||||||
| Additions related to tax position taken in previous years |
1,329 | 552 | ||||||
| Reduction in tax position taken in previous years |
(1,631 | ) | (2,332 | ) | ||||
| Balance at the end of the year |
$ | 8,442 | $ | 8,137 | ||||
Included in the unrecognized tax benefits of $8.4 million as of December 27, 2009 is $0.9 million of tax benefits that, if recognized, would reduce the Company’s annual effective tax rate. Further, the Company is unaware of any positions for which it is reasonably possible that the total amounts of unrecognized tax benefits will significantly increase or decrease within the next twelve months.
46
Table of Contents
SOLO CUP COMPANY AND SUBSIDIARIES
NOTES TO CONSOLIDATED FINANCIAL STATEMENTS
| (9) | Debt |
A summary of long-term debt is as follows (in thousands):
| December 27, 2009 |
December 28, 2008 | ||||||
| Long-term debt: |
|||||||
| 10.5% Senior Secured Notes due 2013 |
$ | 300,000 | $ | — | |||
| Unamortized discount |
(5,703 | ) | — | ||||
| 10.5% Senior Secured Notes due 2013, net |
294,297 | — | |||||
| 8.5% Senior Subordinated Notes due 2014 |
325,000 | 325,000 | |||||
| Asset-based Revolving Credit Facility |
15,000 | — | |||||
| First Lien Credit Facility – Term Loan |
— | 361,954 | |||||
| First Lien Credit Facility – Revolver |
— | 28,000 | |||||
| Canadian Credit Facility – Term Loan |
404 | 1,532 | |||||
| Capital lease obligations |
1,388 | 1,704 | |||||
| Total long-term debt |
636,089 | 718,190 | |||||
| Less: Current maturities of long-term debt |
779 | 1,368 | |||||
| Long-term debt, net of current maturities |
$ | 635,310 | $ | 716,822 | |||
Scheduled maturities of long-term debt at December 27, 2009, excluding capital lease obligations (Note 10), are as follows (in thousands):
| 2010 |
$ | 404 | |
| 2011 |
— | ||
| 2012 |
— | ||
| 2013 |
315,000 | ||
| 2014 |
325,000 | ||
| $ | 640,404 | ||
On July 2, 2009, Solo Delaware and Solo Cup Operating Corporation issued $300.0 million of 10.5% Senior Secured Notes due 2013, and the Company entered into a new asset-based revolving credit facility providing for borrowings of up to $200.0 million subject to borrowing base limitations and other specified terms and conditions. The Company used the initial borrowings under its asset-based revolving credit facility of $28.3 million, together with the net proceeds of $293.8 million from the issuance of its senior secured notes, to (1) repay the $300.9 million of borrowings outstanding, including accrued interest thereon, under the first lien credit facility, (2) pay $17.3 million of debt issuance costs relating to the senior secured notes and the asset-based revolving credit facility, and (3) provide $3.9 million for operating needs. The Company deferred the debt issuance costs and will amortize them through 2013, when the senior secured notes and borrowings under the asset-based revolving credit facility mature. During the third and fourth quarter of 2009, the Company incurred additional debt issuance costs. Unamortized debt issuance costs of $16.8 million are included in other assets on the Company’s Consolidated Balance Sheet as of December 27, 2009.
In connection with these refinancing transactions, the Company reclassified $9.1 million of unrealized losses associated with existing interest rate swap agreements from accumulated other comprehensive loss to interest expense during the thirteen weeks ended June 28, 2009. See further description in Note 11. In addition, the unamortized balance of debt issuance costs related to the first lien credit facility of $2.5 million was written off in July during the thirteen weeks ended September 27, 2009 as a result of the refinancing.
47
Table of Contents
SOLO CUP COMPANY AND SUBSIDIARIES
NOTES TO CONSOLIDATED FINANCIAL STATEMENTS
10.5% Senior Secured Notes
Solo Delaware and Solo Cup Operating Corporation co-issued the senior secured notes under an indenture, dated as of July 2, 2009, among the co-issuers, SF Holdings, Solo Manufacturing LLC, P. R. Solo Cup, Inc., Solo Cup Owings Mills Holdings, Lily-Canada Holding Corporation, Solo Cup (UK) Limited, Insulpak Holdings Limited and Solo Cup Europe Limited, as guarantors, and U.S. Bank National Association, as trustee. The senior secured notes mature on November 1, 2013 and bear interest at a rate of 10.5% per annum. Interest on the senior secured notes is payable semi-annually on May 1 and November 1 of each year. The Company made its first interest payment on November 1, 2009. The senior secured notes were issued at 97.928% of their aggregate principal amount for gross proceeds of $293.8 million, representing a yield to maturity of 11.125%.
At any time prior to May 1, 2011, the Company may, on one or more than one occasion, redeem some or all of the senior secured notes at any time at a redemption price equal to 100% of the principal amount of the senior secured notes redeemed, plus a “make-whole” premium as of, and any accrued and unpaid interest to, the applicable redemption date. In addition, at any time prior to May 1, 2011, the Company also may redeem up to 35% of the aggregate principal amount of senior secured notes, using the proceeds of qualifying equity offerings, at a redemption price of 110.5% of the principal amount of the notes redeemed and may, not more than once in any 12-month period, redeem up to 10% of the original aggregate principal amount of the senior secured notes at a redemption price of 103%, in each case, plus any accrued and unpaid interest to the applicable redemption date.
On or after May 1, 2011, the Company may redeem all or a part of the senior secured notes at a redemption price equal to a percentage of the principal amount thereof, plus any accrued and unpaid interest. If redeemed during the twelve-month period beginning May 1, 2011, the redemption price would be 105.25%. If redeemed on May 1, 2010 or thereafter, the redemption price would be 100%.
If specified change of control events occur, the Company must offer to repurchase the senior secured notes at a repurchase price equal to 101% of the principal amount of the senior secured notes repurchased, plus any accrued and unpaid interest to the applicable repurchase date. If the Company sells assets under specified circumstances, it must offer to repurchase the senior secured notes at a repurchase price equal to 100% of the principal amount of the senior secured notes repurchased, plus any accrued and unpaid interest to the applicable repurchase date.
The indenture contains covenants that, among other things, restrict the ability of Solo Delaware and its restricted subsidiaries to incur additional debt or issue disqualified stock or preferred stock; create liens; pay dividends; make investments or make other restricted payments, sell assets, consolidate, merge, sell or otherwise dispose of all or substantially all of the assets of Solo Delaware and its restricted subsidiaries; enter into transactions with affiliates; and designate subsidiaries as unrestricted. These covenants are subject to a number of important limitations and exceptions.
Asset-Based Revolving Credit Facility
The asset-based revolving credit facility provides for revolving credit financing of up to $200.0 million, including a $40.0 million sub-limit for letters of credit, and has a maturity date of July 2, 2013.
The Company’s ability to borrow under the asset-based revolving credit facility is limited to a borrowing base equal to 85% of eligible accounts receivable plus the lower of (1) 65% of eligible inventory and (2) 85% of the net orderly liquidation value of eligible inventory, minus availability reserves, and is subject to other conditions, limitations and reserve requirements.
Under the asset-based revolving credit facility, the Company has the right to increase the aggregate principal amount of the commitments from time to time, in an aggregate amount not to exceed $100.0 million, without the consent of any lender (other than the lenders participating in such increase), so long as any such increase is at least $25.0 million, subject to borrowing base limitations and other specified terms and conditions.
Interest accrues on outstanding borrowings under the asset-based revolving credit facility at a rate of either LIBOR (as defined in the asset-based revolving credit facility) plus a margin of 4% per annum or a specified base rate plus a margin of 3% per annum, at the option of the Company. These interest rate margins are subject to adjustment after July 2, 2010 based on borrowing base availability. As of December 27, 2009, outstanding borrowings under the asset-based revolving credit facility bore interest at an effective rate of 6.25%.
48
Table of Contents
SOLO CUP COMPANY AND SUBSIDIARIES
NOTES TO CONSOLIDATED FINANCIAL STATEMENTS
8.5% Senior Subordinated Notes
On February 27, 2004, Solo Delaware issued $325.0 million of 8.5% Senior Subordinated Notes due 2014 under an indenture among the issuer, the initial guarantors identified therein and U.S. Bank National Association, as trustee. The senior subordinated notes mature on February 15, 2014 and bear interest at a rate of 8.5% per annum. Interest on the senior subordinated notes is payable semi-annually on February 15 and August 15 of every year. The Company has made all scheduled interest payments to date.
The senior subordinated notes were not redeemable before February 15, 2009. Starting on that date, the Company has the option to redeem all or a portion of the senior subordinated notes at a redemption price equal to a percentage of the principal amount thereof plus accrued interest. If redeemed during the twelve-month period from February 15, 2009, the applicable percentage was 104.25%; from February 15, 2010 the applicable percentage is 102.833%; from February 15, 2011 the applicable percentage is 101.417% and from February 15, 2012 and thereafter, the applicable percentage is 100% of the principal amount to be redeemed. The senior subordinated notes provide that upon the occurrence of a change of control, as defined, the holders thereof will have an option to require the redemption of the notes at a redemption price equal to 101% of the principal amount thereof, plus accrued interest. The indenture governing the senior subordinated notes contains various covenants which, subject to specified exceptions, prohibit, or limit, among other things, asset sales, changes of control, dividend payments, equity repurchases or redemptions, the incurrence of additional debt, the issuance of disqualified stock, specified transactions with affiliates, the creation of additional liens and specified other business activities.
Canadian Credit Facility
On September 24, 2004, Solo Cup Canada Inc., a Canadian subsidiary of Solo Delaware, entered into a credit agreement with GE Canada Finance Holding Company. The credit agreement was subsequently amended by an agreement dated as of October 19, 2006 and by a second amendment dated as of November 16, 2007. The Canadian credit facility expires September 29, 2011. The maximum amount available, subject to borrowing base limitations and other specified terms and conditions, is CAD 30.0 million (approximately $28.6 million), with a term facility maximum of CAD 17.5 million (approximately $16.7 million) and a revolving credit facility maximum of CAD 12.5 million (approximately $11.9 million) that increases to CAD 16.5 million (approximately $15.7 million), on a dollar for dollar basis, as the term loan’s outstanding balance is reduced.
Solo Cup Canada may use the proceeds from the facilities or cash on hand to make investments in its affiliates or in businesses that are substantially similar to Solo Canada up to a maximum of CAD 10.0 million (approximately $9.5 million). Solo Cup Canada may also make a one-time capital expenditure of CAD 6.0 million (approximately $5.7 million) to provide for increased manufacturing capacity. The minimum fixed charge ratio is 1.25:1 on a rolling twelve-month basis.
The second amendment provided, among other things, that Solo Cup Canada may issue letters of credit, subject to specified conditions, for up to CAD 11.0 million (approximately $10.5 million) and that up to CAD 10.0 million (approximately $9.5 million) of the CAD 11.0 million (approximately $10.5 million) limit may be issued on Solo Cup Canada’s account on behalf of the Company to beneficiaries identified by the Company.
Applicable interest rates under the revolving and term loan facility are the Canadian prime rate plus 0.25%, or the Canadian bankers’ acceptance rate plus 1.5%, at Solo Cup Canada’s option. At December 27, 2009, there was no balance outstanding on the revolving facility, the term loan balance was CAD 0.4 million (approximately $0.4 million) and bore interest at an effective rate of approximately 1.90%.
49
Table of Contents
SOLO CUP COMPANY AND SUBSIDIARIES
NOTES TO CONSOLIDATED FINANCIAL STATEMENTS
| (10) | Leases |
The gross amount of machinery and equipment held under capital leases, and related accumulated amortization, were as follows (in thousands):
| December 27, 2009 | December 28, 2008 | |||||||
| Machinery and equipment |
$ | 1,673 | $ | 1,538 | ||||
| Less accumulated amortization |
(781 | ) | (369 | ) | ||||
| $ | 892 | $ | 1,169 | |||||
Capital lease obligations were $1.4 million and $1.7 million as of December 27, 2009 and December 28, 2008, respectively. As of December 28, 2008, capital lease obligations consisted of various machines with leases expiring between 2011 and 2014. Amortization expense was $0.2 million for each of the years ended December 27, 2009, December 28, 2008 and December 30, 2007.
The Company also has several non-cancelable operating leases that expire over the next 19 years and provide for renewal terms. These include property leases with escalation clauses averaging 2% to 5% annually, as well as leases of machinery, office equipment and vehicles.
In June 2007, the Company entered into a lease agreement in conjunction with the sale of six of its manufacturing facilities. The sale proceeds of $130.0 million were used to retire the second lien credit facility. Upon the sale of the six properties, the Company immediately leased them back pursuant to a 20-year term lease. The lease contains four five-year renewal term options and is non-cancelable. Rent is payable on a quarterly basis, due on the first day of each calendar quarter, with an annual 2% escalation. Annual rent expense of $14.2 million is recognized on a straight-line basis over the 20-year term of the lease. Payments during fiscal years 2009 and 2008 were $9.1 million and $11.8 million, respectively. The fourth quarterly payment in 2009 of approximately $3.0 million was paid subsequent to December 27, 2009, the Company’s fiscal year end. Net property, plant and equipment was reduced in 2007 by the carrying values of the six properties sold, which amounted to approximately $73.0 million, of which $65.5 million was buildings and improvements and $7.5 million was land. The resulting gain of approximately $53.2 million (net of $3.7 million of closing costs) was recorded as a deferred credit in the Company’s Consolidated Balance Sheet. The remaining deferred credit is being amortized to income on a straight-line basis as an offset to rent expense over the 20-year lease term. As of December 27, 2009, the remaining deferred credit was $46.2 million, of which $2.6 million was included in other current liabilities. As of December 28, 2008, the deferred credit was $48.8 million, of which $2.6 million was included in other current liabilities.
As of December 27, 2009, future minimum lease payments for capital leases and non-cancelable operating leases having an initial or remaining noncancelable lease term in excess of one year, were as follows (in thousands):
| Capital Leases |
Operating Leases | ||||||
| For the fiscal year: |
|||||||
| 2010 |
$ | 351 | $ | 46,144 | |||
| 2011 |
339 | 42,606 | |||||
| 2012 |
323 | 40,884 | |||||
| 2013 |
323 | 39,333 | |||||
| 2014 |
242 | 37,634 | |||||
| Thereafter |
— | 354,180 | |||||
| Total minimum lease payments |
1,578 | $ | 560,781 | ||||
| Less amounts representing interest |
(190 | ) | |||||
| Present value of minimum payments on capital leases |
$ | 1,388 | |||||
Future minimum rental payments to be received under noncancelable subleases as of December 27, 2009 totaled approximately $3.0 million. Total rental expense for operating leases, including rentals on month-to-month leases, was $50.6 million, $51.5 million and $45.5 million for the years ended December 27, 2009, December 28, 2008 and December 30, 2007, respectively.
50
Table of Contents
SOLO CUP COMPANY AND SUBSIDIARIES
NOTES TO CONSOLIDATED FINANCIAL STATEMENTS
| (11) | Fair Value of Financial Instruments |
Fair Value Measurements
The Company’s financial instruments consist primarily of cash equivalents, accounts receivable, accounts payable, derivative financial instruments and debt, including obligations under capital leases. The carrying values of financial instruments other than fixed-rate debt approximated their fair values as of December 27, 2009 and December 28, 2008 due to their short-term maturities or market rates of interest. The fair value of the Company’s floating-rate debt as of December 27, 2009 and December 28, 2008 approximated its carrying value due to the Company’s ability to borrow at comparable terms in the open market. The fair value of investments held within the Company’s defined benefit pension plan trusts are further described in Note 12.
The Company’s 8.5% Senior Subordinated Notes (Note 9) had a carrying value of $325.0 million and an estimated fair value of $320.9 million and $219.1 million as of December 27, 2009 and December 28, 2008, respectively. The fair value of these notes was determined based on the price of the last trade of the debt on December 24, 2009 and December 26, 2008, the last business day of each respective fiscal period. These estimated fair values were determined using Level 1 inputs of the fair value hierarchy, as defined in FASB ASC Topic 820, Fair Value Measurements and Disclosures.
The Company’s 10.5% Senior Secured Notes, issued on July 2, 2009 (Note 9), had a carrying value of $294.3 million and an estimated fair value of $312.0 million at December 27, 2009. The fair value of these notes was determined based on the average of the bid price (low) and ask price (high) as of December 24, 2009, the last business day of the fiscal year. The estimated fair value was determined using Level 1 inputs of the fair value hierarchy, as defined in FASB ASC Topic 820.
The fair value hierarchy consists of three levels:
| • | Level 1 fair values are valuations based on quoted market prices in active markets for identical assets or liabilities that the entity has the ability to access; |
| • | Level 2 fair values are those valuations based on quoted prices for similar assets or liabilities, quoted prices in markets that are not active, or other inputs that are observable or can be corroborated by observable data for substantially the full term of the assets or liabilities; and |
| • | Level 3 fair values are valuations based on inputs that are supported by little or no market activity and that are significant to the fair value of the assets or liabilities. |
The Company’s interest rate swap agreements, described below, are measured at fair value on a recurring basis using Level 2 inputs in the fair value hierarchy. The Company uses an income approach to value the outstanding interest rate swaps. The income approach consists of a discounted cash flow model that takes into account the present value of future cash flows under the terms of the contracts incorporating observable market inputs as of the reporting date such as prevailing interest rates. Both the counterparty credit risk and the Company’s credit risk are considered in the fair value determination. Further, any credit valuation adjustments are considered when assessing the effectiveness and measuring the ineffectiveness of qualified hedging relationships.
Interest Rate Swap Agreements
As of December 27, 2009, the Company had outstanding interest rate swap agreements with a notional amount of $150 million that were originally entered into to hedge a portion of the Company’s exposure to interest rate risk under its variable-rate first lien facility term loan borrowings. The interest rate swaps were designated and qualified as highly effective cash flow hedges. As of June 28, 2009, these swaps no longer qualified for hedge accounting because the Company’s first lien credit facility was extinguished in conjunction with the Company’s July 2009 refinancing transactions, as further described in Note 9. As a result of the refinancing transactions, the counterparty to the interest rate swaps required the Company to post a specified amount of collateral against the current market value of the swaps. The Company’s obligation to post collateral will continue through the expiration date of the swaps in February 2011. The balance of such collateral at December 27, 2009 of $10.4 million is included in restricted cash on the Company’s Consolidated Balance Sheet. The amount of collateral that must remain on account with the counterparty will fluctuate based on future changes in the estimated fair value of the swaps.
When the interest rate swaps had been designated as cash flow hedges, the mark-to-market changes on the swaps had been reported as a component of accumulated other comprehensive income (loss) in accordance with FASB ASC Topic 815, Derivatives. As a result of the refinancing, the hedged forecasted payments of variable-rate interest under the first lien borrowings were no longer probable of occurring. Accordingly, the Company discontinued hedge accounting prospectively, and, as a result, the cumulative mark-to-market loss of $9.1 million associated with these swaps was reclassified from accumulated other comprehensive loss to interest expense in June 2009. Because the swaps no longer qualified for hedge accounting, during the third and fourth fiscal quarters of 2009 the mark-to-market loss of these interest rate swaps of $2.8 million was recognized as interest expense.
51
Table of Contents
SOLO CUP COMPANY AND SUBSIDIARIES
NOTES TO CONSOLIDATED FINANCIAL STATEMENTS
The location and amount of all gains or losses recognized in income on the interest rate swaps, including the reclassification from accumulated other comprehensive loss to interest expense are as follows (in millions):
| Amount of Loss (Gain) Recognized during the Year Ended | ||||||||||||
| Derivative Instruments |
Location in Consolidated Statements of Operations |
December 27, 2009 | December 28, 2008 | December 30, 2007 | ||||||||
| Interest rate swaps |
Interest expense (income), net | $ | 6.3 | $ | 4.1 | $ | (0.6 | ) | ||||
| Interest rate swaps |
Reclassification of unrealized loss on cash flow hedges to interest expense | 9.1 | — | — | ||||||||
The reclassification adjustment from accumulated other comprehensive income (loss) for gains (losses) realized in net earnings, net of tax, was $(3.5) million, $(4.2) million and $0.1 million for the years ended December 27, 2009, December 28, 2008 and December 30, 2007, respectively.
The interest rate swaps are reported as current or non-current liabilities at fair value on the Company’s Consolidated Balance Sheets based on their expiration dates as shown in the table below:
| Effective Date |
Expiration Date |
Fixed Rate Paid |
Notional Amount (millions) |
Fair Value at December 27, 2009 (millions) |
Fair Value at December 28, 2008 (millions) |
|||||||||||||
| Receive-variable (Eurodollar), pay-fixed interest rate swap |
10/2/2007 | 4/2/2009 | 4.6475 | % | $ | 50.0 | $ | — | $ | (0.5 | ) | |||||||
| Three receive-variable (Eurodollar), pay-fixed interest rate swaps |
8/28/2007 | 2/28/2011 | 5.3765 | % | 150.0 | (8.3 | ) | (10.6 | ) | |||||||||
| $ | 200.0 | $ | (8.3 | ) | $ | (11.1 | ) | |||||||||||
In March 2004, June 2005 and March 2006, the Company entered into receive-variable, pay-fixed interest rate swaps with a total notional amount of $300.0 million. In September 2006, the Company terminated these agreements prior to their stated expiration dates. Through the termination date, these interest rate swap agreements were accounted for as cash flow hedges and their fair values were included in other current assets and other assets on the Company’s Consolidated Balance Sheets. Included in accumulated other comprehensive income (loss) was a deferred gain on the qualified hedged transactions of $0.2 million, net of tax, as of December 28, 2008. The deferred gain was amortized over the remaining term of the underlying first lien term debt, increasing interest income and income tax expense. The remaining deferred gain of $0.1 million as of June 28, 2009 was fully amortized in July 2009 as a result of the extinguishment of the underlying debt.
As of December 27, 2009, the Company had no outstanding derivatives designated as part of a cash flow or fair value hedging relationship and no hedges of the foreign currency exposure of a net investment in a foreign operation. As of December 28, 2008, the Company had no outstanding derivatives designated as part of a fair value hedging relationship and no hedges of the foreign currency exposure of a net investment in a foreign operation.
52
Table of Contents
SOLO CUP COMPANY AND SUBSIDIARIES
NOTES TO CONSOLIDATED FINANCIAL STATEMENTS
| (12) | Pensions and Other Postretirement Benefits |
The Company sponsors defined benefit pension plans and a postretirement health care plan for certain U.S. employees. These plans provide certain union and non-union employees with retirement and disability income benefits. Pension costs are based upon the actuarially determined normal costs, plus interest on and amortization of the unfunded liabilities. These plans are frozen to new participants and the benefits for the majority of the participants in the pension plans are frozen. The Company’s policy has been to fund annually the minimum contributions required by applicable regulations. Plan assets for the U.S. pension plans are held in retirement trust funds with investments primarily in common stock, corporate bonds and government securities. The postretirement health care plan covers a small group of retirees. The plan, in most cases, pays stated percentages of most medical expenses incurred by retirees after subtracting payments by Medicare or other providers and after a stated deductible has been met. The plan is contributory, with retiree contributions adjusted annually.
The Company also sponsors defined benefit pension plans and a postretirement health care plan that covers all Solo Cup Canada employees who meet certain length of service requirements. These plans provide certain union and non-union employees with retirement and disability income benefits. The Company’s funding policy is to contribute amounts necessary to satisfy the amounts required by local laws and regulations. Plan assets for the Solo Cup Canada pension plans are held in retirement trust funds with investments primarily in common stock, corporate bonds and government securities.
The Company also sponsors a noncontributory defined benefit pension plan that covers all Solo Cup Europe Limited employees who meet certain length of service requirements. Plan benefits are based on participants’ compensation during their final year of service. The Company’s funding policy is to contribute amounts necessary to satisfy the amounts required by local laws and regulations. Plan assets for the Solo Cup Europe Limited pension plan are held in retirement trust funds with investments primarily in common stock, corporate bonds and government securities.
In September 2006, the FASB issued a new standard that was effective for fiscal years ending after December 15, 2007, for companies without publicly-traded equity securities. The provisions of this new standard are included in the FASB ASC under Topic 715, Compensation – Retirement Benefits. The standard required the full recognition of the overfunded or underfunded status of a defined benefit postretirement plan as an asset or liability in the balance sheet. This statement also requires that subsequent changes in that funded status be recognized during the year of the change through other comprehensive income (loss). The Company does not have publicly-traded equity securities and, therefore, adopted these provisions during its 2007 fiscal year. The incremental effect was a decrease in other comprehensive income of $1.5 million for the 2007 fiscal year.
In addition to the recognition provisions described above, the new standard also requires companies to measure the funded status of the plan as of the date of their fiscal year end, effective for fiscal years ending after December 15, 2008. The Company adopted these measurement provisions effective December 28, 2008 for its pension and other postretirement plans. As a result, the net periodic benefit cost for the period between the earlier measurement date (September 30, 2007) and the new measurement date (December 28, 2008) was allocated proportionately between amounts recognized as an adjustment of retained earnings (accumulated deficit) and net periodic benefit cost for the 2008 fiscal year. Accordingly, the amount recognized as an increase to accumulated deficit was approximately $0.2 million.
53
Table of Contents
SOLO CUP COMPANY AND SUBSIDIARIES
NOTES TO CONSOLIDATED FINANCIAL STATEMENTS
The following table sets forth the change in benefit obligation for the Company’s benefit plans (in thousands):
| Pension Benefits | Other Postretirement Benefits | |||||||||||||||
| For the year ended | ||||||||||||||||
| December 27, 2009 |
December 28, 2008 |
December 27, 2009 |
December 28, 2008 |
|||||||||||||
| Change in benefit obligation: |
||||||||||||||||
| Benefit obligation at beginning of year |
$ | 103,457 | $ | 123,653 | $ | 11,934 | $ | 12,772 | ||||||||
| Service cost |
925 | 1,105 | 35 | 55 | ||||||||||||
| Interest cost |
7,065 | 7,154 | 773 | 682 | ||||||||||||
| Impact of measurement date change |
— | 225 | — | (34 | ) | |||||||||||
| Curtailment loss |
— | (17 | ) | — | — | |||||||||||
| Actuarial losses (gains) |
13,392 | (10,603 | ) | (4,243 | ) | 485 | ||||||||||
| Foreign currency exchange rate changes |
4,767 | (10,635 | ) | 182 | (263 | ) | ||||||||||
| Plan participant contributions |
163 | 223 | 566 | 660 | ||||||||||||
| Benefits paid |
(6,859 | ) | (7,648 | ) | (1,325 | ) | (2,423 | ) | ||||||||
| Benefit obligation at end of year |
$ | 122,910 | $ | 103,457 | $ | 7,922 | $ | 11,934 | ||||||||
| Change in plan assets: |
||||||||||||||||
| Fair value of plan assets at beginning of year |
$ | 77,311 | $ | 119,657 | $ | — | $ | — | ||||||||
| Actual return on plan assets |
15,060 | (27,764 | ) | — | — | |||||||||||
| Impact of measurement date change |
— | (937 | ) | — | — | |||||||||||
| Foreign currency exchange rate changes |
4,506 | (9,924 | ) | — | — | |||||||||||
| Employer contributions |
3,386 | 3,704 | 759 | 1,763 | ||||||||||||
| Plan participant contributions |
163 | 223 | 566 | 660 | ||||||||||||
| Benefits paid |
(6,859 | ) | (7,648 | ) | (1,325 | ) | (2,423 | ) | ||||||||
| Fair value of plan assets at end of year |
$ | 93,567 | $ | 77,311 | $ | — | $ | — | ||||||||
| Funded Status - Benefit Obligation in Excess of Plan Assets |
$ | (29,343 | ) | $ | (26,146 | ) | $ | (7,922 | ) | $ | (11,934 | ) | ||||
| Pension Benefits | Other Postretirement Benefits | |||||||||||||||
| December 27, 2009 |
December 28, 2008 |
December 27, 2009 |
December 28, 2008 |
|||||||||||||
| Noncurrent assets |
$ | 42 | $ | — | $ | — | $ | — | ||||||||
| Current liabilities |
(457 | ) | (451 | ) | (1,125 | ) | (1,854 | ) | ||||||||
| Noncurrent liabilities |
(28,928 | ) | (25,695 | ) | (6,797 | ) | (10,080 | ) | ||||||||
| Net amount recognized at end of year |
$ | (29,343 | ) | $ | (26,146 | ) | $ | (7,922 | ) | $ | (11,934 | ) | ||||
| Prior service (cost) credit |
$ | (1,017 | ) | $ | (1,221 | ) | $ | 5,176 | $ | 5,610 | ||||||
| Net actuarial loss |
(28,742 | ) | (26,630 | ) | (1,356 | ) | (5,922 | ) | ||||||||
| Accumulated other comprehensive (loss) income |
$ | (29,759 | ) | $ | (27,851 | ) | $ | 3,820 | $ | (312 | ) | |||||
54
Table of Contents
SOLO CUP COMPANY AND SUBSIDIARIES
NOTES TO CONSOLIDATED FINANCIAL STATEMENTS
The estimated amount that will be amortized from accumulated other comprehensive income (loss) into net periodic benefit cost (income) in 2010 is as follows (in thousands):
| Pension Benefits | Other Postretirement Benefits |
||||||
| Recognized net actuarial loss |
$ | 2,290 | $ | 53 | |||
| Amortization of prior service cost (credit) |
204 | (435 | ) | ||||
| Total loss (income) |
$ | 2,494 | $ | (382 | ) | ||
The accumulated benefit obligation for all defined benefit pension plans was approximately $118.6 million and $101.7 million at December 27, 2009 and December 28, 2008, respectively. The following table presents aggregated information for individual pension plans with an accumulated benefit obligation in excess of plan assets as of December 27, 2009 and December 28, 2008 (in thousands):
| December 27, 2009 |
December 28, 2008 | |||||
| Projected benefit obligation |
$ | 97,136 | $ | 85,196 | ||
| Accumulated benefit obligation |
97,136 | 85,196 | ||||
| Fair value of plan assets |
68,324 | 59,397 | ||||
For the year ended December 30, 2007, $3.9 million of income, net of tax, was recognized in other comprehensive income as a reduction in the minimum pension liability.
Net periodic benefit cost for the Company’s pension and other postretirement benefit plans consists of the following (in thousands):
| For the year ended | ||||||||||||
| December 27, 2009 | December 28, 2008 | December 30, 2007 | ||||||||||
| Pension Benefits |
||||||||||||
| Service cost |
$ | 925 | $ | 1,105 | $ | 1,469 | ||||||
| Interest cost |
7,065 | 7,154 | 6,879 | |||||||||
| Expected return on plan assets |
(5,864 | ) | (8,756 | ) | (7,849 | ) | ||||||
| Amortization of prior service cost |
204 | 205 | 205 | |||||||||
| Amortization of net loss |
2,201 | 2 | 244 | |||||||||
| Net periodic benefit cost (income) |
$ | 4,531 | $ | (290 | ) | $ | 948 | |||||
| Other Postretirement Benefits |
||||||||||||
| Service cost |
$ | 35 | $ | 55 | $ | 55 | ||||||
| Interest cost |
773 | 682 | 911 | |||||||||
| Amortization of prior service credit |
(435 | ) | (435 | ) | (253 | ) | ||||||
| Amortization of net loss |
343 | 308 | 284 | |||||||||
| Net periodic benefit cost |
$ | 716 | $ | 610 | $ | 997 | ||||||
55
Table of Contents
SOLO CUP COMPANY AND SUBSIDIARIES
NOTES TO CONSOLIDATED FINANCIAL STATEMENTS
Key assumptions - The following weighted-average assumptions were used to determine the benefit obligation at fiscal year-end and the net periodic benefit cost for each fiscal year:
| Pension Benefits | Other Postretirement Benefits | |||||||||||
| 2009 | 2008 | 2009 | 2008 | |||||||||
| To determine benefit obligation at fiscal year-end: |
||||||||||||
| Discount rate: |
||||||||||||
| North America |
5.94 | % | 7.00 | % | 5.04 | % | 6.94 | % | ||||
| Europe |
5.65 | % | 6.00 | % | — | — | ||||||
| Expected long-term rate of return on plan assets: |
||||||||||||
| North America |
7.61 | % | 7.60 | % | — | — | ||||||
| Europe |
7.70 | % | 7.40 | % | — | — | ||||||
| To determine net periodic benefit cost for each fiscal year: |
||||||||||||
| Discount rate: |
||||||||||||
| North America |
7.00 | % | 6.14 | % | 6.94 | % | 5.78 | % | ||||
| Europe |
6.00 | % | 5.80 | % | — | — | ||||||
| Expected long-term rate of return on plan assets: |
||||||||||||
| North America |
7.60 | % | 7.73 | % | — | — | ||||||
| Europe |
7.40 | % | 7.40 | % | — | — | ||||||
The Company generally estimates the discount rate for its pension and other postretirement benefit obligations based on a hypothetical investment in a portfolio of high-quality bonds that approximate the estimated cash flows of the pension and other postretirement benefit obligations. The Company believes this approach permits a matching of future cash outflows related to benefit payments with future cash inflows associated with bond coupons and maturities.
One of the pension plans for Solo Cup Canada is pay-related. The rate of compensation increase used to determine the benefit obligation as of December 27, 2009 and December 28, 2008, and the net periodic benefit cost for the plan for the fiscal years then ended was 3.50%. The discount rate is based on rates at which the pension benefit obligation could effectively be settled on a present value basis. To determine the weighted average discount rate, the Company reviews long-term, high-quality corporate bonds at its measurement date and uses a model that matches the projected benefit payments for its plans to coupons and maturities from high-quality bonds.
The expected long-term rate of return on plan assets takes into consideration historical and expected long-term returns based upon the weighted-average allocation of equities, fixed income and other asset components comprising the plans’ assets at the plans’ measurement dates.
For measurement purposes, the assumed health care cost trend rates were as follows:
| Health care cost trend rate assumed for 2009 |
8.0% – 9.0 | % | |
| Rate to which the cost trend rate is assumed to decline |
5.0 | % | |
| Year that the rate reaches the ultimate trend rate |
2015 – 2017 |
Assumed health care cost trend rates have a significant effect on the amounts reported for the health care plans. A one-percentage-point change in assumed health care cost trend rates would have the following effects (in thousands):
| 1-Percentage- Point Increase |
1-Percentage- Point Decrease |
||||||
| Effect on total of service and interest cost |
$ | 16 | $ | (14 | ) | ||
| Effect on postretirement benefit obligation |
180 | (167 | ) | ||||
56
Table of Contents
SOLO CUP COMPANY AND SUBSIDIARIES
NOTES TO CONSOLIDATED FINANCIAL STATEMENTS
Plan Assets - The weighted-average asset allocation of the Company’s pension plan assets, by category, were as follows:
| Plan Assets at | ||||||
| December 27, 2009 | December 28, 2008 | |||||
| Asset Category |
||||||
| Equity securities |
64.1 | % | 63.4 | % | ||
| Debt securities |
32.8 | 32.3 | ||||
| Real estate |
1.5 | 0.9 | ||||
| Other |
1.6 | 3.4 | ||||
| Total |
100.0 | % | 100.0 | % | ||
Each of the pension plans’ assets are invested with the objective of being able to meet current and future benefit payments needs, while maximizing total investment returns within the constraints of a prudent level of portfolio risk and diversification. The assets of each plan are diversified across asset classes to achieve an optimal balance between risk and return, and between income and growth of assets through capital appreciation.
Several external investment managers manage the assets of the pension plans and may invest in both fixed-income and equity investments. Fixed income investments may include cash and short-term instruments, U.S. government securities, corporate bonds, mortgages and other fixed income investments. Equity investments may include various types of stock, such as large-, mid-, and small-cap stocks, and foreign equities. Each investment manager is allowed to exercise investment discretion, subject to limitations, if any, established by the Company’s retirement committee for the pension plans. The retirement committee periodically reviews the performance of the investment managers and asset allocation. For the U.S. plans, Mercer Global Investments is the Manager of Investment Managers and provides expert advice and recommendations to help the retirement committee fulfill its fiduciary responsibilities in furtherance of each plans’ goals and objectives.
Fair value measurements for the pension plans’ assets at December 27, 2009 are summarized below (in thousands):
| Quoted Prices in Active Markets for Identical Inputs (Level 1) |
Significant Other Observable Inputs (Level 2) |
Significant Unobservable Inputs (Level 3) |
Total | |||||||||
| Plan net assets: |
||||||||||||
| Cash and cash equivalents |
$ | 1,645 | $ | — | $ | — | $ | 1,645 | ||||
| Common collective funds (1) |
||||||||||||
| Equity securities |
— | 30,892 | — | 30,892 | ||||||||
| Fixed-income securities |
— | 18,299 | — | 18,299 | ||||||||
| Pooled pension funds (2) |
||||||||||||
| Equity securities |
— | 15,131 | — | 15,131 | ||||||||
| Fixed-income securities |
— | 9,921 | — | 9,921 | ||||||||
| Pooled pension fund (3) |
— | 17,679 | — | 17,679 | ||||||||
| Total plan net assets at fair value |
$ | 1,645 | $ | 91,922 | $ | — | $ | 93,567 | ||||
| (1) | These common collective funds are held in the trusts for the Company’s U.S. pension plans. These funds are comprised of shares or units in commingled funds that are not publicly traded. The underlying assets in these funds (equity securities and fixed income securities) are publicly traded and price quotes for the assets held by these funds are readily available. The values of these funds are not publicly quoted and must trade through a broker. The fair values included in the above table were provided by the fund administrator who values these funds using the net asset value, or NAV, per fund share, which is based on the value of the underlying securities. |
| (2) | These pooled pension funds are held in the trusts for the Company’s Canadian pension plans. The funds are similar to the U.S. common collective funds and are priced using the same inputs. |
| (3) | This pooled pension fund is held in the trust for the Company’s European pension plan. This fund is comprised of shares or units in a commingled fund that is not publicly traded. The fair value included in the above table was provided by the fund administrator who values this fund using the net asset value, or NAV, per fund share, which is based on the value of the underlying securities. |
57
Table of Contents
SOLO CUP COMPANY AND SUBSIDIARIES
NOTES TO CONSOLIDATED FINANCIAL STATEMENTS
Contributions - The Company expects to contribute approximately $7.0 million to its pension plans and approximately $1.1 million to its other postretirement benefit plans in 2010.
Estimated future benefit payments - The following benefit payments, which reflect expected future service, as appropriate, are expected to be paid (in thousands):
| Pension Benefits | Other Postretirement Benefits | |||||
| 2010 |
$ | 7,188 | $ | 1,125 | ||
| 2011 |
7,319 | 1,095 | ||||
| 2012 |
7,476 | 1,021 | ||||
| 2013 |
7,610 | 901 | ||||
| 2014 |
7,786 | 813 | ||||
| Years 2015–2019 |
41,637 | 2,402 | ||||
Defined contribution plans - Effective January 1, 2007, the Company dissolved its former Sweetheart/Fonda Profit Sharing Retirement Plan and merged the plan assets with the existing Solo Cup Company Profit Sharing Plus Plan. This plan covers substantially all U.S. employees of Solo Cup Operating Corporation and qualifies under Section 401(k) of the Internal Revenue Code. The plan allows employees to contribute up to 75% of their qualified gross wages as defined in the plan. Prior to January 1, 2009, the Company provided a matching contribution equal to 75% of the first 2%, and 50% of the next 4%, of each employee’s eligible compensation contributed to the plan. For certain union employees, the Company provides a matching contribution equal to 100% of the first 2%, and 50% of the next 4%, of each employee’s eligible compensation contributed to the plan. In addition, the Company may make additional profit-sharing contributions at the sole discretion of the Company’s Board of Directors. On January 1, 2009, the Company, at its discretion, temporarily eliminated employer-match contributions for its employees; therefore, charges for employer contributions to the plan were nominal for the year ended December 27, 2009. Charges for employer contributions to the plan were approximately $5.6 million and $5.7 million for the years ended December 28, 2008 and December 30, 2007, respectively, and are recorded in cost of goods sold and selling, general and administrative expenses in the accompanying Consolidated Statements of Operations.
The Company also has defined contribution plans for Solo Cup Canada and Solo Cup Europe Limited employees. Charges for employer contributions to these plans were approximately $0.5 million in each of the years ended December 27, 2009, December 28, 2008 and December 30, 2007, and are recorded in cost of goods sold and selling, general and administrative expenses in the accompanying Consolidated Statements of Operations.
| (13) | Shareholder’s Equity |
On February 27, 2004, Solo Delaware received net proceeds of $229.6 million from the issuance of 100 shares of Common Stock to Solo Cup Investment Corporation and the retirement of all outstanding shares of Solo Illinois’ Class A and Class B common stock. To fund this purchase of Solo Delaware common stock, Solo Cup Investment Corporation issued $240.0 million of convertible participating preferred stock (“CPPS”) to Vestar. The CPPS pays cash dividends at a rate of 10.0% per annum on an amount equal to the sum of the original purchase price of the CPPS plus all accrued and unpaid dividends. Dividends accumulate to the extent not paid, whether or not earned or declared. As of December 27, 2009, accrued and unpaid dividends were approximately $184.7 million.
Solo Cup Investment Corporation is required to redeem the CPPS for an amount in cash equal to its original purchase price, plus all accrued and unpaid dividends, on the eleventh anniversary of its issuance. Prior to that time, the CPPS is subject to specified accelerated redemption clauses. Solo Cup Investment Corporation, at its option and election, or its designee, may redeem in whole or in part the outstanding shares of CPPS or other securities it has issued on or after the third anniversary through the seventh anniversary of its issuance. The CPPS may be converted into common shares of Solo Cup Investment Corporation at any time, subject to specified limitations, at the option of the holders of the CPPS. Mandatory conversion occurs upon the closing of an initial public offering. The Company provides no guarantees with respect to these obligations of Solo Cup Investment Corporation.
During 2004, $4.1 million of capital was contributed to the Company by Solo Cup Investment Corporation. The contributed capital included $0.8 million of proceeds that were received by Solo Cup Investment Corporation from certain Company employees upon the issuance of additional shares of CPPS to those employees. The remaining $3.3 million represented the issuance of 3,283 Convertible Preferred Units (“CPUs”) of Solo Cup Investment Corporation to certain Company employees in settlement of deferred compensation liabilities (Note 15). As a result of the departure of certain employees from the Company, $2.0 million of this capital contribution was returned to Solo Cup Investment Corporation in 2007 as a dividend. In connection therewith, 1,907 CPUs and 100 CPPS were canceled.
58
Table of Contents
SOLO CUP COMPANY AND SUBSIDIARIES
NOTES TO CONSOLIDATED FINANCIAL STATEMENTS
| (14) | Accumulated Other Comprehensive Income (Loss) |
The components of accumulated other comprehensive income (loss) are as follows (in thousands):
| December 27, 2009 | December 28, 2008 | |||||||
| Foreign currency translation adjustments |
$ | 11,240 | $ | 805 | ||||
| Pension liability adjustments, net of tax benefit of $4,820 and $5,870 |
(21,119 | ) | (22,293 | ) | ||||
| Unrealized investment loss, net of tax of $0 |
— | (12 | ) | |||||
| Unrealized loss on cash flow hedges, net of tax of $0 |
— | (11,106 | ) | |||||
| Unrecognized gain on cash flow hedges, net of tax of $215 |
— | 150 | ||||||
| Accumulated other comprehensive loss |
$ | (9,879 | ) | $ | (32,456 | ) | ||
| (15) | Share-Based Payments |
Long Term Incentive Plan
On October 1, 2007, the Board of Directors of Solo Delaware approved a Long Term Incentive Plan (the “Plan”). The purpose of the Plan is to provide long-term incentives to selected key management employees of Solo Delaware and its affiliates. Awards under the Plan provide the opportunity to receive a cash bonus payment upon the occurrence of any sale, redemption, transfer or other disposition by Vestar of all or a portion of its equity interest in Solo Cup Investment Corporation for cash or marketable securities (a “Liquidity Event”). The aggregate award amount under the Plan (the “LTIP Award Pool”) will be determined based on a sliding percentage of the equity value of Solo Cup Investment Corporation (the “Equity Value”), as determined by the Solo Delaware Board, in accordance with the existing stockholder agreement of Solo Cup Investment Corporation, upon the occurrence of the earlier of a Liquidity Event or the Plan Termination Date (October 1, 2014), which is the seventh anniversary of the Plan’s effective date. Awards may also be allocated if Vestar sells, redeems, transfers or otherwise disposes of less than 100% of its equity interest in Solo Cup Investment Corporation for cash or marketable securities (a “Partial Liquidity Event”).
If there has not been a Liquidity Event prior to the Plan Termination Date, the Board of Solo Delaware will determine the Equity Value of Solo Cup Investment Corporation (as defined in the Plan) as of such date and will establish the LTIP Award Pool based on a sliding percentage of such valuation. The entire LTIP Award Pool will be distributed to the participants upon the occurrence of a Liquidity Event or the Plan Termination Date.
The following table reflects the percentage of the LTIP Award Pool granted by the Board to individual participants and forfeited by individual participants during the years ended December 28, 2008 and December 27, 2009:
| Percentage of LTIP Award Pool outstanding at December 30, 2007 |
67 | % | |
| 2008 Grants |
3 | % | |
| 2008 Forfeitures |
5 | % | |
| Percentage of LTIP Award Pool outstanding at December 28, 2008 |
65 | % | |
| 2009 Grants |
8 | % | |
| 2009 Forfeitures |
4 | % | |
| Percentage of LTIP Award Pool outstanding at December 27, 2009 |
69 | % | |
As of December 27, 2009, 69% of the LTIP Award Pool was outstanding. The percentage outstanding determines the allocation of the total LTIP Award Pool amongst the recipients and does not impact the total LTIP Award Pool. Expense is recorded over the participants’ service periods representing the period between a participant’s grant date and the Plan Termination Date. As additional grants are made to existing or new participants, compensation expense will be recorded over the respective future service period. Accordingly, the expense recorded in future periods will be affected by future participant grants and forfeitures.
59
Table of Contents
SOLO CUP COMPANY AND SUBSIDIARIES
NOTES TO CONSOLIDATED FINANCIAL STATEMENTS
Based on the Company’s valuations of the Plan as of December 27, 2009 and December 28, 2008, the Company recorded compensation expense of approximately $0.4 million in 2009 and $1.3 million in 2008, and compensation expense of $18.1 million is expected to be recognized over the remaining service period of 4.75 years. The Company re-measures the LTIP Award Pool’s fair value on a quarterly basis with a corresponding adjustment to compensation expense over the remaining service period.
The estimated fair value of the LTIP Award Pool is derived based on a lattice (binomial) forecast model with the primary input being the estimated business enterprise value for the Company, which is determined based on the estimated discounted cash flows of the business and through a comparison to market values of peer companies. The inputs used to calculate the estimated business enterprise value represent significant unobservable inputs, which are considered Level 3 inputs as defined by FASB ASC Topic 820, Fair Value Measurements and Disclosures. The LTIP Award is derived from the binomial model forecasts based on the probabilities of obtaining the forecasted future business enterprise values. FASB ASC Topic 718, Compensation—Stock Compensation requires that the fair value of the LTIP Award Pool be determined assuming a full payout at the Plan Termination Date with no consideration of a Liquidity Event. As the LTIP Award Pool is based on the business enterprise value of the Company, the fair value of the equity was calculated by the lattice model utilizing a Black-Scholes Option Model.
The key assumptions used in the Black-Scholes Option Model include:
| i) | the fair value of the underlying asset set equal to the estimated business enterprise value, |
| ii) | the strike price equal to the face value of the debt plus accrued interest, |
| iii) | volatility of 42.5% in 2009 and 53.0% in 2008, which was based on historic and implied forward volatilities for selected publicly-traded companies and calibrated such that the value derived by the model for the public debt was equivalent to the market trading price for the public debt on the valuation date, |
| iv) | forward one-year risk free rates ranging from 0.43% to 4.62% in 2009 and 0.38% to 2.38% in 2008, based on the market yields of government bonds with terms corresponding to the remaining term of the Plan at the respective node in the lattice model (ranging from 1 to 5 years for 2009; 1 to 6 years for 2008), and |
| v) | a dividend yield of 0% for both 2009 and 2008 based on the assumption that dividends would not be paid. |
The recorded expense reflects management’s estimate of forfeitures, which is based on management’s turnover expectations related to the Plan participants and historical forfeiture rates. The assumed annual forfeiture rate applied in 2009 and 2008 was approximately 16% and 8%, respectively.
CPUs and Stock Options
Solo Cup Investment Corporation also had a management investment and incentive compensation plan for certain key employees of the Company. Under this plan, Solo Cup Investment Corporation reserved 1,450,000 shares of common stock, and 5,000 shares of CPPS for issuance (Note 13). The accounting impact of this plan was recorded in the consolidated financial statements of the Company, as the plan relates to employees of the Company.
During the second quarter of 2004, Solo Cup Investment Corporation issued 3,283 CPUs to certain Company employees in settlement of $3.3 million of deferred compensation liabilities. The fair value of the CPUs granted was linked to the fair market value of one share of CPPS. For CPUs, compensation expense was recognized periodically based on changes in the fair value of the CPU relative to the grant-date fair value of the CPU. During the year ended December 30, 2007, the Company recorded a reversal of compensation expense with a corresponding decrease to additional paid-in capital of $0.6 million, reflecting the reversal of the accrued dividends as a result of the departure of certain employees from the Company.
The issuance of CPUs by Solo Cup Investment Corporation in settlement of deferred compensation liabilities of the Company totaling $3.3 million was recorded as additional paid-in capital in 2004. During 2007, as a result of employees separating from the Company, 1,907 CPUs were canceled and additional paid-in capital was reduced by $1.9 million. As of December 30, 2007, there were no CPUs outstanding, and none were granted in 2009 or 2008.
60
Table of Contents
SOLO CUP COMPANY AND SUBSIDIARIES
NOTES TO CONSOLIDATED FINANCIAL STATEMENTS
There was no stock option activity during the years ended December 27, 2009 or December 28, 2008. The following shows stock option activity for the year ended December 30, 2007:
| Shares under option Time-based |
Shares under option Performance-based (2) |
Total shares under option |
|||||||
| December 31, 2006 |
293,585 | 195,723 | 489,308 | ||||||
| Cancelation(1) |
(293,585 | ) | (195,723 | ) | (489,308 | ) | |||
| December 30, 2007 |
— | — | — | ||||||
| (1) | During 2007, the Company’s board of directors canceled all outstanding options. No options had been exercised at the time of cancelation. |
| (2) | The options were performance-based and were accounted for as variable options. No compensation expense was recorded related to these awards because the performance goals had not been met and the value of the underlying common stock had not increased. |
| (16) | Related-party Transactions |
Advisory fees - SCC Holding
In 2004, Solo Delaware and Solo Cup Investment Corporation entered into a management agreement with SCC Holding providing for, among other items, the payment by Solo Cup Investment Corporation of an annual advisory fee of $2.5 million to SCC Holding. On December 19, 2008, Solo Delaware and Solo Cup Investment Corporation entered into a first amendment to this management agreement. The first amendment provided that SCC Holding would not receive any fees under the management agreement for the fiscal year ended December 28, 2008; therefore, no expense was incurred by the Company during the 2008 fiscal year related to this agreement. On June 30, 2009, Solo Delaware and Solo Cup Investment Corporation entered into a second amendment to the management agreement with SCC Holding. The second amendment provides that the annual advisory fee would be $0.8 million beginning with the 2009 fee. Pursuant to the agreement, the Company incurred $0.8 million, $0 and $2.5 million of advisory fees to SCC Holding during the years ended December 27, 2009, December 28, 2008 and December 30, 2007, respectively.
Advisory fees - Vestar
In 2004, Solo Delaware and Solo Cup Investment Corporation also entered into a management agreement with Vestar pursuant to which Solo Cup Investment Corporation agreed to pay Vestar an annual advisory fee of $0.8 million, plus reimbursement of its expenses. On December 19, 2008, Solo Delaware, Solo Cup Investment Corporation and Vestar entered into an amendment to this management agreement. The amendment provided that Vestar would not receive any advisory fees under its management agreement for the fiscal year ended December 28, 2008; therefore, no expense was incurred by the Company during the 2008 fiscal year related to this agreement. Pursuant to the agreement, the Company incurred $0.8 million, $0 and $0.8 million of advisory fees during the years ended December 27, 2009, December 28, 2008 and December 30, 2007.
Out of pocket expenses incurred in 2009, 2008 and 2007 were approximately $0.2 million, $0.2 million and $0.8 million, respectively. As of December 27, 2009 and December 28, 2008, approximately $40 thousand and $0.1 million, respectively, were included in other current liabilities for out-of-pocket expenses.
Interest-free loans
In July 2008, the Company extended an interest-free loan of $0.2 million to one of its executive officers. The loan is included in other long-term assets on the Company’s Consolidated Balance Sheet as of December 28, 2008. The loan was fully repaid in July 2009.
Accounting guarantee
In February 2009, Solo Cup Operating Corporation entered into an agreement by which it leased to Sun Products Corporation a warehouse located in Havre de Grace, Maryland, which the Company closed in December 2008 (Note 4). One or more Vestar entities have an equity interest in Sun Products. The lease is for a term of seven years and includes two 5-year renewal options. During September 2009, the Company sold the Havre de Grace property and simultaneously assigned the lease to the new owner. One of the contractual terms of the purchase agreement with the new owner requires the Company to lease the property from the new owner for years 8-15 beginning in 2016 in the event the tenant does not renew the lease. The Company recorded a liability equal to the estimated fair value of this guarantee of approximately $1.2 million in accordance with FASB ASC Topic 460, Guarantees and Topic 820, Fair Value Measurements and Disclosures, and, due to its continuing involvement in the property, deferred the gain on the sale. The inputs used in the fair value calculation represent significant unobservable inputs, which are considered Level 3 inputs as defined by FASB ASC Topic 820.
61
Table of Contents
SOLO CUP COMPANY AND SUBSIDIARIES
NOTES TO CONSOLIDATED FINANCIAL STATEMENTS
| (17) | Commitments and Contingencies |
The Company is involved in various claims and legal actions arising from time to time in the ordinary course of business. Management believes that the ultimate disposition of these matters would not have a material adverse effect on the Company’s business, consolidated financial position, results of operations or liquidity.
The Company also has certain purchase obligations for raw materials that are commitments for projected needs to be utilized in the normal course of business. These are contracts that specify all significant terms, including fixed or minimum quantities to be purchased, a pricing structure and appropriate timing of the transaction.
| (18) | Government Obligations |
The Company entered into agreements with the City of Chicago and the State of Illinois relating to the Company’s 2001 acquisition of certain property located in Chicago, Illinois. Pursuant to these agreements, the City of Chicago paid a portion of the 2001 purchase price on behalf of the Company in the form of cash and the issuance of a note. The State of Illinois also provided a grant to the Company. Under the agreements, the Company is required to fulfill certain obligations relating to the development of the property and retention of employees. The Company’s intention is no longer to develop the property, but rather to sell the property. It expects that the obligations under the agreements with the City of Chicago and State of Illinois will either transfer to a new owner or be repaid from the proceeds of a sale. The obligations total approximately $16.2 million and are included in other current liabilities in the accompanying Consolidated Balance Sheets as of December 27, 2009 and December 28, 2008. Approximately $3.0 million of the obligations are interest bearing. As of December 27, 2009 and December 28, 2008, accrued interest on the accompanying Consolidated Balance Sheets includes $2.8 million and $2.3 million, respectively, of interest related to the obligations.
62
Table of Contents
SOLO CUP COMPANY AND SUBSIDIARIES
NOTES TO CONSOLIDATED FINANCIAL STATEMENTS
| (19) | Segments |
The Company manages and evaluates its operations in two reportable segments: North America and Europe. Both of these segments manufacture and supply a broad portfolio of single-use products used to serve food and beverages, that are available in plastic, paper, and foam, post-consumer recycled content and annually renewable materials. The operating segments are managed separately based on the products and requirements of the different markets. North America includes all of the Company’s entities established in the United States, Canada, Mexico and Puerto Rico, and the Company’s corporate function. Europe includes all U.K. entities. Other includes Australia and Panama. The Company dissolved its sole Australian entity in May 2009.
The accounting policies of the operating segments are the same as those described in Note 2. Segment operating results are measured based on operating income (loss). Intersegment net sales are accounted for on an arm’s-length pricing basis. The segment information below excludes discontinued operations (Note 3).
No individual customer accounted for greater than 10% of consolidated net sales in fiscal year 2009, 2008 or 2007. It is not practicable for the Company to report revenues from external customers for each product and service or each group of similar products.
| (in thousands) |
North America |
Europe (1) | Other | Total Segments |
Eliminations | Total | ||||||||||||||
| Year ended December 27, 2009 |
||||||||||||||||||||
| Revenues from external customers |
$ | 1,382,999 | $ | 106,252 | $ | 13,301 | $ | 1,502,552 | $ | — | $ | 1,502,552 | ||||||||
| Intersegment net sales |
23,575 | 28 | — | 23,603 | (23,603 | ) | — | |||||||||||||
| Operating income (loss) |
50,741 | (21,953 | ) | 1,416 | 30,204 | (102 | ) | 30,102 | ||||||||||||
| Depreciation and amortization |
71,678 | 4,039 | 303 | 76,020 | — | 76,020 | ||||||||||||||
| Capital expenditures |
70,286 | 1,419 | 110 | 71,815 | — | 71,815 | ||||||||||||||
| Property, plant and equipment, net |
490,678 | 15,800 | 2,486 | 508,964 | — | 508,964 | ||||||||||||||
| Total assets at year end |
973,787 | 59,309 | 12,258 | 1,045,354 | (57,936 | ) | 987,418 | |||||||||||||
| Year ended December 28, 2008 |
||||||||||||||||||||
| Revenues from external customers |
$ | 1,723,444 | $ | 109,383 | $ | 14,207 | $ | 1,847,034 | $ | — | $ | 1,847,034 | ||||||||
| Intersegment net sales |
21,540 | — | — | 21,540 | (21,540 | ) | — | |||||||||||||
| Operating income |
64,298 | 1,002 | 100 | 65,400 | 198 | 65,598 | ||||||||||||||
| Depreciation and amortization |
77,333 | 4,500 | 428 | 82,261 | — | 82,261 | ||||||||||||||
| Capital expenditures |
74,557 | 4,610 | 531 | 79,698 | — | 79,698 | ||||||||||||||
| Property, plant and equipment, net |
491,797 | 16,640 | 2,692 | 511,129 | — | 511,129 | ||||||||||||||
| Total assets at year end |
1,039,505 | 70,200 | 11,081 | 1,120,786 | (46,991 | ) | 1,073,795 | |||||||||||||
| Year ended December 30, 2007 |
||||||||||||||||||||
| Revenues from external customers |
$ | 1,996,838 | $ | 100,456 | $ | 12,808 | $ | 2,110,102 | $ | — | $ | 2,110,102 | ||||||||
| Intersegment net sales |
19,986 | — | 47 | 20,033 | (20,033 | ) | — | |||||||||||||
| Operating income |
51,098 | 2,363 | 1,916 | 55,377 | (94 | ) | 55,283 | |||||||||||||
| Depreciation and amortization |
91,516 | 4,090 | 600 | 96,206 | — | 96,206 | ||||||||||||||
| Capital expenditures |
41,936 | 4,638 | 914 | 47,488 | — | 47,488 | ||||||||||||||
| Property, plant and equipment, net |
514,597 | 22,666 | 2,586 | 539,849 | — | 539,849 | ||||||||||||||
| Total assets at year end |
1,142,102 | 78,508 | 11,334 | 1,231,944 | (28,769 | ) | 1,203,175 | |||||||||||||
| (1) | The operating loss of the Europe reporting segment for the year ended December 27, 2009, includes a goodwill impairment charge of approximately $17.2 million (Note 7). |
63
Table of Contents
SOLO CUP COMPANY AND SUBSIDIARIES
NOTES TO CONSOLIDATED FINANCIAL STATEMENTS
Net sales by customer group were as follows:
| For the year ended | |||||||||
| (in thousands) |
December 27, 2009 |
December 28, 2008 |
December 30, 2007 | ||||||
| Foodservice |
$ | 1,212,539 | $ | 1,536,728 | $ | 1,732,601 | |||
| Consumer |
290,013 | 310,306 | 377,501 | ||||||
| Net sales |
$ | 1,502,552 | $ | 1,847,034 | $ | 2,110,102 | |||
Geographic information:
Net sales from external customers by customer location are determined based on where the Company’s products were delivered. Long-lived assets include property, plant and equipment, net; goodwill; and certain other non-current assets.
| For the year ended | ||||||
| (in thousands) |
December 27, 2009 |
December 28, 2008 | ||||
| United States |
$ | 1,200,067 | $ | 1,511,148 | ||
| Other countries |
302,485 | 335,886 | ||||
| Revenues from external customers |
$ | 1,502,552 | $ | 1,847,034 | ||
| (in thousands) |
December 27, 2009 |
December 28, 2008 | ||||
| United States |
$ | 500,040 | $ | 481,853 | ||
| Other countries |
50,685 | 65,982 | ||||
| Total long-lived assets |
$ | 550,725 | $ | 547,835 | ||
Reconciliation:
| For the year ended | ||||||||||||
| (in thousands) |
December 27, 2009 |
December 28, 2008 |
December 30, 2007 |
|||||||||
| Total segment and other operating income |
$ | 30,204 | $ | 65,400 | $ | 55,377 | ||||||
| Elimination of intersegment operating (income) loss |
(102 | ) | 198 | (94 | ) | |||||||
| Interest expense |
(72,739 | ) | (62,725 | ) | (83,271 | ) | ||||||
| Interest income |
535 | 1,101 | 2,177 | |||||||||
| Loss on debt extinguishment |
(2,520 | ) | — | (3,962 | ) | |||||||
| Foreign currency exchange gain (loss), net |
2,577 | (14,107 | ) | 4,090 | ||||||||
| Other, net |
— | — | 184 | |||||||||
| Loss from continuing operations before income taxes |
$ | (42,045 | ) | $ | (10,133 | ) | $ | (25,499 | ) | |||
64
Table of Contents
SOLO CUP COMPANY AND SUBSIDIARIES
NOTES TO CONSOLIDATED FINANCIAL STATEMENTS
| (20) | Valuation and Qualifying Account |
The valuation and qualifying account is the allowance for doubtful accounts. The changes in this account were as follows (in thousands):
| Beginning balance |
Charged to costs and expenses |
Charged to other accounts (1) |
Deductions | Ending balance | |||||||||||||
| Allowance for doubtful accounts |
|||||||||||||||||
| 2009 |
$ | 1,453 | $ | 655 | $ | (44 | ) | $ | (950 | ) | $ | 1,114 | |||||
| 2008 |
1,348 | 584 | 136 | (615 | ) | 1,453 | |||||||||||
| 2007 |
2,252 | 39 | 4 | (947 | ) | 1,348 | |||||||||||
| (1) | Charged to other accounts includes recoveries received, reclassifications and cumulative translation adjustments for translation of foreign accounts. |
| (21) | Quarterly Financial Data (Unaudited) |
The following table sets forth certain unaudited financial data for quarterly periods during fiscal years 2009 and 2008.
| (In millions) |
4Q 2009 |
3Q 2009 |
2Q 2009 |
1Q 2009 |
4Q 2008 |
3Q 2008 |
2Q 2008 |
1Q 2008 | |||||||||||||||||||||
| Net sales |
$ | 387.1 | $ | 370.1 | $ | 395.8 | $ | 349.6 | $ | 404.3 | $ | 462.2 | $ | 518.7 | $ | 461.8 | |||||||||||||
| Gross profit |
50.9 | 53.8 | 64.4 | 37.3 | 43.5 | 60.1 | 76.3 | 67.9 | |||||||||||||||||||||
| Net (loss) income |
(4.5 | ) | (27.9 | ) | 6.9 | (10.2 | ) | (12.8 | ) | (8.0 | ) | 8.4 | 0.3 | ||||||||||||||||
65
Table of Contents
SOLO CUP COMPANY AND SUBSIDIARIES
NOTES TO CONSOLIDATED FINANCIAL STATEMENTS
| (22) | Guarantors |
On July 2, 2009, Solo Delaware and Solo Cup Operating Corporation (“SCOC”) co-issued $300.0 million of 10.5% Senior Secured Notes due 2013. The senior secured notes are fully and unconditionally guaranteed, on a joint and several basis, by certain of the Company’s subsidiaries. The consolidated guarantors include SF Holdings; Solo Manufacturing LLC; P.R. Solo Cup, Inc.; Lily-Canada Holding Corporation; Solo Cup (UK) Limited; Insulpak Holdings Limited; Solo Cup Europe Limited; and Solo Cup Owings Mills Holdings.
Effective February 22, 2004, Solo Delaware acquired SF Holdings. Solo Delaware partially funded the acquisition through the issuance of its 8.5% Senior Subordinated Notes due 2014. The senior subordinated notes are fully and unconditionally guaranteed, on a joint and several basis, by certain of the Company’s subsidiaries. The consolidated guarantors of the senior subordinated notes are the same as the senior secured notes, except for SCOC, which is a guarantor of the senior subordinated notes, but a co-issuer of the senior secured notes.
The following financial information has been revised to present the guarantors and non-guarantors of both the senior subordinated notes and the senior secured notes, in accordance with Rule 3-10 of Regulation S-X under the Securities Exchange Act of 1934. Also, certain of this financial information has been revised from amounts previously presented to properly reflect investments in subsidiaries under the equity method. In presenting this financial information, the equity method of accounting has been applied to (1) Solo Delaware’s investment in SF Holdings, (2) SF Holdings’ investment in SCOC, and (3) SCOC’s investment in the Other Guarantors and Non-Guarantor subsidiaries. All such subsidiaries meet the requirements to be consolidated under U.S. generally accepted accounting principles. All intercompany balances and transactions have been eliminated.
66
Table of Contents
SOLO CUP COMPANY AND SUBSIDIARIES
NOTES TO CONSOLIDATED FINANCIAL STATEMENTS
| Condensed Consolidated Balance Sheet December 27, 2009 (In thousands) | |||||||||||||||||||||||
| Solo Delaware (1) |
SF Holdings (2) (Guarantor) |
SCOC (3) | Other Guarantors (4) |
Non- Guarantors |
Eliminations | Consolidated | |||||||||||||||||
| Assets | |||||||||||||||||||||||
| Current assets: |
|||||||||||||||||||||||
| Cash and cash equivalents |
$ | — | $ | — | $ | 5 | $ | 4,517 | $ | 25,484 | $ | — | $ | 30,006 | |||||||||
| Accounts receivable – trade |
— | — | 83,808 | 16,912 | 16,483 | — | 117,203 | ||||||||||||||||
| Accounts receivable – other |
2,163 | — | 42,699 | 2,182 | 23 | (39,405 | ) | 7,662 | |||||||||||||||
| Inventories |
— | — | 192,131 | 18,781 | 23,895 | (2,225 | ) | 232,582 | |||||||||||||||
| Deferred income taxes |
— | — | 18,696 | — | 435 | — | 19,131 | ||||||||||||||||
| Prepaid expenses and other current assets |
— | — | 24,776 | 2,533 | 2,508 | — | 29,817 | ||||||||||||||||
| Total current assets |
2,163 | — | 362,115 | 44,925 | 68,828 | (41,630 | ) | 436,401 | |||||||||||||||
| Property, plant and equipment, net |
— | — | 460,800 | 15,799 | 32,365 | — | 508,964 | ||||||||||||||||
| Intercompany receivables – non-current |
155,108 | — | 6,088 | — | (161,196 | ) | — | ||||||||||||||||
| Intercompany debt – non-current |
439,708 | — | 39,175 | — | (478,883 | ) | — | ||||||||||||||||
| Investments in subsidiaries |
39,372 | 336,337 | 53,609 | — | — | (429,318 | ) | — | |||||||||||||||
| Restricted cash |
10,410 | — | — | — | — | — | 10,410 | ||||||||||||||||
| Other assets |
15,441 | — | 13,387 | 782 | 2,033 | — | 31,643 | ||||||||||||||||
| Total assets |
$ | 662,202 | $ | 336,337 | $ | 935,174 | $ | 61,506 | $ | 103,226 | $ | (1,111,027 | ) | $ | 987,418 | ||||||||
| Liabilities and Shareholder’s Equity | |||||||||||||||||||||||
| Current liabilities: |
|||||||||||||||||||||||
| Accounts payable |
$ | 301 | $ | — | $ | 64,294 | $ | 11,320 | $ | 6,075 | $ | — | 81,990 | ||||||||||
| Intercompany payable |
— | — | 4,343 | 24,348 | 10,714 | (39,405 | ) | — | |||||||||||||||
| Accrued expenses and other current liabilities |
16,105 | — | 78,847 | 1,570 | 6,180 | — | 102,702 | ||||||||||||||||
| Current maturities of long-term debt |
— | — | — | 374 | 405 | — | 779 | ||||||||||||||||
| Total current liabilities |
16,406 | — | 147,484 | 37,612 | 23,374 | (39,405 | ) | 185,471 | |||||||||||||||
| Long-term debt, net of current maturities |
619,297 | — | 15,000 | 1,013 | — | — | 635,310 | ||||||||||||||||
| Long-term debt, net of current maturities – intercompany |
— | 135,769 | 303,941 | 39,173 | — | (478,883 | ) | — | |||||||||||||||
| Deferred income taxes |
— | — | 20,384 | — | 2,288 | — | 22,672 | ||||||||||||||||
| Long-term payable – intercompany |
— | 161,196 | — | — | — | (161,196 | ) | — | |||||||||||||||
| Other long-term liabilities |
8,286 | — | 112,028 | 2,317 | 3,121 | — | 125,752 | ||||||||||||||||
| Total liabilities |
643,989 | 296,965 | 598,837 | 80,115 | 28,783 | (679,484 | ) | 969,205 | |||||||||||||||
| Total shareholder’s equity (accumulated deficit) |
18,213 | 39,372 | 336,337 | (18,609 | ) | 74,443 | (431,543 | ) | 18,213 | ||||||||||||||
| Total liabilities and shareholder’s equity |
$ | 662,202 | $ | 336,337 | $ | 935,174 | $ | 61,506 | $ | 103,226 | $ | (1,111,027 | ) | $ | 987,418 | ||||||||
(Continued)
| (1) | Issuer of 8.5% Senior Subordinated Notes; co-issuer of 10.5% Senior Secured Notes |
| (2) | Guarantor of 8.5% Senior Subordinated Notes and 10.5% Senior Secured Notes |
| (3) | Guarantor of 8.5% Senior Subordinated Notes; co-issuer of 10.5% Senior Secured Notes |
| (4) | Guarantors of 8.5% Senior Subordinated Notes and 10.5% Senior Secured Notes |
67
Table of Contents
SOLO CUP COMPANY AND SUBSIDIARIES
NOTES TO CONSOLIDATED FINANCIAL STATEMENTS
| Condensed Consolidated Balance Sheet December 28, 2008 (In thousands) | ||||||||||||||||||||||
| Solo Delaware |
SF Holdings (Guarantor) |
SCOC | Other Guarantors |
Non- Guarantors |
Eliminations | Consolidated | ||||||||||||||||
| Assets | ||||||||||||||||||||||
| Current assets: |
||||||||||||||||||||||
| Cash and cash equivalents |
$ | 40,310 | $ | — | $ | 8 | $ | 1,020 | $ | 16,166 | $ | — | $ | 57,504 | ||||||||
| Cash in escrow |
— | — | 50 | — | — | — | 50 | |||||||||||||||
| Accounts receivable – trade |
— | — | 87,010 | 17,866 | 16,126 | — | 121,002 | |||||||||||||||
| Accounts receivable – other |
— | — | 31,349 | 1,104 | 247 | (29,661 | ) | 3,039 | ||||||||||||||
| Intercompany debt – current |
— | — | — | 205 | — | (205 | ) | — | ||||||||||||||
| Inventories |
— | — | 248,965 | 15,412 | 20,911 | (2,027 | ) | 283,261 | ||||||||||||||
| Deferred income taxes |
— | — | 21,560 | 87 | 235 | — | 21,882 | |||||||||||||||
| Prepaid expenses and other current assets |
— | — | 31,432 | 3,738 | 3,702 | — | 38,872 | |||||||||||||||
| Total current assets |
40,310 | — | 420,374 | 39,432 | 57,387 | (31,893 | ) | 525,610 | ||||||||||||||
| Property, plant and equipment, net |
— | — | 463,057 | 16,640 | 31,432 | — | 511,129 | |||||||||||||||
| Goodwill |
— | — | — | 15,459 | — | — | 15,459 | |||||||||||||||
| Intercompany receivables – non-current |
134,237 | — | 6,088 | — | — | (140,325 | ) | — | ||||||||||||||
| Intercompany debt – non-current |
540,209 | — | 36,071 | 820 | — | (577,100 | ) | — | ||||||||||||||
| Investments in subsidiaries |
42,537 | 318,631 | 62,457 | — | — | (423,625 | ) | — | ||||||||||||||
| Other assets |
12,210 | — | 6,582 | — | 2,805 | — | 21,597 | |||||||||||||||
| Total assets |
$ | 769,503 | $ | 318,631 | $ | 994,629 | $ | 72,351 | $ | 91,624 | $ | (1,172,943 | ) | $ | 1,073,795 | |||||||
| Liabilities and Shareholder’s Equity | ||||||||||||||||||||||
| Current liabilities: |
||||||||||||||||||||||
| Accounts payable |
$ | — | $ | — | $ | 57,651 | $ | 10,216 | $ | 6,892 | $ | — | $ | 74,759 | ||||||||
| Intercompany payable |
— | — | 1,103 | 18,282 | 10,276 | (29,661 | ) | — | ||||||||||||||
| Accrued expenses and other current liabilities |
12,673 | — | 83,075 | 3,020 | 4,257 | — | 103,025 | |||||||||||||||
| Current maturities of long-term debt |
— | — | — | 183 | 1,185 | — | 1,368 | |||||||||||||||
| Current maturities of long-term debt – intercompany |
— | — | 205 | — | — | (205 | ) | — | ||||||||||||||
| Total current liabilities |
12,673 | — | 142,034 | 31,701 | 22,610 | (29,866 | ) | 179,152 | ||||||||||||||
| Long-term debt, net of current maturities |
714,954 | — | — | 1,521 | 347 | — | 716,822 | |||||||||||||||
| Long-term debt, net of current maturities – intercompany |
— | 135,769 | 405,260 | 36,071 | — | (577,100 | ) | — | ||||||||||||||
| Deferred income taxes |
— | — | 28,193 | 366 | 2,291 | — | 30,850 | |||||||||||||||
| Long-term payable – intercompany |
— | 140,325 | — | — | — | (140,325 | ) | — | ||||||||||||||
| Other long-term liabilities |
10,584 | — | 100,511 | 2,291 | 2,293 | — | 115,679 | |||||||||||||||
| Total liabilities |
738,211 | 276,094 | 675,998 | 71,950 | 27,541 | (747,291 | ) | 1,042,503 | ||||||||||||||
| Total shareholder’s equity |
31,292 | 42,537 | 318,631 | 401 | 64,083 | (425,652 | ) | 31,292 | ||||||||||||||
| Total liabilities and shareholder’s equity |
$ | 769,503 | $ | 318,631 | $ | 994,629 | $ | 72,351 | $ | 91,624 | $ | (1,172,943 | ) | $ | 1,073,795 | |||||||
(Continued)
68
Table of Contents
SOLO CUP COMPANY AND SUBSIDIARIES
NOTES TO CONSOLIDATED FINANCIAL STATEMENTS
| Consolidated Statement of Operations For the year ended December 27, 2009 (In thousands) |
||||||||||||||||||||||||||||
| Solo Delaware |
SF Holdings (Guarantor) |
SCOC | Other Guarantors |
Non- Guarantors |
Eliminations | Consolidated | ||||||||||||||||||||||
| Net sales |
$ | — | $ | — | $ | 1,317,912 | $ | 106,394 | $ | 176,719 | $ | (98,473 | ) | $ | 1,502,552 | |||||||||||||
| Cost of goods sold |
— | — | 1,129,529 | 103,312 | 161,655 | (98,364 | ) | 1,296,132 | ||||||||||||||||||||
| Gross profit |
— | — | 188,383 | 3,082 | 15,064 | (109 | ) | 206,420 | ||||||||||||||||||||
| Selling, general and administrative expenses |
15 | — | 132,764 | 7,814 | 9,662 | (116 | ) | 150,139 | ||||||||||||||||||||
| Impairment of goodwill |
— | — | — | 17,210 | — | — | 17,210 | |||||||||||||||||||||
| Loss on asset disposals |
— | — | 8,508 | 8 | 453 | — | 8,969 | |||||||||||||||||||||
| Operating (loss) income |
(15 | ) | — | 47,111 | (21,950 | ) | 4,949 | 7 | 30,102 | |||||||||||||||||||
| Interest expense, net |
9,009 | 20,872 | 32,095 | 1,070 | 50 | — | 63,096 | |||||||||||||||||||||
| Reclassification of unrealized loss on cash flow hedges to interest expense |
9,108 | — | — | — | — | — | 9,108 | |||||||||||||||||||||
| Loss on debt extinguishment |
2,520 | — | — | — | — | — | 2,520 | |||||||||||||||||||||
| Foreign currency exchange gain, net |
— | — | (282 | ) | (1,435 | ) | (860 | ) | — | (2,577 | ) | |||||||||||||||||
| Equity in loss (earnings) of subsidiaries |
14,789 | (6,083 | ) | 17,513 | — | — | (26,219 | ) | — | |||||||||||||||||||
| (Loss) income from before income taxes |
(35,441 | ) | (14,789 | ) | (2,215 | ) | (21,585 | ) | 5,759 | 26,226 | (42,045 | ) | ||||||||||||||||
| Income tax provision (benefit) |
215 | — | (8,298 | ) | 201 | 1,493 | — | (6,389 | ) | |||||||||||||||||||
| Net (loss) income |
$ | (35,656 | ) | $ | (14,789 | ) | $ | 6,083 | $ | (21,786 | ) | $ | 4,266 | $ | 26,226 | $ | (35,656 | ) | ||||||||||
| Consolidated Statement of Operations For the year ended December 28, 2008 (In thousands) |
||||||||||||||||||||||||||||
| Solo Delaware |
SF Holdings (Guarantor) |
SCOC | Other Guarantors |
Non- Guarantors |
Eliminations | Consolidated | ||||||||||||||||||||||
| Net sales |
$ | — | $ | — | $ | 1,643,413 | $ | 109,476 | $ | 203,298 | $ | (109,153 | ) | $ | 1,847,034 | |||||||||||||
| Cost of goods sold |
— | — | 1,426,353 | 99,357 | 182,577 | (109,017 | ) | 1,599,270 | ||||||||||||||||||||
| Gross profit |
— | — | 217,060 | 10,119 | 20,721 | (136 | ) | 247,764 | ||||||||||||||||||||
| Selling, general and administrative expenses |
17 | — | 139,724 | 9,112 | 10,848 | (95 | ) | 159,606 | ||||||||||||||||||||
| Loss on asset disposals |
— | — | 22,514 | — | 46 | — | 22,560 | |||||||||||||||||||||
| Operating (loss) income |
(17 | ) | — | 54,822 | 1,007 | 9,827 | (41 | ) | 65,598 | |||||||||||||||||||
| Interest (income) expense, net |
(13,700 | ) | 19,010 | 53,309 | 3,000 | 5 | — | 61,624 | ||||||||||||||||||||
| Foreign currency exchange loss (gain), net |
— | — | 13,041 | 2,868 | (1,802 | ) | — | 14,107 | ||||||||||||||||||||
| Equity in loss (earnings) of subsidiaries |
25,581 | 6,571 | (4,592 | ) | — | — | (27,560 | ) | — | |||||||||||||||||||
| (Loss) income from continuing operations before income taxes |
(11,898 | ) | (25,581 | ) | (6,936 | ) | (4,861 | ) | 11,624 | 27,519 | (10,133 | ) | ||||||||||||||||
| Income tax provision (benefit) |
153 | — | (216 | ) | (1,251 | ) | 3,381 | — | 2,067 | |||||||||||||||||||
| (Loss) income from continuing operations |
(12,051 | ) | (25,581 | ) | (6,720 | ) | (3,610 | ) | 8,243 | 27,519 | (12,200 | ) | ||||||||||||||||
| Loss from discontinued operations, net of income taxes of $0 |
— | — | (628 | ) | — | — | — | (628 | ) | |||||||||||||||||||
| Gain on sale of discontinued operations, net of income taxes of $0 |
— | — | 777 | — | — | — | 777 | |||||||||||||||||||||
| Net (loss) income |
$ | (12,051 | ) | $ | (25,581 | ) | $ | (6,571 | ) | $ | (3,610 | ) | $ | 8,243 | $ | 27,519 | $ | (12,051 | ) | |||||||||
(Continued)
69
Table of Contents
SOLO CUP COMPANY AND SUBSIDIARIES
NOTES TO CONSOLIDATED FINANCIAL STATEMENTS
| Consolidated Statement of Operations For the year ended December 30, 2007 (In thousands) |
||||||||||||||||||||||||||||
| Solo Delaware |
SF Holdings (Guarantor) |
SCOC | Other Guarantors |
Non- Guarantors |
Eliminations | Consolidated | ||||||||||||||||||||||
| Net sales |
$ | — | $ | — | $ | 1,898,653 | $ | 100,547 | $ | 214,170 | $ | (103,268 | ) | $ | 2,110,102 | |||||||||||||
| Cost of goods sold |
— | — | 1,685,743 | 88,602 | 188,428 | (103,090 | ) | 1,859,683 | ||||||||||||||||||||
| Gross profit |
— | — | 212,910 | 11,945 | 25,742 | (178 | ) | 250,419 | ||||||||||||||||||||
| Selling, general and administrative expenses |
(452 | ) | — | 183,437 | 9,580 | 11,256 | (178 | ) | 203,643 | |||||||||||||||||||
| Gain on asset disposals |
— | — | (7,235 | ) | — | (1,272 | ) | — | (8,507 | ) | ||||||||||||||||||
| Operating income |
452 | — | 36,708 | 2,365 | 15,758 | — | 55,283 | |||||||||||||||||||||
| Interest expense, net |
233 | 17,315 | 60,060 | 3,080 | 406 | — | 81,094 | |||||||||||||||||||||
| Loss on debt extinguishment |
3,962 | — | — | — | — | — | 3,962 | |||||||||||||||||||||
| Foreign currency exchange gain, net |
— | — | (1,776 | ) | (382 | ) | (1,932 | ) | — | (4,090 | ) | |||||||||||||||||
| Other income, net |
— | — | (184 | ) | — | — | — | (184 | ) | |||||||||||||||||||
| Equity in earnings of subsidiaries |
(75,768 | ) | (112,586 | ) | (9,207 | ) | — | — | 197,561 | — | ||||||||||||||||||
| Income (loss) from continuing operations before income taxes |
72,025 | 95,271 | (12,185 | ) | (333 | ) | 17,284 | (197,561 | ) | (25,499 | ) | |||||||||||||||||
| Income tax provision (benefit) |
944 | 19,503 | (44,401 | ) | (250 | ) | 4,743 | — | (19,461 | ) | ||||||||||||||||||
| Income (loss) from continuing operations |
71,081 | 75,768 | 32,216 | (83 | ) | 12,541 | (197,561 | ) | (6,038 | ) | ||||||||||||||||||
| Income (loss) from discontinued operations, net of income tax provision of $3,043 |
— | — | 3,107 | — | (3,251 | ) | — | (144 | ) | |||||||||||||||||||
| Gain on sale of discontinued operations, net of income tax provision of $17,671 |
— | — | 77,263 | — | — | — | 77,263 | |||||||||||||||||||||
| Net income (loss) |
$ | 71,081 | $ | 75,768 | $ | 112,586 | $ | (83 | ) | $ | 9,290 | $ | (197,561 | ) | $ | 71,081 | ||||||||||||
(Continued)
70
Table of Contents
SOLO CUP COMPANY AND SUBSIDIARIES
NOTES TO CONSOLIDATED FINANCIAL STATEMENTS
| Condensed Consolidated Statement of Cash Flows For the year ended December 27, 2009 (In thousands) |
|||||||||||||||||||||||||||
| Solo Delaware |
SF Holdings (Guarantor) |
SCOC | Other Guarantors |
Non- Guarantors |
Eliminations | Consolidated | |||||||||||||||||||||
| CASH FLOWS FROM OPERATING ACTIVITIES |
|||||||||||||||||||||||||||
| Net cash (used in) provided by operating activities |
$ | (24,415 | ) | $ | — | $ | 150,610 | $ | 1,582 | $ | 10,160 | $ | — | $ | 137,937 | ||||||||||||
| CASH FLOWS FROM INVESTING ACTIVITIES |
|||||||||||||||||||||||||||
| Purchases of property, plant and equipment |
— | — | (69,655 | ) | (1,733 | ) | (857 | ) | 430 | (71,815 | ) | ||||||||||||||||
| Proceeds from sale of property, plant and equipment |
— | — | 17,016 | 2 | 22 | (430 | ) | 16,610 | |||||||||||||||||||
| Investment in subsidiary |
— | — | (3,000 | ) | — | — | 3,000 | — | |||||||||||||||||||
| Increase in restricted cash |
(10,410 | ) | — | — | — | — | — | (10,410 | ) | ||||||||||||||||||
| Decrease in cash in escrow |
— | — | 50 | — | — | — | 50 | ||||||||||||||||||||
| Net cash used in investing activities |
(10,410 | ) | — | (55,589 | ) | (1,731 | ) | (835 | ) | 3,000 | (65,565 | ) | |||||||||||||||
| CASH FLOWS FROM FINANCING ACTIVITIES |
|||||||||||||||||||||||||||
| Net (repayments) borrowings under revolving credit facilities |
(28,000 | ) | — | 15,000 | — | — | — | (13,000 | ) | ||||||||||||||||||
| Repayments of term notes |
(68,170 | ) | — | — | — | (1,250 | ) | — | (69,420 | ) | |||||||||||||||||
| Capital contribution from parent |
— | — | — | 3,000 | (3,000 | ) | — | ||||||||||||||||||||
| Collection on (repayment of) intercompany debt |
100,501 | — | (101,526 | ) | 1,025 | — | — | — | |||||||||||||||||||
| Repayments of other debt |
— | — | — | (344 | ) | — | — | (344 | ) | ||||||||||||||||||
| Debt issuance costs |
(9,816 | ) | — | (8,498 | ) | — | — | — | (18,314 | ) | |||||||||||||||||
| Net cash (used in) provided by financing activities |
(5,485 | ) | — | (95,024 | ) | 3,681 | (1,250 | ) | (3,000 | ) | (101,078 | ) | |||||||||||||||
| Effect of exchange rate changes on cash |
— | — | — | (34 | ) | 1,242 | — | 1,208 | |||||||||||||||||||
| Net (decrease) increase in cash and cash equivalents |
(40,310 | ) | — | (3 | ) | 3,498 | 9,317 | — | (27,498 | ) | |||||||||||||||||
| Cash and cash equivalents, beginning of period |
40,310 | — | 8 | 1,020 | 16,166 | — | 57,504 | ||||||||||||||||||||
| Cash and cash equivalents, end of period |
$ | — | $ | — | $ | 5 | $ | 4,518 | $ | 25,483 | $ | — | $ | 30,006 | |||||||||||||
(Continued)
| Condensed Consolidated Statement of Cash Flows For the year ended December 28, 2008 (In thousands) |
|||||||||||||||||||||||||||
| Solo Delaware |
SF Holdings (Guarantor) |
SCOC | Other Guarantors |
Non- Guarantors |
Eliminations | Consolidated | |||||||||||||||||||||
| CASH FLOWS FROM OPERATING ACTIVITIES |
|||||||||||||||||||||||||||
| Net cash provided by operating activities – continuing operations |
$ | 14,315 | $ | — | $ | 114,899 | $ | 949 | $ | 2,414 | $ | — | $ | 132,577 | |||||||||||||
| Net cash used in operating activities – discontinued operations |
— | — | (638 | ) | — | — | — | (638 | ) | ||||||||||||||||||
| Net cash provided by operating activities |
14,315 | — | 114,261 | 949 | 2,414 | — | 131,939 | ||||||||||||||||||||
| CASH FLOWS FROM INVESTING ACTIVITIES |
|||||||||||||||||||||||||||
| Purchases of property, plant and equipment |
— | — | (72,431 | ) | (4,610 | ) | (3,947 | ) | 1,290 | (79,698 | ) | ||||||||||||||||
| Proceeds from sale of property, plant and equipment |
— | — | 11,743 | — | 50 | (1,290 | ) | 10,503 | |||||||||||||||||||
| Proceeds from sale of discontinued operations |
— | — | 850 | — | — | — | 850 | ||||||||||||||||||||
| Increase in cash in escrow |
— | — | (50 | ) | — | — | — | (50 | ) | ||||||||||||||||||
| Net cash used in investing activities |
— | — | (59,888 | ) | (4,610 | ) | (3,897 | ) | — | (68,395 | ) | ||||||||||||||||
| CASH FLOWS FROM FINANCING ACTIVITIES |
|||||||||||||||||||||||||||
| Net repayments under revolving credit facilities |
(2,100 | ) | — | — | — | — | — | (2,100 | ) | ||||||||||||||||||
| Repayments of term notes |
(36,696 | ) | — | — | — | (1,386 | ) | — | (38,082 | ) | |||||||||||||||||
| Collection on (repayment of) intercompany debt |
54,327 | — | (54,327 | ) | — | — | — | — | |||||||||||||||||||
| Repayments of other debt |
— | — | (50 | ) | (85 | ) | — | — | (135 | ) | |||||||||||||||||
| Net cash provided by (used in) financing activities |
15,531 | — | (54,377 | ) | (85 | ) | (1,386 | ) | — | (40,317 | ) | ||||||||||||||||
| Effect of exchange rate changes on cash |
— | — | — | (102 | ) | 796 | — | 694 | |||||||||||||||||||
| Net increase (decrease) in cash and cash equivalents |
29,846 | — | (4 | ) | (3,848 | ) | (2,073 | ) | — | 23,921 | |||||||||||||||||
| Cash and cash equivalents, beginning of period |
10,464 | — | 12 | 4,868 | 18,239 | — | 33,583 | ||||||||||||||||||||
| Cash and cash equivalents, end of period |
$ | 40,310 | $ | — | $ | 8 | $ | 1,020 | $ | 16,166 | $ | — | $ | 57,504 | |||||||||||||
71
Table of Contents
SOLO CUP COMPANY AND SUBSIDIARIES
NOTES TO CONSOLIDATED FINANCIAL STATEMENTS
| Condensed Consolidated Statement of Cash Flows For the year ended December 30, 2007 (In thousands) |
|||||||||||||||||||||||||||
| Solo Delaware |
SF Holdings (Guarantor) |
SCOC | Other Guarantors |
Non- Guarantors |
Eliminations | Consolidated | |||||||||||||||||||||
| CASH FLOWS FROM OPERATING ACTIVITIES |
|||||||||||||||||||||||||||
| Net cash provided by (used in) operating activities – continuing operations |
$ | 397,595 | $ | — | $ | (330,022 | ) | $ | 8,284 | $ | 11,091 | $ | — | $ | 86,948 | ||||||||||||
| Net cash used in operating activities – discontinued operations |
— | — | 8,868 | — | (238 | ) | — | 8,630 | |||||||||||||||||||
| Net cash provided by (used in) operating activities |
397,595 | — | (321,154 | ) | 8,284 | 10,853 | — | 95,578 | |||||||||||||||||||
| CASH FLOWS FROM INVESTING ACTIVITIES |
|||||||||||||||||||||||||||
| Purchases of property, plant and equipment |
— | — | (40,120 | ) | (4,638 | ) | (3,753 | ) | 1,023 | (47,488 | ) | ||||||||||||||||
| Proceeds from asset disposal |
— | — | 141,875 | 1 | 2,616 | (1,023 | ) | 143,469 | |||||||||||||||||||
| Proceeds from sale of discontinued operations |
— | — | 210,043 | — | — | — | 210,043 | ||||||||||||||||||||
| Net cash provided by (used in) investing activities – continuing operations |
— | — | 311,798 | (4,637 | ) | (1,137 | ) | — | 306,024 | ||||||||||||||||||
| Net cash provided by (used in) investing activities – discontinued operations |
— | — | 148 | — | (533 | ) | — | (385 | ) | ||||||||||||||||||
| Net cash provided by (used in) investing activities |
— | — | 311,946 | (4,637 | ) | (1,670 | ) | — | 305,639 | ||||||||||||||||||
| CASH FLOWS FROM FINANCING ACTIVITIES |
|||||||||||||||||||||||||||
| Net repayments under revolving credit facilities |
(72,500 | ) | — | — | — | (94 | ) | — | (72,594 | ) | |||||||||||||||||
| (Repayments) borrowings of term notes and other debt, net |
(313,475 | ) | — | 50 | (278 | ) | (6,189 | ) | — | (319,892 | ) | ||||||||||||||||
| Return of capital to parent |
(2,007 | ) | — | — | — | — | — | (2,007 | ) | ||||||||||||||||||
| Debt issuance costs |
(380 | ) | — | — | — | — | — | (380 | ) | ||||||||||||||||||
| Net cash (used in) provided by financing activities – continuing operations |
(388,362 | ) | — | 50 | (278 | ) | (6,283 | ) | — | (394,873 | ) | ||||||||||||||||
| Net cash used in financing activities – discontinued operations |
— | — | — | — | (72 | ) | — | (72 | ) | ||||||||||||||||||
| Net cash (used in) provided by financing activities |
(388,362 | ) | — | 50 | (278 | ) | (6,355 | ) | — | (394,945 | ) | ||||||||||||||||
| Effect of exchange rate changes on cash |
— | — | — | (146 | ) | 1,066 | — | 920 | |||||||||||||||||||
| Net increase (decrease) in cash and cash equivalents |
9,233 | — | (9,158 | ) | 3,223 | 3,894 | — | 7,192 | |||||||||||||||||||
| Cash and cash equivalents, beginning of period |
1,231 | — | 9,170 | 1,645 | 14,345 | — | 26,391 | ||||||||||||||||||||
| Cash and cash equivalents, end of period |
$ | 10,464 | $ | — | $ | 12 | $ | 4,868 | $ | 18,239 | $ | — | $ | 33,583 | |||||||||||||
72
Table of Contents
| Item 9. | Changes in and Disagreements with Accountants on Accounting and Financial Disclosure. |
Not applicable.
Item 9A(T). Controls and Procedures.
Evaluation of Disclosure Controls and Procedures
Our management, including our chief executive officer (principal executive officer) and chief financial officer (principal financial and accounting officer), has evaluated the effectiveness of our disclosure controls and procedures (as such term is defined in Rules 13a-15(e) or 15d-15(e) under the Exchange Act of 1934, as amended) as of the end of the period covered by this report.
Based on such evaluation, our chief executive officer and chief financial officer concluded that our disclosure controls and procedures were effective as of December 27, 2009.
Management Report on Internal Control Over Financial Reporting
The following management report shall be deemed “furnished” and not “filed” for purposes of Section 18 of the Securities Exchange Act of 1934, as amended (the “Exchange Act”).
Our management is responsible for establishing and maintaining adequate internal control over financial reporting, as such term is defined in Rules 13a-15(f) and 15d-15(f) of the Exchange Act. Our internal control over financial reporting is designed to provide reasonable assurance regarding the reliability of financial reporting and the preparation of financial statements for external purposes in accordance with United States generally accepted accounting principles. Because of its inherent limitations, internal control over financial reporting may not prevent or detect misstatements. Also, projections of any evaluation of effectiveness to future periods are subject to the risk that controls may become inadequate because of changes in conditions, or that the degree of compliance with the policies or procedures may deteriorate.
Under the supervision and with the participation of management, including our chief executive officer (principal executive officer) and chief financial officer (principal financial and accounting officer), management conducted an evaluation of the effectiveness of our internal control over financial reporting based on the framework in Internal Control—Integrated Framework issued by the Committee of the Sponsoring Organizations of the Treadway Commission (COSO).
Based on our assessment using those criteria, management concluded that the Company’s internal control over financial reporting as of December 27, 2009 was effective.
This annual report on Form 10-K does not include an attestation report of the Company’s registered public accounting firm regarding internal control over financial reporting. Management’s report was not subject to attestation by the Company’s registered public accounting firm pursuant to temporary rules of the Securities and Exchange Commission that permit the Company to furnish only management’s report with this annual report on Form 10-K.
Changes in Disclosure Controls and Procedures
There have been no changes in the Company’s internal control over financial reporting (as defined in Rules 13a-15(f) and 15d-15(f) under the Exchange Act) during the thirteen weeks ended December 27, 2009, that have materially affected, or are reasonably likely to materially affect, the Company’s internal control over financial reporting.
| Item 9B. | Other Information. |
None.
73
Table of Contents
| Item 10. | Directors, Executive Officers and Corporate Governance. |
The following table sets forth the name, age and current position of Solo Delaware’s executive officers and directors as of March 15, 2010.
| Name |
Age | Position |
Date First Elected | |||
| Kevin A. Mundt |
56 | Chairman of the Board, Chairman of the Audit Committee, Member of the Compensation Committee | 12/15/06(1) | |||
| Robert L. Hulseman |
77 | Chairman Emeritus of the Board | 1/29/04(2) | |||
| Robert M. Korzenski |
55 | Chief Executive Officer, President and Director | 4/15/04(2) | |||
| Robert D. Koney, Jr. |
53 | Executive Vice President and Chief Financial Officer | 4/2/07 | |||
| George F. Chappelle, Jr. |
48 | Executive Vice President and Chief Operating Officer | 10/2/09 | |||
| Jan Stern Reed |
50 | Executive Vice President – HR, General Counsel and Secretary | 11/30/04(2) | |||
| Peter J. Mendola |
55 | Senior Vice President – Operations | 4/2/07 | |||
| Neil Harrison |
57 | Director, Member of the Audit Committee | 4/2/07 | |||
| James R. Hulseman |
56 | Director | 8/3/07 | |||
| John D. Hulseman |
53 | Director | 8/3/07 | |||
| Sheila M. Hulseman |
74 | Director | 1/29/04 | |||
| Jeffrey W. Long |
53 | Director, Chair of the Compensation Committee | 12/15/06(1) | |||
| Daniel S. O’Connell |
56 | Director, Member of the Compensation Committee | 2/28/04(1) | |||
| Brian P. O’Connor |
34 | Director, Member of the Audit Committee | 4/3/08(1) |
| (1) | Each of Messrs Long, Mundt, O’Connell and O’Connor is an employee and equity owner of Vestar Capital Partners, an affiliate of Solo Delaware, due to its ownership of 32.71% of the voting stock of Solo Cup Investment Corporation, the parent of Solo Delaware. |
| (2) | Please refer to the identified individual’s biography set forth below for additional Director or Executive positions held by such individual while at Solo Delaware and the term such position(s) was held. |
Kevin A. Mundt is a director and has served as Chairman of the Board since December 2006. Mr. Mundt is a managing director of Vestar Capital Partners, which he joined in 2004. Previously he was a Managing Director of Mercer Oliver Wyman, the financial consulting arm of Marsh and McLennan from 1998 to 2003. Prior to that, beginning in 1983, he was one of the founders of Corporate Decisions, Inc., which was acquired by Marsh and McLennan. Mr. Mundt is also currently a director of MediMedia, Fiorucci, SpA, National Mentor and Sun Products Corporation. He also served as a director of Telephone Data Systems, Inc. (AMEX: TDS) from July 1998 through December 2005.
Robert L. Hulseman is a director and has served as Chairman Emeritus since December 2006. He served as Chairman and Chief Executive Officer of Solo Delaware from January 2004 until December 2006. Mr. Hulseman served as Chairman and Chief Executive Officer of Solo Illinois from January 1998 to October 2005, and served as a director of Solo Illinois from April 1956 to June 2005. He began his career in the disposable foodservice and food packaging products industry with Solo Illinois in 1950. Mr. Hulseman is also the husband of Sheila M. Hulseman, and the uncle of James R. and John D. Hulseman, all of which are directors of Solo Delaware.
Robert M. Korzenski is a director and Chief Executive Officer and President of Solo Delaware, having served as a director and President since April 2006 and as the Chief Executive Officer since August 2006. Prior to that, he served as Executive Vice President – Sales and Marketing of Solo Delaware from February 2005 until April 2006, and as Senior Vice President – Integration; Hoffmaster-Fonda Brands of Solo Delaware and Solo Illinois from February 2004 to February 2005. Mr. Korzenski served as President of the Hoffmaster brand of Sweetheart from March 2002 until February 2004. Prior to that, Mr. Korzenski served at The Fonda Group, Inc. from March 1995 until March 2002, where he was President and Chief Operating Officer from March 1998 to March 2002.
74
Table of Contents
Robert D. Koney, Jr. is Chief Financial Officer and Executive Vice President of Solo Delaware, having served in that capacity since April 2007. Prior to joining the Company, Mr. Koney was Chief Financial Officer and Senior Vice President of Russell Corporation (NYSE: RML), an athletic and sporting goods company, from September 2004 to December 2006. Mr. Koney also served at Goodrich Corporation (NYSE: GR), a global supplier of systems and services to the aerospace and defense markets, from 1986 to 2004, where he was Vice President, Corporate Controller and Principal Accounting Officer from 1998 to 2004.
George F. Chappelle, Jr. is Chief Operating Officer and Executive Vice President of Solo Delaware, having served in that capacity since October 2009. Prior to joining Solo Delaware, Mr. Chappelle was Senior Vice President, Chief Supply Chain Officer and Senior Corporate Officer of Sara Lee Corporation (NYSE: SLE), a global consumer goods company, from June 2005 to February 2008. Prior to his tenure at Sara Lee, Mr. Chappelle served as Vice President, Chief Information Officer and Corporate Officer of H.J. Heinz Company (NYSE: HNZ), a global marketer and producer of foods, from August 2002 to June 2005. During that time, Mr. Chappelle also served as H.J. Heinz Company’s Vice President of Business Transformation from March 2003 to June 2005.
Jan Stern Reed is Executive Vice President – Human Resources, General Counsel and Secretary of Solo Delaware, having served in that capacity since April 2006. Prior to that, Ms. Reed served as Executive Vice President, General Counsel and Secretary of Solo Delaware from June 2005 to April 2006. From December 2004 to June 2005, she served as Senior Vice President, General Counsel and Secretary of Solo Delaware. Prior to joining Solo Delaware, Ms. Reed served as Associate General Counsel and Corporate Secretary for Baxter International Inc. (NYSE: BAX), a global developer and manufacturer of products used in the health care field, from February 1998 to November 2004, and also served as its Chief Governance Officer from March 2003 to November 2004.
Peter J. Mendola is Senior Vice President – Operations of Solo Delaware, having served in that capacity since April 2007. Prior to joining Solo Delaware, Mr. Mendola spent 19 years at Georgia Pacific/Dixie®, a world-wide manufacturer and marketer of tissue, packaging, paper, pulp and building products, most recently as Vice President – Paper Operations from 2004 until 2007, and Vice President – Supply Chain and Technical Services from 2001 to 2004.
Neil Harrison is a director of Solo Delaware, having served in that capacity since April 2007. Mr. Harrison served as the Chairman, President and Chief Executive Officer of Birds Eye Foods, an international producer of canned, bottled and frozen products, from September 2005 to December 2009. Prior to that time Mr. Harrison was Chairman, President and Chief Executive Officer of Atkins Nutritionals Inc. from February 2005 to June 2005. Prior to that role, Mr. Harrison was with the H.J. Heinz Company (NYSE: HNZ), where he served as an Executive Vice President – H. J. Heinz and President and Chief Executive Officer – Heinz North America from 2002 to 2004. From 1999 to 2002, Mr. Harrison was the President and Chief Executive Officer – Heinz Frozen Food Company.
James R. Hulseman is a director of Solo Delaware, having served in that capacity since August 2007. Mr. Hulseman is currently Vice President – Special Projects of Solo Cup Operating Corporation, the operating subsidiary of Solo Delaware. He previously held the position of Vice President – Global Quality Initiatives from 2002 to 2007 and prior to that as Vice President – Quality from October 2000. James R. Hulseman is the brother of John D. Hulseman, a director of Solo Delaware. He is also the nephew of Robert L. Hulseman, Chairman Emeritus and Sheila M. Hulseman, director, of Solo Delaware.
John D. Hulseman is a director of Solo Delaware, having served in that capacity since August 2007. Mr. Hulseman has held the position of Energy Manager of Solo Cup Operating Corporation since 2006. From 2001 until 2006 he was a Production Manager. John D. Hulseman is the brother of James R. Hulseman, a director of Solo Delaware. He is also the nephew of Robert L. Hulseman, Chairman Emeritus and Sheila M. Hulseman, director, of Solo Delaware.
Sheila M. Hulseman is a director of Solo Delaware, having served in that capacity since January 2004. Ms. Hulseman served as a director of Solo Illinois from April 1989 to June 2005. Ms. Hulseman is the wife of Robert L. Hulseman and the aunt of James R. and John D. Hulseman, each directors of Solo Delaware.
Jeffrey W. Long is a director of Solo Delaware, having served in that capacity since December 2006. Mr. Long has been a managing director of Vestar Capital Partners since September 2005. Before that, Mr. Long was a Principal at McKinsey and Company, Inc. from June 1999 to August 2005. Mr. Long is currently a director of St. John Knits International, Inc. and Consolidated Container Company, LLC.
Daniel S. O’Connell is a director of Solo Delaware, having served in that capacity since February 2004. Mr. O’Connell is the Chief Executive Officer and founder of Vestar Capital Partners. Prior to founding Vestar Capital Partners in 1998, Mr. O’Connell was a Managing Director and Co-Head of the Management Buyout Group at The First Boston Corporation. Mr. O’Connell is currently a director of Sun Products Corporation, Sunrise Medical, Inc., St. John Knits International, Inc. and National Mentor. He also served as a director of Birds Eye Foods, Inc. from 2002 to 2009, and Radiation Therapy Services, Inc. from 2008 to 2009.
75
Table of Contents
Brian P. O’Connor is a Director of Solo Delaware, having served in that capacity since April 2008. In August 2000, Mr. O’Connor joined Vestar and most recently has served as a Principal since January 2009. Prior to that time he served in other capacities including as Vice President from December 2006 to December 2008. Prior to joining Vestar, Mr. O’Connor was a member of the Merchant Banking group at Donaldson, Lufkin & Jenrette from August 1998 to June 2000.
Board Structure and Risk Oversight
Our business and affairs are managed under the direction of our board of directors. We currently have ten directors. Pursuant to the Stockholders Agreement among Solo Delaware, Solo Cup Investment Corporation, Vestar, SCC Holding and specified other parties:
| • | Messrs. Mundt, Harrison, Long, O’Connell and O’Connor serve on Solo Delaware’s board of directors as designees of Vestar; |
| • | Messrs. Korzenski, Robert L. Hulseman, James R. Hulseman, John D. Hulseman and Ms. Sheila M. Hulseman serve on Solo Delaware’s board of directors as designees of SCC Holding; and |
| • | Mr. Mundt serves as Chairman of the Board of Solo Delaware as Vestar’s designee to that position. |
There are no other arrangements or understandings between any member of the board of directors or executive officer and any other person pursuant to which that person was elected or appointed to his or her position.
We currently have one vacancy on our board of directors. Under the terms of the Stockholders’ Agreement, Vestar has the right to appoint a designee to fill this vacancy.
Our audit committee is responsible for overseeing our risk management function. While the audit committee has primary responsibility for overseeing risk management, our entire Board of Directors is actively involved in overseeing our risk management. For example, the Board engages in periodic discussions with our executive management team and such other company officers as the Board deems necessary, including our Chief Executive Officer, Chief Operating Officer, Chief Financial Officer and General Counsel. We believe that the leadership structure of our Board supports effective risk management oversight.
Board Meetings and Committees
The Board of Directors of Solo Delaware maintains an Audit Committee and a Compensation Committee that assist the Board of Directors in fulfilling its oversight responsibilities. The Audit Committee reviews Solo Delaware’s financial reporting process, its system of internal controls, the audit process and the process of monitoring Solo Delaware’s compliance with laws and regulations. The Board did not designate any director as the “audit committee financial expert,” as defined by the Securities and Exchange Commission, or SEC. Mr. Mundt serves as the chair of Solo Delaware’s Audit Committee. Neither Mr. Mundt nor any of the Directors is considered “independent” under the standards established by the New York Stock Exchange. The Compensation Committee reviews Solo Delaware’s employee benefit plans and executive compensation. The charters of the Audit and Compensation Committees are available free of charge at the “About Solo” portion of our website, www.solocup.com, under the “Investor Relations” link. In 2009, Solo Delaware’s Board of Directors held eight meetings, the Audit Committee held six meetings and the Compensation Committee met once. No incumbent director attended fewer than 75 percent of the total meetings held by the Board of Directors or of the total committee meetings of the Board on which that director served.
Section 16(a) Beneficial Owner Reporting Compliance
Solo Delaware does not have a class of equity securities registered pursuant to Section 12 of the Securities Exchange Act of 1934, as amended.
Code of Business Conduct
We have adopted the “Solo Cup Company Code of Business Conduct,” which applies to all of our directors, officers and employees. We make this code available free of charge on our website, www.solocup.com, under the heading “Working at Solo,” or by request. We intend to disclose certain amendments to the “Solo Cup Company Code of Business Conduct,” or any waivers of the “Solo Cup Company Code of Business Conduct” granted to executive officers and directors, on our website within four business days following the date of any such amendment or waiver.
76
Table of Contents
| Item 11. | Executive Compensation. |
Compensation Discussion and Analysis
The following discussion is provided to give an understanding of our compensation policies and decisions regarding the executive officers identified in the Summary Compensation Table below, who we refer to as our “named executive officers.”
Background. Our board of directors’ compensation committee, which was established in 2007, oversees our executive compensation. The compensation committee made significant changes to our compensation philosophy that had been in effect prior to 2007, and our policies have changed accordingly. Specifically, prior to 2007 our compensation policies and philosophy were primarily an extension of long-standing practices that had been in effect for many years at Solo Illinois before Vestar acquired an ownership interest in us. These practices included the provision of significant perquisites to senior management that have since been eliminated. The discussion in this section does not apply to the Hulseman family members who are identified in “Certain Relationships and Related Transactions and Director Independence” below, as their compensation is determined by the terms of the Stockholders Agreement and of the Transition Agreement dated December 14, 2006 among Solo Delaware, Vestar and certain of its affiliates, SCC Holding and Solo Cup Investment Corporation.
Compensation Philosophy. The objectives of our compensation programs are to (1) drive our financial performance through incentives and rewards designed to direct individual performance toward achieving our common goals; (2) align the executive officers and senior management with the entire employee team; (3) attract and retain executive talent at compensation levels that are market competitive; and (iv) reflect the value of each officer’s position. Our compensation philosophy is to provide a competitive total rewards program comprised of four components: compensation; benefits; development; and work environment. The compensation portion of our total rewards program seeks to equitably and consistently recognize and compensate employees for superior performance. The short-term aspect of our program primarily focuses on competitive compensation consisting of both fixed and variable pay in the form of cash. These incentives are provided in the form of base compensation and an annual bonus plan. Because we do not have publicly-traded equity, we do not have the ability to utilize stock-based incentives as a component of our at-risk compensation; however, we have implemented a long-term incentive plan that is designed to align the senior management team with our long-term future financial success. Our total rewards approach is also geared towards supporting our overall business objectives by driving and maintaining a performance-driven culture, offering competitive benefits, encouraging and rewarding individual career development and providing a balance between work and family life.
Process for Determining Executive Compensation. The compensation committee determines annual cash compensation for each executive based on a number of factors, including their individual performance contributions during the year, any additional roles and responsibilities assumed, the ability of the executive to effect favorable change within the organization, our financial performance and the achievement of goals and objectives. Prior to recruiting for any open executive officer positions, each position is analyzed based on the specific job criteria, relocation considerations and the median market compensation for that position. After candidates are identified and selected, the compensation committee and management work together to develop a compensation package that we believe is market competitive and sufficiently rewarding to attract talent to us, taking into account the candidate’s current compensation, current position and overall experience.
Compensation Components. Our executive compensation includes a base salary, an annual cash incentive opportunity, traditional benefits, a long-term incentive cash award opportunity and minimal perquisites. We do not have any formal or informal policy or target for the percentage of compensation that is allocated between annual and long-term compensation, between cash and non-cash compensation or among the different forms of non-cash compensation. Instead, we have determined subjectively on a case-by-case basis – albeit within a range based on job description and level – the appropriate amount and mix of the various compensation components.
Base Salaries. Base salaries are used to recognize the experience, skills, knowledge and responsibilities required of all our employees, including our executives. Base salaries for our executives, together with other components of compensation, are evaluated for adjustment annually by the CEO based on an assessment of the executive’s performance utilizing the criteria set forth above under “ – Process for Determining Executive Compensation,” as well as the executive’s contribution to achieving our goals and objectives, his or her leadership skills, economic market conditions and compensation trends in our industry, after which a recommendation by the CEO is presented to the compensation committee for ultimate approval by the board of directors.
77
Table of Contents
Cash Bonuses. In addition to base salaries, our executives are eligible to receive an incentive cash payment based primarily on our financial performance measured on an annual basis and, to a lesser degree, annual individual objectives. This variable portion of our cash incentive program provides an opportunity for the executive to receive remuneration in direct proportion to the extent to which we have achieved our strategic, operational and financial goals. Our annual bonuses are paid under our annual management incentive plan, known as the “Management Incentive Plan” or “MIP,” which provides for a cash payment, dependent upon our obtaining specified earnings before interest, taxes, depreciation and amortization adjusted for certain items, such as non-cash charges and restructuring charges (known as “Adjusted EBITDA”), calculated as a percentage of the executive’s base salary. If we do not meet a specified percentage of the targeted annual Adjusted EBITDA amount (90% in 2009), there is no payout under the Management Incentive Plan. The target cash payment percent for each executive officer is between 55% and 65% of that executive’s base salary. If corporate financial performance measures are exceeded, executives may receive up to 200% of their target Management Incentive Plan payment that is based on the corporate financial performance measure. Actual awards under the Management Incentive Plan are based upon our financial performance, and also each individual’s performance for the year. The percent allocated between Adjusted EBITDA achievement and individual performance varies under the Management Incentive Plan, depending upon the participant’s position. Since 2007, the total pool of employees eligible to participate in the MIP includes all managers and above.
The threshold, target and maximum annual Adjusted EBITDA amounts are set by the compensation committee and Solo Delaware’s board of directors each year. The compensation committee recommends to Solo Delaware’s board for approval the annual incentive target award and payout for each of the named executive officers, with the Chief Executive Officer providing recommendations to the compensation committee for each named executive officer other than himself. The Chief Executive Officer, the compensation committee and Solo Delaware’s board of directors followed this practice with regard to the 2009 Management Incentive Plan. For 2009, it was determined that we did not meet the threshold annual Adjusted EBITDA amount required to fund the plan that had been established by Solo Delaware’s board, and accordingly, no awards were granted to any participants in the Management Incentive Plan, including the executive officers.
At its March 2010 meeting, the compensation committee established the threshold, target and maximum annual Adjusted EBITDA amounts under the Management Incentive Plan. In addition, it recommended, and the full board approved, the target bonus award percentages and salaries set forth in the table below for those officers who were named executive officers for 2009 and remain executive officers of Solo Delaware as of the date of filing of this annual report.
| Name |
2010 Salary | 2010 MIP Target Award |
||||
| Mr. Korzenski |
$ | 735,000 | 65 | % | ||
| Mr. Koney |
$ | 425,000 | 65 | % | ||
| Ms. Reed |
$ | 465,000 | 65 | % | ||
Stock Options. We do not offer any stock options. In 2007, Solo’s board of directors cancelled all outstanding vested and unvested options awarded under SCIC’s Management Investment and Incentive Compensation Plan and the plan was terminated.
Benefits and Perquisites. Prior to 2007, we maintained certain benefit plans only for and provided certain perquisites only to executive officers, specified other management members and the Hulseman family members. In 2007, the executive officers and all other participants in these plans were transitioned to the same medical, dental, life, disability, vision, and insurance benefit plans as those that are provided to all of our other employees on the same basis, terms and conditions. In addition, perquisites that were only offered to named executive officers were terminated. The named executive officers currently receive substantially the same perquisites as those available to all employees. Mr. Korzenski, Ms. Reed and Mr. Pasqualini received whole life insurance policies in the amount of $250,000 or a comparable annuity payment in 2009.
Long Term Incentive Plan. See the discussion below under the heading “Long Term Incentive Plan.” The compensation committee believes that this plan will provide a significant long-term incentive for key senior management team members and continue to promote our performance-based philosophy.
Retirement Benefits. Executive officers also participate in our 401(k) plan, a tax-qualified retirement savings plan available to all employees, pursuant to which employees are permitted to defer a portion of their income under the 401(k) plan. We did not match employee contributions in 2009. In 2010, we resumed our contribution, matching 25% of the first 2% of salary contributed by an employee on an after tax basis. We do not maintain any defined benefit plans in which our named executive officers participate. We offer a deferred compensation plan; none of our current named executive officers participated in this plan during 2007, 2008 or 2009.
78
Table of Contents
Severance Payments. Each of our named executive officers is entitled to receive severance benefits upon certain qualifying terminations of employment, based upon either an applicable provision in such executive’s employment agreement or pursuant to the terms of our Severance Policy. These severance arrangements are intended to retain executives and provide continuity of management in connection with a threatened or actual change in control transaction. Certain terms of the employment agreements and severance payments made to Messrs. Pasqualini and Simmonds are described below under the caption “Executive Employment Agreements.”
Compensation Committee Report
The Compensation Committee has reviewed the Compensation Discussion and Analysis and has discussed it with the Company’s management. Based on our review and discussion, we recommend to the board of directors that the Compensation Discussion and Analysis be included in the Company’s Annual Report on Form 10-K for the year ended December 28, 2008.
Compensation Committee
Jeffrey W. Long, Chair
Kevin A. Mundt
Daniel S. O’Connell
Summary Compensation Information for Named Executive Officers
The following tables, narrative and footnotes summarize the compensation earned by Solo Delaware’s named executive officers for all services rendered in all capacities to us. The named executive officers include our Chief Executive Officer, Chief Financial Officer and the next three most highly compensated executive officers in 2009 who were serving as such at the end of 2009. The named executive officers for 2009 also include an executive officer who left Solo Delaware before the end of 2009, but whose 2009 total compensation (including severance) made him one of the three most highly compensated executive officers (other than the Chief Executive Officer and Chief Financial Officer) for 2009.
Summary Compensation Table — Fiscal Year 2009
| Name and Principal Position(1) |
Year | Salary($) | Bonus($) | Non-Equity Incentive Plan Compensation ($)(2) |
Change in Pension Value and Nonqualified Deferred Compensation Earnings ($) |
All Other Compensation ($)(3) |
Total ($) | |||||||||
| Robert M. Korzenski |
2009 | 735,002 | — | — | — | 8,814 | 743,816 | |||||||||
| 2008 | 735,010 | — | — | — | 16,706 | 751,716 | ||||||||||
| 2007 | 725,584 | 375,000 | (4) | 716,625 | — | 52,885 | 1,870,094 | |||||||||
| Robert D. Koney, Jr. |
2009 | 395,000 | — | — | — | — | 395,000 | |||||||||
| 2008 | 382,506 | — | — | — | 9,456 | 391,962 | ||||||||||
| 2007 | (5) | 281,249 | 15,000 | (6) | 341,250 | — | 223,434 | 860,933 | ||||||||
| Thomas A. Pasqualini (7) |
2009 | 410,002 | — | — | — | 38,262 | 448,264 | |||||||||
| 2008 | 410,010 | — | — | — | 46,747 | 456,757 | ||||||||||
| 2007 | 404,622 | — | 399,750 | — | 99,211 | 903,583 | ||||||||||
| Jan Stern Reed |
2009 | 450,001 | — | — | — | 5,008 | 455,009 | |||||||||
| 2008 | 450,008 | — | — | — | 12,845 | 462,853 | ||||||||||
| 2007 | 443,275 | — | 438,750 | — | 65,768 | 947,793 | ||||||||||
| Malcolm S. Simmonds (8) |
2009 | 325,000 | — | — | — | — | 325,000 | |||||||||
| 2008 | 320,000 | — | — | — | 8,893 | 328,893 | ||||||||||
| 2007 | (5) | 209,808 | 25,000 | (6) | 228,750 | — | 280,173 | 743,731 | ||||||||
| Robert J. Fronberry (9) |
2009 | 173,715 | — | — | — | 275,000 | 448,715 | |||||||||
| (1) | Eric A. Simonsen served as Solo Delaware’s Interim Chief Financial Officer from July 27, 2006 to January 12, 2007. Mr. Simonsen was a managing director of AlixPartners, LLC, and Solo Delaware did not directly pay him any salary or benefits. |
79
Table of Contents
| (2) | Amounts for 2007 represent annual incentive awards issued under the 2007 Management Incentive Plan, but paid in 2008. No amounts were awarded under the 2008 Management Incentive Plan or, as discussed above under “—Compensation Discussion and Analysis,” the 2009 Management Incentive Plan. |
| (3) | Amounts in this column consist of those items identified in the table “All Other Compensation” immediately following the Summary Compensation Table. |
| (4) | Transaction bonus received in connection with the sale of our Hoffmaster business in October 2007 as previously disclosed in Solo’s Form 8-K filed with the SEC on October 17, 2007. |
| (5) | Mr. Koney and Mr. Simmonds joined Solo Delaware in April 2007. |
| (6) | Represents amount paid for a sign-on bonus. |
| (7) | Mr. Pasqualini left Solo Delaware in February 2010. |
| (8) | Mr. Simmonds left Solo Delaware in January 2010. |
| (9) | Mr. Fronberry left Solo Delaware in August 2009. |
All Other Compensation
| Name |
Year | Perquisites and Other Personal Benefits ($)(1) |
Tax Reimbursements ($) |
Insurance Premiums and Health Care Expenses($) |
Company Contributions to Retirement and 401(k) Plans($) |
Severance | Total All Other Compensation($) | |||||||||||
| Robert M. Korzenski, |
2009 | — | 2,926 | (3) | 5,888 | (4) | — | — | 8,814 | |||||||||
| 2008 | — | 2,926 | (3) | 5,888 | (4) | 7,892 | — | 16,706 | ||||||||||
| 2007 | 21,565 | (2) | 16,235 | (3) | 7,253 | (4) | 7,832 | — | 52,885 | |||||||||
| Robert D. Koney, Jr., |
2009 | — | — | — | — | — | — | |||||||||||
| 2008 | — | — | — | 9,456 | — | 9,456 | ||||||||||||
| 2007 | (5) | 141,744 | (6) | 78,548 | (7) | — | 3,142 | — | 223,434 | |||||||||
| — | ||||||||||||||||||
| Thomas A. Pasqualini, |
2009 | — | 11,268 | (10) | 26,994 | (11) | — | — | 38,262 | |||||||||
| 2008 | — | 11,483 | (10) | 27,509 | (11) | 7,755 | — | 46,747 | ||||||||||
| 2007 | 30,440 | (9) | 31,538 | (10) | 28,903 | (11) | 8,330 | — | 99,211 | |||||||||
| — | ||||||||||||||||||
| Jan Stern Reed, |
2009 | — | 1,475 | (3) | 3,533 | (4) | — | — | 5,008 | |||||||||
| 2008 | — | 1,475 | (3) | 3,533 | (4) | 7,837 | — | 12,845 | ||||||||||
| 2007 | 34,625 | (12) | 17,645 | (3) | 4,898 | (4) | 8,600 | — | 65,768 | |||||||||
| — | ||||||||||||||||||
| Malcolm S. Simmonds, |
2009 | — | — | — | — | — | — | |||||||||||
| 2008 | — | — | — | 8,893 | — | 8,893 | ||||||||||||
| 2007 | (5) | 160,171 | (13) | 117,330 | (7) | — | 2,672 | — | 280,173 | |||||||||
| Robert J. Fronberry |
2009 | — | — | — | — | 275,000 | 275,000 | |||||||||||
| (1) | The amounts represented reflect the aggregate incremental cost to Solo Delaware of providing the perquisite to the named executive officer. |
| (2) | Amount represents the fair market value of a company-owned vehicle transferred to Mr. Korzenski. |
| (3) | Amounts for 2009, 2008 and 2007 include tax reimbursements on income imputed to the named executive officer for whole life insurance premiums paid on behalf of the officer by Solo Delaware. Amounts for 2007 also include tax reimbursements on income imputed to the named executive officer for (a) the fair market value of a company-owned vehicle transferred to the officer; and (b) health insurance premiums paid on behalf of the officer by Solo Delaware through March 2007, when the named executive officer was transferred to the same health insurance plans offered to all other employees of Solo Delaware. |
80
Table of Contents
| (4) | Amounts for 2009, 2008 and 2007 include a whole life insurance premium paid by Solo Delaware on behalf of the named executive officer. Amounts for 2007 also include health insurance premiums paid by Solo Delaware on behalf of the named executive officer through March 2007, when the officer was transferred to the same health insurance plan offered to all other employees of Solo Delaware. |
| (5) | Messrs. Koney and Simmonds joined Solo Delaware in April 2007. |
| (6) | Amount represents relocation allowance and expense reimbursement paid to or on behalf of Mr. Koney. Portions of these amounts were incurred in 2007, but paid in 2008. |
| (7) | Amount represents tax reimbursement on income imputed to the named executive officer for payments made by Solo Delaware for a sign-on bonus and relocation allowances and expenses. |
| (8) | Mr. Pasqualini left Solo Delaware in February 2010 to pursue other opportunities. |
| (9) | Amount represents the fair market value of a company-owned vehicle transferred to Mr. Pasqualini. |
| (10) | Amounts for 2009, 2008 and 2007 include tax reimbursements on income imputed to Mr. Pasqualini for payments made by Solo Delaware on his behalf for a whole life insurance premium or annuity, and certain medical expenses. Amount for 2007 also includes tax reimbursements on income imputed to Mr. Pasqualini for the fair market value of a company-owned vehicle transferred to Mr. Pasqualini and health insurance premiums paid on his behalf by Solo Delaware through March 2007, when the named executive officer was transferred to the same health insurance plans offered to all other employees of Solo Delaware. The tax reimbursements for 2009 totaled $11,268. |
| (11) | Amounts for 2009, 2008 and 2007 include whole life insurance premiums ($11,800 for 2009) and certain medical expenses ($15,194 for 2009) paid by Solo Delaware on behalf of Mr. Pasqualini. Amounts for 2007 also include health insurance premiums paid on Mr. Pasqualini’s behalf by Solo Delaware through March 2007, when the named executive officer was transferred to the same health insurance plan offered to all other employees of Solo Delaware. |
| (12) | Amount represents the fair market value of a company-owned vehicle transferred to Ms. Reed. |
| (13) | Amount represents relocation allowances and expense reimbursements paid to or on behalf of Mr. Simmonds. Portions of these amounts were incurred in 2007, but paid in 2008. In 2007, Mr. Simmonds also received a six-month interest-free loan from us in the amount of $200,000 to allow him to purchase a home in Illinois prior to selling his Georgia home. Such amount was fully repaid by Mr. Simmonds in January 2008. |
| (14) | Amount represents a lump-sum severance payment to Mr. Fronberry in connection with his departure from Solo Cup Operating Corporation in August 2009. |
Long Term Incentive Plan
In March 2010, Solo Delaware’s board of directors amended the Long Term Incentive Plan that it approved in October 2007. A copy of the Long Term Incentive Plan, as amended and restated in March 2010, “LTIP,” is filed as an exhibit to this annual report. The purpose of the LTIP is to provide long-term incentives to selected key management employees of Solo Delaware and its affiliates, including the named executive officers. The principal terms and conditions of the LTIP are as follows:
| • | Awards under the Plan represent the opportunity to receive a cash bonus payment upon the occurrence of any sale, redemption, transfer or other disposition by Vestar of all or a portion of its equity interest in Solo Cup Investment Corporation for cash or marketable securities (a “Liquidity Event”). Vestar currently controls Solo Cup Investment Corporation’s and Solo Delaware’s boards of directors and owns 32.71% of Solo Cup Investment Corporation’s common stock on an as-converted basis. |
81
Table of Contents
| • | The aggregate of all awards available under the LTIP (the “LTIP Award Pool”) will be determined based on a sliding percentage of the equity value of Solo Cup Investment Corporation, as determined by the Solo Delaware board of directors, in accordance with the existing Stockholders’ Agreement of Solo Cup Investment Corporation, upon the occurrence of the earlier of a Liquidity Event or the plan termination date, which is the seventh anniversary of the LTIP’s effective date, as follows: |
| Equity Value of SCIC |
Percentage Used for LTIP Award Pool | ||
| First $240 million |
2.5 | % | |
| Next $240 million |
7.5 | % | |
| Over $480 million |
15.0 | % |
| • | Individual awards under the LTIP (the “Awards”) will be determined by the compensation committee in consultation with Solo Delaware’s CEO and will represent a percentage interest in the LTIP Award Pool. |
| • | If Vestar sells, redeems, transfers or otherwise disposes of less than 100% of its equity interest in Solo Cup Investment Corporation for cash or marketable securities (a “Partial Liquidity Event”), the Solo Delaware board of directors will determine the equity value of Solo Cup Investment Corporation as of the date of such a sale and will calculate the LTIP Award Pool by (1) multiplying such equity value by a ratio corresponding to the percentage of aggregate equity interests held by Vestar that was disposed of in the transaction constituting the Partial Liquidity Event and (2) applying the formula described above to such reduced equity value of Solo Cup Investment Corporation. |
| • | If there are a series of Partial Liquidity Events, the LTIP Award Pool for each such event will take into account the value received in respect of any prior Partial Liquidity Event(s) in order to reflect the intent of the equity value formula described above and to avoid the duplication of benefits. |
| • | If there has not been a Liquidity Event prior to the plan termination date, Solo Delaware’s board of directors will determine the equity value of Solo Cup Investment Corporation as of such date and will establish the LTIP Award Pool based on such valuation, calculated by using half of each applicable percentage amount shown in the table above. |
| • | If a participant’s employment with Solo Delaware or one of its affiliates is terminated for Cause, as defined in the Plan, or he or she resigns voluntarily from Solo Delaware or an affiliate prior to a Liquidity Event, or if no Liquidity Event occurs, prior to the plan termination date, the participant will forfeit his or her Award and immediately cease to participate in the Plan. Notwithstanding the provisions summarized in the previous sentence, in the event a participant’s employment with Solo Delaware or one of its affiliates is terminated after a Partial Liquidity Event has occurred, then (1) if the termination was for Cause, the participant will forfeit his or her award and will have no further rights under the LTIP (including for any payment relating to an earlier Partial Liquidity Event); and (2) if the termination was a result of the participant’s voluntary resignation, the participant’s Award relating to the Partial Liquidity Event will be paid in accordance with the LTIP and the Participant will have no further rights to payments of any kind under the LTIP. |
| • | If a participant’s employment with Solo is terminated (1) without Cause or (2) as a result of death or Disability, as defined in the LTIP, the participant will vest in his or her award based on the number of full years that have elapsed between the date the Award was granted and the termination date, as set forth below: |
| Date of Termination |
Percentage Vested |
||
| Prior to the 1st anniversary of Grant Date |
0 | % | |
| On or after the 1st anniversary of Grant Date and prior to the 2nd anniversary of Grant Date |
20 | % | |
| On or after the 2nd anniversary of Grant Date and prior to the 3rd anniversary of Grant Date |
40 | % | |
| On or after the 3rd anniversary of Grant Date and prior to the 4th anniversary of Grant Date |
60 | % | |
| On or after the 4th anniversary of Grant Date and prior to the 5th anniversary of Grant Date |
80 | % | |
| On or after the 5th anniversary of Grant Date |
100 | % |
| • | Generally, Awards will not be paid until the earlier to occur of (1) a Change in Control, as defined in the Plan, or (2) the plan termination date. If there is a Partial Liquidity Event or a Liquidity Event that does not result in a Change in Control prior to the date of a Change in Control or the plan termination date, Award payments will be credited to a Solo Delaware bookkeeping account that will earn interest at a rate equal to that of the 10-year Treasury Note as in effect as of the last day of the previous calendar quarter, plus two percentage points, compounded quarterly. |
82
Table of Contents
In October 2007, Solo Delaware’s board of directors granted ten percent of the LTIP Award Pool to Mr. Korzenski, and five percent of the LTIP Award Pool to each of Ms. Reed and Messrs. Koney, Pasqualini and Simmonds. No additional grants were made to such individuals in 2008 or 2009. Total grants of 69% (including those to the above named executive officers) of the LTIP Award Pool were outstanding as of December 27, 2009.
Director Compensation
Solo Delaware pays annual compensation of $50,000 to each director who is appointed by Vestar but is not employed by Vestar. For 2009, Mr. Harrison received $50,000 for his services as a director. Solo Delaware also reimburses all directors for reasonable expenses for attending board meetings.
Executive Employment Agreements
The agreements described under this heading “Executive Employment Agreements” and amendments to such agreements are filed as exhibits to this annual report on Form 10-K.
Solo Cup Investment Corporation and Solo Cup Operating Corporation have employment agreements, as amended, with Mr. Korzenski and Ms. Reed. Mr. Korzenski’s agreement commenced on April 14, 2004, and Ms. Reed’s agreement commenced on November 30, 2004. The agreements automatically renew for one-year periods unless the executive or we provide the other with notice of termination at least ninety (90) days prior to its expiration. No notification of termination was provided during the existing terms of the agreements. Accordingly, Mr. Korzenski’s and Ms. Reed’s agreements will automatically renew on April 14, 2010 for additional one-year terms that may again be automatically renewed. In addition to base salary, which is reviewed annually and can be increased but not decreased, each executive is eligible to receive an annual bonus equal to a percentage of annual salary of 65% based on the achievement of a target Adjusted EBITDA level pursuant to the Management Incentive Plan. Upon termination of employment due to death or disability, the employment agreements provide that the executive will be paid all accrued and unpaid base salary and bonus and a prorated annual bonus for the year in which the termination occurs.
If the executive terminates his or her employment for “good reason” or Solo Cup Investment Corporation terminates the executive’s employment without “cause,” as such terms are defined in the employment agreements, Solo Cup Investment Corporation will pay to the executive all accrued and unpaid base salary and bonus, and a severance amount equal to the greater of (A) the amount of base salary that would have been paid over the remainder of the then-current agreement term and (B) two and one-half times annual base salary, each payable in accordance with the normal payroll practices of Solo Cup Investment Corporation.
Additionally, Solo Cup Investment Corporation will provide the executive with continued coverage under the welfare benefit programs covering the executive at the time of termination for the above-described severance period or until the executive obtains similar coverage by a new employer.
Upon termination of an employment agreement following a change-in-control, Mr. Korzenski and Ms. Reed are not entitled to any additional payments or benefits under the employment agreement beyond those described above.
In the event of a termination of employment not for cause, Mr. Koney is entitled to receive a severance amount equal to his annual base salary.
Solo Cup Investment Corporation and Solo Cup Operating Corporation also entered into an employment agreement, as amended, with Mr. Pasqualini that commenced on April 14, 2004. The agreement contained similar terms as described above with respect to Mr. Korzenski and Ms. Reed, except that if Mr. Pasqualini terminated his employment for “good reason” or Solo Cup Investment Corporation terminated his employment without “cause,” as such terms are defined in the employment agreement, Solo Cup Investment Corporation was required to pay Mr. Pasqualini all accrued and unpaid base salary and bonus, and a severance amount equal to the greater of (A) the amount of base salary that would have been paid over the remainder of the then current agreement term and (B) one and one-half times annual base salary, each payable in accordance with the normal payroll practices of Solo Cup Investment Corporation.
Mr. Pasqualini’s employment terminated effective February 1, 2010. In connection therewith, he will receive severance in the amount of $615,000, which represented one and one-half times his annual base salary, payable in installments, net of applicable tax withholding, over an 18-month period on regular payroll dates. Mr. Pasqualini also will receive benefit coverage under our group health, vision and dental plans for such 18-month period or until such earlier time as he receives similar coverage from a new employer. Receipt of such payments and benefits is subject to the terms of his employment agreement (attached as an exhibit to this annual report) and our Code of Business Conduct, as well as compliance with customary confidentiality and non-disparagement provisions.
83
Table of Contents
In the event of a termination of employment not for cause, Mr. Simmonds was entitled to receive a severance amount equal to his annual base salary. Mr. Simmonds’ employment terminated effective January 8, 2010. Mr. Simmonds will receive severance of $325,000, which represented his annual base salary, net of applicable tax withholding, payable in 12 monthly installments. Receipt of such payments is subject to compliance with compliance with the provisions of our Code of Business Conduct, as well as customary confidentiality and non-disparagement provisions.
Compensation Committee Interlocks and Insider Participation
For the fiscal year ended December 27, 2009, the compensation committee of the board of directors of Solo Delaware determined executive compensation. None of its executive officers served as a director or member of the compensation committee or other board committee performing equivalent functions of another corporation. Mr. Long, a director and member of the compensation committee of Solo is also a member of the audit and compensation committees of Argo-Tech Corporation.
84
Table of Contents
| Item 12. | Security Ownership of Certain Beneficial Owners and Management and Related Stockholder Matters. |
All of Solo Delaware’s outstanding capital stock is owned by its parent company, Solo Cup Investment Corporation. Solo Delaware does not maintain any compensation plan under which equity securities of Solo Delaware are authorized for issuance. The following table presents the beneficial ownership of Solo Cup Investment Corporation’s voting stock as of March 15, 2010 by (1) Solo Delaware’s directors and named executive officers, (2) Solo Delaware’s current directors and executive officers as a group, and (3) other persons that beneficially own in excess of 5% of Solo Cup Investment Corporation’s voting stock. As of March 15, 2010, 10,425,100 shares of Solo Cup Investment Corporation common stock, or SCIC common stock, and 240,200 shares of Solo Cup Investment Corporation convertible participating preferred stock, or SCIC preferred stock, were outstanding.
All persons listed in the table below have sole voting and investment power with respect to their shares, except as indicated otherwise. Unless otherwise indicated, the address of each beneficial owner listed in the table below is c/o Solo Cup Company, 150 S. Saunders Road, Suite 150, Lake Forest, Illinois 60045. Beneficial ownership is determined in accordance with the rules of the SEC under which, in general, persons having voting or investment power with respect to a security are beneficial owners of that security. Shares of capital stock issuable pursuant to options or convertible securities, to the extent those options or convertible securities are exercisable or convertible, as applicable, within 60 days as of March 15, 2010, are treated as beneficially owned and outstanding for the purpose of computing the percentage ownership of the person holding the option or convertible security, but are not treated as outstanding for the purpose of computing the percentage ownership of any other person.
| Common Stock | Convertible Participating Preferred Stock |
||||||||||||
| Name of Beneficial Owner |
Shares Beneficially Owned |
Percent of Class Beneficially Owned |
Shares Beneficially Owned |
Percent of Class Beneficially Owned |
Stock Options Exercisable Within 60 Days | ||||||||
| SCC Holding Company LLC(1) |
10,425,100 | 100.0 | %(2) | — | — | — | |||||||
| Vestar Capital Partners IV, L.P. and affiliates(3) |
5,071,200 | (4) | 32.7 | %(4) | 240,000 | 99.9 | % | — | |||||
| Robert L. Hulseman(5) |
10,425,100 | 100.0 | %(2) | — | — | — | |||||||
| Robert M. Korzenski |
2,113 | (4) | * | 100 | * | — | |||||||
| Robert D. Koney, Jr. |
— | — | — | — | — | ||||||||
| Thomas A. Pasqualini |
— | — | — | — | — | ||||||||
| Jan Stern Reed |
2,113 | (4) | * | 100 | * | — | |||||||
| Malcolm S. Simmonds |
— | — | — | — | — | ||||||||
| Neil Harrison |
— | — | — | — | — | ||||||||
| Sheila M. Hulseman(6) |
10,425,100 | 100.0 | %(2) | — | — | — | |||||||
| James R. Hulseman(1) |
— | — | — | — | — | ||||||||
| John D. Hulseman(1) |
— | — | — | — | — | ||||||||
| Jeffrey W. Long(3) |
5,071,200 | (4) | 32.7 | %(4) | 240,000 | 99.9 | % | — | |||||
| Kevin A. Mundt(3) |
5,071,200 | (4) | 32.7 | %(4) | 240,000 | 99.9 | % | — | |||||
| Daniel S. O’Connell(3) |
5,071,200 | (4) | 32.7 | %(4) | 240,000 | 99.9 | % | — | |||||
| Brian P. O’Connor(3) |
5,071,200 | (5) | 32.7 | %(5) | 240,000 | 99.9 | % | — | |||||
| All directors and executive officers as a group (17 persons) (3)(4)(5)(6) |
15,500,526 | (7) | 100.0 | % | 240,200 | 100.0 | % | — | |||||
| * | Indicates less than 1% ownership. |
| (1) | Robert L. Hulseman holds 50% of the voting membership interests of SCC Holding Company LLC. His brother John F. Hulseman, a former Director of Solo Delaware, holds the other 50% of the voting membership of SCC Holding Company LLC. James R. Hulseman and John D. Hulseman, sons of John F. Hulseman and Directors of Solo do not hold any voting membership interests in SCC Holding Company LLC. |
| (2) | If the issued and outstanding shares of SCIC preferred stock convert into shares of SCIC common stock, this percentage would decline to approximately 67.26%. |
85
Table of Contents
| (3) | Vestar Capital Partners IV, L.P. (“Vestar IV”) owns 216,071 shares of SCIC preferred stock, Vestar Cup Investment, LLC (“Vestar I”) owns 18,929 shares of SCIC preferred stock and Vestar Cup Investment II, LLC (“Vestar II”) owns 5,000 shares of SCIC preferred stock. Vestar IV is the managing member of both Vestar I and Vestar II. Vestar IV is a Delaware limited partnership, the general partner of which is Vestar Associates IV, L.P., a Delaware limited partnership. The general partner of Vestar Associates IV, L.P. is Vestar Associates Corporation IV, a Delaware corporation. The board of directors of Vestar Associates Corporation IV consists solely of Daniel S. O’Connell, who also serves as its President and Chief Executive Officer. Messrs. Mundt and Long are managing directors of Vestar IV and Mr. O’Connor is Vice President of Vestar IV. In their roles as directors and/or officers of these entities, Messrs. Long, O’Connell, O’Connor and Mundt may be deemed to share beneficial ownership of Vestar IV’s shares of SCIC common stock and SCIC preferred stock. Each of Messrs. Long, O’Connor and Mundt disclaims beneficial ownership of those shares except to the extent of his pecuniary interest therein. The address of Vestar IV is 245 Park Avenue, 41st Floor, New York, New York 10167. |
| (4) | Represents beneficial ownership of shares of SCIC common stock issuable upon conversion of SCIC preferred stock. |
| (5) | Robert L. Hulseman holds 50% of the voting membership interests of SCC Holding Company LLC and, as a result, may be deemed to beneficially own the shares of SCIC common stock held by SCC Holding Company LLC. Robert L. Hulseman disclaims beneficial ownership of those shares except to the extent of his pecuniary interest therein. |
| (6) | Consists of shares owned by Robert L. Hulseman, Sheila M. Hulseman’s husband, which may be deemed to be beneficially owned by her. Sheila M. Hulseman disclaims beneficial ownership of those shares except to the extent of her pecuniary interest therein. |
| (7) | Includes 5,075,426 shares of common stock issuable upon conversion of the SCIC preferred stock. |
86
Table of Contents
| Item 13. | Certain Relationships and Related Transactions, and Director Independence. |
Robert L. Hulseman, who is the uncle of James R. and John D. Hulseman, and the husband of Sheila M. Hulseman, is the Chairman Emeritus and a director of Solo Delaware. Robert L. Hulseman holds 50% of the voting membership interests of SCC Holding, which owns 67.26% of the voting stock of Solo Cup Investment Corporation, the parent of Solo Delaware. In addition, Sheila M., James R. and John D. Hulseman are directors of Solo Delaware.
SCC Holding’s ownership structure includes ownership interests of 9,867,626 Units of Class A Non-Voting Common Units, 57,474 Class B Voting Common Units, and 500,000 Class A Non-Voting Preferred Units. The Class A Non-Voting Preferred Units, or Preferred Units, require an annual preferred return to each Preferred Unit holder in the amount of $4.30 per Unit. The Preferred Units also have a preference upon the liquidation of SCC Holding in the amount of $43.00 per Unit. The Class A Non-Voting and Class B Voting Common Units are identical, except that the Class B Voting Common Units are voting Units. The Class A Non-Voting and Class B Common Units, known collectively as the Common Units, constitute 100% of the total common units in SCC Holding. Robert L. Hulseman, as a result of his ownership of Class B Voting Common Units, has an economic interest of 0.28954% of SCC Holding’s value allocable to the Common Units and 0.27565% of SCC Holding’s total value allocable to all Preferred and Common Units.
Robert L. Hulseman and Sheila M. Hulseman, indirectly as beneficiaries of trusts, each have an economic interest of approximately 5.75% of SCC Holding’s value allocable to the Common Units and approximately 5.72% of SCC Holding’s total value allocable to all Preferred Units and Common Units. Each of the ten children of Robert L. Hulseman and Sheila M. Hulseman has an economic interest in SCC Holding, either directly or indirectly as the beneficiary of one or more trusts, of 3.98% of the Preferred Units and approximately 3.83% of the Common Units. Each of James R. Hulseman, John D. Hulseman and four of their siblings has an economic interest in SCC Holding, either directly or indirectly as the beneficiary of one or more trusts, of 3.76% of the Preferred Units and approximately 6.30% of the Common Units.
In connection with Solo Delaware’s acquisition of SF Holdings in February 2004, Vestar purchased for cash $240.0 million in SCIC preferred stock. Holders of SCIC preferred stock are entitled to vote on all matters on which the holders of Solo Cup Investment Corporation common stock, or SCIC common stock, are entitled to vote. Each holder of SCIC preferred stock may vote that number of shares of SCIC common stock into which its SCIC preferred stock is convertible. Subject to specified exceptions, the holders of SCIC preferred stock and common stock vote together as a single class. As a result of its ownership of SCIC preferred stock, Vestar controls 32.71% of SCIC’s voting stock.
Also in connection with the SF Holdings acquisition, Vestar and SCC Holding entered into several agreements, including a preferred stock purchase agreement, management agreements, the stockholders’ agreement and a registration rights agreement relating to, among other things, ownership of, and registration rights with respect to, voting stock in Solo Cup Investment Corporation.
In connection with our February 2004 acquisition of SF Holdings, Solo Delaware and Solo Cup Investment Corporation entered into two management agreements: one with SCC Holding and one with Vestar. The Vestar management agreement provides for, among other things, the payment of an $800,000 annual management fee by Solo Cup Investment Corporation to Vestar. The management agreement with SCC Holding provided for, among other things, the payment of a $2.5 million annual management fee by Solo Cup Investment Corporation to SCC Holding or an affiliate or successor of SCC Holding. The management agreement with SCC Holding was amended in connection with the July 2009 refinancing transactions, and pursuant to that amendment, the amount of the annual management fee payable to SCC Holding was reduced from $2.5 million to $800,000. In 2009, each of SCC Holding and Vestar received an annual management fee of $800,000 under its respective management agreement. In addition, pursuant to the terms of the Vestar management agreement, Solo Cup Investment Corporation paid Vestar approximately $220,000 for out-of-pocket expenses.
The SCC Holding management agreement terminates when SCC Holding ceases to beneficially own at least 10% of the SCIC common stock, and similarly, the Vestar management agreement terminates when Vestar ceases to beneficially own at least 10% of the SCIC common stock.
In December 2006, in connection with the transition of control of Solo Delaware’s and Solo Cup Investment Corporation’s board of directors, Solo Delaware and Solo Cup Investment Corporation entered into a transition agreement with Vestar and SCC Holding. Among other things, the transition agreement determines the compensation of “Solo Family Members,” which is defined as any individual who held beneficial interests in units of SCC Holding on the date of the closing of the acquisition of SF Holdings and any immediate family member thereof.
87
Table of Contents
Solo Delaware currently employs Robert L. and Sheila M. Hulseman’s son, Paul J. Hulseman, as a Senior Vice President. In this capacity, he received salary and benefits of approximately $286,540 in 2009. Solo Delaware currently employs Robert L. and Sheila M. Hulseman’s son, Thomas J. Hulseman, as a Director of International Marketing. In this capacity, he received salary and benefits of approximately $175,000 in 2009.
Solo Delaware currently employs Robert L. and Sheila M. Hulseman’s son-in-law, Joseph P. Kovach, as a Vice President — Operations. In this capacity, he received salary and benefits of approximately $255,500 in 2009. James R. Hulseman, a Director of Solo Delaware is also Vice President, Special Projects of the company. As Vice President, he received salary and benefits of approximately $247,950 in 2009. Solo Delaware also employs John D. Hulseman, one of its Directors, as Energy Manager, for which he received salary and benefits of approximately $47,000 in 2009. James R. and John D. Hulseman are brothers, as well as nephews of Robert L. and Sheila M. Hulseman. Solo Delaware also paid John F. Hulseman $114,000 pursuant to the stockholders’ agreement and the transition agreement.
In accordance with the transition agreement, the salary that we pay to each Solo Family Member employed by us (other than Robert L. Hulseman who was paid $295,000 for his role as Chairman Emeritus in 2009) is commensurate with the salaries that we pay to other employees holding similar positions. Aggregate annual amounts paid to all Solo Family Members cannot exceed $1.5 million, excluding any management fees paid to SCC Holding. The Solo Family Members that we employ also receive health and life insurance benefits and reimbursement of personal expenses commensurate with those being provided to our executive officers. The Solo Family Members are also subject to the same employee policies as all of our other employees.
Any Solo Family Member that may be terminated by us with or without cause would be entitled to severance benefits under the then-existing policy, provided however, that the severance benefits may not be for less than six months. In 2007, 2008 and 2009, Robert L. Hulseman was provided with office space and secretarial services, and until the termination of the transition agreement, Solo Delaware will provide him with an automobile consistent with terms of its policies related thereto as of the date of the transition agreement, subject to the terms therein.
As provided for in the stockholders’ agreement and in accordance with the transition agreement, as of December 2006, the size of the board of directors of Solo Delaware and Solo Cup Investment Corporation increased by four members to a total of eleven directors, and Vestar appointed four additional directors. Following these appointments on December 15, 2006, directors appointed by Vestar constituted a majority of each of Solo Delaware’s and Solo Cup Investment Corporation’s board of directors. The directors currently appointed by Vestar are Neil Harrison, Kevin A. Mundt, Daniel S. O’Connell, Brian P. O’Connor and Jeffrey W. Long. Currently, Vestar has the right to appoint one additional director to the board of directors of each of Solo Delaware and SCIC to fill a vacancy on the board of directors of each company. Directors appointed by Vestar who are neither employees nor equity owners of Vestar receive $50,000 annually as compensation for director services. Currently, only Mr. Harrison receives director compensation. In August 2007, Solo Delaware extended an interest-free loan of $200,000 to Malcolm S. Simmonds, its then Senior Vice President of Foodservice and Marketing and an NEO to allow him to purchase a home in Illinois prior to selling his home in Georgia. Mr. Simmonds, who left Solo Delaware in January 2010, fully repaid the loan in January 2008. In July 2008, Solo Delaware extended an interest-free loan of $200,000 to one of its senior executive officers, who is not a named executive officer, to assist with his relocation. The loan was fully repaid in July 2009.
In February 2009, Solo Cup Operating Corporation entered into an agreement with Sun Products Corporation under which Solo Cup Operating Corporation leased to Sun a warehouse located in Havre de Grace, Maryland that we closed in December 2008. Mr. Mundt, Chairman of Solo Delaware’s board of directors, and Mr. O’Connell, a Director of Solo Delaware, are also directors of Sun, and one or more Vestar entities have an equity interest in Sun. During September 2009, Solo Cup Operating Corporation sold the Havre de Grace property and simultaneously assigned the lease to the new owner. One of the contractual terms of the purchase agreement requires Solo Cup Operating Corporation to lease the property from the new owner for years 8-15 beginning in 2016 in the event Sun does not renew the lease.
The board of directors of Solo Delaware has not yet adopted formal written policies and procedures regarding related person transactions. Solo Delaware took initial steps to evaluate a number of the related person transactions through its entry into the transition agreement. None of the directors of Solo Delaware are “independent” under standards established by the New York Stock Exchange.
88
Table of Contents
| Item 14. | Principal Accounting Fees and Services. |
Relationship with Independent Registered Public Accounting Firm
KPMG LLP has served as our independent registered public accounting firm since 2002. Since July 13, 2004, when Solo Delaware became a registrant, the Board of Directors (the Audit Committee beginning February 2007) has pre-approved all audit and non-audit services provided by KPMG LLP. KPMG LLP’s fees for the years ended December 27, 2009 and December 28, 2008 were as follows (in thousands):
| For the year ended December 27, 2009 | For the year ended December 28, 2008 | |||||
| Audit fees (1) |
$ | 1,630 | $ | 1,649 | ||
| Audit-related fees (2) |
135 | — | ||||
| Tax fees (3) |
34 | 77 | ||||
| Other |
2 | 83 | ||||
| Total |
$ | 1,801 | $ | 1,809 | ||
| (1) | Audit fees consisted of work performed for the audit of financial statements, quarterly financial statement reviews, statutory audits, and filings with the SEC. |
| (2) | Audit-related fees consisted of all services performed by the independent auditors in relation to our issuance and registration of senior secured notes. |
| (3) | Tax fees consisted of all services performed by the independent auditor’s tax personnel, except those related to the audit of financial statements. |
The Audit Committee reviews all relationships between KPMG LLP and Solo Delaware, including the provision of non-audit services, which may relate to the auditor’s independence. The Board of Directors’ pre-approval is required to retain KPMG LLP for any services and for the fees payable for such services.
| Item 15. | Exhibits and Financial Statement Schedules. |
| (a) | The following documents are filed as part of this Report: |
| 1. | Financial Statements: |
See Item 8, “Financial Statements and Supplementary Data,” beginning on page 29 of this document.
| 2. | Financial Statement Schedules: |
All schedules are omitted because of the absence of conditions under which they are required or because information called for is shown in the consolidated financial statements and notes thereto in Item 8.
| 3. | Exhibits: |
See Index of Exhibits beginning on page 92 of this document.
89
Table of Contents
SIGNATURES
Pursuant to the requirements of Section 13 or 15(d) of the Securities Exchange Act of 1934, the Registrant has duly caused this report to be signed on its behalf by the undersigned, thereunto duly authorized.
| SOLO CUP COMPANY | ||
| By: | /s/ Robert M. Korzenski | |
| Robert M. Korzenski | ||
| President and Chief Executive Officer (Principal Executive Officer and Duly Authorized Officer) | ||
Date: March 25, 2010
Pursuant to the requirements of the Securities Exchange Act of 1934, this report has been signed below by the following persons on behalf of the Registrant in the capacities and on the date indicated.
| By: | /s/ Robert L. Hulseman |
Date: March 25, 2010 | ||||
| Robert L. Hulseman | ||||||
| Chairman Emeritus | ||||||
| By: | /s/ Kevin A. Mundt |
Date: March 25, 2010 | ||||
| Kevin A. Mundt | ||||||
| Chairman of the Board | ||||||
| By: | /s/ Robert M. Korzenski |
Date: March 25, 2010 | ||||
| Robert M. Korzenski | ||||||
| Chief Executive Officer, President and Director (Principal Executive Officer) | ||||||
| By: | /s/ Robert D. Koney, Jr. |
Date: March 25, 2010 | ||||
| Robert D. Koney, Jr. | ||||||
| Executive Vice President and Chief Financial Officer (Principal Financial and Accounting Officer) | ||||||
| By: | /s/ Brian P. O’Connor |
Date: March 25, 2010 | ||||
| Brian P. O’Connor | ||||||
| Director | ||||||
| By: | /s/ Neil Harrison |
Date: March 25, 2010 | ||||
| Neil Harrison | ||||||
| Director | ||||||
| By: | /s/ James R. Hulseman |
Date: March 25, 2010 | ||||
| James R. Hulseman | ||||||
| Director | ||||||
| By: | /s/ John D. Hulseman |
Date: March 25, 2010 | ||||
| John D. Hulseman | ||||||
| Director | ||||||
| By: | /s/ Sheila M. Hulseman |
Date: March 25, 2010 | ||||
| Sheila M. Hulseman | ||||||
| Director | ||||||
| By: | /s/ Jeffrey W. Long |
Date: March 25, 2010 | ||||
| Jeffrey W. Long | ||||||
| Director | ||||||
90
Table of Contents
| By: |
/s/ Daniel S. O’Connell |
Date: March 25, 2010 | ||||
| Daniel S. O’Connell | ||||||
| Director |
Supplemental Information to be Furnished With Reports Filed Pursuant to Section 15(d) of the Act by Registrants Which Have Not Registered Securities Pursuant to Section 12 of the Act:
No annual report or proxy material has been sent to security holders of Solo Cup Company.
91
Table of Contents
INDEX OF EXHIBITS FILED WITH OR
INCORPORATED BY REFERENCE INTO
FORM 10-K OF SOLO CUP COMPANY
FOR THE YEAR ENDED DECEMBER 27, 2009
| Exhibit |
Exhibit Description | |
| †3.1 | Amended and Restated Certificate of Incorporation of Solo Cup Company (incorporated by reference to Exhibit 3.1 to the Form S-4 filed by Solo Cup Company on June 24, 2004) | |
| †3.2 | Second Amended and Restated By-laws of Solo Cup Company (incorporated by reference to Exhibit 99.1 to the Form 8-K filed by Solo Cup Company on June 24, 2005) | |
| †3.3 | Amended and Restated Certificate of Incorporation of Solo Cup Operating Corporation (f/k/a Sweetheart Cup Company Inc.) (incorporated by reference to Annex A-1 to Exhibit A to Exhibit 3.12 to the Form S-4 filed by Solo Cup Company on June 24, 2004) | |
| †3.4 | Amended and Restated By-laws of Solo Cup Operating Corporation (f/k/a Sweetheart Cup Company Inc.) (incorporated by reference to Exhibit 3.4 to the Form S-4 filed by Solo Cup Company on December 4, 2009) | |
| †3.5 | Amended and Restated Certificate of Incorporation of SF Holdings Group, Inc. (incorporated by reference to Exhibit A to Exhibit 3.10 to the Form S-4 filed by Solo Cup Company on June 24, 2004) | |
| †3.6 | Amended and Restated By-laws of SF Holdings Group, Inc. (incorporated by reference to Exhibit 3.6 to the Form S-4 filed by Solo Cup Company on December 4, 2009) | |
| †3.7 | Certificate of Incorporation of Lily-Canada Holding Corporation (incorporated by reference to Exhibit 3.14 to the Form S-4 filed by Solo Cup Company on June 24, 2004) | |
| †3.8 | Amended and Restated By-laws of Lily-Canada Holding Corporation (incorporated by reference to Exhibit 3.8 to the Form S-4 filed by Solo Cup Company on December 4, 2009) | |
| †3.9 | Certificate of Formation of Solo Manufacturing LLC (incorporated by reference to Exhibit 3.9 to the Form S-4 filed by Solo Cup Company on December 4, 2009) | |
| †3.10 | Limited Liability Company Agreement of Solo Manufacturing LLC (incorporated by reference to Exhibit 3.10 to the Form S-4 filed by Solo Cup Company on December 4, 2009) | |
| †3.11 | Certificate of Trust of Solo Cup Owings Mills Holdings (incorporated by reference to Exhibit 3.11 to the Form S-4 filed by Solo Cup Company on December 4, 2009) | |
| †3.12 | Trust Agreement, dated as of June 24, 2009 between Solo Cup Operating Corporation and Wilmington Trust Company (incorporated by reference to Exhibit 3.12 to the Form S-4 filed by Solo Cup Company on December 4, 2009) | |
| †3.13 | Certificate of Incorporation of P. R. SOLO CUP, INC. (incorporated by reference to Exhibit 3.7 to the Form S-4 filed by Solo Cup Company on June 24, 2004) | |
| †3.14 | By-laws of P. R. SOLO CUP, INC. (incorporated by reference to Exhibit 3.8 to the Form S-4 filed by Solo Cup Company on June 24, 2004) | |
| †3.15 | First Amendment to By-laws of P. R. SOLO CUP, INC. (incorporated by reference to Exhibit 3.15 to the Form S-4 filed by Solo Cup Company on December 4, 2009) | |
| †3.16 | Certificate of Incorporation of Solo Cup (UK) Limited (incorporated by reference to Exhibit 3.22 to the Form S-4 filed by Solo Cup Company on June 24, 2004) | |
| †3.17 | Memorandum of Association and Articles of Association of Solo Cup (UK) Limited (f/k/a Realglass Limited) (incorporated by reference to Exhibit 3.17 to the Form S-4 filed by Solo Cup Company on December 4, 2009) | |
| †3.18 | Certificate of Incorporation of Insulpak Holdings Limited (incorporated by reference to Exhibit 3.24 to the Form S-4 filed by Solo Cup Company on June 24, 2004) | |
| †3.19 | Articles of Association and Memorandum of Association of Insulpak Holdings Limited (incorporated by reference to Exhibit 3.19 to the Form S-4 filed by Solo Cup Company on December 4, 2009) | |
92
Table of Contents
| Exhibit |
Exhibit Description | |
| †3.20 | Certificate of Incorporation of Solo Cup Europe Limited (incorporated by reference to Exhibit 3.26 to the Form S-4 filed by Solo Cup Company on June 24, 2004) | |
| †3.21 | Memorandum of Association and Articles of Association of Solo Cup Europe Limited (incorporated by reference to Exhibit 3.21 to the Form S-4 filed by Solo Cup Company on December 4, 2009) | |
| †4.1 | Indenture, dated as of February 27, 2004, by and among Solo Cup Company, a Delaware corporation, certain guarantors of Solo Cup Company and U.S. Bank National Association, as Trustee (incorporated by reference to Exhibit 4.2 to the Form S-4 filed by Solo Cup Company on June 24, 2004) | |
| †4.2 | Form of 8 1/2% Senior Subordinated Notes (incorporated by reference to Exhibit A to Exhibit 4.2 to the Form S-4 filed by Solo Cup Company on June 24, 2004) | |
| †4.3 | First Supplemental Indenture dated as of June 18, 2004, by and among Solo Cup Company, a Delaware corporation, certain guarantors of Solo Cup Company and U.S. Bank National Association, as Trustee (incorporated by reference to Exhibit 4.4 to the Form S-4 filed by Solo Cup Company on June 24, 2004) | |
| †4.4 | Certificate of Designations of Convertible Participating Preferred Stock of Solo Cup Investment Corporation (incorporated by reference to Exhibit 4.5 to the Form S-4 filed by Solo Cup Company on June 24, 2004) | |
| †4.5 | Certificate of Designations of Redeemable Preferred Stock of Solo Cup Investment Corporation (incorporated by reference to Exhibit 4.6 to the Form S-4 filed by Solo Cup Company on June 24, 2004) | |
| †4.6 | Indenture, dated as of July 2, 2009, among Solo Cup Company, Solo Cup Operating Corporation, the guarantors listed on the signature pages thereto and U.S. Bank National Association, as trustee (incorporated by reference to Exhibit 4.6 to the Form 8-K filed by Solo Cup Company on July 9, 2009) | |
| †4.7 | Security Agreement dated as of July 2, 2009 by and among Solo Cup Company, Solo Cup Operating Corporation, the other subsidiaries of Solo Cup Company listed on the signature pages thereof and U.S. Bank National Association, as collateral trustee (incorporated by reference to Exhibit 4.8 to the Form 8-K filed by Solo Cup Company on July 9, 2009) | |
| †4.8 | Notes Debenture dated July 2, 2009 between U.S. Bank National Association, as collateral trustee, and Solo Cup (UK) Limited, Insulpak Holdings Limited and Solo Cup Europe Limited as the Chargors (incorporated by reference to Exhibit 4.9 to the Form 8-K filed by Solo Cup Company on July 9, 2009) | |
| †4.9 | Collateral Trust Agreement, dated as of July 2, 2009, by and among Solo Cup Company, Solo Cup Operating Corporation, the guarantors from time to time party thereto, U.S. Bank National Association, as trustee, the other secured debt representatives from time to time party thereto, and U.S. Bank National Association, as collateral trustee (incorporated by reference to Exhibit 4.10 to the Form 8-K filed by Solo Cup Company on July 9, 2009) | |
| †4.10 | Lien Subordination and Intercreditor Agreement, dated as of July 2, 2009, among Bank of America, N.A., as agent for the ABL Secured Parties referred to therein, U.S. Bank National Association, as collateral trustee for the Priority Lien Secured Parties and the Subordinated Lien Secured Parties referred to therein, Solo Cup Company, Solo Cup Operating Corporation and the subsidiaries of Solo Cup Company named therein (incorporated by reference to Exhibit 4.11 to the Form 8-K filed by Solo Cup Company on July 9, 2009) | |
| †4.11 | Form of 10.5% Senior Secured Notes due 2013 (included in Exhibit A to Exhibit 4.6) | |
| †4.12 | Second Supplemental Indenture dated as of June 30, 2005, by and among Solo Cup Company, certain guarantors of Solo Cup Company and U.S. Bank National Association, as Trustee (incorporated by reference to Exhibit 4.13 to the Form 10-Q filed on August 11, 2009) | |
| †4.13 | Third Supplemental Indenture dated as of July 2, 2009, by and among Solo Cup Company, certain guarantors of Solo Cup Company and U.S. Bank National Association, as Trustee (incorporated by reference to Exhibit 4.14 to the Form 10-Q filed on August 11, 2009) | |
93
Table of Contents
| Exhibit |
Exhibit Description | |
| †10.1 | The Solo Cup Company Management Incentive Plan (incorporated by reference to Exhibit 10.35 to the Form 10-Q filed by Solo Cup Company on May 15, 2007) * | |
| 10.2 | Solo Cup Company Management Long-Term Incentive Plan dated October 1, 2007, as amended as of March 24, 2010* | |
| †10.3 | Employment Agreement, dated as of April 14, 2004, among Solo Cup Investment Corporation, Solo Cup Operating Corporation and Robert M. Korzenski (incorporated by reference to Exhibit 10.11 to the Form S-4 filed by Solo Cup Company on June 24, 2004) * | |
| †10.4 | Amendment No. 1, dated as of July 26, 2006, to Employment Agreement dated as of April 14, 2004, by and between Solo Cup Investment Corporation, Solo Cup Operating Corporation and Robert M. Korzenski (incorporated by reference to Exhibit 10.5 to the Form 10-Q filed by Solo Cup Company on October 16, 2006) * | |
| †10.5 | Amendment No. 2, dated as of October 11, 2006, to Employment Agreement dated as of April 14, 2004, by and between Solo Cup Investment Corporation, Solo Cup Operating Corporation and Robert M. Korzenski (incorporated by reference to Exhibit 10.8 to the Form 10-Q filed by Solo Cup Company on October 16, 2006) * | |
| †10.6 | Amendment No. 3, dated as of December 12, 2008, to Employment Agreement dated as of April 14, 2004, by and between Solo Cup Investment Corporation, Solo Cup Operating Corporation (successor by merger to Solo Cup Company, an Illinois corporation) and Robert M. Korzenski (incorporated by reference to Exhibit 99.3 to the Form 8-K filed by Solo Cup Company on December 23, 2008) * | |
| †10.7 | Employment Agreement, dated as of April 14, 2004, among Solo Cup Investment Corporation, Solo Cup Operating Corporation and Tom Pasqualini (incorporated by reference to Exhibit 10.12 to the Form S-4 filed by Solo Cup Company on June 24, 2004) * | |
| †10.8 | Amendment No. 1, dated as of July 26, 2006, to Employment Agreement dated as of April 14, 2004, by and between Solo Cup Investment Corporation, Solo Cup Operating Corporation and Tom Pasqualini (incorporated by reference to Exhibit 10.6 to the Form 10-Q filed by Solo Cup Company on October 16, 2006) * | |
| †10.9 | Amendment No. 2, dated as of December 12, 2008, to Employment Agreement dated as of April 14, 2004, by and between Solo Cup Investment Corporation, a Delaware corporation, Solo Cup Operating Corporation, a Delaware corporation (successor by merger to Solo Cup Company, an Illinois corporation) and Tom Pasqualini (incorporated by reference to Exhibit 99.4 to the Form 8-K filed by Solo Cup Company on December 23, 2008) * | |
| †10.10 | Employment Agreement, dated as of November 30, 2004, among Solo Cup Investment Corporation, Solo Cup Operating Corporation and Jan Stern Reed (incorporated by reference to Exhibit 99.1 to the Form 8-K filed by Solo Cup Company on December 3, 2004) * | |
| †10.11 | Amendment No. 1, dated as of July 26, 2006, to Employment Agreement dated as of November 30, 2004, by and between Solo Cup Investment Corporation, Solo Cup Operating Corporation and Jan Stern Reed (incorporated by reference to Exhibit 10.4 to the Form 10-Q filed by Solo Cup Company on October 16, 2006) * | |
| †10.12 | Amendment No. 2, dated as of October 11, 2006, to Employment Agreement dated as of November 30, 2004, by and between Solo Cup Investment Corporation, a Delaware corporation, Solo Cup Operating Corporation, a Delaware corporation (successor by merger to Solo Cup Company, an Illinois corporation) and Jan Stern Reed (incorporated by reference to Exhibit 10.7 to the Form 10-Q filed by Solo Cup Company on October 16, 2006) * | |
| †10.13 | Amendment No. 3, dated as of December 12, 2008, to Employment Agreement dated as of November 30, 2004, by and between Solo Cup Investment Corporation, a Delaware corporation, Solo Cup Operating Corporation, a Delaware corporation (successor by merger to Solo Cup Company, an Illinois corporation) and Jan Stern Reed (incorporated by reference to Exhibit 99.5 to the Form 8-K filed by Solo Cup Company on December 23, 2008) * | |
94
Table of Contents
| Exhibit |
Exhibit Description | |
| †10.14 | Management Agreement, dated as of February 27, 2004, among Solo Cup Investment Corporation, Solo Cup Company and Vestar Capital Partners (incorporated by reference to Exhibit 10.16 to the Form S-4 filed by Solo Cup Company on June 24, 2004) | |
| †10.15 | Amendment No. 1, dated as of December 19, 2008, to Management Agreement, dated as of February 27, 2004, among Solo Cup Investment Corporation, Solo Cup Company and Vestar Capital Partners (incorporated by reference to Exhibit 99.1 to the Form 8-K filed by Solo Cup Company on December 23, 2008) | |
| †10.16 | Management Agreement, dated as of February 27, 2004, among Solo Cup Investment Corporation, Solo Cup Company and SCC Holding Company LLC (incorporated by reference to Exhibit 10.17 to the Form S-4 filed by Solo Cup Company on June 24, 2004) | |
| †10.17 | Amendment No. 1, dated as of December 19, 2008, to Management Agreement, dated as of February 27, 2004, among Solo Cup Investment Corporation, Solo Cup Company, a Delaware corporation, and SCC Holding Company LLC (incorporated by reference to Exhibit 99.2 to the Form 8-K filed by Solo Cup Company on December 23, 2008) | |
| †10.18 | Amendment No. 2, dated as of June 30, 2009, to Management Agreement, dated as of February 27, 2004, among Solo Cup Investment Corporation, Solo Cup Company, a Delaware corporation, and SCC Holding Company LLC (incorporated by reference to Exhibit 99.1 to the Form 8-K filed on July 7, 2009) | |
| †10.19 | Stockholders’ Agreement, dated as of February 27, 2004, among Vestar Capital Partners IV, L.P., Vestar Cup Investment, LLC, Vestar Cup Investment II, LLC, SCC Holding Company LLC, Solo Cup Investment Corporation and Solo Cup Company (Robert M. Korzenski, and Thomas Pasqualini became parties to the Stockholders’ Agreement effective April 14, 2004 and Jan Stern Reed effective November 30, 2004, by executing a joinder agreement in the form of Exhibit 10.19 to the Form S-4 filed by Solo Cup Company on June 24, 2004) (incorporated by reference to Exhibit 10.18 to the Form S-4 filed by Solo Cup Company on June 24, 2004) | |
| †10.20 | Amendment No. 1, dated as of June 26, 2008, to Stockholders’ Agreement, dated as of February 27, 2004, among Vestar Capital Partners IV, L.P., Vestar Cup Investment, LLC, Vestar Cup Investment II, LLC, SCC Holding Company LLC, Solo Cup Company, Solo Cup Investment Corporation and the parties identified on the signature pages thereto as Management Investors (incorporated by reference to Exhibit 10.32 to the Form 8-K filed by Solo Cup Company on July 2, 2008) | |
| †10.21 | Transition Agreement, dated December 14, 2006, among Vestar Capital Partners IV, L.P., Vestar Cup Investment, LLC, Vestar Cup Investment II, LLC, SCC Holding Company LLC, Solo Cup Investment Corporation and Solo Cup Company (incorporated by reference to Exhibit 10.1 to the Form 8-K filed by Solo Cup Company on December 15, 2006) | |
| †10.22 | Form of Joinder to Stockholders’ Agreement (incorporated by reference to Exhibit 10.19 to the Form S-4 filed by Solo Cup Company on June 24, 2004) | |
| †10.23 | Registration Rights Agreement, dated as of February 27, 2004, between Solo Cup Investment Corporation, SCC Holding Company LLC, Vestar Capital Partners IV, L.P., Vestar Cup Investment, LLC, and Vestar Cup Investment II, LLC (Robert M. Korzenski and Thomas Pasqualini became parties to the Stockholders’ Agreement effective April 14, 2004 and Jan Stern Reed effective November 30, 2004, by executing a joinder agreement in the form of Exhibit 10.21 to the Form S-4 filed by Solo Cup company on June 24, 2004) (incorporated by reference to Exhibit 10.20 to the Form S-4 filed by Solo Cup Company on June 24, 2004) | |
| †10.24 | Form of Joinder to Registration Rights Agreement (incorporated by reference to Exhibit 10.21 to the Form S-4 filed by Solo Cup Company on June 24, 2004) | |
| †10.25 | Credit Agreement dated as of September 24, 2004 between Lily Cups Inc. as Borrower and GE Canada Finance Holding Company as Agent and Lender (incorporated by reference to Exhibit 4.7 to the Form 10-Q filed by Solo Cup Company on November 5, 2004) | |
| †10.26 | Amendment Agreement dated as of October 19, 2006 to Credit Agreement dated as of September 24, 2004 between Lily Cups Inc. as Borrower and GE Canada Finance Holding Company as Agent and Lender (incorporated by reference to Exhibit 99.1 to the Form 8-K filed by Solo Cup Company on October 25, 2006) | |
95
Table of Contents
| Exhibit |
Exhibit Description | |
| †10.27 | Second Amendment Agreement, dated November 16, 2007, to Credit Agreement dated as of September 24, 2004, between Solo Cup Canada Inc. and GE Canada Finance Holding Company (incorporated by reference to Exhibit 10.40 to the Form 8-K filed by Solo Cup Company on November 21, 2007) | |
| †10.28 | Third Amendment Agreement, dated March 2, 2009, to Credit Agreement dated as of September 24, 2004, between Solo Cup Canada Inc. and GE Canada Finance Holding Company (incorporated by reference to Exhibit 99.1 to the Form 8-K filed by Solo Cup Company on March 5, 2009) | |
| †10.29 | Lease Agreement between iSTAR SCC Distribution Centers LLC, as Landlord and Solo Cup Operating Corporation and SF Holdings Group, Inc. and Solo Cup Company, jointly and severally as Tenant, dated as of June 27, 2007 (incorporated by reference to Exhibit 10.31 to the Form S-4 filed by Solo Cup Company on December 4, 2009) | |
| †10.30 | Loan Agreement, dated as of July 2, 2009, among Solo Cup Company, Solo Cup Operating Corporation, certain subsidiaries of Solo Cup Company from time to time party thereto as guarantors, the financial institutions from time to time party thereto as lenders, Bank of America, N.A., as a co-collateral agent and as administrative agent for the lenders, and General Electric Capital Corporation, as a co-collateral agent for the lenders (incorporated by reference to Exhibit 10.37 to the Form 8-K filed on July 9, 2009) | |
| †10.31 | Security Agreement dated July 2, 2009 made by Solo Cup Company, Solo Cup Operating Corporation and the other subsidiaries of Solo Cup Company listed on the signature pages thereof to Bank of America, N.A., as administrative agent (incorporated by reference to Exhibit 10.38 to the Form 8-K filed by Solo Cup Company on July 9, 2009) | |
| †10.32 | ABL Debenture dated July 2, 2009 between Bank of America, N.A., as agent, and Solo Cup (UK) Limited, Insulpak Holdings Limited and Solo Cup Europe Limited (incorporated by reference to Exhibit 10.39 to the Form 8-K filed by Solo Cup Company on July 9, 2009) | |
| 21 | List of Subsidiaries of Solo Cup Company, a Delaware corporation | |
| 31.1 | Certification of Principal Executive Officer Pursuant to Section 302 of the Sarbanes-Oxley Act of 2002 | |
| 31.2 | Certification of Principal Financial and Accounting Officer Pursuant to Section 302 of the Sarbanes-Oxley Act of 2002 | |
| 32.1 | Certification of Principal Executive Officer Pursuant to 18 U.S.C. Section 1350, as Adopted Pursuant to Section 906 of the Sarbanes-Oxley Act of 2002 | |
| 32.2 | Certification of Principal Financial and Accounting Officer Pursuant to 18 U.S.C. Section 1350, as Adopted Pursuant to Section 906 of the Sarbanes-Oxley Act of 2002 | |
| † | Previously filed |
| * | Indicates a management contract or a compensatory plan or agreement. |
96