Attached files
| file | filename |
|---|---|
| 8-K - FORM 8-K - Nalco Holding CO | d8k.htm |
 Essential
Expertise for Water, Energy and Air Bradley J. Bell Executive Vice President, Chief Financial Officer Bank of America Merrill Lynch Credit Conference December 3, 2009 Exhibit 99.1 SM |
 2 Forward-Looking Statements and Regulation G This presentation includes “forward-looking statements” within the meaning of Section
27A of the Securities Act of 1933 and Section 21E of the Securities Exchange Act of
1934. These forward-looking statements include statements concerning our plans, objectives, goals, strategies, future events, future revenue or performance, capital expenditures, financing needs, plans or intentions
relating to acquisitions, business trends and other information that is not historical
information. When used in this presentation, the words “estimates,” “expects,” “anticipates,” “projects,” “plans,” “intends,” “believes,” “forecasts,” or future or conditional verbs,
such as “will,” “should,” “could” or “may,” and variations of such words or similar expressions are intended to identify forward-looking statements. All forward-looking
statements, including, without limitation, management’s examination of historical
operating trends and data are based upon our current expectations and various assumptions. Our expectations, beliefs and projections are expressed in good faith and we believe there is a reasonable basis for them.
However, there can be no assurance that management’s expectations, beliefs and
projections will be achieved. There are a number of risks and uncertainties that could cause our actual results to differ
materially from the forward-looking statements contained in this presentation.
Important factors that could cause our actual results to differ materially from the forward-looking statements we make in this presentation. Such risks, uncertainties and other important factors include, among others:
our leverage; limitations on flexibility in operating our business contained in our
debt agreements; increases in interest rates as a result of our variable rate indebtedness; pricing pressure from our customers; technological change and innovation; risks associated with our non-U.S. operations;
fluctuations in currency exchange rates; high competition in the markets in which we
operate; adverse changes to environmental, health and safety regulations; operating hazards in our production facilities; inability to achieve expected cost savings; difficulties in securing or
changes in the pricing of the raw materials we use; our significant pension benefit
obligations and the current underfunding of our pension plans; our ability to realize the full value of our intangible assets; our ability to attract and retain skilled employees, particularly research scientists, technical
sales professionals and engineers; and our ability to protect our intellectual property
rights. There may be other factors that may cause our actual results to differ materially from the forward-looking statements. All forward-looking statements attributable to us or persons acting on our behalf apply only as
of the date of this presentation and are expressly qualified in their entirety by the
cautionary statements included in this presentation. We undertake no obligation to update or revise forward-looking statements which may be made to reflect events or circumstances that arise after the date made or
to reflect the occurrence of unanticipated events. Non-GAAP measures may be discussed in today’s presentation. Management believes that
discussion of these measures provides investors with additional insight into the
ongoing operations of Nalco Holding Company. Non-GAAP measures are reconciled to the closest GAAP measure in measures used to determine compliance with the Company’s debt covenants or to assess the
ongoing performance of the business. Free Cash Flow is defined as Cash from
Operations less Capital Expenditures and Minority Interest charges. In addition, Nalco may discuss sales growth in terms of nominal (actual), organic (nominal less foreign currency and acquisition/divestiture/merger/joint
venture impacts), and real (organic growth less that portion of the growth which
consists of price increases that simply pass along higher raw and purchased material costs). The non-GAAP measures should not be viewed as an alternative to GAAP measures of performance. Furthermore, these
measures may not be consistent with similar measures provided by other companies.
schedules attached to our earnings releases, which may be found at www.nalco.com. Adjusted EBITDA and Pro Forma EBITDA are non-GAAP |
 3 Investment Highlights • Leading Market Positions • Integrated, Innovative Technology, Sales and Service Model • Unmatched Global Presence • Significant Top-line Growth Potential • World Class Selling and Service Team • Strong Free Cash Flows • Continued Cost Saving Opportunities • Deep Management Team Nalco is a Service Company with: Financial Targets: 6-8% Real Revenue Growth by 2011 EBITDA Growth Targets: 2009 – Environment Dependent Mid-term –
High single digits Longer-term – Double-digits Significant EPS Growth |
 4 • Cooling water treatment – Scale control, microbial fouling, corrosion control • Boiling water treatment – Pre-treatment, condensate control, internal treatment • Raw and wastewater treatment • Mining and mineral process aids • Other water- and air-based process applications • Air emission control and combustion efficiency $7.5 billion global market #1 Market Position 18% Market Share $1,515 million $778 million $1,919 million A Service Company Water Services Water Services 4 4 2008 Market Positions Products and Services 2008 Net Sales • Flow assurance • Oil/water separation • Heavy crude desalting • Monomer inhibitors • Anti-oxidants • Fuel and lubricant additives • Boiler, cooling water, raw water and wastewater applications • Combustion efficiency and air emission control $4.8 billion global market #1 Market Position 32% Market Share Paper Services Paper Services 4 4 • Digester Additives • Defoamers & Wash Aids • De-Inking Chemicals • Felt Cleaners • Coating Additives • Boiler, cooling water, raw water and wastewater applications • Combustion efficiency and air emission control $8.5 billion global market #3 Market Position 9% Market Share Energy Services Energy Services Limited economic sensitivity (1) Approximate market size based on internal estimates and industry publications and surveys. (2) Represents the water treatment and services markets, which accounted for approximately 72% of our Water
Services segment’s net sales in 2008. (3) Market share calculations include end-market
allocations from an all-inclusive Emerging Market business unit within Water Services. Some chemical business and associated market size transferred from Water Services to Energy Services in 2008. (4) Managed internally as Water and Process Services Division. Separate segment reporting being
maintained. (1)(2) (2) (2) (3) |
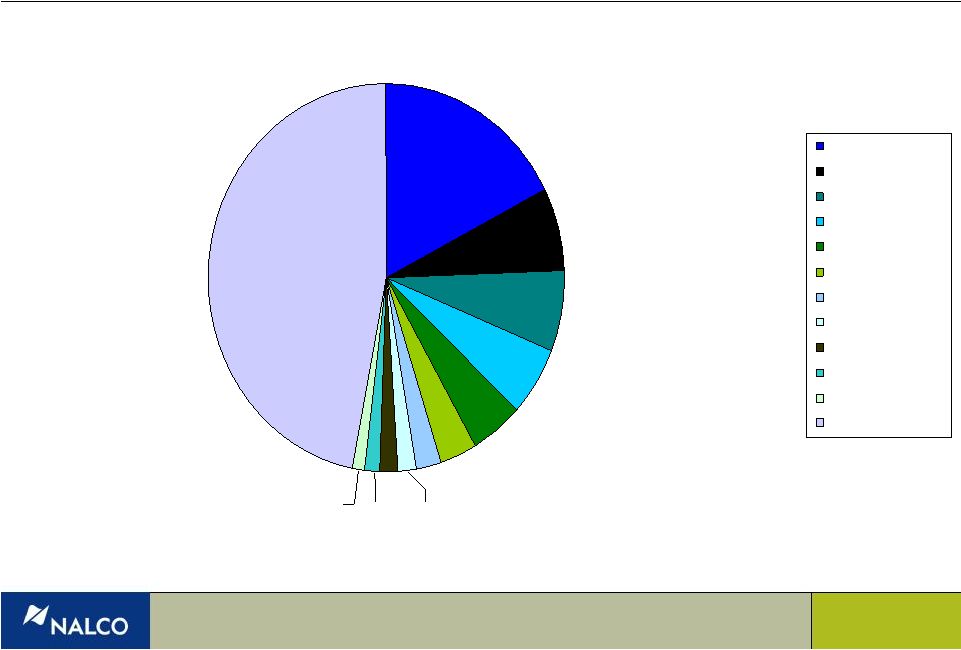 5 More than Twice the Size of Nearest Competitor Nalco has a sizable scale advantage across the $21 billion water and water-related services and chemicals market space* * Note: Uses 2008 sales and market size data in share chart. Excludes equipment,
municipal, air pollution control and process chemical and service sales in the Water Services segment, which collectively were more than $540 million in sales for Nalco in 2008. Reflects management estimates of 2008 sales in relevant competing markets, based on published data and
management estimates. 17.6% 6.9% 6.7% 5.8% 4.7% 3.4% 2.1% 1.5% 47.0% 1.9% 1.3% 1.2% Nalco Baker Petrolite Ashland/Hercules BASF/CIBA GE Water Kemira Kurita Champion Buckman EKA Danaher (Chemtreat) Other |
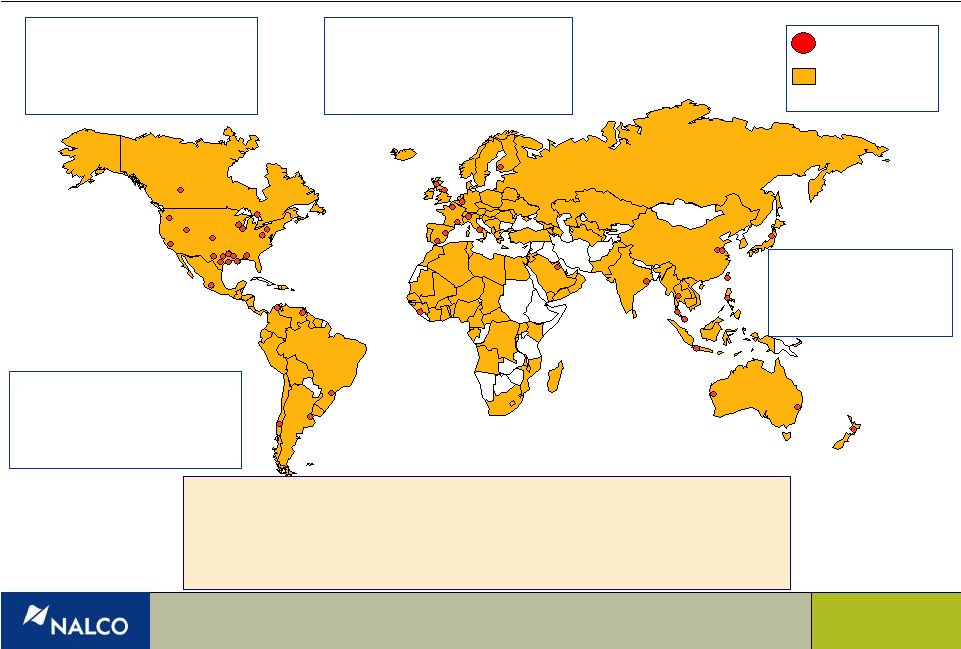 6 Unmatched, Diverse Global Presence Latin America 2008 Sales $411mm Employees 1,680 Plants 6 North America 2008 Sales
$2,028mm Employees 4,790 Plants 18 Europe, Africa & Middle East 2008 Sales $1,154mm Employees 3,015 Plants 11 Asia/Pacific 2008 Sales $619mm Employees 2,285 Plants 13 Countries of Operation Plant 70,000+ Customers 7,000+ Sales and Service Professionals Largest Customer = <3% of sales Of Top 20 Customers, 19 with Nalco >10 years |
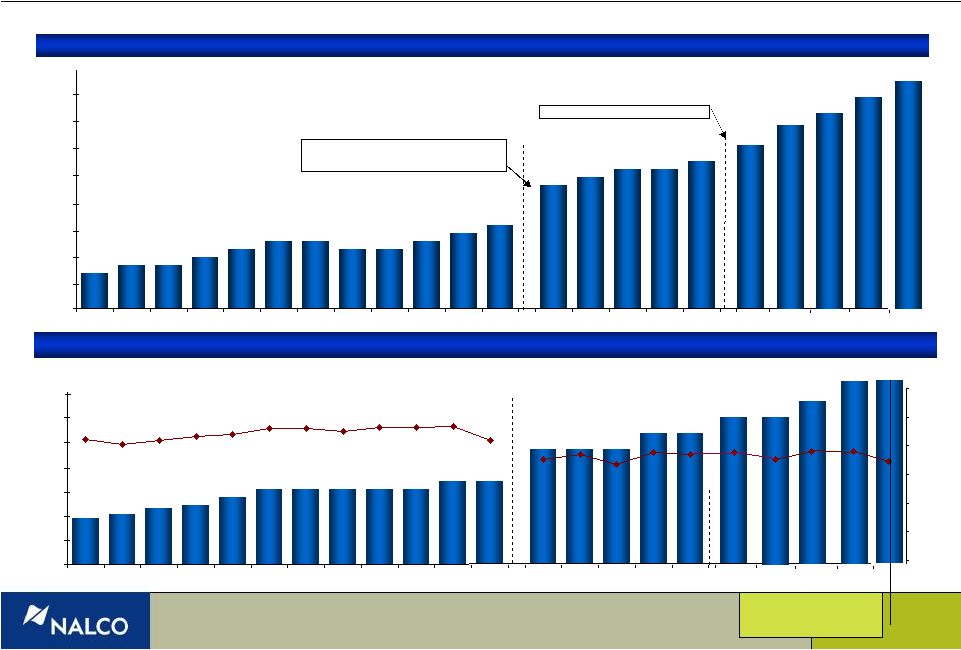 7 Growing Revenue and EBITDA Nalco is a consistently growing performer with a service-annuity model $2,430 $3,033 $1,574 $1,434 $1,304 $1,215 $1,247 $1,292 $1,287 $1,164 $1,013 $899 $843 $738 $2,367 $2,767 $2,644 $2,620 $0 $500 $1,000 $1,500 $2,000 $2,500 $3,000 1987 1988 1989 1990 1991 1992 1993 1994 1995 1996 1997 1998 1999 2000 2001 2002 2003 2004 $161 $176 $195 $227 $264 $306 $306 $289 $290 $312 $346 $342 $433 $466 $458 $517 $528 $585 19.1% 19.6% 17.5% 19.2% 18.3% 21.8% 20.9% 21.7% 22.4% 22.6% 23.8% 23.7% 23.2% 23.9% 23.9% 24.1% 21.7% $0 $100 $200 $300 $400 $500 $600 1987 1988 1989 1990 1991 1992 1993 1994 1995 1996 1997 1998 1999 2000 2001 2002 2003 0% 5% 10% 15% 20% 25% 30% Revenue Suez acquired Nalco and merged Nalco with Calgon and Aquazur in 1999 Adjusted EBITDA and EBITDA Margins Note: 1987- ‘98 based on Nalco Chemical Co. public filings. 1999 and 2000 based on
unaudited Suez reported results. 2003 data excludes $30 million in pro forma cost savings 2004 19.3% 2005 $3,312 $603 18.2% +11% +3% +9% +10% Private equity purchase of Nalco $3,603 +9% 2006 2005 2006 $680 18.9% +13% $3,912 +9% 2007 2007 $730 18.7% +7% $4,212 +8% 2008 2008 $732 17.4% Up 3.7% excl. synfuels $3,500 $4,000 $700 |
 8 Progressive De-Levering Traditional Metrics Understate Nalco’s Cash-Generating Capabilities. Recommend Investors Compare Cash PE, EV/(EBITDA-CapEx) and FCF Yield to Understand Nalco as a Cash-Generating Business. (1) Includes senior discount note debt issued January 2004. (2) Excludes $30mm pro forma future cost savings. (3) Calculated using period-end closing stock price, final quarter average diluted shares
outstanding and LTM Free Cash Flow. Not calculated in 2004 because Initial
Public Offering launched during middle of fourth quarter, distorting average shares outstanding. Extremely diversified customer base, annuity service model, and low capital intensity combine to produce strong, stable Free Cash Flow generation. $ in millions 12/31/03 12/31/04 12/31/05 12/31/06 12/31/07 12/31/08 9/30/09 Cash & Cash Equivalents $ 100 $ 33 $ 31 $ 37 $ 120 $ 62 $ 242 Total Debt 3,765 (1) 3,442 3,267 3,189 3,324 3,223 3,156 Net Debt 3,665 (1) 3,409 3,236 3,152 3,204 3,162 2,914 LTM Adjusted EBITDA $ 528 (2) $ 585 $ 603 $ 680 $ 730 $ 732 $ 708 Total Net Debt/LTM EBITDA 6.9x 5.8x 5.4x 4.6x 4.4x 4.3x 4.1x Free Cash Flow - LTM $ 139.9 $ 119.6 $ 183.5 $ 200.6 $ 142.0 $ 420.0 Period-end Free Cash Flow Yield (3) 4.6% 6.1% 5.8% 8.9% 14.8% |
 9 1. Improve Safety – Goal is top-quartile performance 2. Gain Step Change in Productivity – $84 million YTD achieved – on path to record over $100 million 3. Generate Focused, Profitable Growth – Sequential sales gains 5% nominally in each of Q2 and Q3 from recession driven 1 quarter low. – Progress starting to show in India, China and Middle East – New sales of 3D TRASAR ® Cooling Water units keeping pace with 2008 results, despite weaker economic conditions. – OxiPro ® Deposit Control Technology in Paper – two-thirds of sales coming from competitively held accounts 4. Improve Cash Flows – YTD Record $374 million, with $182 million from working capital 5. Strengthen Future Growth, e.g. – New Deepwater and Ultra deepwater technology – Leadership gains in China and Russia – Added 140 people YTD in China/India – Crossbow – water pre-treatment services acquisition Five Priorities for 2009: Results to Date st |
 •
Pro Forma EBITDA of $190M up 4% nominally versus Prior Year Margin of 19.9% versus PY 16.4% • Sales up 5% sequentially, though down 14% versus PY (10% organic) Sequential Y-O-Y Nominal Organic North America -- (13%) Latin America 15% (3) Europe Africa Middle East 8 (12) Asia 9 (2) • Record Nine Months Free Cash Flow, led by working capital improvements Q3 of $134M brings 9-mos result to $374M, vs PY $97M • Productivity Program helped improve Margins Nine months achievement of $84M toward $100M annual goal Nalco Reported a Very Solid Third Quarter 10 |
 Third Quarter
Highlights Q3 2009 2008 Nominal Change Q2 2009 Nominal Change Sales $957 $1,116 (14%) $913 5% GPM 47.3% 42.5% 480 bps 45.0% 230 bps EBITDA $167 $211 $82 Pro Forma EBITDA * 190 183 4% 142 34% Margin 19.9% 16.4% 15.6% EPS $0.20 $0.41 $(0.21) Pro Forma EPS * 0.31 0.36 (14%) 0.13 138% Free Cash Flow $134 $28 379% $94 43% 11 * Pro Forma results adjust for a 2008 divestiture gain, a 2009 pension
settlement charge,
and restructuring actions in both periods |
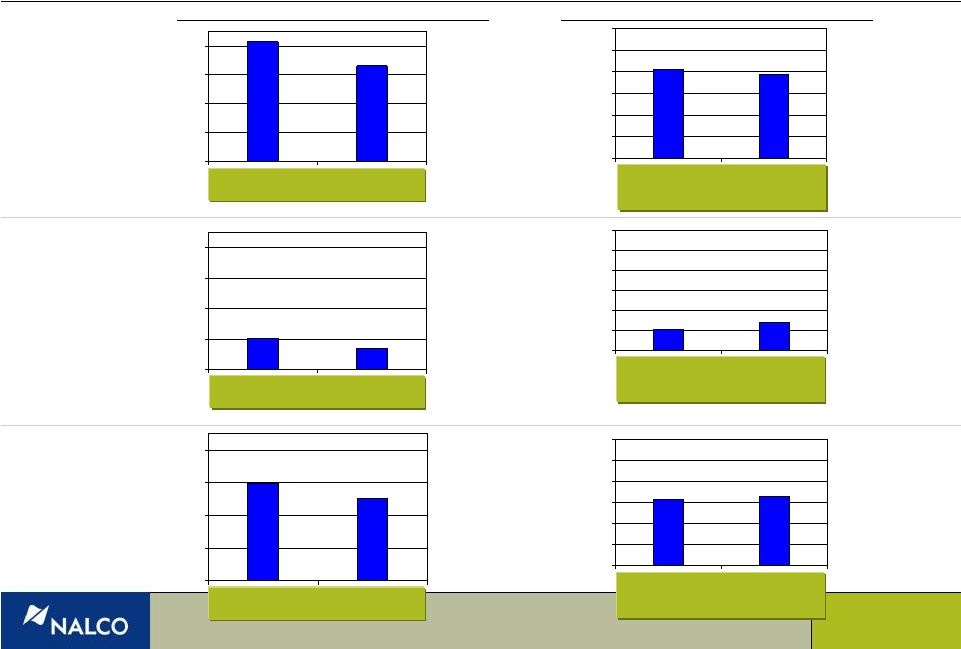 Q3 Segment
Results 433 515 100 200 300 400 500 Water Services Paper Services Sales Segment Direct Contribution Q3 2008 Q3 2009 Organic Change (10%) 171 203 100 200 300 400 500 97 103 0 25 50 75 100 125 150 Energy Services 12 Q3 2008 Q3 2009 Organic Change +2% Margin: 20.0% 22.4% Q3 2008 Q3 2009 Organic Change (13%) Q3 2008 Q3 2009 Organic Change (8%) Q3 2008 Q3 2009 Organic Change +35% Margin: 13.0% 20.2% 35 27 0 25 50 75 100 125 150 82 78 0 25 50 75 100 125 150 353 397 100 200 300 400 500 Q3 2008 Q3 2009 Organic Change +9% Margin: 19.6% 23.2% |
 Record Nine
Month Free Cash Flow 2009 2008 2009 2008 Cash Earnings $101 $100 $242 $294 Trade Accounts Receivable (10) (37) 98 (20) Inventories 1 (35) 91 (113) Accounts Payable 30 7 (7) 32 Accrueds/Prepaids 42 31 21 4 Total Working Capital 63 (34) 203 (97) Cash From the Operating Cycle 164 66 445 197 Net Capex (30) (38) (71) (100) Free Cash Flow $134 $28 $374 $97 Q3
YTD 13 |
 14 • Sustain Base Real Growth 3-4% • Strengthen Key Geographies – BRIC+ 2%+ – EAME .5%+ • New Technology Platforms/Business models: (Water, Energy, Air) – Water - Automation Build-Out .5%+ – Energy - Enhanced Oil Recovery .3%+ – Air - Nalco Mobotec .5%+ – M&A .5%+ As Economic Growth Returns, Strategy Will Help Drive Market Share Total Added Growth Potential 4%+ * Real growth is defined as organic growth less the impact of sizable cost-driven price swings. Organic growth excludes FX and M&A impacts. Assumes economic stabilization. Expected Real Growth by 2011* 6-8% 2009 YTD Progress +140 in India/China Sequential Gains 1,900 new unit sales 34% growth Awaiting Rules Crossbow |
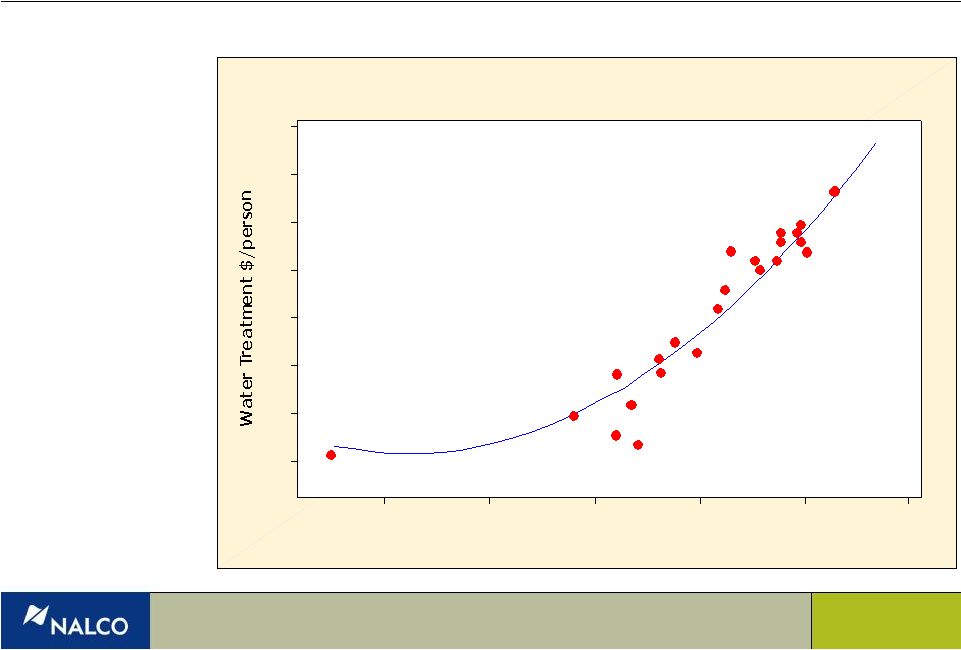 15 MVA $/ person 3500 3000 2500 2000 1500 1000 35 30 25 20 15 10 5 0 United States Japan South Korea Czech Republic Brazil India Germany Sweden Austria Taiwan Hungary Argentina China Mexico Russia Australia United Kingdom France Italy Belgium Indonesia Why hire in China and India? In developing countries, water treatment spend grows faster than GDP Modernization drives per- person water treatment increase. Add to high industrial growth rates for Nalco opportunity Sources: Freedonia “World Water Treatment Products”, March 2006. Data correlation corrected for scaling differences from logarithmic chart presented by Freedonia Netherlands MVA is Manufacturing Value Added Spain Scatterplot of Water Treatment $/person vs MVA $/person |
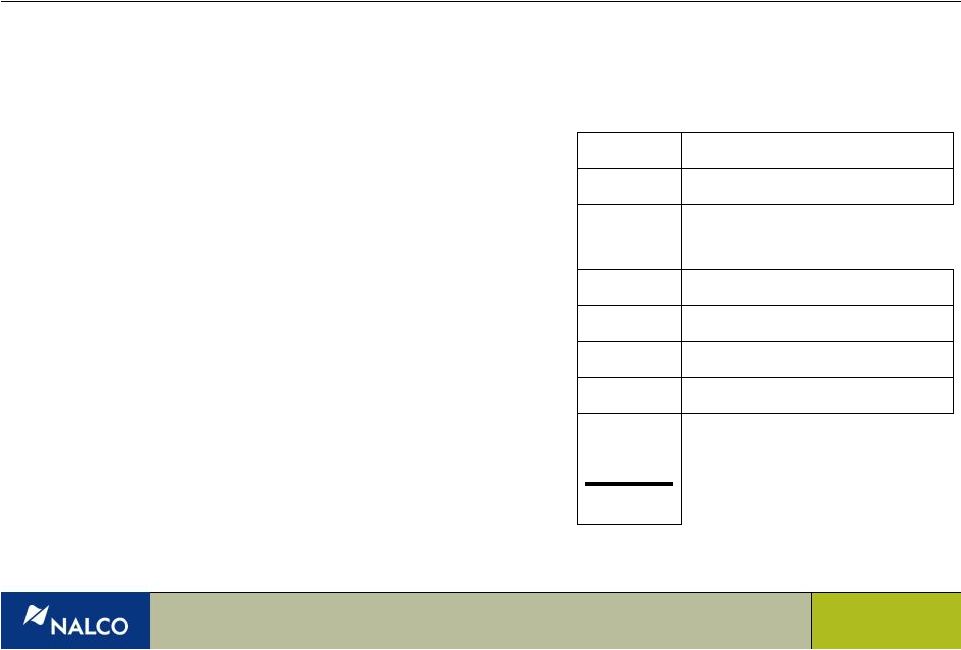
 16 Quality Scarcity (recycling & reuse) Energy efficiency (heat transfer) Wastewater requirements and enforcement Reservoir efficiency (EOR) Hard-to-reach oil (deep/ultra deep) Opportunity crudes Produced water purification New energy Sulfur and nitrogen oxides, mercury, particulates Combustion efficiency Greenhouse gases Indoor Air Quality What Drives Our Outlook to the Future? Key Factors Driving Growth Resource Issue Opportunity for Nalco Essential Expertise for Water, Energy and Air SM |
 Existing Capital
Structure Debt Maturity Profile Notes: (1) LTM September 2009 Adjusted EBITDA: $666.6m (2) Market prices as of 11/13/09 17 $0 $100 $200 $300 $400 $500 $600 $700 $800 2010 2011 2012 2013 2014 2015 2016 2017 New TL B 7.75% US Sr Notes 7.75% Euro Sr Notes 8.25% Sr Notes 8.875% Sr Notes 9.0% Eur Sr Sub Notes OLD TL B AR Facility 9.0% Holdco Sr Disc Notes RCF Trading ($mm) As of September 30, 2009 Amount Maturity Margin Floor Leverage (1) Level (2) YTW (2) STW (2) Rating Next Call Cash 242.0 Debt AR Facility ($160m) -- Jun-10 -- -- -- -- -- -- RCF ($250m) -- 13-May-14 L+350 3.00% -- -- -- -- Ba1/BB+ Old TLB 167.0 4-Nov-10 L+175 0.3x 100.00 2.03% L+175 Ba1/BB+ New TLB 746.2 13-May-16 L+350 3.00% 1.1x 101.00 6.19% L+591 Ba1/BB+ Other Debt 51.8 0.1x Total Senior Secured Debt 965.0 1.4x 7.750% USD Senior Notes 190.0 15-Nov-11 7.750% 0.3x 100.25 7.48% T+743 Ba2/BB- Callable at Par 7.750% Euro Senior Notes (€200m) 292.0 15-Nov-11 7.750% 0.4x 100.00 7.75% B+659 Ba2/BB- Callable at Par 8.250% Senior Notes 489.8 15-May-17 8.250% 0.7x 104.75 7.19% T+476 Ba2/BB- 05/15/13 @ 104.13 8.875% Senior Sub Notes 465.0 15-Nov-13 8.875% 0.7x 103.31 6.83% T+677 B2/B 11/15/10 @ 101.48 9.000% Euro Senior Sub Notes (€200m) 292.0 15-Nov-13 9.000% 0.4x 103.10 6.89% B+638 B2/B 11/15/10 @ 101.50 9.000% Holdco Senior Discount Notes 462.0 1-Feb-14 9.000% 0.7x 102.00 8.00% T+563 B2/B 02/01/10 @ 103.00 Total Debt 3,155.8 4.7x Market Cap. as of 11/13/09 @ $23.79 3,286.9 Noncontrolling Interest 20.1 Total Enterprise Value 6,220.8 9.3x Corporate Rating: Ba3 / BB- |
 Recent
Amendments to the 2003 and 2009 Credit Agreements Provide: • Ability to apply balance sheet cash against USD 190 million 7.75% Senior Notes due November 2011 • Ability to raise USD 300 million New Term Loans to call the Euro 200 million 7.75% Senior Notes due November 2011 – Accordion size and Secured Leverage Ratio increased to accommodate this financing • Enhanced ability to add Unsecured Debt – subject to ratio tests but now without separate caps • Miscellaneous basket size and Alternative Currency adjustments 18 |
 Essential Expertise for Water, Energy and Air SM |