Attached files

David
Blackford
CEO & President
California Bank & Trust
CEO & President
California Bank & Trust
December
1, 2009
Portfolio
and Performance Update
Page
*
CB&T
Overview
® $11 billion in
assets
® 116
branches
throughout California
throughout California
® $9.2 billion in
loans
® $9.4 billion
in
deposits
deposits
® Accomplished
management team
in place for last 10
years
management team
in place for last 10
years

Page
*
Bank
Performance
® Loans:
Ø Modest growth since
2004 (less than 3% organic CAGR)
® Deposits:
Ø 32% DDA, 80% core
deposits1
Ø Stable, low cost
deposit base to relationship customers
® Profitability:
Ø YTD NIM of 4.76%
-among the highest in the country (92nd
percentile)(2)
percentile)(2)
Ø Flat expenses since
2004 provide strong operating efficiency (88th
percentile) (2)
percentile) (2)
® Strategic
Growth:
Ø Low risk expansion
thru 2 FDIC assisted acquisitions in 2009
(1) Excludes all CDs and
Foreign Deposits
(2) Source:
SNL Financial
Sept 09
YTD. Compared
to coml.. banks with assets
>$2.0B. Adj. for FDIC Insurance Assessment and Alliance and Vineyard acq.
>$2.0B. Adj. for FDIC Insurance Assessment and Alliance and Vineyard acq.

Page
*
Credit
Metrics
|
|
2008
|
Sept.
2009 YTD |
|
|
Non-accrual
Loans / Loans
|
1.72
|
2.75
|
|
|
Net
Charge-offs / Avg Loans
|
0.78
|
1.79
|
Provision
156 bp
higher than NCO: Result = $95MM reserve build 2009 |
|
Loan Loss
Provision / Avg Loans
|
1.05
|
3.35
|
|
|
ACL /
NPLs
|
98.6
|
107.0
|
Over
100% coverage
|
|
ACL /
Loans
|
1.69
|
2.94
|
|
® Strong core
operating earnings have enabled us to build reserves and
expediently dispose of real estate assets in weaker markets
expediently dispose of real estate assets in weaker markets
® Credit deterioration
has been manageable
Data
excludes FDIC Supported Assets
Sept
YTD charge-offs and provision annualized for ratios

Page
*
California
Housing Overview
® Improving demand for
finished lots in all Western
markets
markets
Ø Lot prices
increasing as inventory contracts
® Very
recent signs of SFR
stabilization appearing
Ø October 2009 year
over year SFR price increase for
Orange County, San Diego, and the Bay Area, with LA
decline in single digits.
Orange County, San Diego, and the Bay Area, with LA
decline in single digits.
Ø Affordability much
improved following 30-40% price
declines from peak
declines from peak
® Entitled land demand
remains soft, although prices
expected to firm as finished lot inventory reduces
expected to firm as finished lot inventory reduces

Page
*
California
Commercial Overview
® Valuation declines
driven by:
Ø Rising Cap
rates
Ø Increase in vacancy
rates across all product types
Ø Rental rate declines
and larger concessions
® Current prices off
40% from 2007 peak (Moody’s
REAL Cml.
PPI Index)
PPI Index)
® No safe haven - all
product types affected
® Huge wave of CMBS
and bank loans maturing that
will not qualify for refinance
will not qualify for refinance
® CBT proactively
identifying at-risk projects to
resolve
resolve

Page
*
® Lending practices
have constrained problem loan
migration and limited loss exposure
migration and limited loss exposure
® Careful
Loan Origination
Ø Strong initial
underwriting
Ø LTV
maintenance
Ø Remargin
requirements
Ø Market and loan
diversification
Ø Borrower financial
capacity to support project
® Rigorous
Loan Management
Ø Early problem
recognition
Ø Reappraise and
remargin - first mover advantage
Ø Concentrated efforts
to reduce exposure
Ø Solution
oriented
Ø Intense executive
management involvement and support
CBT’s
Lending Philosophy
Page
*
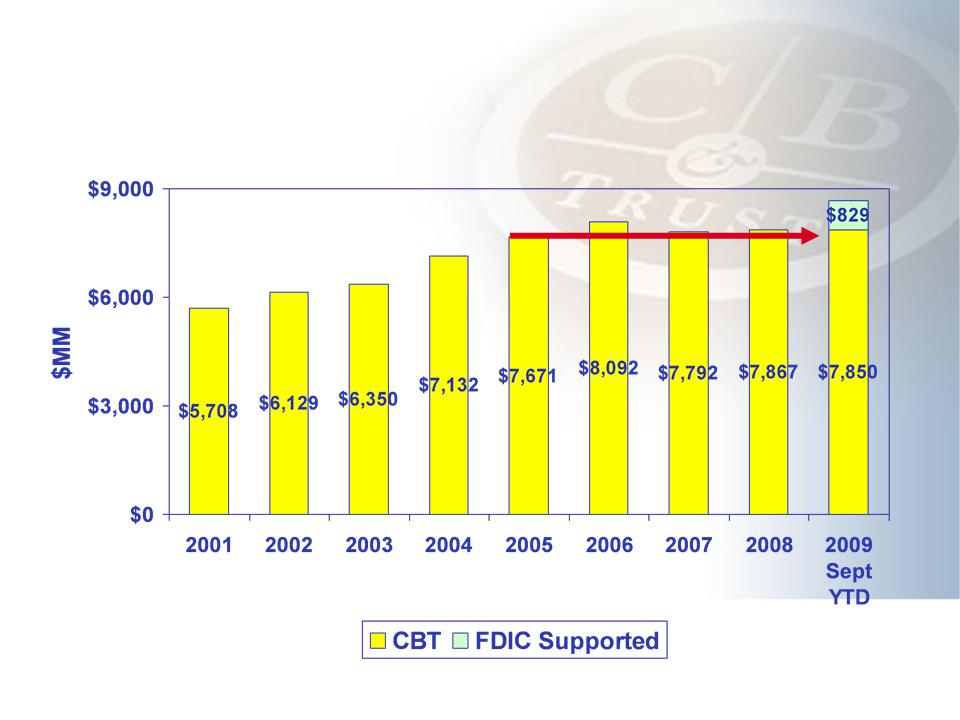
Loan
Growth
Average loans ($MM)
Average loans ($MM)

Page
*

Page
*
CBT
Loan Portfolio
Outstandings of 9/30/09
Outstandings of 9/30/09
1st TD
Mortgages

Page
*
CBT
Loan Portfolio
Outstandings of 9/30/09
Outstandings of 9/30/09
Owner
Occupied Real
Estate
Estate
Ø Well secured smaller
loans
Ø Diversification by
product
and geography
and geography
Ø Largely plain
vanilla RE
SBA
504
Ø Problems arising
from
business failures
business failures
Ø 504 NPLs to total at
9/30 =
6.2%.
6.2%.
Ø Loss content
mitigated by
60% LTV/LTC at origination
60% LTV/LTC at origination
Ø CO = .32% total
2008, 1.1%
2009 Sept YTD annualized
2009 Sept YTD annualized
Page
*
CBT
Loan Portfolio
Outstandings of 9/30/09
Outstandings of 9/30/09
Commercial
Real Estate
Ø Specialized RE
lending group
for construction and larger
term
for construction and larger
term
Ø Branch and Cml.
network
originations small investor
miniperms with strong
guarantees
originations small investor
miniperms with strong
guarantees
Ø Portfolio within
targets for
market and product
diversification
market and product
diversification
Ø Substantial
reductions in at-
risk product types
risk product types
Ø Construction
outstandings down
$575MM (35%) from 12/31/07
$575MM (35%) from 12/31/07
Page
*
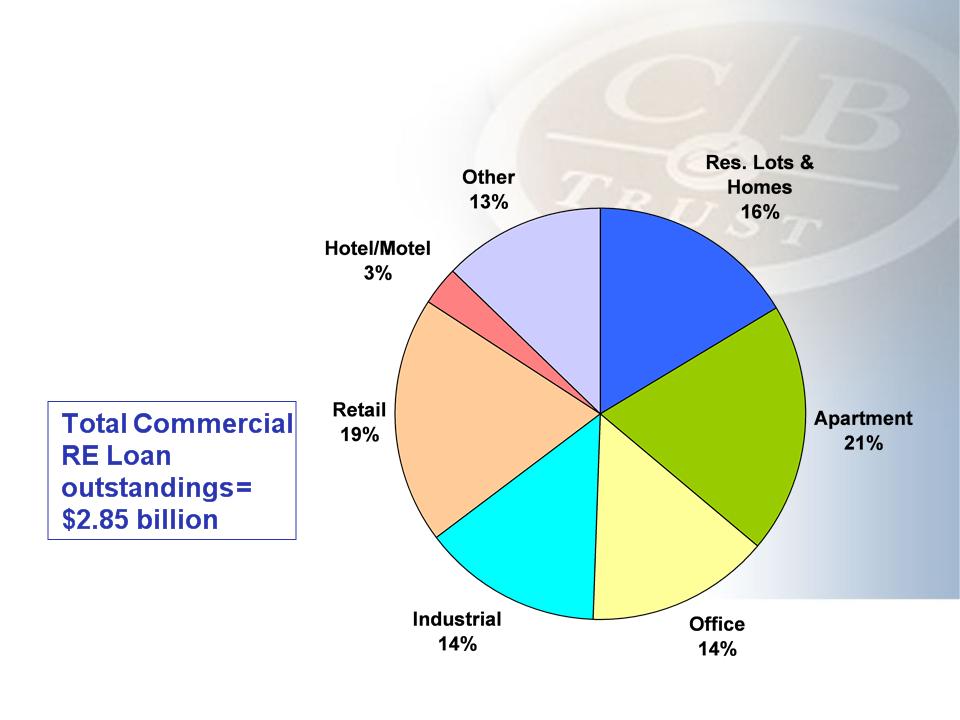
CBT
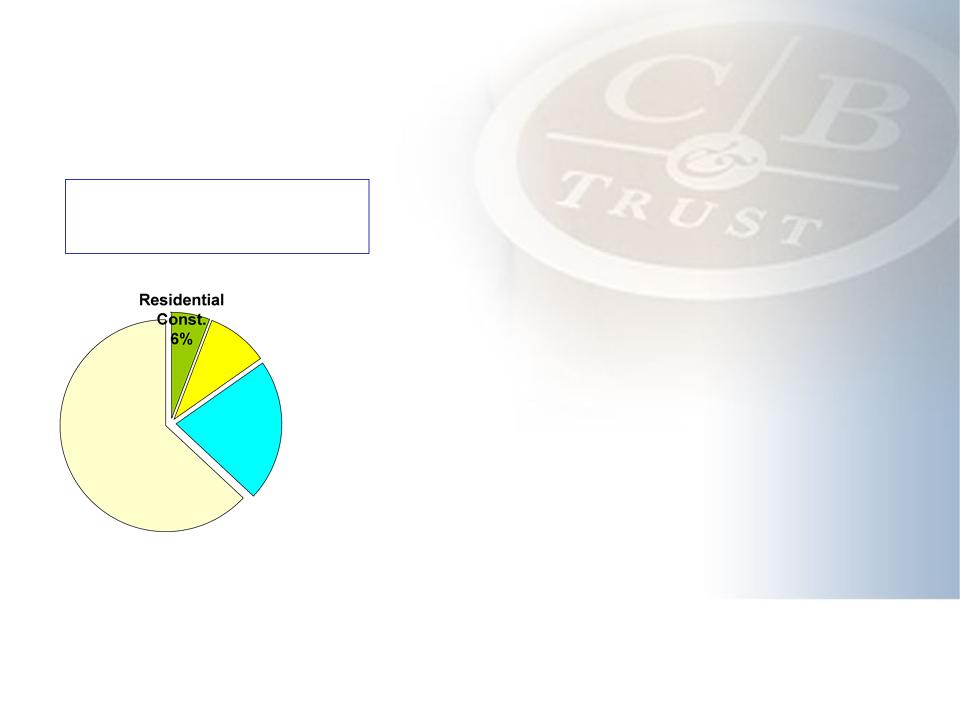
Commercial RE Loan Portfolio
Product Outstandings as of 9/30/09
Product Outstandings as of 9/30/09
* Excludes
FDIC supported assets
Well
Diversified Product Mix

Page
*
CBT
Commercial RE Loan Portfolio
CRE as a % of Total Loans
CRE as a % of Total Loans
Page
*
CBT
Residential Lot and Home Builder Portfolio
Outstandings as of 9/30/09
Outstandings as of 9/30/09
Residential
Builder
portfolio = $467M OS
portfolio = $467M OS
Ø Current market
conditions
showing improvement
showing improvement
Ø Growing demand for
finished
developed lots
developed lots
Ø Multiple offers from
major
homebuilders on lot sales
homebuilders on lot sales
Ø Significant success
in managing
through residential downturn
through residential downturn
Ø Remaining portfolio
manageable
with selected new originations
for developments with solid
market conditions and low LTC
with selected new originations
for developments with solid
market conditions and low LTC

Page
*
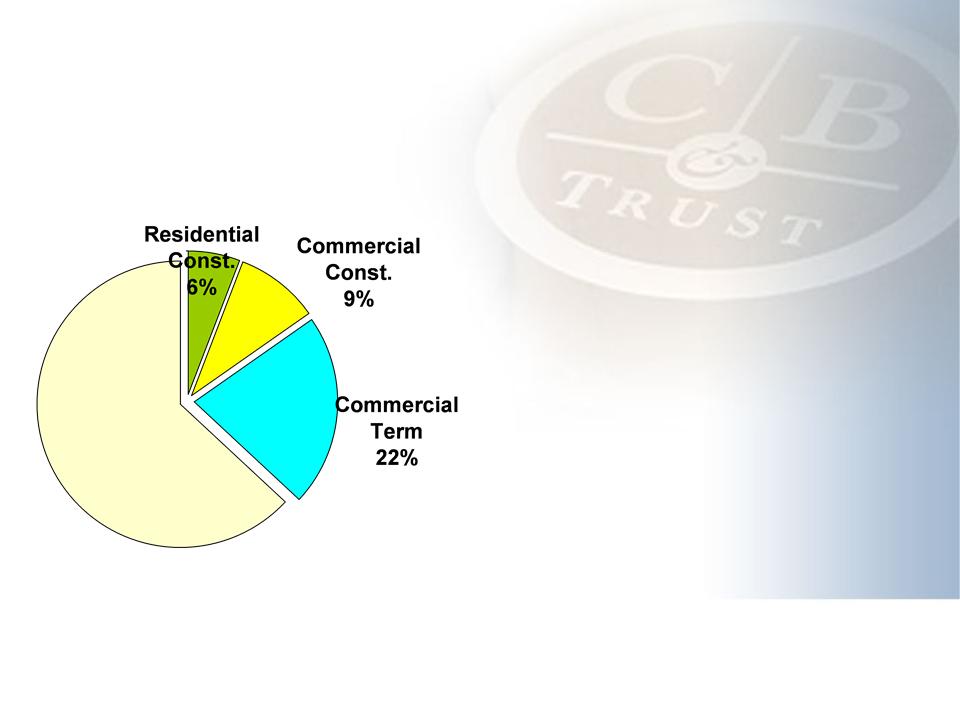
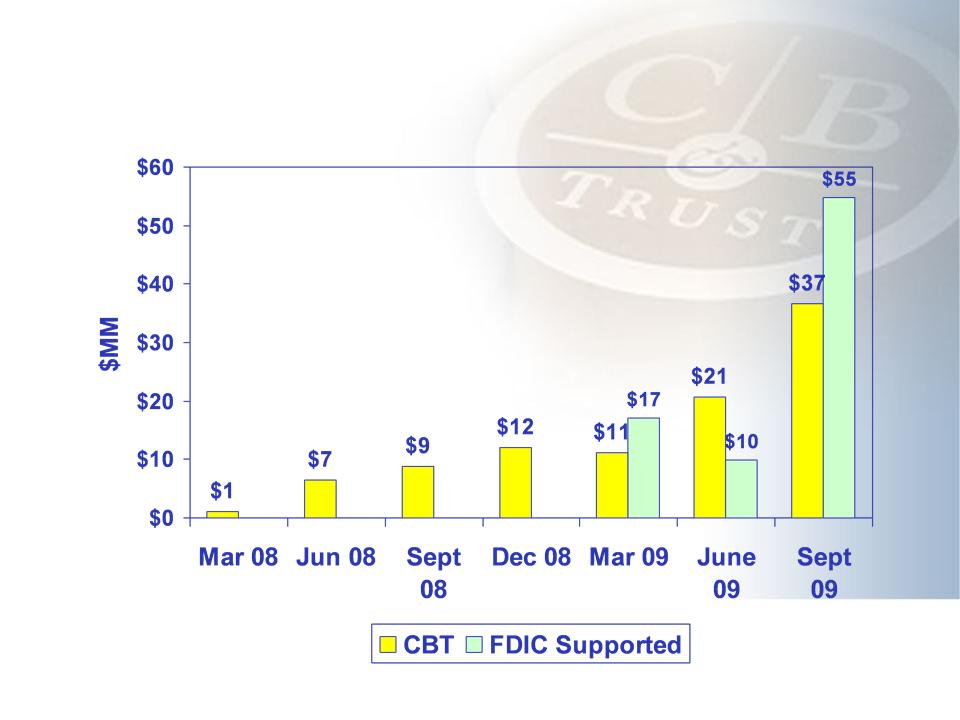
Residential
Construction Commitment Declines
$2.1
billion
ê

Page
*
Commercial
Construction and Term Real Estate
® CBT’s
commercial
strategy has mitigated
impact
strategy has mitigated
impact
Ø Utilize refinancing
interest
rates for initial underwriting
rates for initial underwriting
Ø 55-70% LTV at
origination -
Sponsorship with solid equity
and remargin requirements
Sponsorship with solid equity
and remargin requirements
® Originations spread
over 10
year period
year period
® Reappraisal stress
primarily
limited to 2006-2007 vintages
limited to 2006-2007 vintages

Page
*
Capitalization
Rate Trends
Source:
CB Richard Ellis, Inc., Market View

Page
*
Commercial
Term Originations
Asset
value declines = opportunity for better
structure and pricing = increase in CBT loan
originations 2nd half 2008
structure and pricing = increase in CBT loan
originations 2nd half 2008

Page
*
Commercial
Construction Real Estate
® Completed
cash-flowing projects represent bulk of
commercial construction exposure (which is less than
10% CBT loan total)
commercial construction exposure (which is less than
10% CBT loan total)
Ø Interest reserve use
limited to construction period
Ø Cash flow sweeps or
out-of-pocket payments cover interest for
completed projects
completed projects
Ø No increases to loan
amount to repack interest reserves
Ø Over 90% of watch
credits reappraised during 2009
Ø Commercial
construction disposition strategy mirrors
successful residential efforts
successful residential efforts
Ø Identify at-risk
projects
Ø Reappraise,
restructure and remargin
Ø Dispose at
market-clearing prices
Page
*
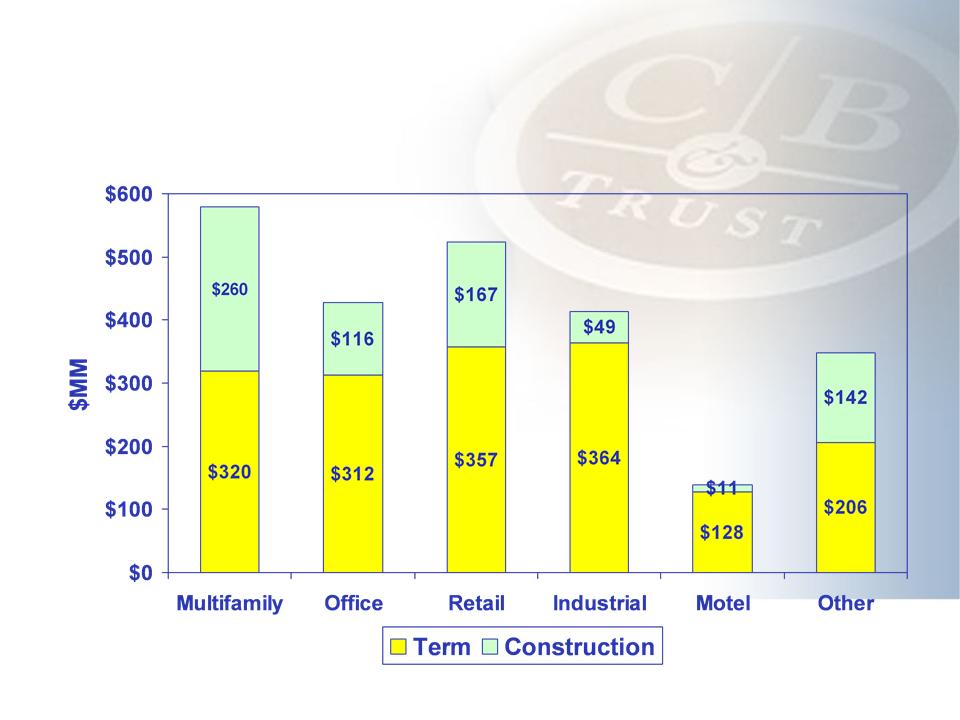
Product
Summary - Commercial RE
Outstandings
as of 9/30/09
David
note:
Construction
“Other”
comprised of
Cml. land =
$103MM
Construction
“Other”
comprised of
Cml. land =
$103MM
Page
*
OREO
CBT
OREO exposure low due to
ability and willingness to react at
market clearing prices via note
sales prior to foreclosure or rapidly
following transfer to OREO
ability and willingness to react at
market clearing prices via note
sales prior to foreclosure or rapidly
following transfer to OREO
3Q
09 exposure
reduced by $8MM 11/09
reduced by $8MM 11/09

Page
*
FDIC
Failed Bank Acquisitions
® February
2009 - Alliance Bank headquartered in Culver
City, CA
City, CA
Ø $925MM loans, five
branches
Ø Successful
integration onto CBT platform
Ø Removed brokered and
money desk CDs
Ø $264MM or 28%
resolved in first seven months
® July
2009 - Vineyard Bank HQ in Corona, CA
Ø $1.3 billion loans,
16 branches
Ø $146MM bargain
purchase price
Ø Strengthens CBT’s
franchise in eastern LA and the stronger
western portion of Inland Empire (CBT to keep 13 branches)
western portion of Inland Empire (CBT to keep 13 branches)
Ø CBT investing in
branch network
Ø Platform for
business and commercial banking expansion

Page
*
Conclusion
® Core
franchise operating very profitability
® One
of the highest NIMs for a bank our size,
coupled with a low efficiency ratio, results in high pre-
tax, pre-provision operating income to absorb credit
costs
coupled with a low efficiency ratio, results in high pre-
tax, pre-provision operating income to absorb credit
costs
Ø Significant reserve
build 2009 ($94MMM Sept
YTD)
® CBT
business strategy effectively implemented
Ø Moderate 10 year
growth (CAGR
5.0%)
Ø Disciplined
underwriting and loan management
Ø Reality based
approach to problem loan identification
and resolution
and resolution

Page
*
2010
Look forward
® 2010 expected to be
transitional year
® However, scrubbed
real estate portfolio and
commercial loan growth sets stage for
improvement late 2010 and into 2011
commercial loan growth sets stage for
improvement late 2010 and into 2011
® Counter-cyclical
lending opportunities provide
excellent structure and improved pricing
excellent structure and improved pricing
® CBT projected to
emerge early and strong
from current downturn
from current downturn