Attached files
 Q4 FY
2009 EARNINGS Prepared Comments and Q&A Discussion Materials SLIDES ONLY EXHIBIT 99.2 BROCADE |
 Q4
FY 2009 Earnings, November 23, 2009 © 2009 Brocade Communications Systems, Inc.—Company Proprietary Information
2 PREPARED COMMENTS MIKE KLAYKO CEO Released November 23rd 4:00PM Pacific Time RICHARD DERANLEAU CFO |
| Q4 FY
2009 Earnings, November 23, 2009 © 2009 Brocade Communications Systems, Inc.—Company Proprietary Information
3 CAUTIONARY STATEMENTS AND DISCLOSURES This presentation includes forward-looking statements, including statements regarding Brocade’s business outlook and financial projections for fiscal year 2010 and
beyond. These forward-looking statements are only predictions and involve
risks and uncertainties such that actual results may vary significantly. These and other risks are set forth in more detail in our Form 10-K for the fiscal year ended October 25, 2008 and Form 10-Q
for the quarter ended August 1, 2009. These forward-looking statements
reflect beliefs, assumptions, estimates and predictions as of today, and
Brocade expressly assumes no obligation to update any such
forward-looking statements. In addition, this presentation includes
various third party estimates regarding the total available market and other
measures, which do not necessarily reflect the view of the Company. Further,
Brocade does not guarantee the accuracy or reliability of any such information or forecast. This presentation includes non-GAAP financial measures. The most directly comparable
GAAP information and a reconciliation between the non-GAAP and GAAP
figures are provided in our Q4 09 press release, which has been furnished to the SEC on Form 8-K, and in this slide presentation. |
 MIKE
KLAYKO CEO Q4 AND FISCAL 2009 Q4 FY 2009 Earnings, November 23, 2009 4 © 2009 Brocade Communications Systems, Inc.—Company Proprietary Information
|
 Q4
FY 2009 Earnings, November 23, 2009 © 2009 Brocade Communications Systems, Inc.—Company Proprietary Information
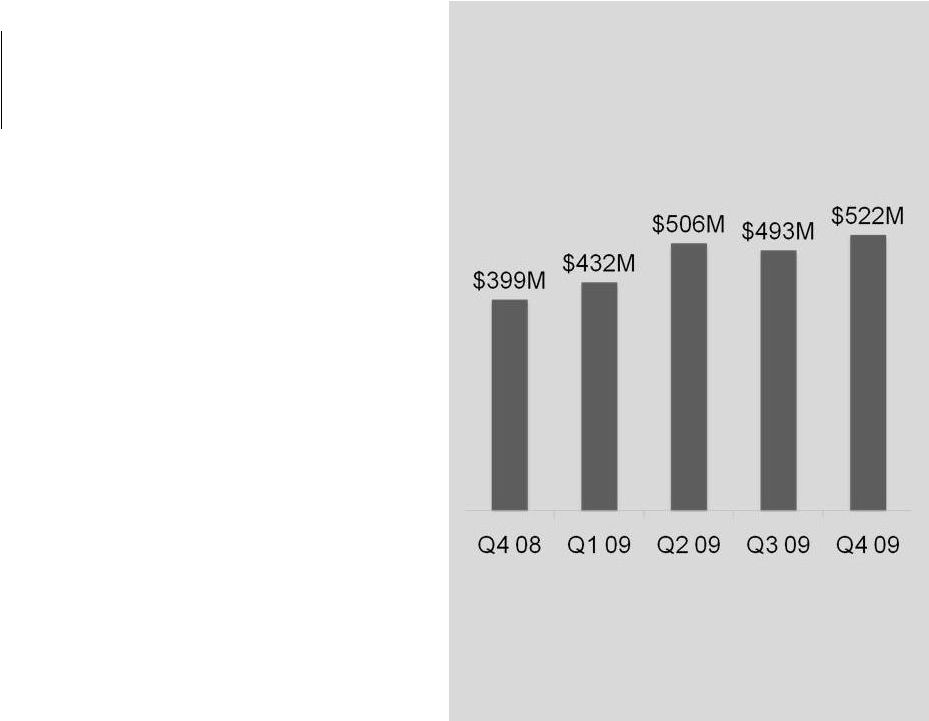
5 QUARTERLY RESULTS * Q4 is third full quarter of combined operations post-Foundry acquisition.
5.8% SEQ. GROWTH REVENUE |
 Q4
FY 2009 Earnings, November 23, 2009 © 2009 Brocade Communications Systems, Inc.—Company Proprietary Information
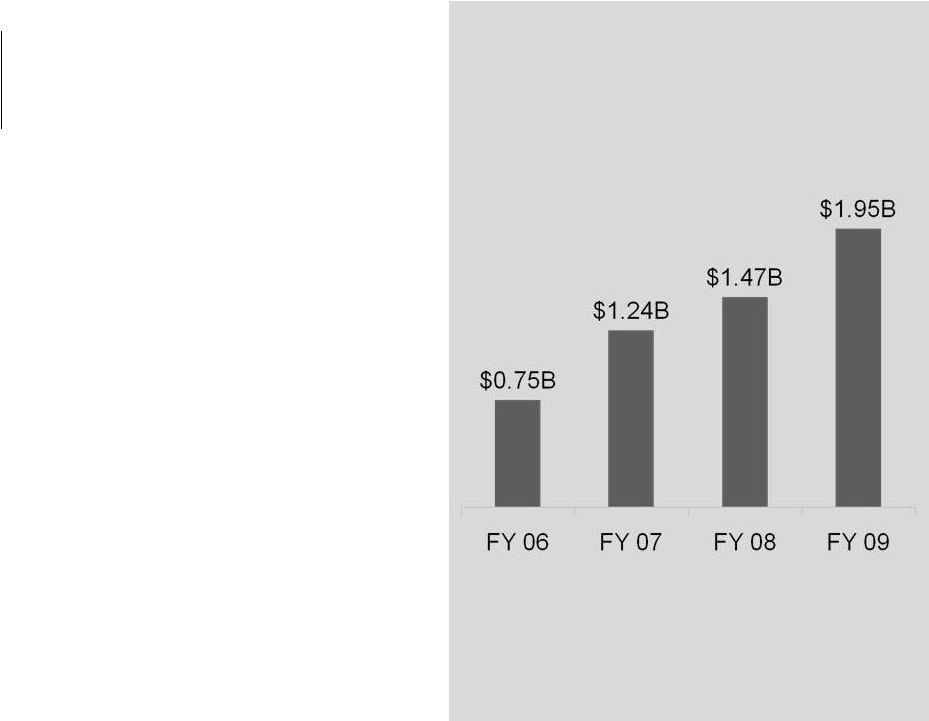
6 ANNUAL RESULTS 33% GROWTH REVENUE |
 FY
2009: A GAME CHANGING YEAR Transformation Innovation Execution Q4 FY 2009 Earnings, November 23, 2009 7 © 2009 Brocade Communications Systems, Inc.—Company Proprietary Information
|
 WHO IS BROCADE? Q4 FY 2009 Earnings, November 23, 2009 8 © 2009 Brocade Communications Systems, Inc.—Company Proprietary Information
|
 A
NETWORKING COMPANY Q4 FY 2009 Earnings, November 23, 2009 9 © 2009 Brocade Communications Systems, Inc.—Company Proprietary Information
|
 ENTER NEW MARKETS ETHERNET Q4 FY 2009 Earnings, November 23, 2009 10 © 2009 Brocade Communications Systems, Inc.—Company Proprietary Information
|
 OPERATE AS ONE COMPANY Q4 FY 2009 Earnings, November 23, 2009 11 © 2009 Brocade Communications Systems, Inc.—Company Proprietary Information
INTEGRATE ACQUIRE FOUNDRY Sales R&D Roadmaps Supply Chains |
 INTERNET USERS
2.25 BILLION EVERY YEAR DATA DOUBLES DEVICES BY 2015 15 BILLION Q4 FY 2009 Earnings, November 23, 2009 © 2009 Brocade Communications Systems, Inc.—Company Proprietary Information 12 ROBUST NETWORKING GROWTH DRIVERS |
 NETWORK UPGRADE COMING Q4 FY 2009 Earnings, November 23, 2009 © 2009 Brocade Communications Systems, Inc.—Company Proprietary Information
13 MULTI-TIERED ARCHITECTURES Don’t Scale Prone to Failure Obsolete NEW PERFORMANCE REQUIREMENTS 65% of CIOs Plan Major Rebuilds |
 $3.3T ANNUAL IT SPEND Q4 FY 2009 Earnings, November 23, 2009 © 2009 Brocade Communications Systems, Inc.—Company Proprietary Information
14 Source: Gartner |
 Q4 FY 2009
Earnings, November 23, 2009 15 © 2009 Brocade Communications Systems, Inc.—Company Proprietary Information INFLECTION POINT |
 Q4
FY 2009 Earnings, November 23, 2009 © 2009 Brocade Communications Systems, Inc.—Company Proprietary Information
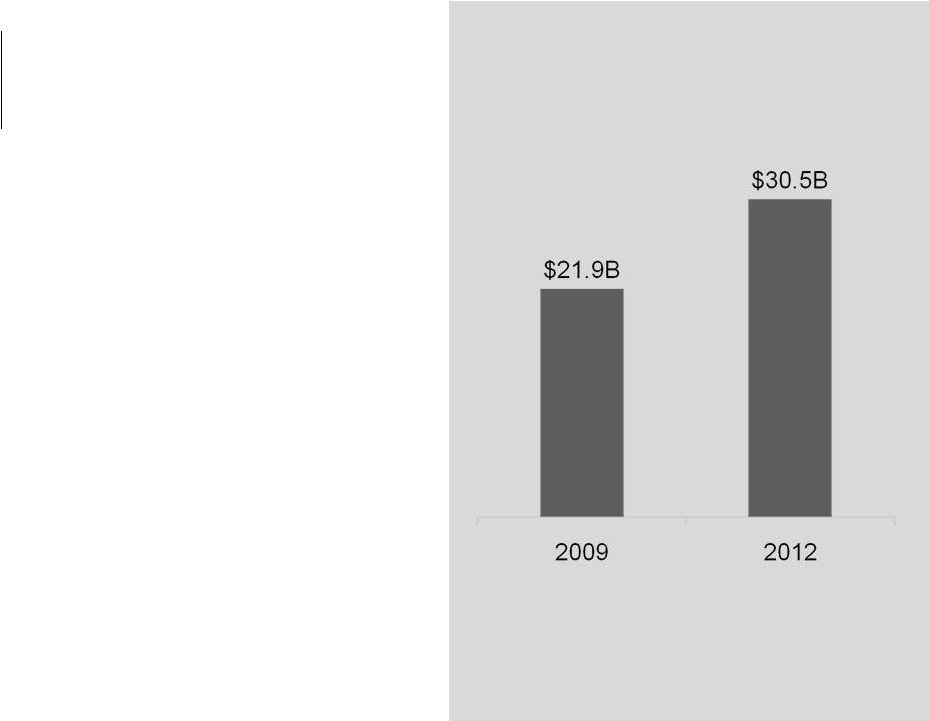
16 STORAGE NETWORKING Source: Dell’Oro 18.6% CAGR 09–12 SAN TAM |
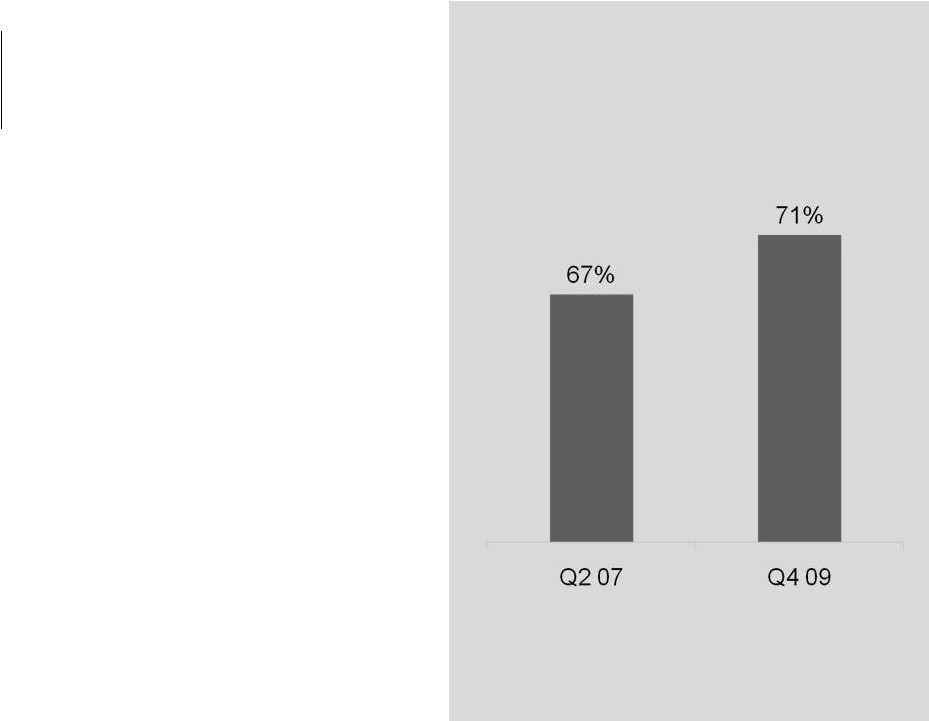 Source: Brocade estimates STORAGE NETWORKING LONGSTANDING LEADERSHIP Q4 FY 2009 Earnings, November 23, 2009 17 © 2009 Brocade Communications Systems, Inc.—Company Proprietary Information
MARKET SHARE |
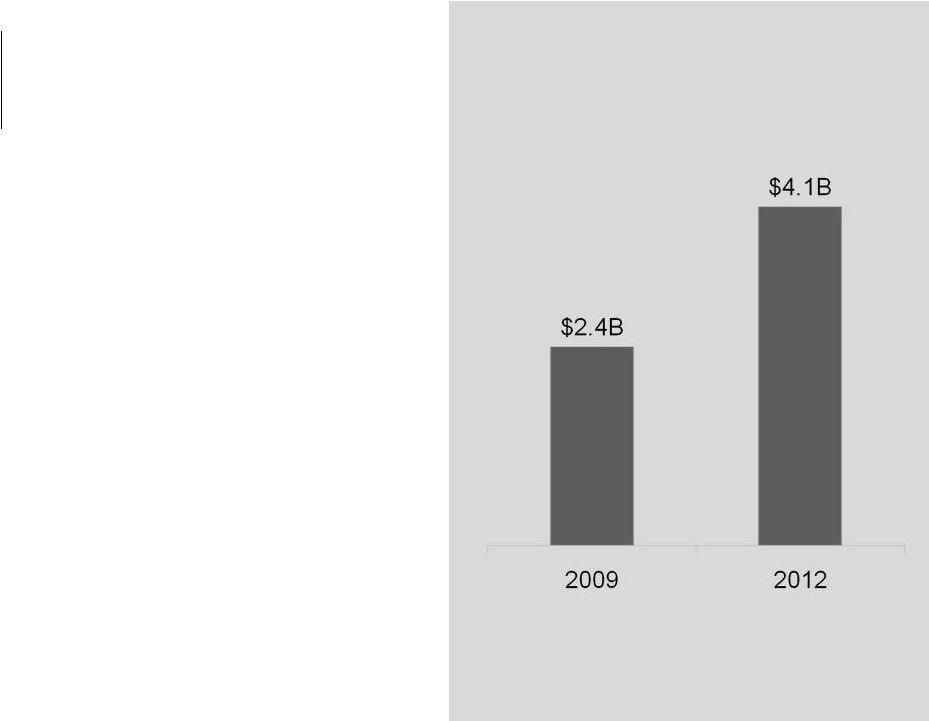
 ETHERNET NETWORKING Source: Infonetics, Dell’Oro 11.7% CAGR 09–12 Q4 FY 2009 Earnings, November 23, 2009 18 © 2009 Brocade Communications Systems, Inc.—Company Proprietary Information
ADDRESSABLE IP TAM |
 NEW
ETHERNET NETWORKING CUSTOMERS 500 EXPANDING OUR FOOTPRINT Q4 FY 2009 Earnings, November 23, 2009 19 © 2009 Brocade Communications Systems, Inc.—Company Proprietary Information
Doubled Ethernet Accounts Among Top 100 Brocade Storage Networking Accounts |
 20 PARTNERS PARTNERS ADDED 111 NEW PARTNERS ADDED 111 NEW PARTNERS |
 Q4 FY 2009
Earnings, November 23, 2009 © 2009 Brocade Communications Systems, Inc.—Company Proprietary Information 21 NEW ROUTES TO MARKET DIRECT VAR DISTRIBUTORS OEM PARTNERS CUSTOMER DIRECT GLOBAL SYSTEMS INTEGRATORS |
 Q4 FY 2009
Earnings, November 23, 2009 © 2009 Brocade Communications Systems, Inc.—Company Proprietary Information 22 PRODUCT DIFFERENTIATION AND STRATEGY DELIVERED 62 SOLUTIONS ETHERNET STORAGE SERVICES |
 Q4 FY 2009
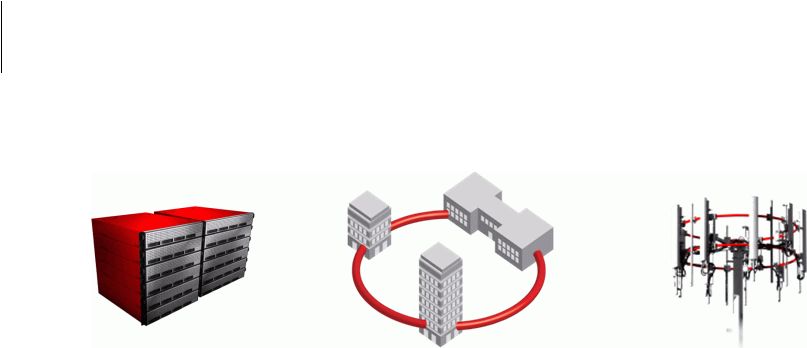
Earnings, November 23, 2009 © 2009 Brocade Communications Systems, Inc.—Company Proprietary Information 23 NEW MARKET SEGMENTS SERVICE PROVIDERS CAMPUS LAN DATA CENTER |
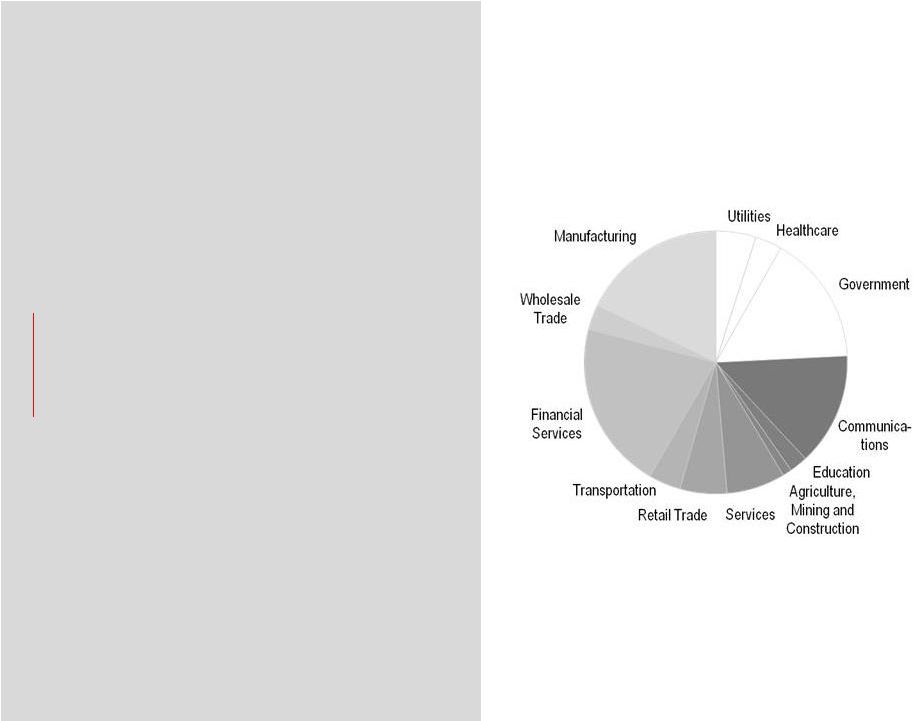
 EDUCATION MEDIA/ ENTERTAINMENT HIGH- PERFORMANCE COMPUTING HEALTHCARE PUBLIC SECTOR Q4 FY 2009 Earnings, November 23, 2009 © 2009 Brocade Communications Systems, Inc.—Company Proprietary Information 24 VERTICAL MARKET STRATEGY |
 Q4
AND FISCAL 2009 SUMMARY Q4 FY 2009 Earnings, November 23, 2009 25 © 2009 Brocade Communications Systems, Inc.—Company Proprietary Information
|
 LOOKING FORWARD Q4 FY 2009 Earnings, November 23, 2009 © 2009 Brocade Communications Systems, Inc.—Company Proprietary Information 26 |
 RELIABILITY CONVERGENCE OPEN SYSTEMS PERFORMANCE Q4 FY 2009 Earnings, November 23, 2009 © 2009 Brocade Communications Systems, Inc.—Company Proprietary Information 27 INNOVATION AND PRODUCT DEVELOPMENT |
 Q4
FY 2009 Earnings, November 23, 2009 © 2009 Brocade Communications Systems, Inc.—Company Proprietary Information
28 CLOSED VS. OPEN SYSTEMS VS |
 KEY
2010 METRICS • Ethernet Account and Revenue Growth • Storage Share • Partnership Growth • Focused Products: – Data Center – Campus LAN – Service Provider Q4 FY 2009 Earnings, November 23, 2009 © 2009 Brocade Communications Systems, Inc.—Company Proprietary Information
29 |
 RICHARD DERANLEAU CFO Q4 FISCAL 2009 FINANCIALS Q4 FY 2009 Earnings, November 23, 2009 30 © 2009 Brocade Communications Systems, Inc.—Company Proprietary Information
|
| Q4
FINANCIAL HIGHLIGHTS Q4 FY 2009 Earnings, November 23, 2009 31 © 2009 Brocade Communications Systems, Inc.—Company Proprietary Information
Revenues in-line with guidance • Strength in North America driven by Federal LAN and Director • Strength in Asia Pacific/Japan • SAN: sequentially up, led by Directors, Switch and Embedded • LAN: sequentially up, led by Federal, partially offset by Service Providers • Global Services: flat sequentially Margins within long-term model • Improving gross margins on mix and Ethernet product cost reductions • Met or exceeded committed acquisition synergies • Effectively controlling spending Strengthening balance sheet • Strong cash flows • Adjusted EBITDA and operating cash flow enable rapid debt repayment • Improving DSO |
 KEY
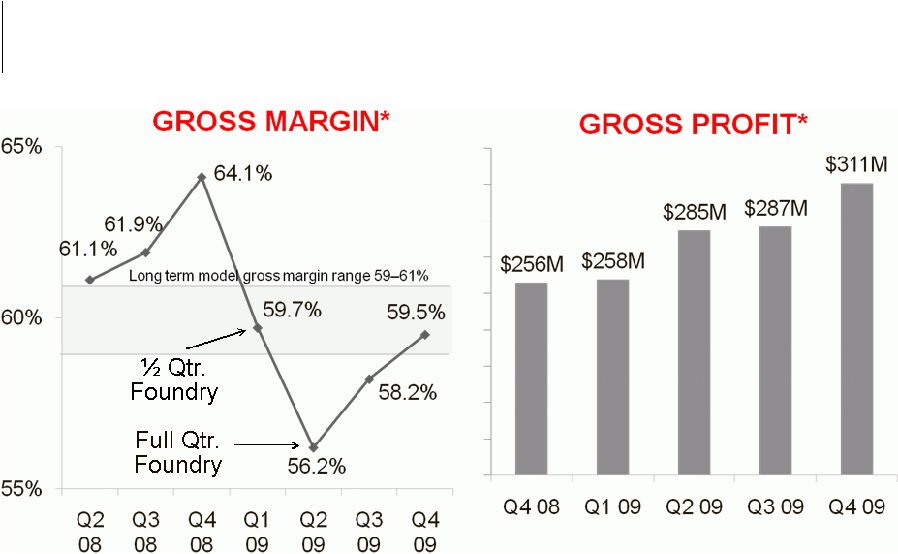
FINANCIAL METRICS Q4 2009 Q3 2009 Q2 2009 Revenue $521.8M $493.3M $506.3M Non-GAAP Gross Margin* 59.5% 58.2% 56.2% Non-GAAP EPS*-Diluted $0.15 $0.12 $0.11 GAAP EPS-Diluted $0.07 ($0.05) ($0.16) Adjusted EBITDA $130.6M $119.3M $119.9M Cash from Operations $155.3M $16.6M $107.3M Q4 FY 2009 Earnings, November 23, 2009 © 2009 Brocade Communications Systems, Inc.—Company Proprietary Information
32 *Non-GAAP, please see reconciliation in appendix. |
 Q4
FY 2009 Earnings, November 23, 2009 © 2009 Brocade Communications Systems, Inc.—Company Proprietary Information
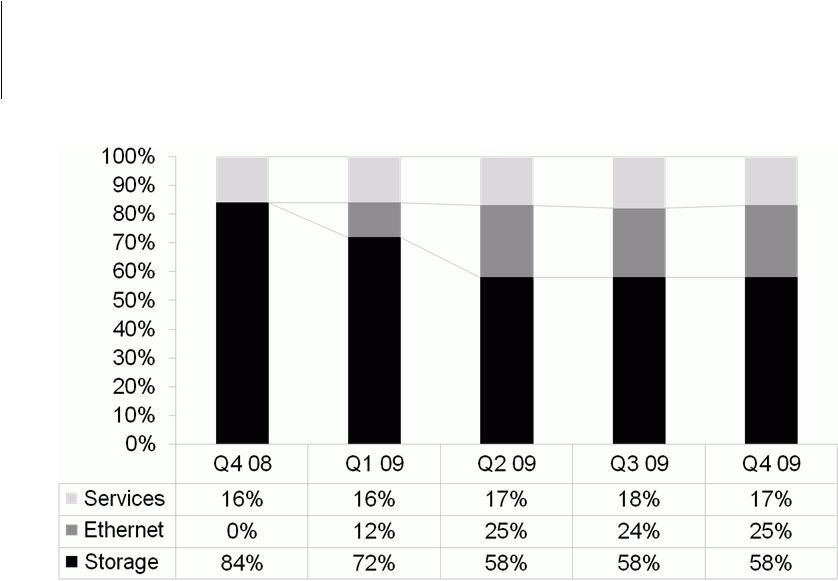
33 REVENUE: STORAGE, ETHERNET, AND SERVICES* *Q4 reflects third full quarter of combined operations post-Foundry
acquisition. |
 Q4
FY 2009 Earnings, November 23, 2009 © 2009 Brocade Communications Systems, Inc.—Company Proprietary Information
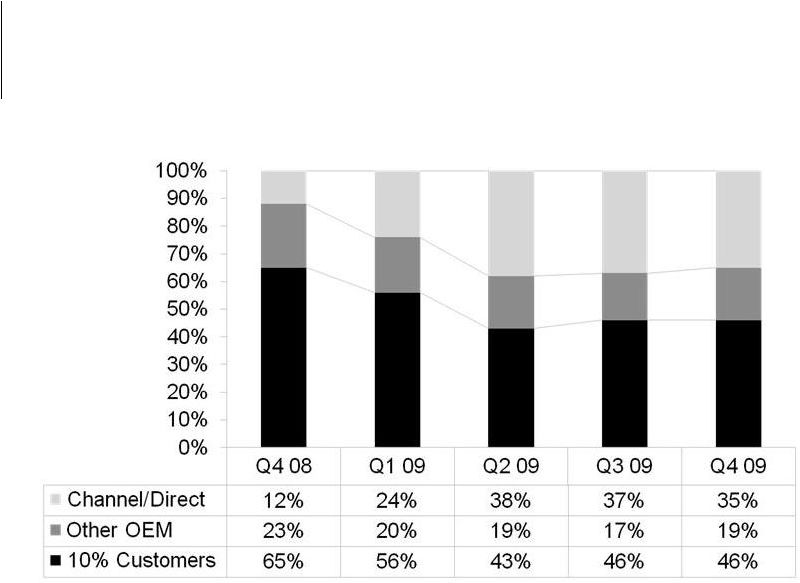
34 REVENUE: 10% CUSTOMERS, OTHER OEM, CHANNEL/DIRECT *Q4 09 is third full quarter of combined operations post-Foundry acquisition.
|
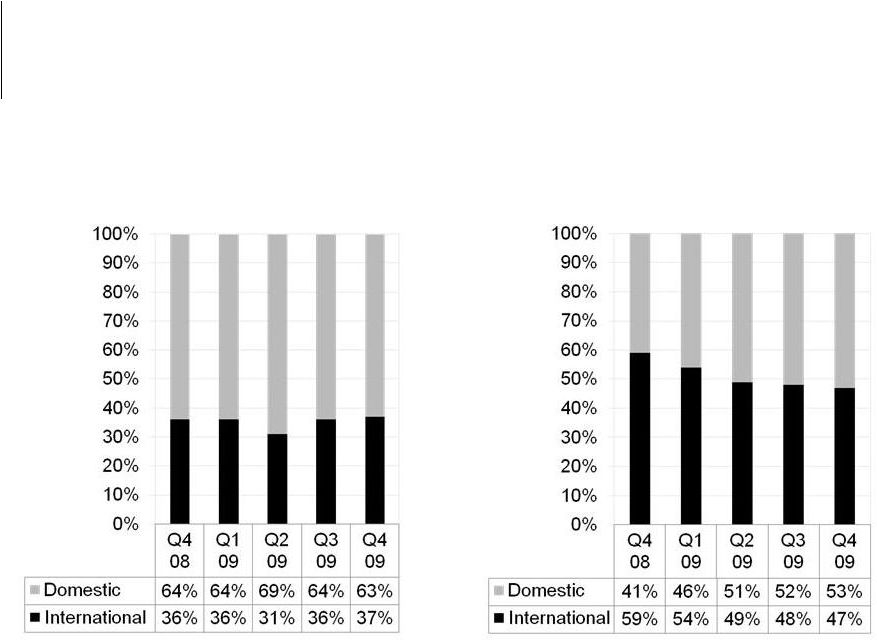 DOMESTIC AND INTERNATIONAL REPORTED REVENUE VS. DEMAND Q4 FY 2009 Earnings, November 23, 2009 35 © 2009 Brocade Communications Systems, Inc.—Company Proprietary Information
REPORTED REVENUE ON A SHIP-TO BASIS DEMAND BY ESTIMATED END USER LOCATION |
 Q4
FY 2009 Earnings, November 23, 2009 © 2009 Brocade Communications Systems, Inc.—Company Proprietary Information
36 GROSS MARGIN* AND PROFIT* * Non-GAAP, please see reconciliation * Non-GAAP, please see reconciliation in appendix |
 Q4
FY 2009 Earnings, November 23, 2009 © 2009 Brocade Communications Systems, Inc.—Company Proprietary Information
37 OPERATING MARGINS* OPERATING EXPENSES* Q4 09: 36.9% Q3 09: 37.8% Q2 09: 37.4% ½ Qtr. Foundry Full Qtr. Foundry Long term model operating margin range: 20–23% * Non-GAAP, please see reconciliation in appendix |
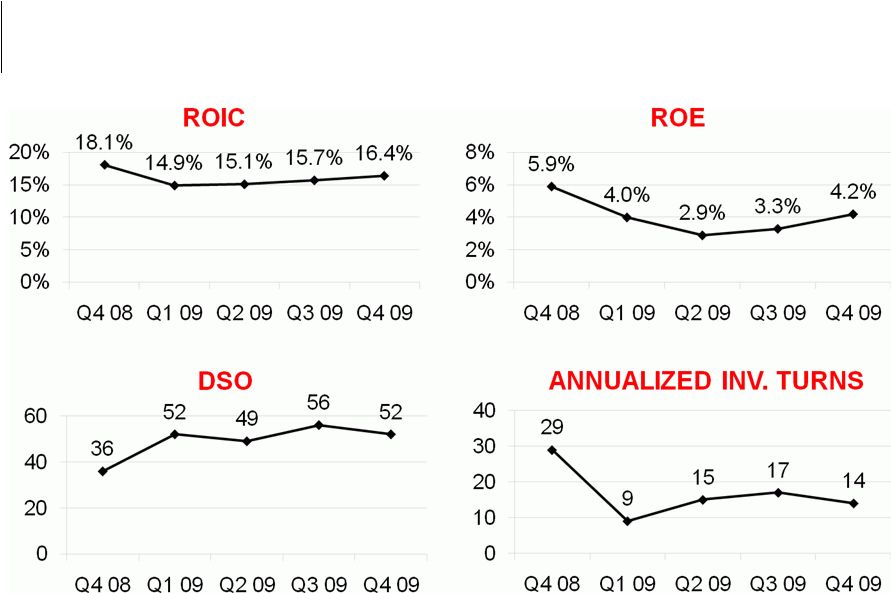 SELECTED BALANCE SHEET METRICS Q4 FY 2009 Earnings, November 23, 2009 38 © 2009 Brocade Communications Systems, Inc.—Company Proprietary Information
|
| Q4 09
FINANCIAL MESSAGES Merger integration • Revenue synergies on plan • Cost synergies ahead of plan Executing well, despite economic conditions • Improved operating margins, now in line with model • Improved DSO, strong working capital management • Strong cash flows provide flexibility Committed to our long-term financial model Q4 FY 2009 Earnings, November 23, 2009 © 2009 Brocade Communications Systems, Inc.—Company Proprietary Information
39 |
| FY 2010
PLANNING ASSUMPTIONS IT market conditions: • Recovering IT Spending in 1H 2010 • Improving to normal IT Spending in 2H 2010 • Benign storage pricing environment Growth drivers: • Benefits of Ethernet distribution partnerships ramping through 2010 • Benefits from product innovation ramping in 2H 2010 Market share: • Gain share in IP Ethernet networking • Maintain share in storage networking – Planning to build share in server products (CNA/Embedded/HBA) Seasonality: • Up sequentially 4–5% in Q1, flat to up in Q2 and Q3, a strong Q4 Q4 FY 2009 Earnings, November 23, 2009 40 © 2009 Brocade Communications Systems, Inc.—Company Proprietary Information
|
 FY
2010 FINANCIAL OUTLOOK Reiterating September 22 nd Outlook Revenue $2.25B–$2.45B Non-GAAP Gross Margin 59–60% Non-GAAP Op. Expenses In Model Non-GAAP Op. Margin In Model Non-GAAP Tax Rate 30% Shares 510M–520M Non-GAAP EPS $0.56–$0.61 Q4 FY 2009 Earnings, November 23, 2009 41 © 2009 Brocade Communications Systems, Inc.—Company Proprietary Information
|
 Q4
FY 2009 Earnings, November 23, 2009 © 2009 Brocade Communications Systems, Inc.—Company Proprietary Information
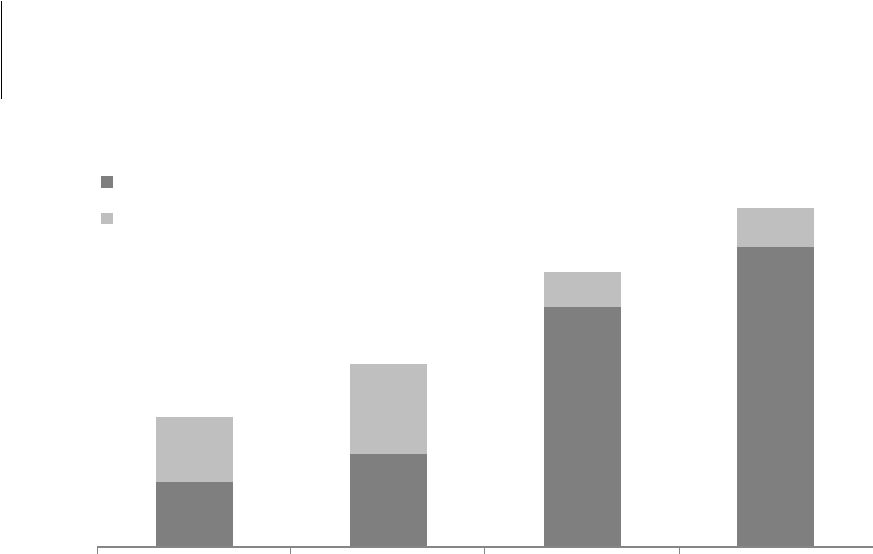
42 OPERATING AND FREE CASH FLOW OUTLOOK * Includes $46M Q1 09 cash from operations, adjusted for $160M class action
payment and normalization of $50M Accounts Payable related to Foundry
acquisition. $162M $235M $600M $750M $163M $225M $90M $100M $325M $460M $690M $850M FY 09 FY 10 FY 11 FY 12 Free Cash Flow Capital Spending * |
 © 2009 Brocade Communications Systems, Inc.—Company Proprietary Information
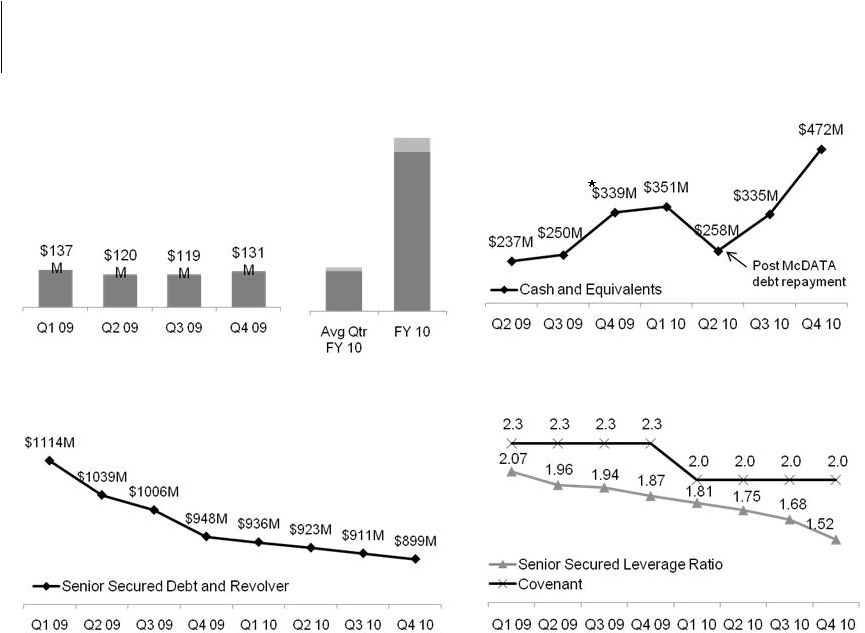
43 ADJUSTED EBITDA, CASH, AND LIQUIDITY OUTLOOK Q4 FY 2009 Earnings, November 23, 2009 REDUCING OUR DEBT… WELL WITHIN OUR DEBT COVENANT… INCREASING CASH BALANCE… * Excludes restricted cash of $12.5M STRONG ADJ. EBITDA PERFORMANCE… $140–152M $560–610M |
 ANTICIPATED REPAYMENT McDATA CONVERT Q4 09 Ending Cash and Equivalents* $339M Q1 10 Cash from Operations $51M Q1 10 Capital Expenditures ($59M) Q1 10 Stock Option Exercises and Other $20M Q1 10 Ending Cash and Equivalents $351M Q2 10 Repayment of McDATA Convertible Debt ($173M) Q2 10 Cash from Operations $141M Q2 10 Capital Expenditures ($74M) Q2 10 Stock Option Exercises and Other $13M Q2 10 Ending Cash and Equivalents $258M * Excludes restricted cash of $12.5M © 2009 Brocade Communications Systems, Inc.—Company Proprietary Information
44 Q4 FY 2009 Earnings, November 23, 2009 |
 Q4
FY 2009 Earnings, November 23, 2009 45 © 2009 Brocade Communications Systems, Inc.—Company Proprietary Information
FY 2009: SUMMARY Transformation Innovation Execution |
 Q4
FY 2009 Earnings, November 23, 2009 © 2009 Brocade Communications Systems, Inc.—Company Proprietary Information
46 LIVE Q&A CALL MIKE KLAYKO CEO November 24th 5:00AM Pacific Time RICHARD DERANLEAU CFO MARC RANDALL SVP Products & Offerings IAN WHITING SVP WW Sales & Marketing DAVE STEVENS CTO |
 APPENDIX AND RECONCILIATIONS |
 Q4
FY 2009 Earnings, November 23, 2009 © 2009 Brocade Communications Systems, Inc.—Company Proprietary Information
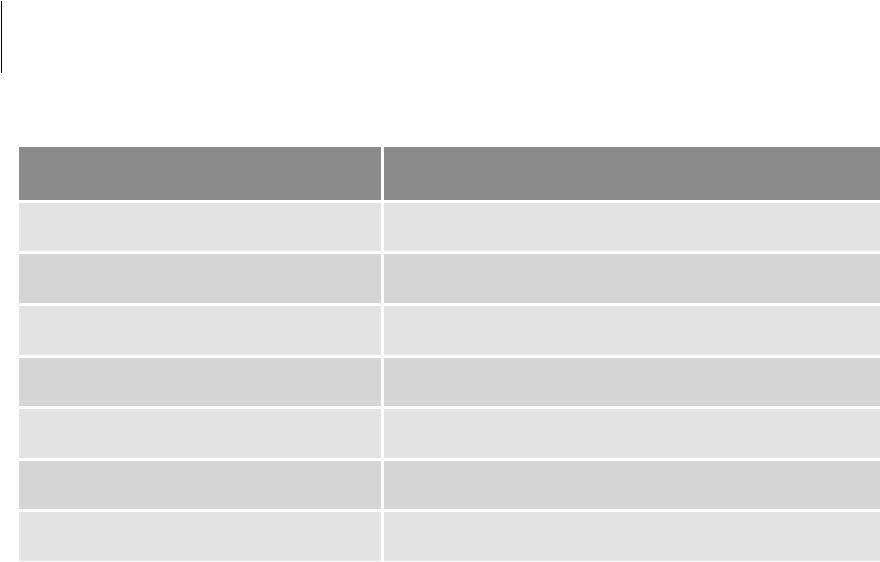
48 LONG TERM FINANCIAL MODEL Reiterating Model Presented on September 22, 2009 Data Storage IP Ethernet Global Services Brocade TOTAL Gross Margin* 60–63% 55–60% 45–50% 59–61% Operating Expense* 37–39% 38–40% 20–25% 38–39% Operating Margin* 21–26% 15–22% 20–30% 20–23% * Non-GAAP numbers, see GAAP vs. Non-GAAP reconciliation in appendix
|
 SEQUENTIAL INCOME STATEMENT* COMPARISON 20.3% 22.7% 3.2% 3.2% 18.0% 17.3% 16.7% 16.3% 41.8% 40.5% Q3 09 Q4 09 Cost of revenue Research and development Sales and marketing General and administrative Income from operations Q4 FY 2009 Earnings, November 23, 2009 © 2009 Brocade Communications Systems, Inc.—Company Proprietary Information
49 * Non-GAAP, please see reconciliation in appendix |
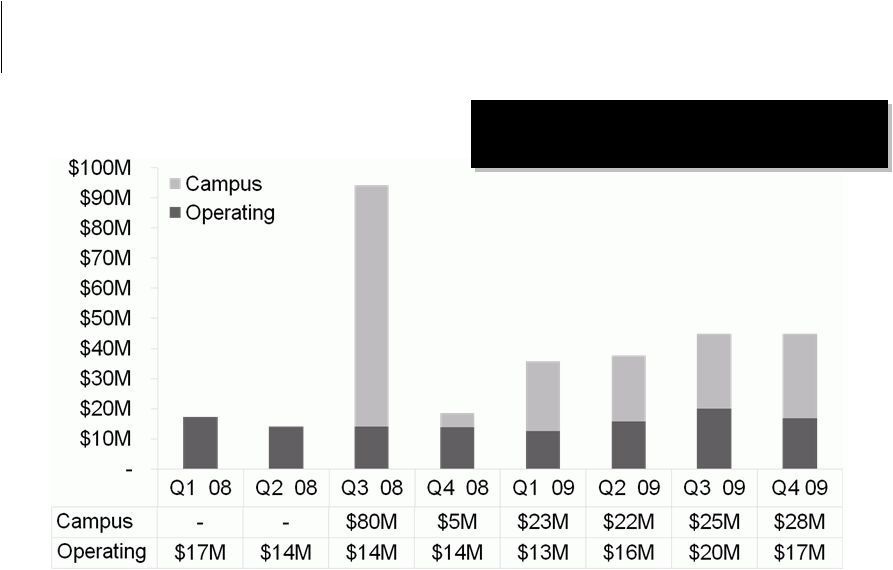 CAPITAL EXPENDITURES Cumulative Campus CAPEX: $183M, approximately 2/3 complete Q4 FY 2009 Earnings, November 23, 2009 50 © 2009 Brocade Communications Systems, Inc.—Company Proprietary Information
|
 Q4
FY 2009 Earnings, November 23, 2009 © 2009 Brocade Communications Systems, Inc.—Company Proprietary Information
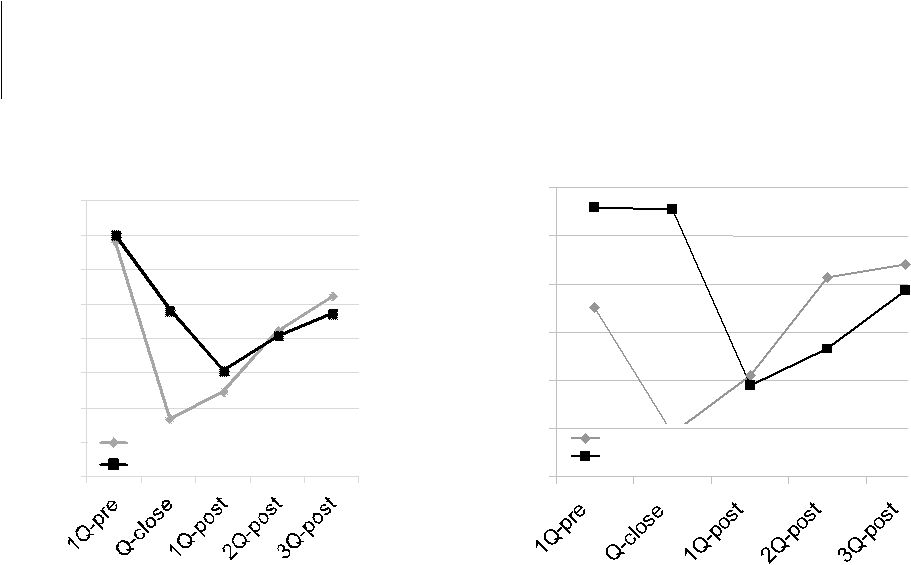
51 RELATIVE ACQUISITION INTEGRATION MARGINS* * Non-GAAP, see reconciliation in appendix, McDATA closed in Q2 07 and Foundry closed in Q1 09 50% 52% 54% 56% 58% 60% 62% 64% 66% GROSS MARGIN Brocade during McData acquisition Brocade during Foundry acquisition OPERATING MARGIN 15% 17% 19% 21% 23% 25% 27% Brocade during McData acquisition Brocade during Foundry acquisition |
 SR.
SECURED LEVERAGE RATIO Q4 FY 2009 Earnings, November 23, 2009 © 2009 Brocade Communications Systems, Inc.—Company Proprietary Information
52 Consolidated Senior Secured Leverage Ratio Q1 FY09 Q2 FY09 Q3 FY09 Q4 FY09 $ Thousand Actual Actual Actual Actual Consolidated Net Income ($26,031) ($63,118) ($21,034) $34,243 plus (i) Consolidated Interest Charges $21,357 $26,398 $22,845 $20,681 (ii) Provision for Federal, state, local and foreign income taxes payable $22,028 $20,021 $0 (iii) Depreciation and amortization expense $39,754 $54,377 $50,956 $51,486 (iv) Fees, costs and expenses incurred on or prior to the Acquisition Closing Date in
connection with the Acquisition and the financing thereof $0 $0 (v) Any cash restructuring charges and integration costs in connection with the
Acquisition, in an aggregate amount not to exceed $75,000,000 $5,319 $4,720 $1,450 $333 (vi) non-cash restructuring charges incurred in connection with the Transaction, all
as approved by Arrangers $18,400 $19,972 $5,840 $2,097 (vii) other non-recurring expenses reducing such Consolidated Net Income which do
not represent a cash item in such period or any future period (in each case
of or by the Borrower and its Subsidiaries for such Measurement Period) $26,900 $53,304 $0 $0 (viii) any non-cash charges for stock compensation expense in compliance with FAS
123R and amortization of the fair value of unvested options under the Acquired Business’ employee stock option plan assumed by the Borrower $18,080 $40,111 $43,313 $35,714 (ix) legal fees and expenses relating to the Borrower’s indemnification obligations for
the benefit of its former officers and directors in connection with its
historical stock option litigation $13,740 $11,778 ($561) $0 minus (i) Federal, state, local and foreign income tax credits $0 ($24,769) $0 ($6,707) (ii) all non-cash items increasing Consolidated Net Income (in each case of or by the
Borrower and its Subsidiaries for such Measurement Period) ($2,877) ($2,899) ($3,511) ($7,216) Consolidated EBITDA $136,670 $119,874 $119,319 $130,631 4 Quarter Trailing Consolidated EBITDA $537,081 $531,304 $518,002 $506,494 Consolidated Senior Secured Debt $1,114,050 $1,039,050 $1,005,909 $948,028 Consolidated Senior Secured Leverage Ratio 2.07 1.96 1.94 1.87 |
 Q4
FY 2009 Earnings, November 23, 2009 © 2009 Brocade Communications Systems, Inc.—Company Proprietary Information
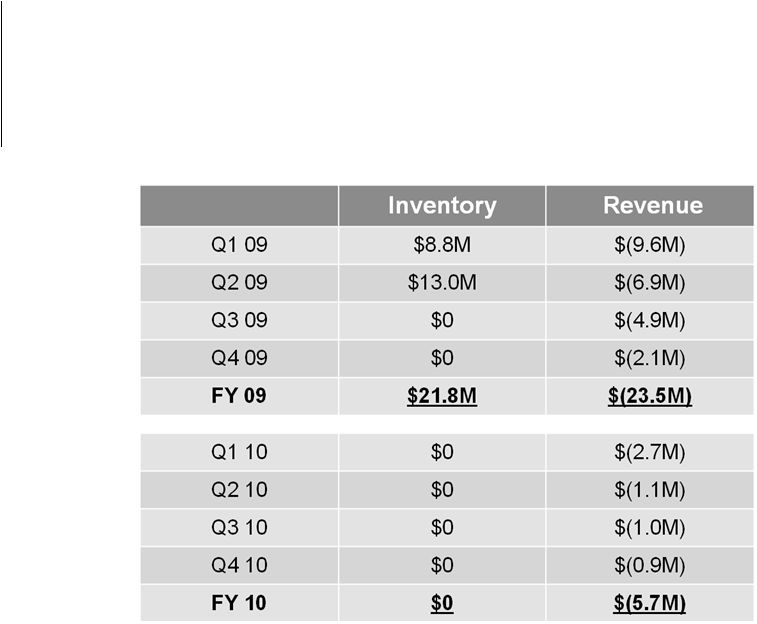
53 FOUNDRY PURCHASE PRICE ADJUSTMENT Anticipated Impact to Inventory and Revenue |
 Q4
FY 2009 Earnings, November 23, 2009 © 2009 Brocade Communications Systems, Inc.—Company Proprietary Information
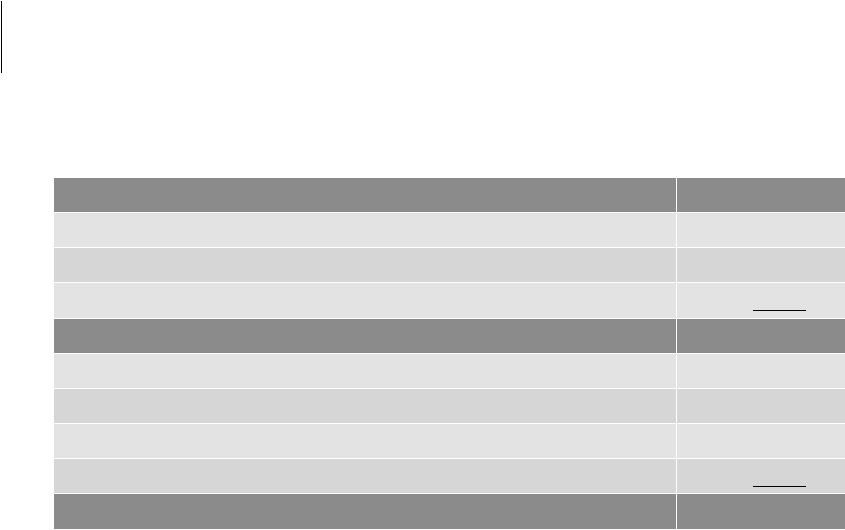
54 QUARTERLY NET INCOME (LOSS) GAAP/NON-GAAP RECONCILIATION (IN THOUSANDS) Q4 09 Q3 09 Q4 08 Net income (loss) on a GAAP basis $33,597 -$21,033 $35,581 Adjustments: Legal fees and recoveries associated with indemnification obligations and other related expenses, net -$14,612 -$561 $26,274 Stock-based compensation expense $35,715 $43,313 $7,515 Amortization of intangible assets $34,950 $35,002 $16,600 Acquisition and integration costs $333 $1,450 $682 Loss on impairment of portfolio investments – – $8,751 Legal fees associated with certain pre-acquisition litigation $546 – $20 Restructuring costs and facilities lease loss benefit, net – – $3,208 Provision for certain pre-acquisition litigation $14,335 – – Acquisition-related financing charges – – $4,736 Income tax effect of adjustments -$31,502 -$2,795 -$27,602 Non-GAAP net income 73,362 $55,376 $75,765 |
 THANK YOU |