Attached files
| file | filename |
|---|---|
| 8-K - CHENIERE ENERGY, INC. 8-K - Cheniere Energy, Inc. | form_8-k.htm |
CHENIERE
ENERGY
Cheniere
Energy
Corporate Presentation
November 2009
Corporate Presentation
November 2009

2
Safe
Harbor Act
1
This
presentation contains certain statements that are, or may be deemed to be,
“forward-looking statements” within the meaning of Section 27A of the Securities
Act and Section 21E of
the Securities Exchange Act of 1934, as amended, or the Exchange Act. All statements, other than statements of historical facts, included herein are “forward-looking statements.”
Included among “forward-looking statements” are, among other things:
the Securities Exchange Act of 1934, as amended, or the Exchange Act. All statements, other than statements of historical facts, included herein are “forward-looking statements.”
Included among “forward-looking statements” are, among other things:
§ statements
that we expect to commence or complete construction of each or any of our
proposed liquefied natural gas, or LNG, receiving terminals by certain dates, or
at all;
§ statements
that we expect to receive authorization from the Federal Energy Regulatory
Commission, or FERC, to construct and operate proposed LNG receiving terminals
by a
certain date, or at all;
certain date, or at all;
§ statements
regarding future levels of domestic natural gas production and consumption, or
the future level of LNG imports into North America, or regarding projected
future
capacity of liquefaction or regasification facilities worldwide regardless of the source of such information;
capacity of liquefaction or regasification facilities worldwide regardless of the source of such information;
§ statements
regarding any financing transactions or arrangements, whether on the part of
Cheniere or at the project level;
§ statements
relating to the construction of our proposed LNG receiving terminals, including
statements concerning estimated costs, and the engagement of any EPC
contractor;
§ statements
regarding any Terminal Use Agreement, or TUA, or other commercial arrangements
presently contracted, optioned, marketed or potential arrangements to be
performed
substantially in the future, including any cash distributions and revenues anticipated to be received; statements regarding the commercial terms and potential revenues from activities
described in this presentation;
substantially in the future, including any cash distributions and revenues anticipated to be received; statements regarding the commercial terms and potential revenues from activities
described in this presentation;
§ statements
regarding the commercial terms or potential revenue from any arrangements which
may arise from the marketing of uncommitted
capacity from any of the terminals, including the Creole Trail and Corpus Christi terminals which do not currently have contractual commitments;
capacity from any of the terminals, including the Creole Trail and Corpus Christi terminals which do not currently have contractual commitments;
§ statements
regarding the commercial terms or potential revenue from any arrangement
relating to the proposed contracting for excess or expansion
capacity for the Sabine Pass LNG Terminal described in this presentation;
capacity for the Sabine Pass LNG Terminal described in this presentation;
§ statements
that our proposed LNG receiving terminals, when completed, will have certain
characteristics, including amounts of regasification and
storage capacities, a number of storage tanks and docks and pipeline interconnections;
storage capacities, a number of storage tanks and docks and pipeline interconnections;
§ statements
regarding Cheniere, Cheniere Energy Partners and Cheniere Marketing forecasts,
and any potential revenues, cash flows and capital expenditures which may be
derived
from any
of Cheniere business groups;
§ statements
regarding Cheniere Pipeline Company, and the capital expenditures and potential
revenues related to this business group; statements
regarding our proposed LNG receiving terminals’ access to existing pipelines, and their ability to obtain transportation capacity on existing pipelines;
regarding our proposed LNG receiving terminals’ access to existing pipelines, and their ability to obtain transportation capacity on existing pipelines;
§ statements
regarding possible expansions of the currently projected size of any of our
proposed LNG receiving terminals;
§ statements
regarding the payment by Cheniere Energy Partners, L.P. of cash
distributions;
§ statements
regarding our business strategy, our business plan or any other plans,
forecasts, examples, models, forecasts or objectives; any or all of which are
subject to change;
§ statements
regarding estimated corporate overhead expenses; and
§ any
other statements that relate to non-historical information.
These forward-looking statements are often identified by the use of terms and phrases such as “achieve,” “anticipate,” “believe,” “estimate,” “example,” “expect,” “forecast,” “opportunities,”
“plan,” “potential,” “project,” “propose,” “subject to,” and similar terms and phrases. Although we believe that the expectations reflected in these forward-looking statements are reasonable,
they do involve assumptions, risks and uncertainties, and these expectations may prove to be incorrect. You should not place undue reliance on these forward-looking statements, which
speak only as of the date of this presentation. Our actual results could differ materially from those anticipated in these forward-looking statements as a result of a variety of factors,
including those discussed in “Risk Factors” in the Cheniere Energy, Inc. Annual Report on Form 10-K for the year ended December 31, 2008, which are incorporated by reference into this
presentation. All forward-looking statements attributable to us or persons acting on our behalf are expressly qualified in their entirety by these ”Risk Factors”. These forward-looking
statements are made as of the date of this presentation, and we undertake no obligation to publicly update or revise any forward-looking statements.
3
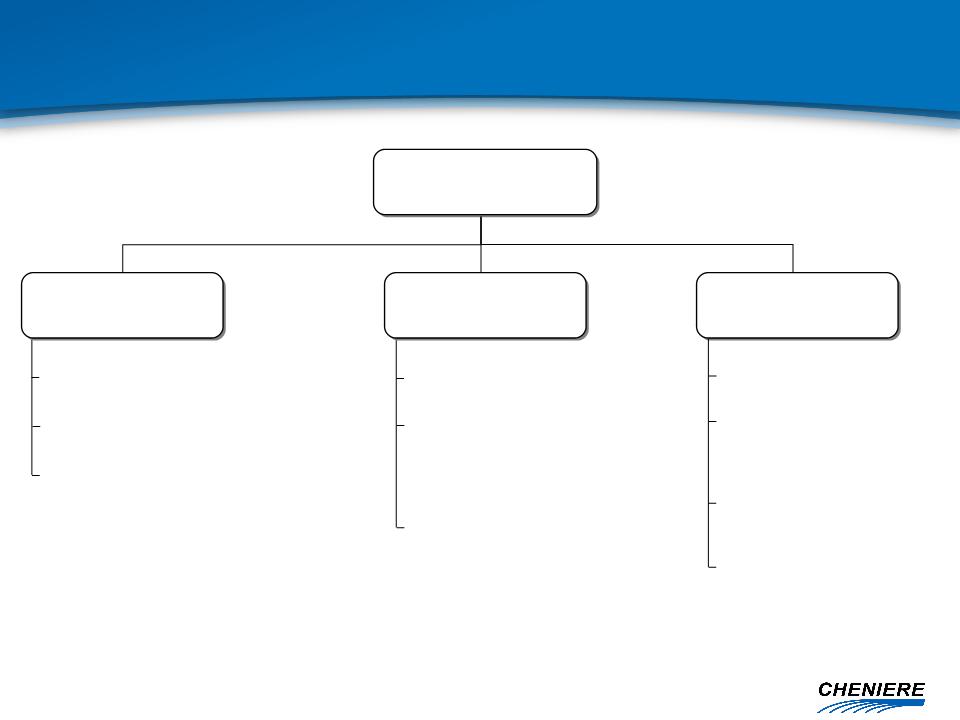
Cheniere
Energy
Marketing
Sabine
Pass LNG (SPLNG) (90.6%)
Freeport
LNG (30%)
Approved
Permits:
Creole
Trail LNG
Corpus
Christi LNG
Creole
Trail P/L (100%)
Approved
Permits:
Creole
Trail P/L Phase II
Corpus
Christi P/L
Development
Projects:
Southern
Trail P/L
Frontera
2.0
Bcf/d SPLNG TUA
MSPAs
with major
LNG suppliers,
merchants, utilities
LNG suppliers,
merchants, utilities
Isle
of Grain Put
Option
12 Cargoes/yr
Over
100 domestic
NAESBs and ISDAs
NAESBs and ISDAs
Pipelines
Terminals
Cheniere
Business Segments
4
|
Sold
- Terminal Use
Agreement (TUA) |
Capacity
(Bcf/d)
|
Estimated
Annual
Distribution to Cheniere* |
|
Conoco
Dow
Mitsubishi
|
0.90
0.50
0.15
|
~
$15MM
|
*Quarterly cash
distributions commenced in 1Q09 and are subject to Freeport board
approval.
April
2009
Freeport
LNG Development, L.P.
Cheniere Energy, Inc. 30%
Cheniere Energy, Inc. 30%
5
|
TUA
|
Capacity
|
2010
Full-Year
Payments ($ in MM) |
|
Total LNG
USA
Chevron
USA
Cheniere
Marketing
|
1.0
Bcf/d
1.0
Bcf/d
2.0
Bcf/d
|
$123
$128
$252
|
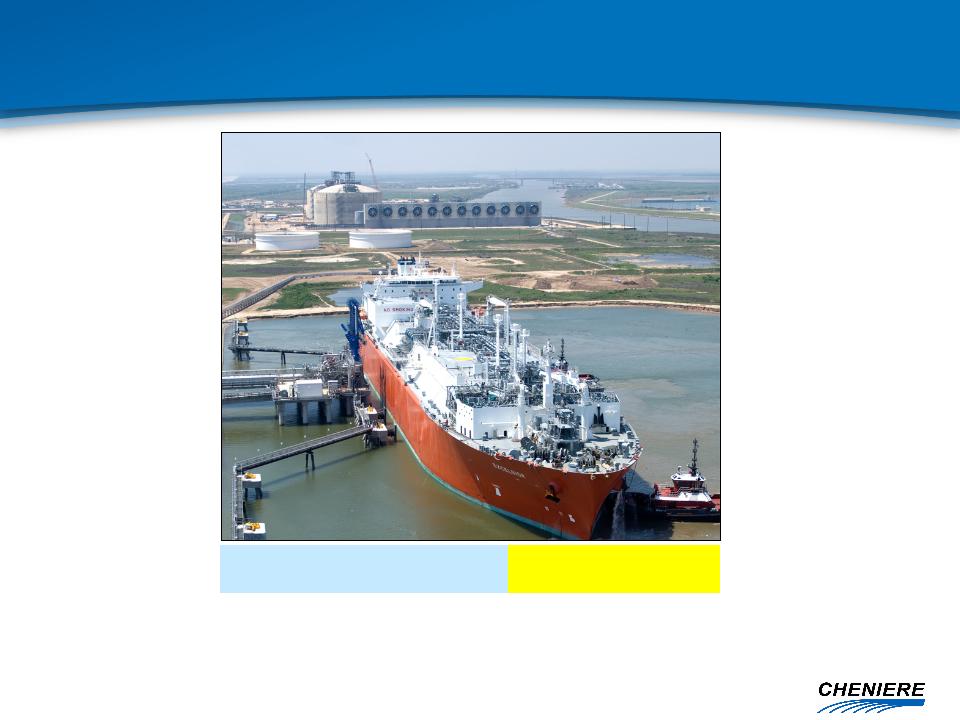
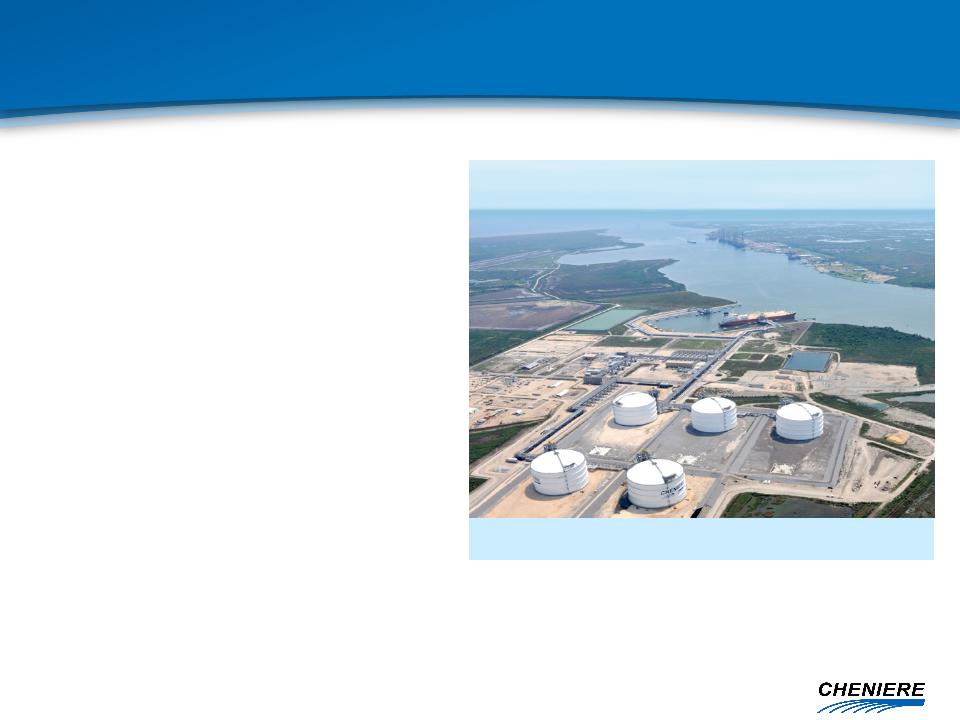
Aerial
view of Sabine Pass LNG August 2009
3
Sabine
Pass LNG
Cheniere Energy, Inc. 90.6%
Cheniere Energy, Inc. 90.6%
§ Vaporization
– ~4.3 Bcf/d peak
send-out
§ Storage
– 5 tanks x 160,000 cm
(16.9 Bcfe)
§ Berthing
/ Unloading
– Two
docks
– LNG carriers up to
266,000 cm
– Four dedicated
tugs
§ Land
– 853 acres in Cameron
Parish, LA
§ Accessibility
- Deep Water Ship Channel
– Sabine River Channel
dredged to 40
feet
feet
§ Proximity
– 3.7 nautical miles
from coast
– 22.8 nautical miles
from outer buoy
§ LNG
Export Licenses Approved
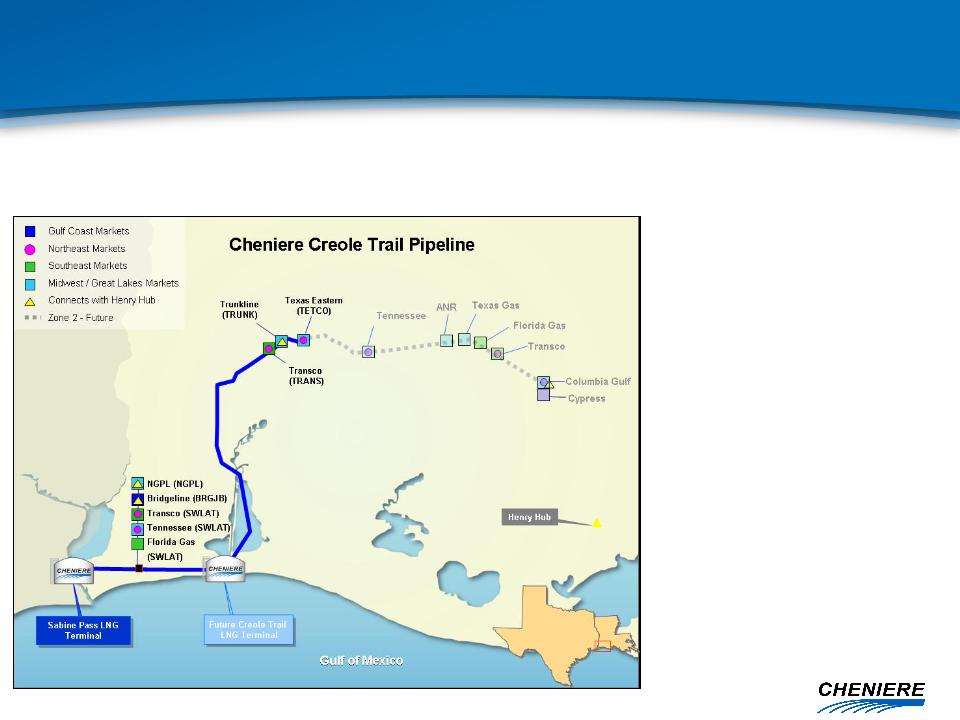
6
§ Size:
– 2.0
Bcf/d
§ Diameter:
– 42-inch
diameter
§ Cost:
– ~$560 million first
94 miles
§ Initial
interconnects:
– 4.1 Bcf/d of
interconnect
capacity
capacity
§ Provides
optimal market access for LNG from the Sabine Pass terminal
§ First
94 miles complete and in-service, additional 58 miles permitted
Creole
Trail Pipeline
Cheniere Energy, Inc. 100%
Cheniere Energy, Inc. 100%

7
Strategic
Focus
§ Commercial -
monetize 2 Bcf/d regas capacity at Sabine
Pass receiving terminal held by Cheniere Marketing
Pass receiving terminal held by Cheniere Marketing
– International LNG
marketing efforts
– Seek long-term TUAs,
LNG purchase/sale agreements
– Purchase spot
cargoes available in the Gulf of Mexico
§ Financial - manage
liquidity

8
Annualized*
($ in
MM)
Disbursements
§ Cheniere Marketing
TUA @ Sabine Pass $252
§ G&A 30-40
§ Pipeline & tug
services 10
§ Other, incl adv tax
payments 3-5
§ Debt service 44
$50 -
65
*Estimates represent
a summary of internal forecasts, are based on current assumptions and are
subject to change. Actual
performance
may differ materially from, and there is no plan to update the forecast. See
“Safe Harbor” cautions. Estimates
exclude
earnings
forecasts from operating activities.
Net
cash outflow
Estimated
Future Cash Flows
Cheniere Energy, Inc.
Cheniere Energy, Inc.
Receipts
§ Freeport
investment $10-20
§ Distributions from
CQP 254
§ Management fees from
CQP 19

9
Annualized*
($ in
MM)
Disbursements
§ Operating
Expenses $34
§ Management Fees 19
§ Debt Service 165
$285
*Estimates represent
a summary of internal forecasts, are based on current assumptions and are
subject to change. Actual
performance
may differ materially from, and there is no plan to update the forecast. See
“Safe Harbor” cautions.
Available
Cash
Distributions to
Unitholders
$281
Estimated
Future Cash Flows
Cheniere Energy Partners
Cheniere Energy Partners
Receipts
§ TUA Customers $503

10
Current
Global Issues for LNG and Natural Gas
§ The world has
abundant reserves of natural gas, but will they be produced?
§ The current global
gas oversupply is expected to last at least 2 to 4 years
§ The growth of LNG
production capacity will provide a bridge between the
continents
continents
– Flexible LNG of 10
to 12 Bcf/d means the world can send a price signal to 3
or 4
LNG vessels every day
LNG vessels every day
§ The substantial
disconnect between oil-indexed prices for gas and spot
prices is straining traditional business models
prices is straining traditional business models
§ Russia, the U.S. and
Canada provide the lion share of world gas supply -
everything else is several orders of magnitude smaller
everything else is several orders of magnitude smaller
§ New supply is being
secured under two very different business models
– Underpinned by crude
based contracts such as in the recent Gorgon deals and
most of Gazprom’s production
most of Gazprom’s production
– Market based
contracting as is the case in the U.S., Canada and the UK model
§ Incremental volumes
from unconventional reserves abundant in U.S. at $6
to $8/MMBtu
to $8/MMBtu
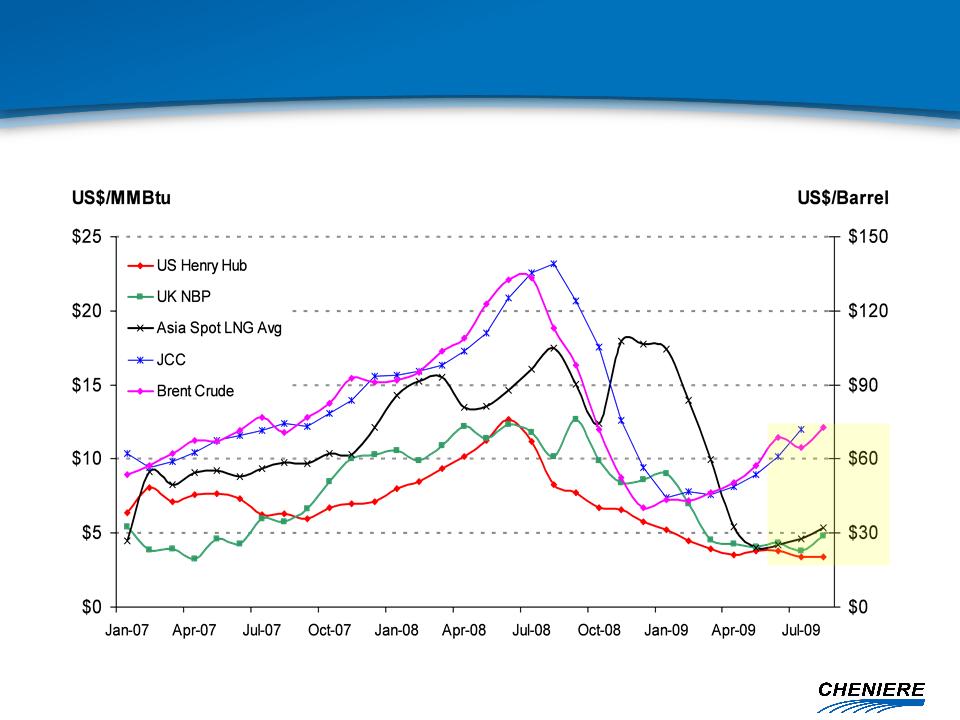
11
Source:
PIRA Energy Group, Petroleum Association of Japan (JCC)
Note: 6
MMBtu per 1 Oil Barrel
JCC =
Japanese Crude Cocktail
• Convergence of spot
prices
• Disconnect from
crude
Global
Prices & Linkage
Implications
Implications
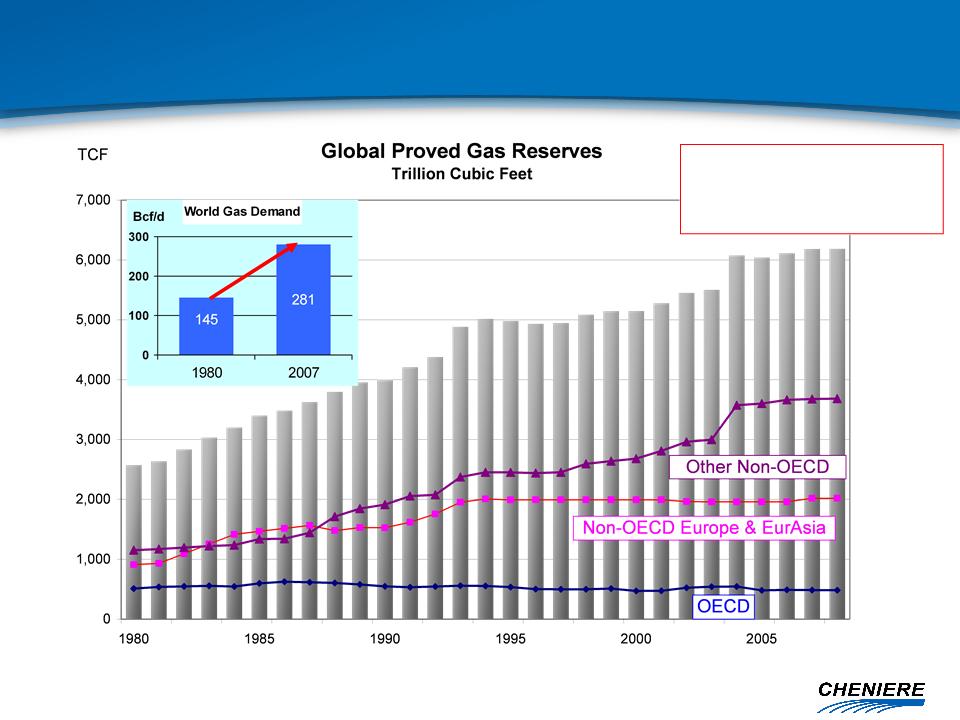
12
Since
1980
World
Gas Demand: +94%
World
Gas Reserves:+140%
Source:
EIA 2009 (Historical World Reserves & Demand)
Bcf/d
Bcf/d
Global
Natural Gas Supply & Demand
Rapid reserve and demand growth
Rapid reserve and demand growth
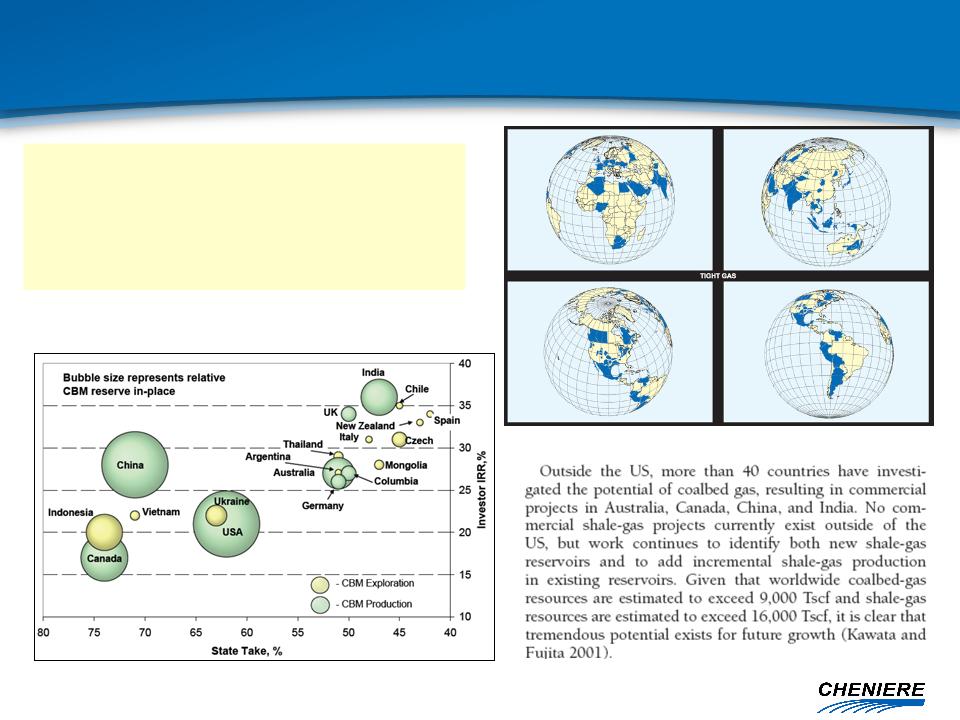
13
“[Ultimately
recoverable remaining resources of] Non-
conventional gas resources - including coalbed
methane, tight gas sands and gas shales - are much
larger, amounting perhaps to over 900 tcm (31,000
Tcf), with 25% in the US and Canada combined.”
conventional gas resources - including coalbed
methane, tight gas sands and gas shales - are much
larger, amounting perhaps to over 900 tcm (31,000
Tcf), with 25% in the US and Canada combined.”
IEA
World Energy Outlook 2008
Coalbed
and Shale-Gas Reservoirs, Jenkins et al, Society
of Petroleum Engineers paper 103514
of Petroleum Engineers paper 103514
Comparison
of Global CBM Resources (IHS)
Global
Distribution of Tight Gas Resources
(Wood
McKenzie)
Global
Potential for Unconventional
Gas Production is Huge
Gas Production is Huge
14
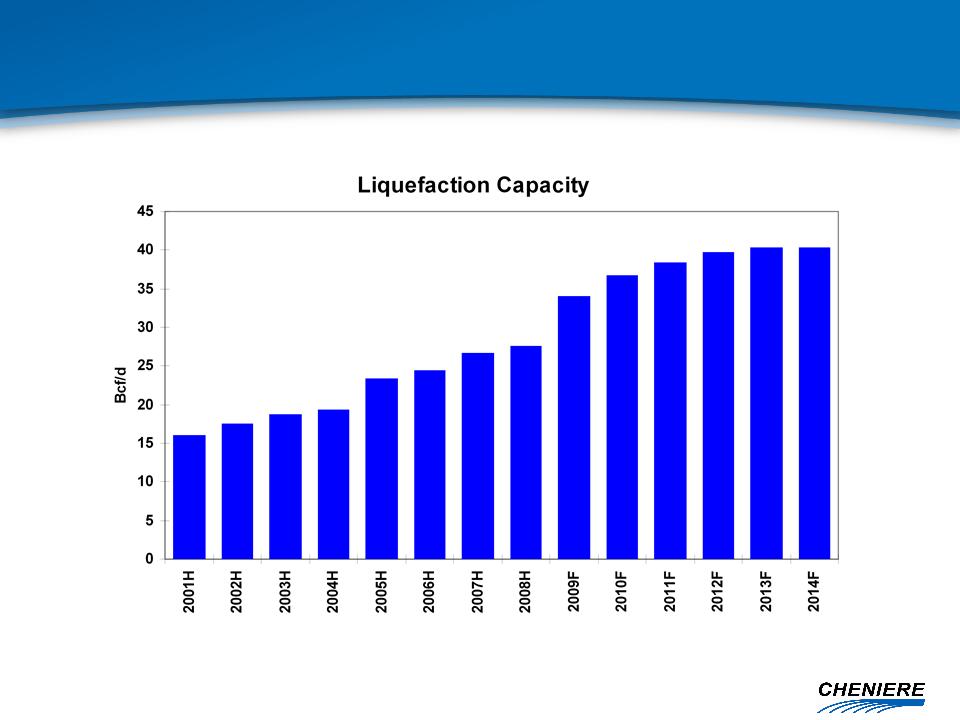
Source:
Cheniere Research
Liquefaction
Capacity Growing Sharply

15
•
Slippage in startup of commercial deliveries: QG II T4, Tangguh,
Yemen
Source:
Cheniere Research
Expected
Incremental Capacity
16
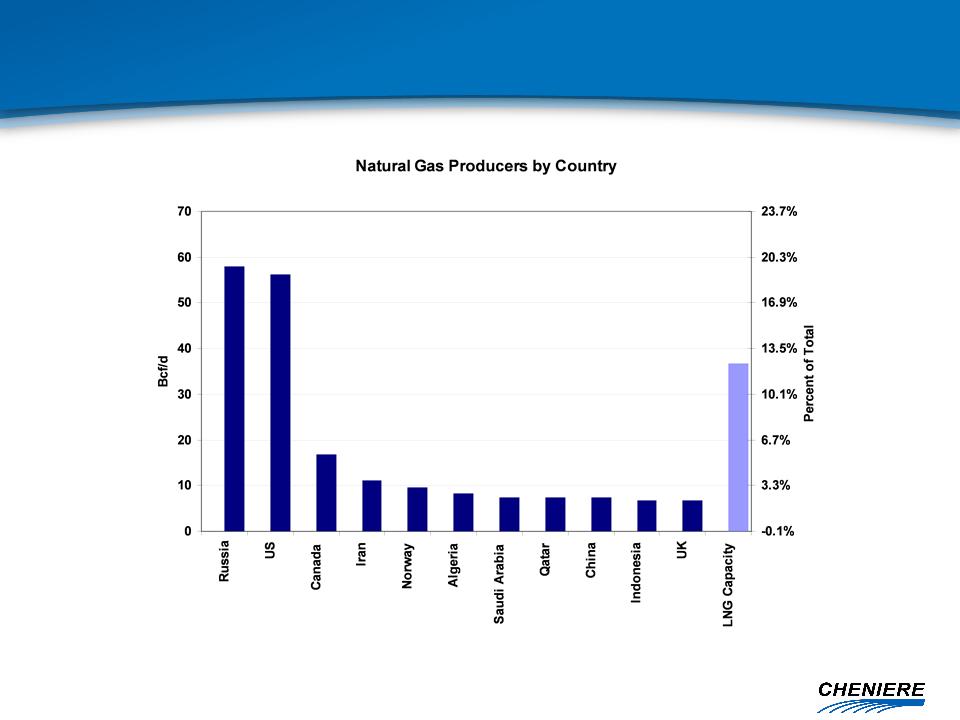
Source:
BP Statistical Review 2009
Russia
and U.S. Account for Nearly 40% of Natural
Gas Production
Gas Production

17
Source:
IGU- Natural Gas Industry Study to 2030
How
Will Current Market Conjuncture Affect the
Evolution of these Pricing Mechanisms?
Evolution of these Pricing Mechanisms?
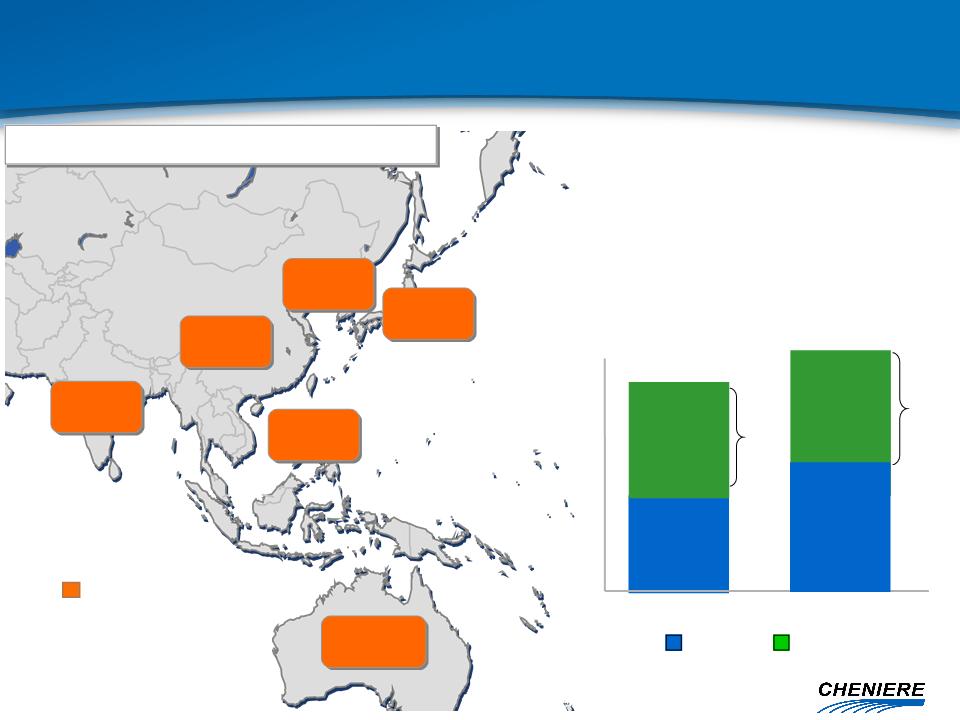
18
Bcf/d
Source:
Historical: Cedigaz (2007);
Forecast: Cheniere
Research
30
25
20
15
10
5
0
2007
2010
Oil
Indexed
Pipeline
LNG
Japan
9
15
Bcf/d
Bcf/d
Korea
3
China
7
Australia
3
India
4
Taiwan
1
16
Bcf/d
LNG
56%
LNG
50%
Incremental
LNG
Need
2010
= ~1
Bcf/d
Consumption
2007
= 27 Bcf/d
2010
= 32 Bcf/d
*
OECD Asia plus India & China
LNG
Import Capacity
2007
= 34 Bcf/d
2010
= 37 Bcf/d
Pipeline
Import
Capacity
Eventually
Large
Bcf/d
Oil
Indexed
Regional
Demand by Country (2007)
Asia
Pacific* Natural Gas Demand Projection

19
Krishna
Godavari
Basin
Turkmenistan-
China Pipeline
China Pipeline
+3
Bcf/d
CBM
India
KJV
Pipeline
Pipeline
+2.8
Bcf/d
China
West-
East #2 Pipeline
+2.9 Bcf/d
East #2 Pipeline
+2.9 Bcf/d
CBM
CBM
Central
Asia
400
Tcf
Proved*
Russia
1,600
Tcf
Proved
Source:
Cheniere Research, BP Statistical Review 2008 (Reserve data)
*Based
on updated Turkmenistan reserves from Oct. 2008 Gaffney, Cline & Associates
survey of South Yolotan-Osman
field
field
Siberia
1,500+
Tcf
Unexplored
Potential
New
Asia Pipelines
Major projects boost access to indigenous reserves
Major projects boost access to indigenous reserves
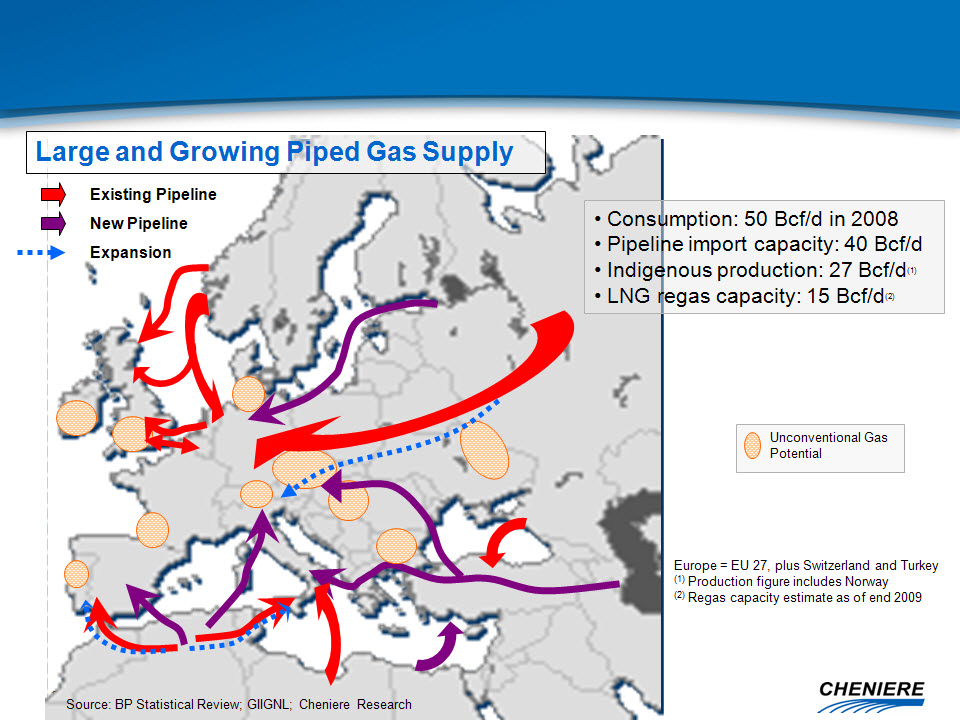
20
European
Suppliers are Undertaking a Significant
Expansion of Pipeline Capacity
Expansion of Pipeline Capacity
21
Existing
Liquefaction
Under
Construction
Proposed
Liquefaction
Atlantic
Basin
~11
Bcf/d
ME
Gulf
13
Bcf/d
Asia
Pacific
13
Bcf/d
Europe
5-7
Bcf/d
Asia
Pacific
16
Bcf/d
2010
Liquefaction Capacity
2010
Consumption
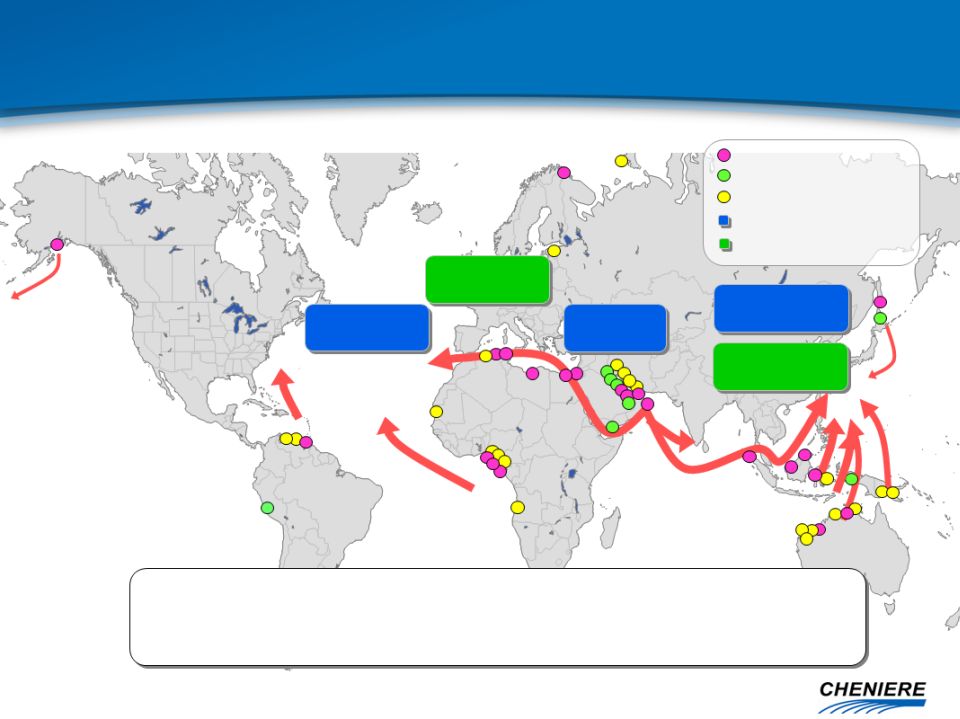
Source:
Cheniere Research
MEG LNG
to Atlantic Basin*: 6-8 Bcf/d
LNG
Available for Atlantic Price Arbitrage: 10-12 Bcf/d
3
to 4 cargoes every day
*
Assumes 85%-92% LNG plant utilization rate.
Projected
LNG Flows in 2010
Global LNG Supply of ~30 Bcf/d
Global LNG Supply of ~30 Bcf/d

22
North
America
§ Critical role of US
in global gas market
Questions:
§ Can the US absorb
the LNG?
§ Will LNG become a
part of the US energy mix?
§ What are the
implications for oil & gas linkage in the US
& globally?
& globally?
23
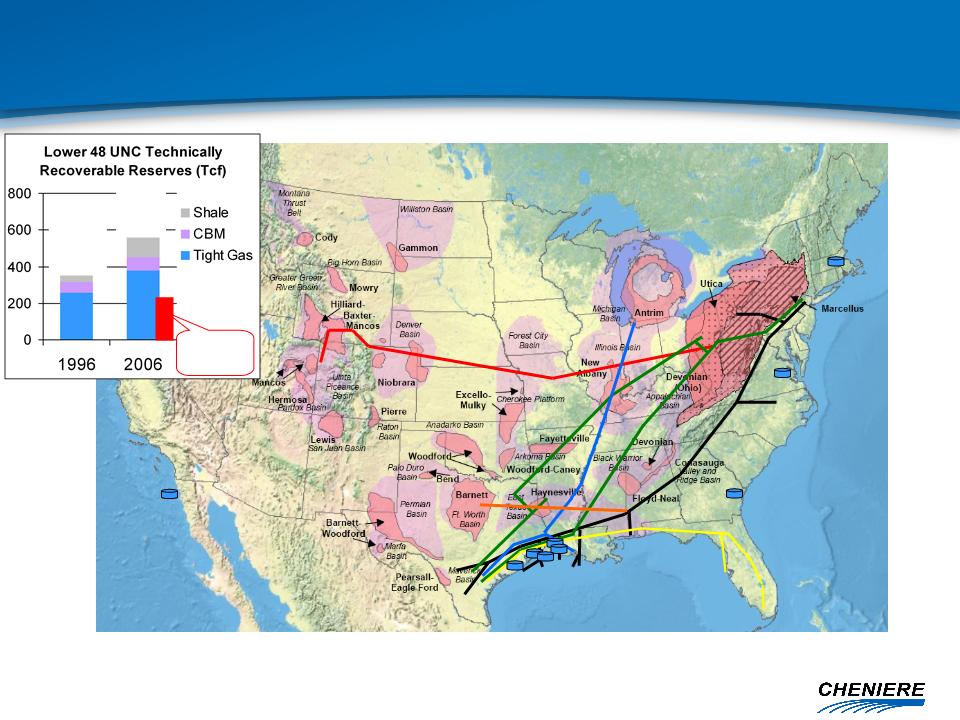
Sources:
EIA (US map graphic, pipelines and LNG terminals placed by
Cheniere).
Advanced
Resources Intl (Lower 48 Unconventional Recoverable Reserves)
Depicted
Pipelines: Rockies
Express, Texas Eastern, Trunkline, Transco, FGT, C/P/SESH/Gulf Crossing (as a
single route)
Depicted
LNG terminals: Freeport,
Golden Pass, Sabine Pass, Cameron, Trunkline, Elba Island, Cove Point,
Everett.
366
Tcf
Tcf
580
Tcf
Tcf
US
Proved
Reserves
Proved
Reserves
US
Unconventional Production
Basins Proximate to Premium Markets and Major Pipelines
Basins Proximate to Premium Markets and Major Pipelines
24
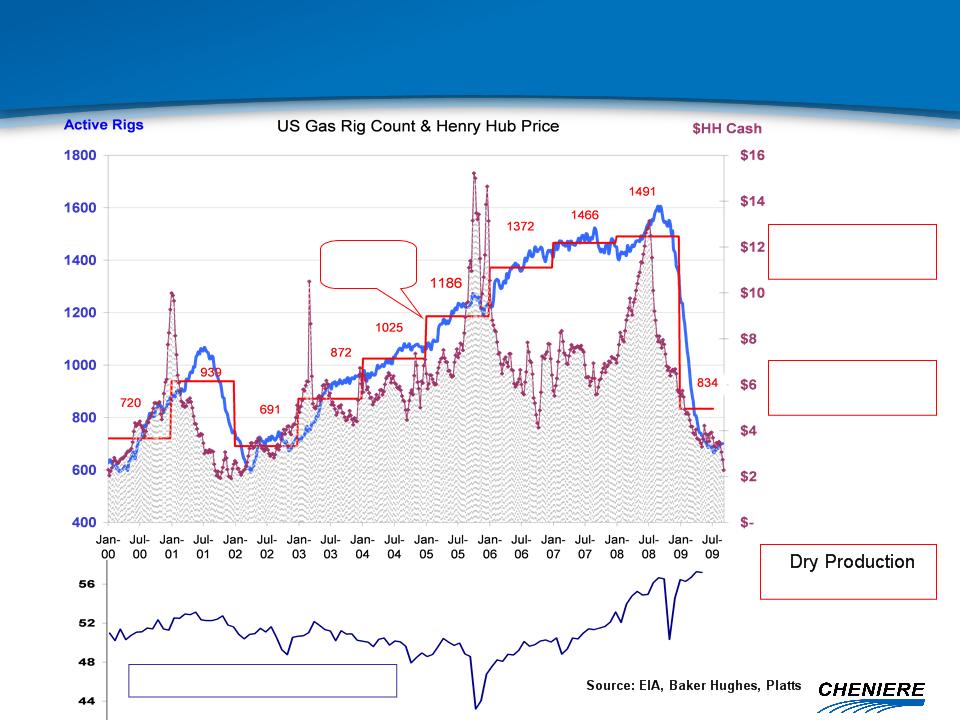
+ 2.7
Bcf/d YE ’08
Rigs
-58%
from
’08 Peak
Gas
Prices -80%
from
’08 Peak
Annual
average
average
Lower
48 Production (Bcf/d)
US
Gas Rig Count, Production & Prices
Drilling has Collapsed with Price, Oversupply
Drilling has Collapsed with Price, Oversupply
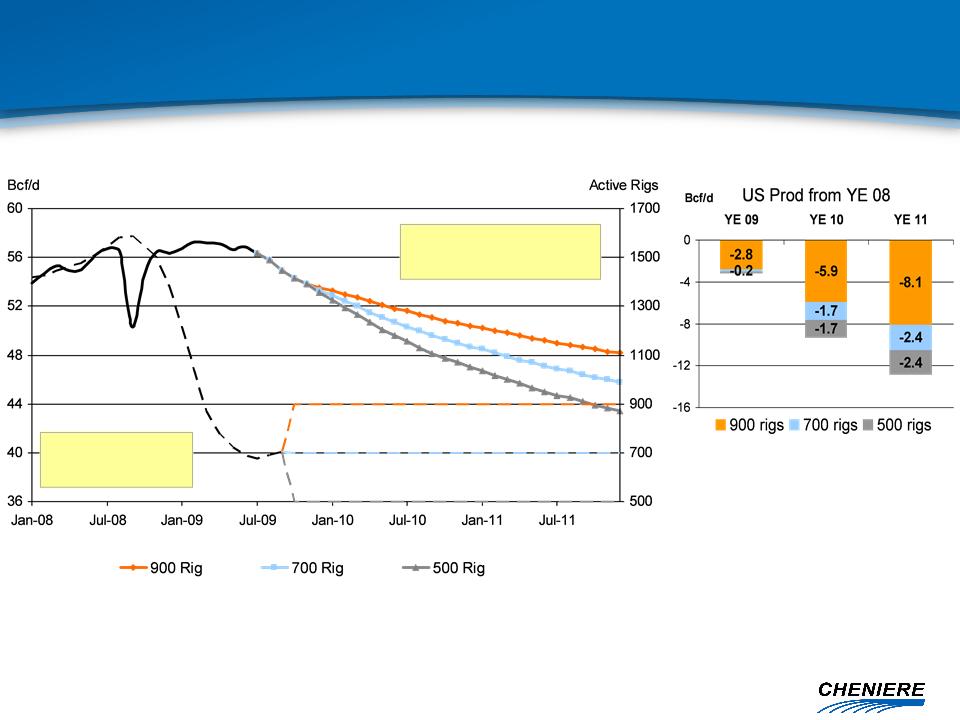
25
Lower
48 Dry Gas
Production
Production
Lower
48 Gas
Rig Count
Rig Count
Source:
Lippman Consulting, EIA, Baker Hughes, Cheniere Research
Lower
48 Wellhead Production & Gas Rig Count
Productive Capacity will Fall Sharply as Drilling is Curtailed
Productive Capacity will Fall Sharply as Drilling is Curtailed

26
Conclusions
§ North America is
about to join the global gas market
§ Unconventional
reserves and the growth of the LNG trade are
challenging the conventional business models
challenging the conventional business models
§ Questions:
– Can the oil linked
model survive?
– Which gas price
index would replace it?
– What is the gas
price required to justify additional production?
– Is it unconventional
gas in the US?
– Could it be
unconventional gas globally?
§ The answers are
unclear
§ Increased volatility
is expected until the industry learns to adapt to a
new business model
new business model

Appendix

28
Public
Unit holders
9.4% LP
Interest
Cheniere
Energy
Investments,
LLC
Sabine
Pass LNG-GP, Inc.
Sabine
Pass LNG, L.P.
Sabine
Pass LNG-LP, LLC
100%
Ownership Interest
100%
Ownership Interest
100%
Ownership Interest
100% LP
Interest
Non-Economic GP
Interest
100%
Ownership Interest
Cheniere LNG
Holdings, LLC
$205 mm
2.25% Convertible Senior Unsecured Notes due 2012
$550 mm
7.25% Senior Secured Notes due 2013
$1,666
mm 7.50% Senior Secured Notes due 2016
88.6%
LP Interest
100% of 2% GP Interest
100% of 2% GP Interest
NYSE
Amex US: LNG
NYSE
Amex US: CQP
3
$400 mm
9.75% Term Loan due 2012
$283 mm
12.0% Convertible Senior Secured Notes due 2018
Note:
Balances as indicated in September 30, 2009 10Q.
Organizational
Structure
29
(1)
(2)
(3)
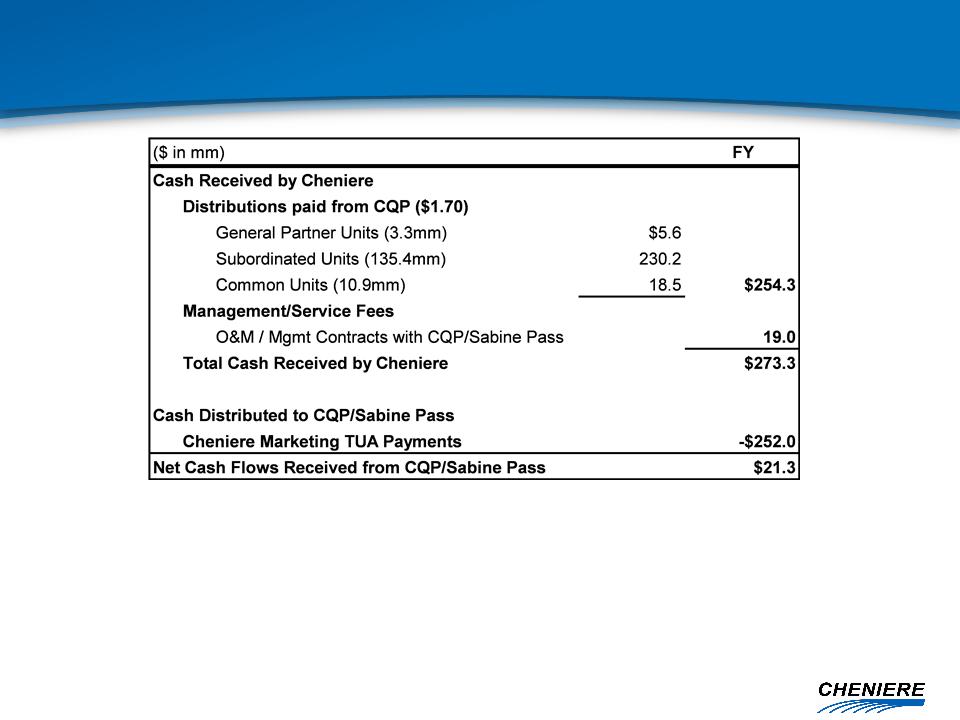
Expected
Cash Flows Between LNG and CQP/Sabine
(1)
Cheniere owns 90.6% of CQP through units held and expects to receive $1.70 per
unit in
distributions within 45 days of each quarter end
distributions within 45 days of each quarter end
(2)
Cheniere has three operations/management contracts with Sabine Pass / CQP under
which
Cheniere will receive payments monthly
Cheniere will receive payments monthly
(3)
Cheniere’s marketing segment contracted for 2.0 Bcf/d capacity at Sabine Pass
and has begun
making TUA capacity payments quarterly in advance
making TUA capacity payments quarterly in advance

30
Cheniere
Energy
Other
Cheniere
Consolidated
Unrestricted
cash
$
-
87
$
87
$
Restricted
cash and securities (2)
259
7
266
Property,
plant and equipment
1,605
633
2,238
Goodwill
and other assets
Total
assets
Deferred
revenue and other liabilities
209
$
(41)
$
168
$
Long-term
debt
2,182
847
3,029
Non-Controlling
interest
-
224
224
Equity
(Deficit)
(1) Includes intercompany
eliminations and reclassifications.
(2) Restricted cash
includes cash for construction of the Sabine Pass regas facility and debt
service reserves as required per indenture.
Cash is restricted at consolidated level.
Cash is restricted at consolidated level.
(3) For a complete
balance sheet see the
Cheniere Energy, Inc. and Cheniere Energy Partners, L.P. Form
10-Q’s for the period ended
September 30, 2009 filed with the SEC.
September 30, 2009 filed with the SEC.
September
30, 2009
(in
millions)
-
Condensed
Balance Sheet

31
Contracted
Capacity - TUAs
(1) Fees
do not vary with the actual quantity of LNG processed; tax reimbursement not
included in the fees.
(2) No
inflation adjustments.
(3)
Subject to annual inflation adjustment.
Summary
of 20-year Terminal Use Agreements
Total
LNG
Chevron
USA
Cheniere
Marketing
Capacity
1.0
Bcf/d
1.0
Bcf/d
2.0
Bcf/d
Fees
(1)
Reservation
Fee
(2)
$0.28/MMBTU
$0.28/MMBTU
$0.28/MMBTU
Opex
Fee
(3)
$0.04/MMBTU
$0.04/MMBTU
$0.04/MMBTU
2010
Full-Year Payments
$123
million
$128
million
$252
million
Term
20
years
20
years
20
years
Guarantor
Total
S.A.
Chevron
Corp.
Cheniere Energy,
Inc.
Guarantor
Credit Rating
Aa1/AA
Aa1/AA
NR/CCC+
Payment
Start Date
April
1, 2009
July 1,
2009
January
1, 2009
6
32
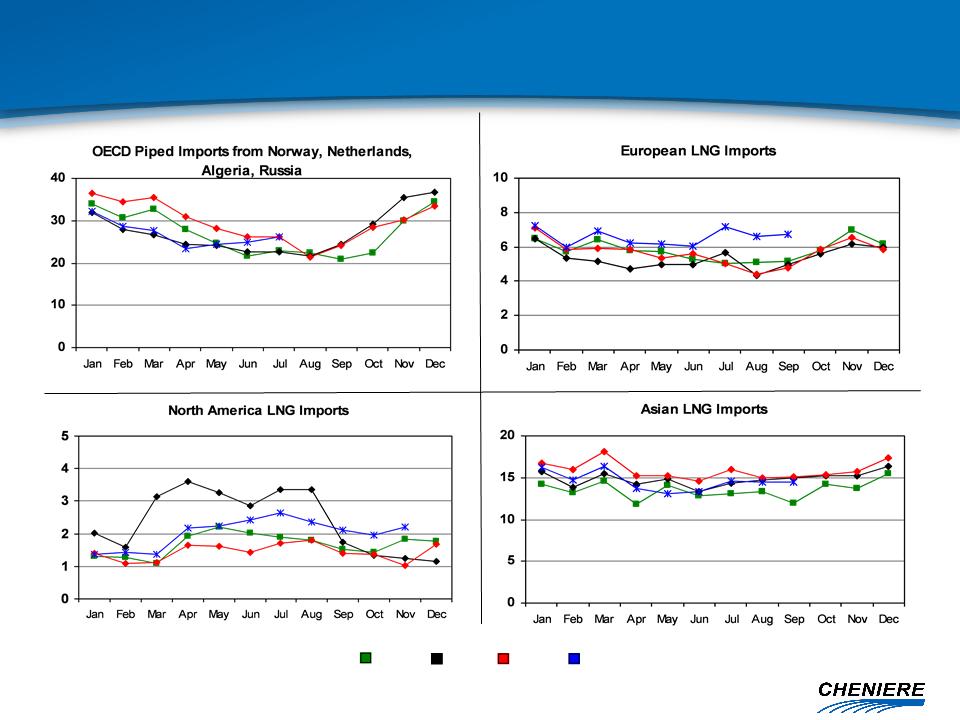
Source:
Waterborne LNG, EIA
2006
2007
2008
2009
Historical
LNG Imports by Region
(Bcf/d)
(Bcf/d)