Attached files
| file | filename |
|---|---|
| 8-K - WUHAN GENERAL GROUP (CHINA), INC | v166899_8k.htm |
November 2009
Safe Harbor Statement
The words “believes,” “could,”
“estimates,” “expects,” “intends,” “may,” “projects,” “should,” and similar expressions, or the negatives of such terms, identify forward-looking
statements.The matters discussed herein that are forward-looking statements are based on current management expectations that involve
risks and uncertainties that may result in such expectations not being realized. Forward-looking statements involve risks and uncertainties that may cause actual results, performance or financial condition to be materially different from the expectations
of future results, performance or financial condition expressed or implied in any forward-looking statements. Such risks include, but are not limited to, competition in the industrial blower and
turbine markets, , the effects of PRC environmental controls, our ability to increase
our market share,
changes to management or key personnel, risks associated with conducting business in China and other risks detailed in the Company’s filings with the Securities and Exchange Commission.
Actual outcomes and results may differ materially from what is expressed or forecasted in such forward-looking statements due to numerous potential risks and uncertainties. Forward-looking statements made during this presentation speak only as of
the date on which they are made, and we do not undertake any obligation to update any forward-looking statement to reflect events or circumstances after the date of this presentation.
Because forward-looking statements are subject to risks and uncertainties, we caution you not to place undue reliance on any forward-looking statements. All written or oral forward-looking statements by the
Company or persons acting on its behalf are qualified by these cautionary statements.
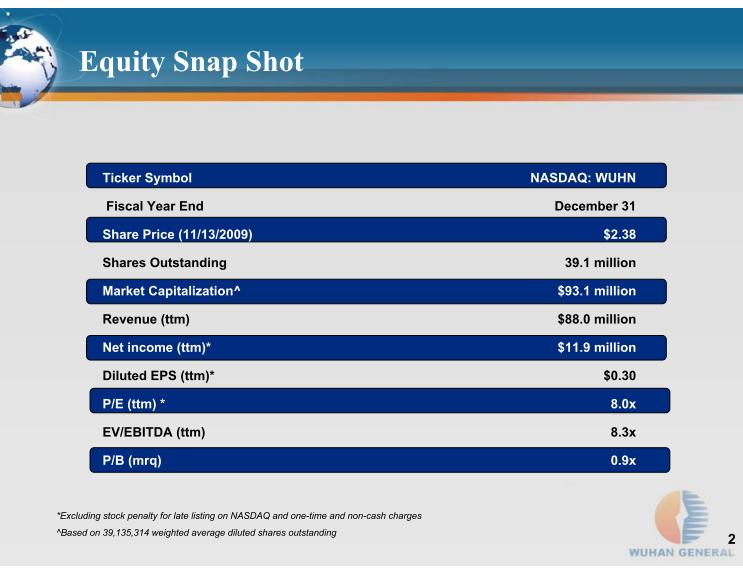
Equity Snap Shot
Ticker Symbol
Fiscal Year End
Share Price (11/13/2009)
Shares Outstanding
Market Capitalization^
Revenue (ttm)
Net income (ttm)*
Diluted EPS (ttm)*
P/E (ttm) *
EV/EBITDA (ttm)
P/B (mrq)
NASDAQ: WUHN
December 31
$2.38
39.1 million
$93.1 million
$88.0 million
$11.9 million
$0.30
8.0x
8.3x
0.9x
*Excluding stock penalty for late listing on NASDAQ and one-time and non-cash charges
^Based on 39,135,314 weighted average diluted shares outstanding
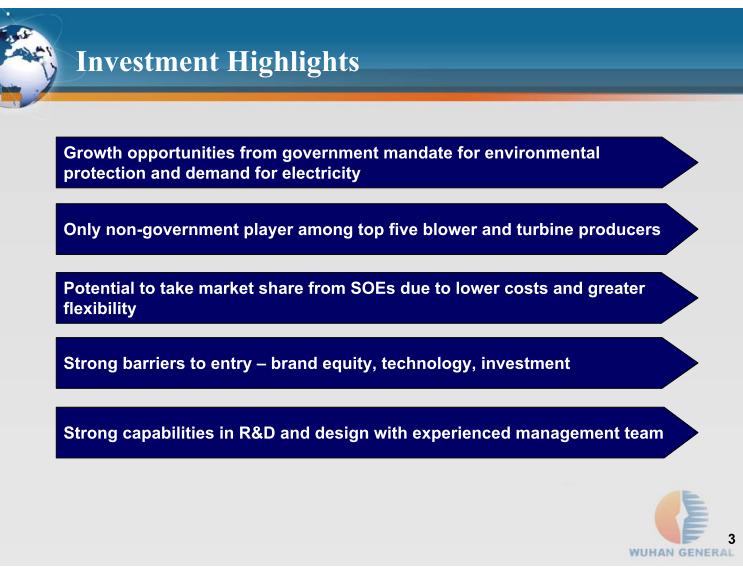
Investment Highlights
Growth opportunities from government mandate for environmental
protection and demand for electricity
Only non-government player among top five blower and turbine producers
Strong capabilities in R&D and design with experienced management team
Potential to take market share from SOEs due to lower costs and greater
flexibility
Strong barriers to entry – brand equity, technology, investment
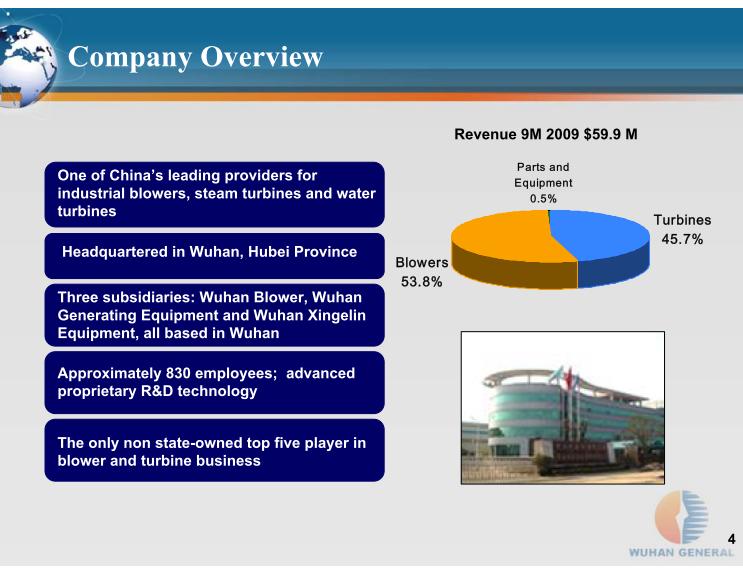
Company Overview
One of China’s leading providers for industrial blowers, steam turbines and water turbines
Headquartered in Wuhan, Hubei Province
Three subsidiaries: Wuhan Blower, Wuhan Generating Equipment and Wuhan Xingelin Equipment, all based in Wuhan
Approximately 830 employees; advanced proprietary R&D technology
The only non state-owned top five player in blower and turbine business
Revenue 9M 2009 $59.9 M
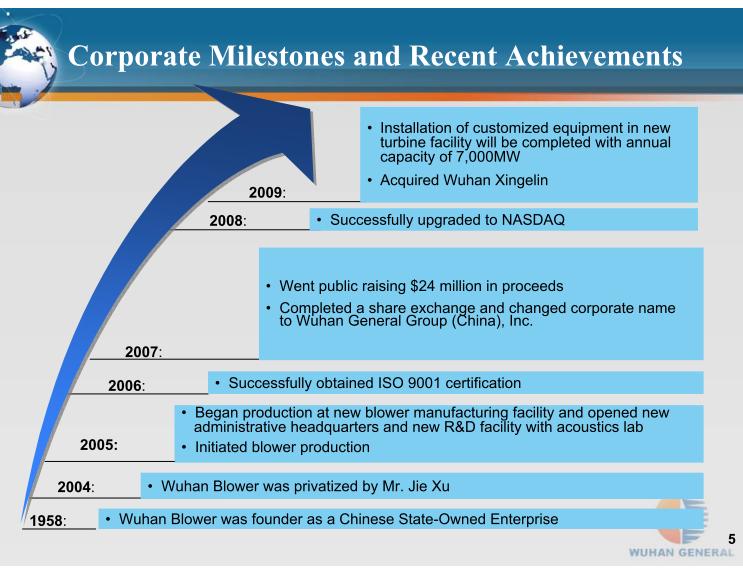
Corporate Milestones and Recent Achievements
Wuhan Blower was founder as a Chinese State-Owned Enterprise
Wuhan Blower was privatized by Mr. Jie Xu
Began production at new blower manufacturing facility and opened new
administrative headquarters and new R&D facility with acoustics lab
Initiated blower production
Went public raising $24 million in proceeds
Completed a share exchange and changed corporate name to Wuhan General Group (China), Inc.
Successfully upgraded to NASDAQ
Installation of customized equipment in new turbine facility will be completed with annual capacity of 7,000MW
Acquired Wuhan Xingelin
Successfully obtained ISO 9001 certification
:
2005:
:
:
:
:
:
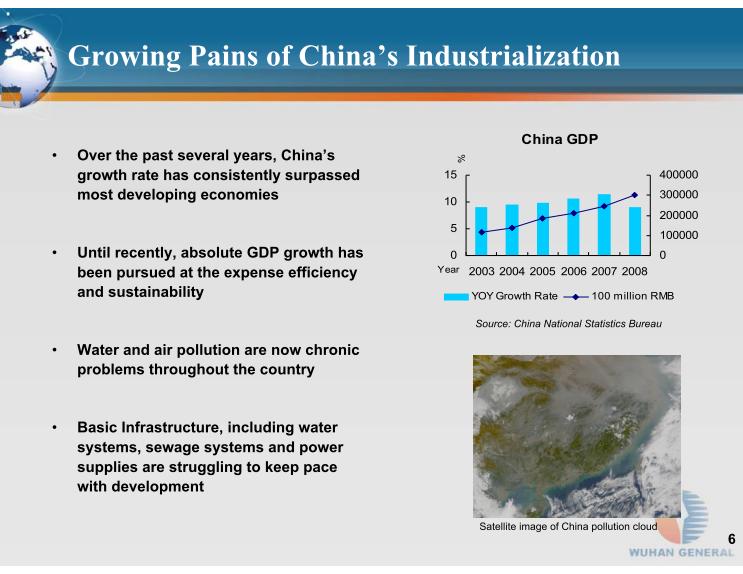
Growing Pains of China’s Industrialization
Over the past several years, China’s growth rate has consistently surpassed most developing economies
Until recently, absolute GDP growth has been pursued at the expense efficiency and sustainability
Water and air pollution are now chronic problems throughout the country
Basic Infrastructure, including water systems, sewage systems and power supplies are struggling to keep pace with development
Satellite image of China pollution cloud
Source: China National Statistics Bureau
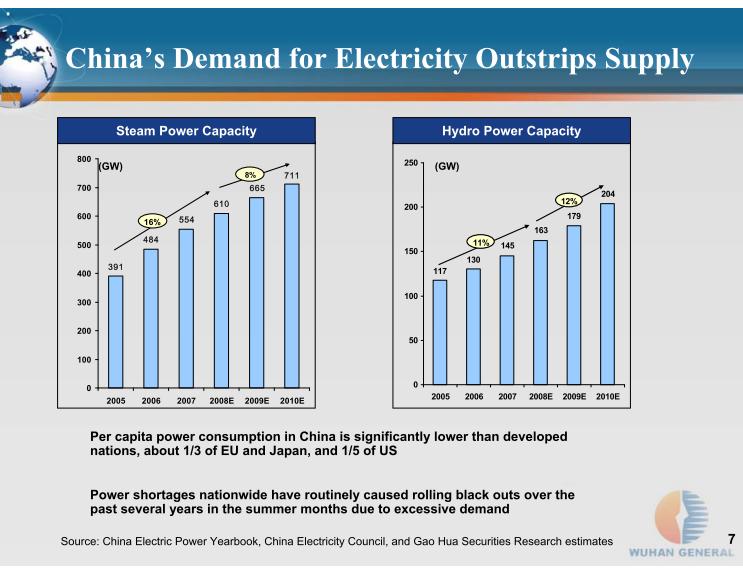
China’s Demand for Electricity Outstrips Supply
Steam Power Capacity
Hydro Power Capacity
Per capita power consumption in China is significantly lower than developed nations, about 1/3 of EU and Japan, and 1/5 of US
Power shortages nationwide have routinely caused rolling black outs over the past several years in the summer months due to excessive demand
(GW)
(GW)
Source: China Electric Power Yearbook, China Electricity Council, and Gao Hua Securities Research estimates
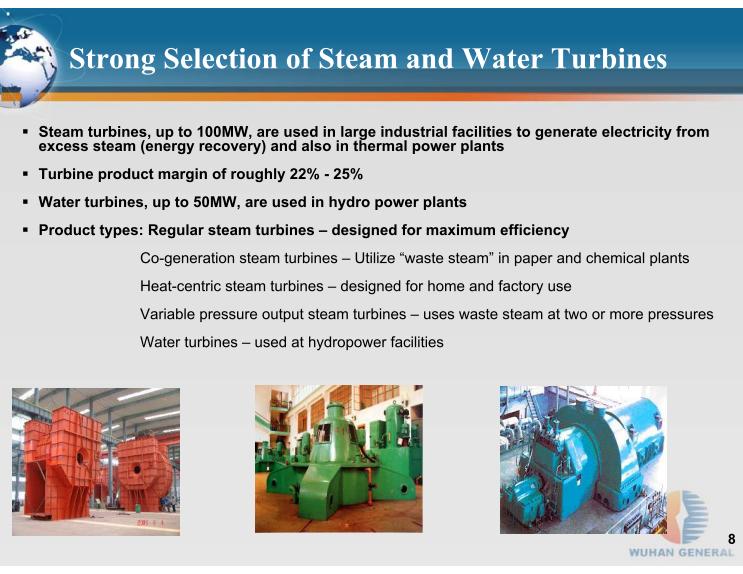
Strong Selection of Steam and Water Turbines
Steam turbines, up to 100MW, are used in large industrial facilities to generate electricity from excess steam (energy recovery) and also in thermal power plants
Turbine product margin of roughly 22% - 25%
Water turbines, up to 50MW, are used in hydro power plants
Product types: Regular steam turbines – designed for maximum efficiency
Co-generation steam turbines – Utilize “waste
steam” in paper and chemical plants
Heat-centric steam turbines – designed for
home and factory use
Variable pressure output steam turbines –
uses waste steam at two or more pressures
Water turbines – used at hydropower facilities
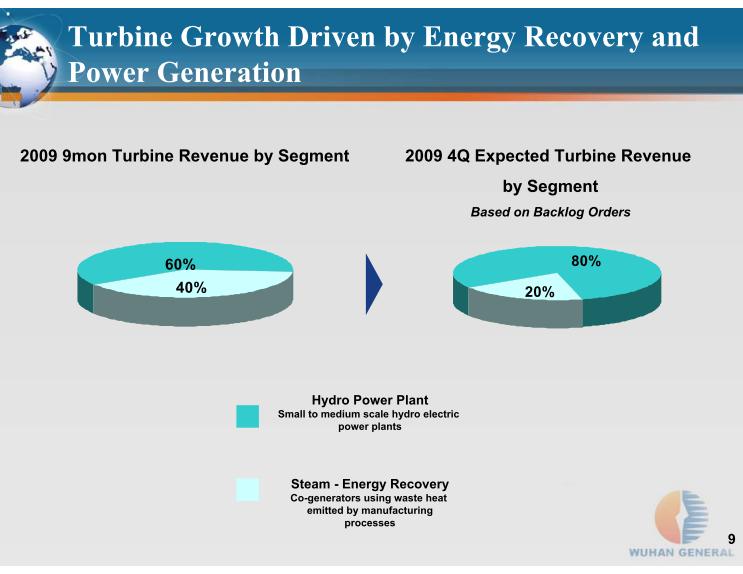
Turbine Growth Driven by Energy Recovery and Power Generation
2009 9mon Turbine Revenue by Segment
Hydro Power Plant
Small to medium scale hydro electric
power plants
Steam - Energy Recovery
Co-generators using waste heat
emitted by manufacturing
processes
2009 4Q Expected Turbine Revenue
by Segment
Based on Backlog Orders
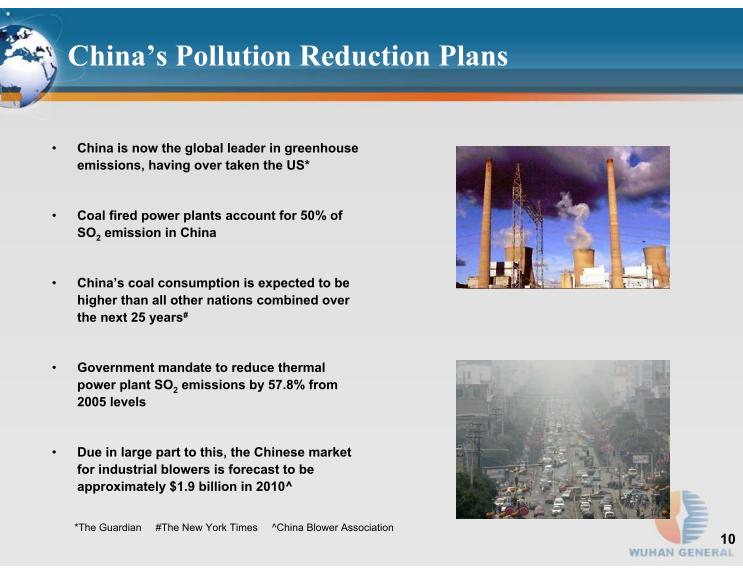
China’s Pollution Reduction Plans
China is now the global leader in greenhouse emissions, having over taken the US*
emission in China
#
emissions by 57.8%
from 2005 levels
Due in large part to this, the Chinese market for industrial blowers is forecast to be approximately $1.9 billion in 2010^
*The Guardian #The New York Times ^China Blower Association
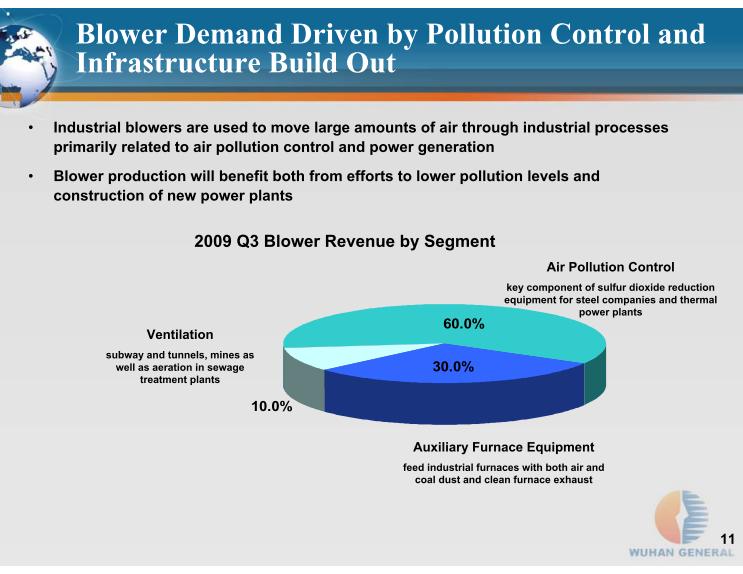
Blower Demand Driven by Pollution Control and Infrastructure Build Out
2009 Q3 Blower Revenue by Segment
Air Pollution Control
key component of sulfur dioxide reduction equipment for steel companies and thermal power plants
Auxiliary Furnace Equipment
feed industrial furnaces with both air and coal dust and clean furnace exhaust
Ventilation
subway and tunnels, mines as well as aeration in sewage treatment plants
Industrial blowers are used to move large amounts of air through industrial processes primarily related to air pollution control and power generation
Blower production will benefit both from efforts to lower pollution levels and construction of new power plants
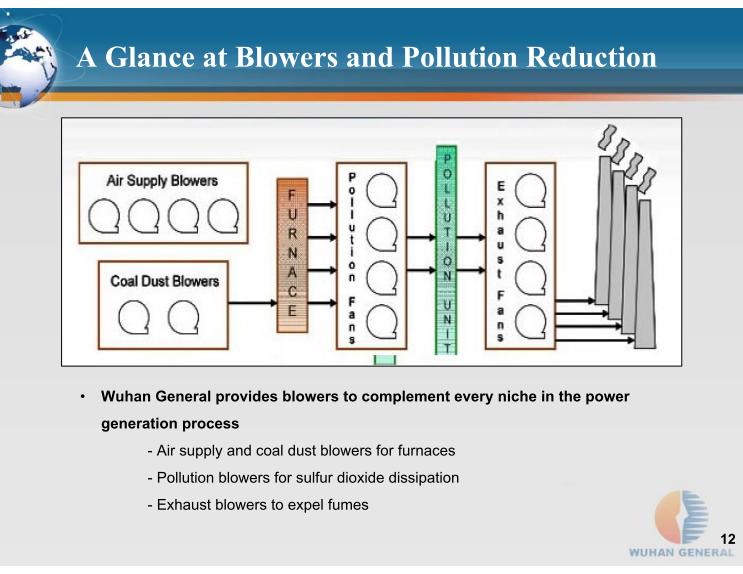
A Glance at Blowers and Pollution Reduction
Wuhan General provides blowers to complement every niche in the power
generation process
- Air supply and coal dust blowers for furnaces
- Pollution blowers for sulfur dioxide dissipation
- Exhaust blowers to expel fumes
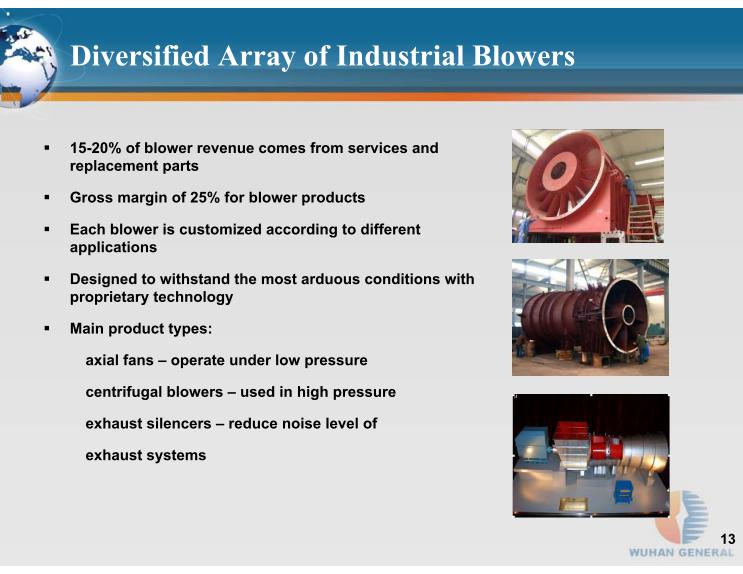
Diversified Array of Industrial Blowers
15-20% of blower revenue comes from services and replacement parts
Gross margin of 25% for blower products
Each blower is customized according to different applications
Designed to withstand the most arduous conditions with proprietary technology
Main product types:
axial fans – operate under low pressure
centrifugal blowers – used in high pressure
exhaust silencers – reduce noise level of
exhaust systems
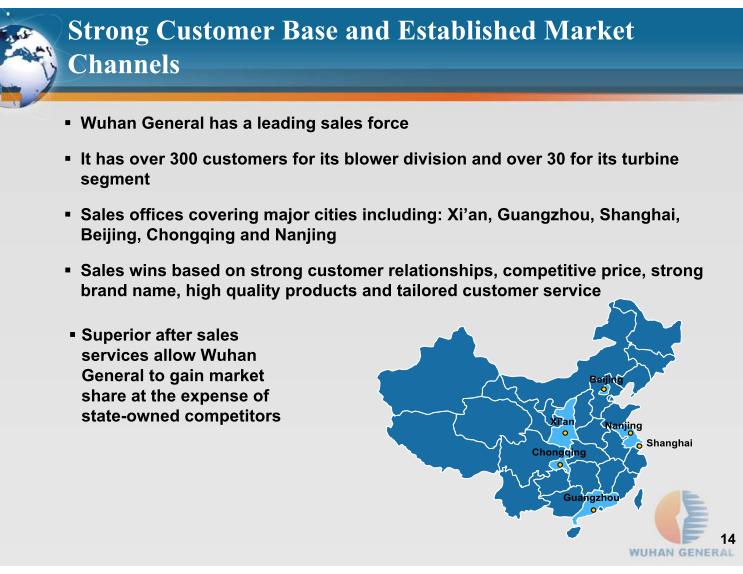
Strong Customer Base and Established Market Channels
Wuhan General has a leading sales force
It has over 300 customers for its blower division and over 30 for its turbine segment
Sales offices covering major cities including: Xi’an, Guangzhou, Shanghai, Beijing, Chongqing and Nanjing
Sales wins based on strong customer relationships, competitive price, strong brand name, high quality products and tailored customer service
Superior after sales services allow Wuhan General to gain market share at the expense of state-owned competitors
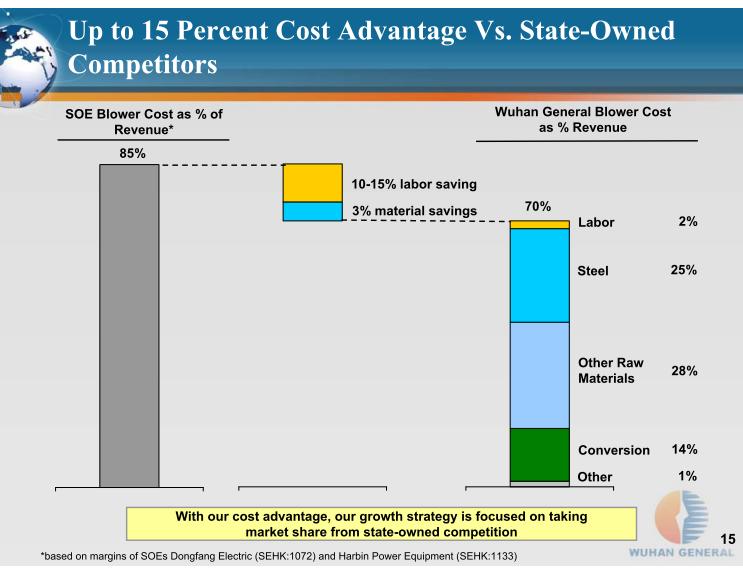
Labor
2%
Steel
25%
Other Raw Materials
28%
Conversion
14%
Other
1%
SOE Blower Cost as % of Revenue*
10-15% labor saving
3% material savings
Wuhan General Blower Cost as % Revenue
85%
70%
With our cost advantage, our growth strategy is focused on taking market share from state-owned competition
Up to 15 Percent Cost Advantage Vs. State-Owned Competitors
*based on margins of SOEs Dongfang Electric (SEHK:1072) and Harbin Power Equipment (SEHK:1133)
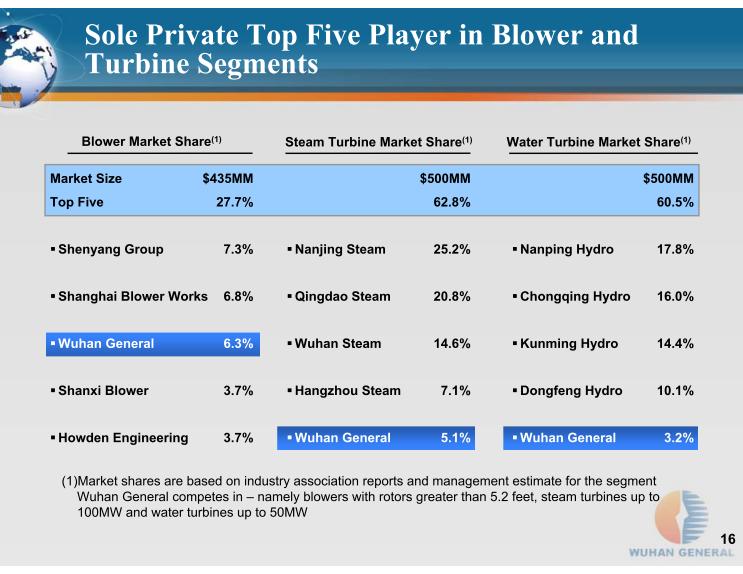
Sole Private Top Five Player in Blower and Turbine Segments
Market Size
Top Five
Shenyang Group
Shanghai Blower Works
Wuhan General
Shanxi Blower
Howden Engineering
$435MM
27.7%
7.3%
6.8%
6.3%
3.7%
3.7%
(1)
(1)
(1)
Nanjing Steam
Qingdao Steam
Wuhan Steam
Hangzhou Steam
Wuhan General
$500MM
62.8%
25.2%
20.8%
14.6%
7.1%
5.1%
Nanping Hydro
Chongqing Hydro
Kunming Hydro
Dongfeng Hydro
Wuhan General
$500MM
60.5%
17.8%
16.0%
14.4%
10.1%
3.2%
(1)
Market shares are based on industry association reports and management estimate for the segment Wuhan General competes in – namely blowers with rotors greater than 5.2 feet, steam turbines up to 100MW
and water turbines up to 50MW
Commitment to Quality and R&D, Tailored Solutions
50 senior professionals, of which 10 enjoy special government subsidies
Licensed technology from Mitsubishi
One of the few Chinese companies capable of making variable angled blades
Established one of the three major national testing centers for industrial blowers
Recipient of national gold awards for turbine products
Solid relationships with the Science and Technology University of Central China, Jiaotong University and the Acoustic Institute of the China Science Academy
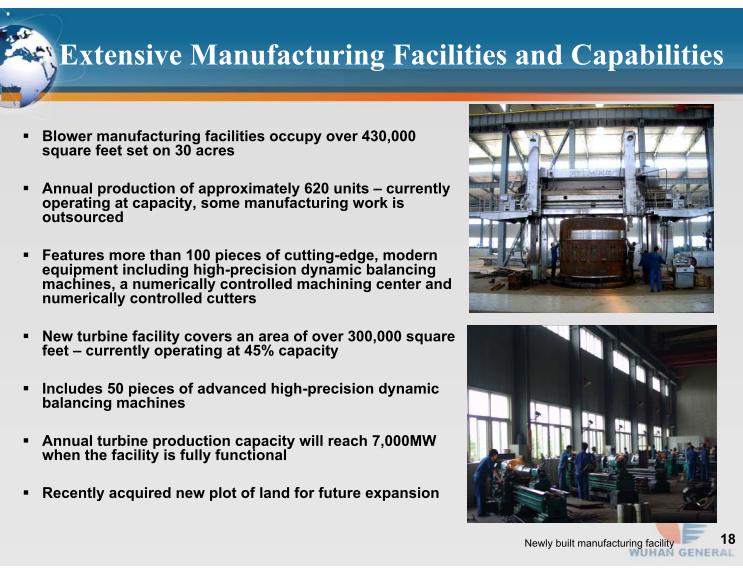
Extensive Manufacturing Facilities and Capabilities
Blower manufacturing facilities occupy over 430,000 square feet set on 30 acres
Annual production of approximately 620 units – currently operating at capacity, some manufacturing work is outsourced
Features more than 100 pieces of cutting-edge, modern equipment including high-precision dynamic balancing machines, a numerically controlled machining center and numerically controlled cutters
New turbine facility covers an area of over 300,000 square feet – currently operating at 45% capacity
Includes 50 pieces of advanced high-precision dynamic balancing machines
Annual turbine production capacity will reach 7,000MW when the facility is fully functional
Recently acquired new plot of land for future expansion
Newly built manufacturing facility
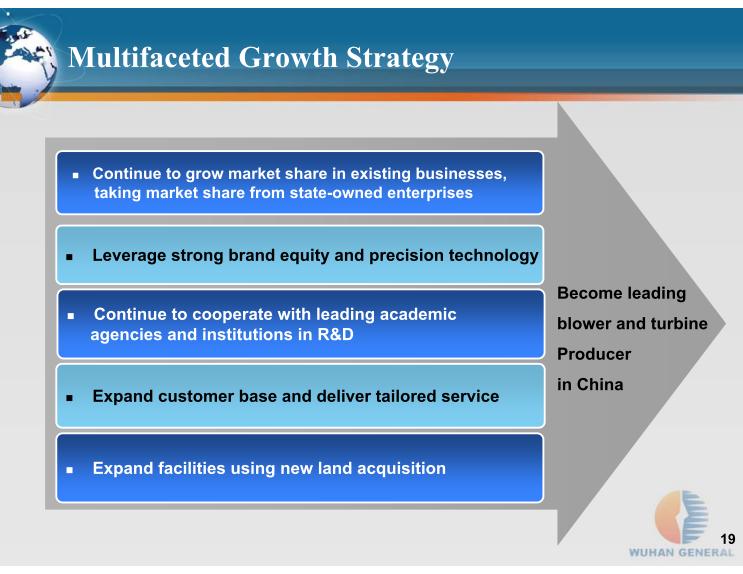
Multifaceted Growth Strategy
Continue to grow market share in existing businesses,
taking market share from state-owned enterprises
Leverage strong brand equity and precision technology
Continue to cooperate with leading academic
agencies and institutions in R&D
Expand customer base and deliver tailored service
Become leading
blower and turbine
Producer
in China
Expand facilities using new land acquisition
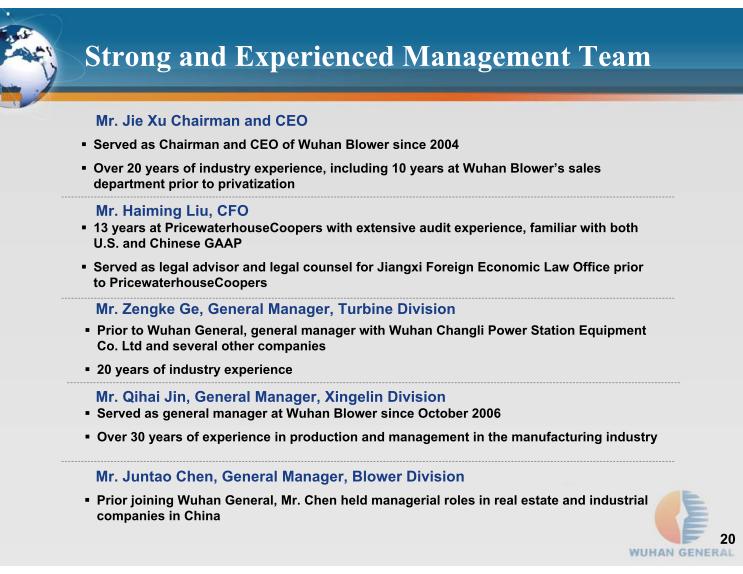
Strong and Experienced Management Team
Mr. Jie Xu Chairman and CEO
Served as Chairman and CEO of Wuhan Blower since 2004
Over 20 years of industry experience, including 10 years at Wuhan Blower’s sales department prior to privatization
Mr. Haiming Liu, CFO
13 years at PricewaterhouseCoopers with extensive audit experience, familiar with both U.S. and Chinese GAAP
Served as legal advisor and legal counsel for Jiangxi Foreign Economic Law Office prior to PricewaterhouseCoopers
Mr. Juntao Chen, General Manager, Blower Division
Mr. Zengke Ge, General Manager, Turbine Division
Prior joining Wuhan General, Mr. Chen held managerial roles in real estate and industrial companies in China
Prior to Wuhan General, general manager with Wuhan Changli Power Station Equipment Co. Ltd and several other companies
20 years of industry experience
Served as general manager at Wuhan Blower since October 2006
Over 30 years of experience in production and management in the manufacturing industry
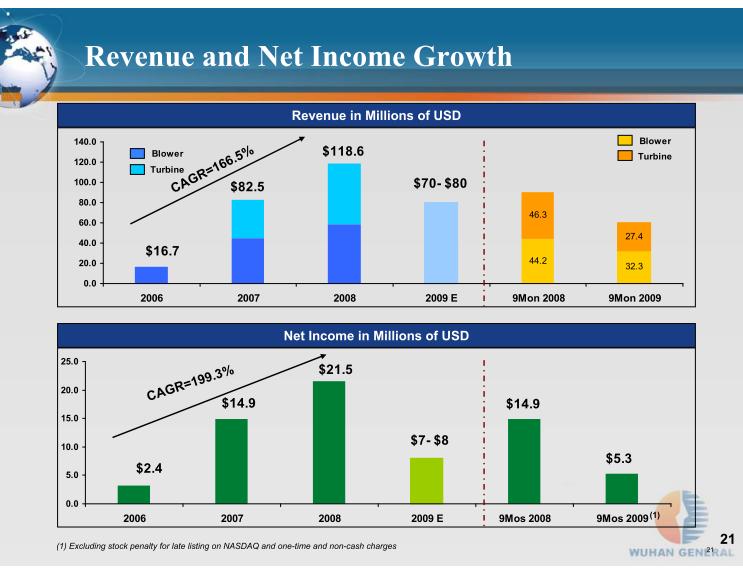
Revenue and Net Income Growth
21
Revenue in Millions of USD
Net Income in Millions of USD
(1)
(1) Excluding stock penalty for late listing on NASDAQ and one-time and non-cash charges
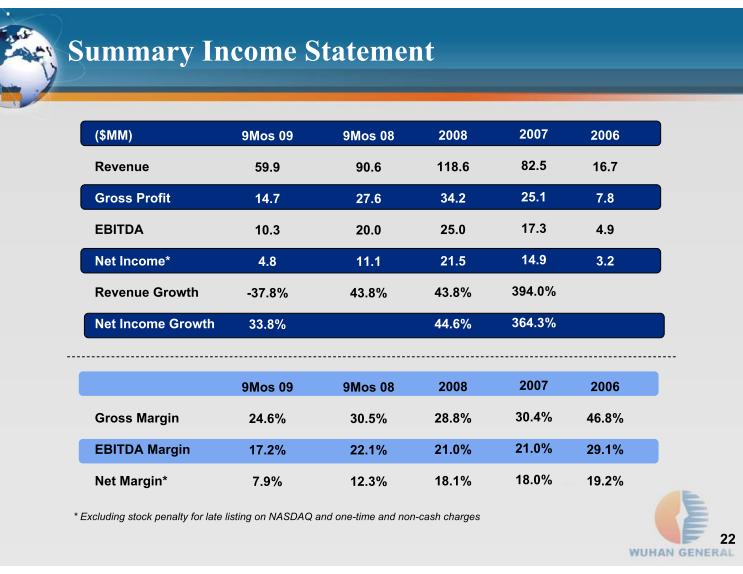
Summary Income Statement
($MM)
Revenue
Gross Profit
EBITDA
Net Income*
Revenue Growth
Net Income Growth
Gross Margin
EBITDA Margin
Net Margin*
2006
16.7
7.8
4.9
3.2
2006
46.8%
29.1%
19.2%
2007
82.5
25.1
17.3
14.9
394.0%
364.3%
2007
30.4%
21.0%
18.0%
2008
118.6
34.2
25.0
21.5
43.8%
44.6%
2008
28.8%
21.0%
18.1%
9Mos 09
59.9
14.7
10.3
4.8
-37.8%
33.8%
9Mos 09
24.6%
17.2%
7.9%
9Mos 08
90.6
27.6
20.0
11.1
43.8%
9Mos 08
30.5%
22.1%
12.3%
* Excluding stock penalty for late listing on NASDAQ and one-time and non-cash charges
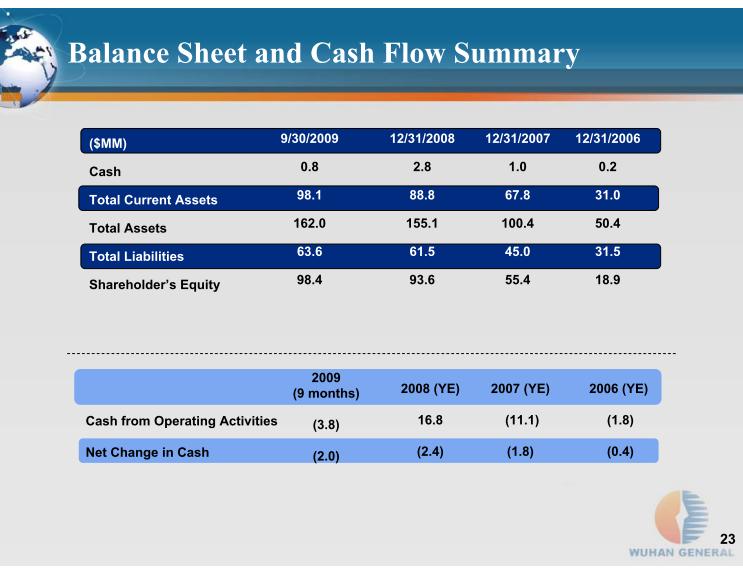
Balance Sheet and Cash Flow Summary
($MM)
Cash
Total Current Assets
Total Assets
Total Liabilities
Shareholder’s Equity
12/31/2006
0.2
31.0
50.4
31.5
18.9
12/31/2007
1.0
67.8
100.4
45.0
55.4
12/31/2008
2.8
88.8
155.1
61.5
93.6
Cash from Operating Activities
Net Change in Cash
2006 (YE)
(1.8)
(0.4)
2007 (YE)
(11.1)
(1.8)
2008 (YE)
16.8
(2.4)
9/30/2009
0.8
98.1
162.0
63.6
98.4
2009 (9 months)
(3.8)
(2.0)
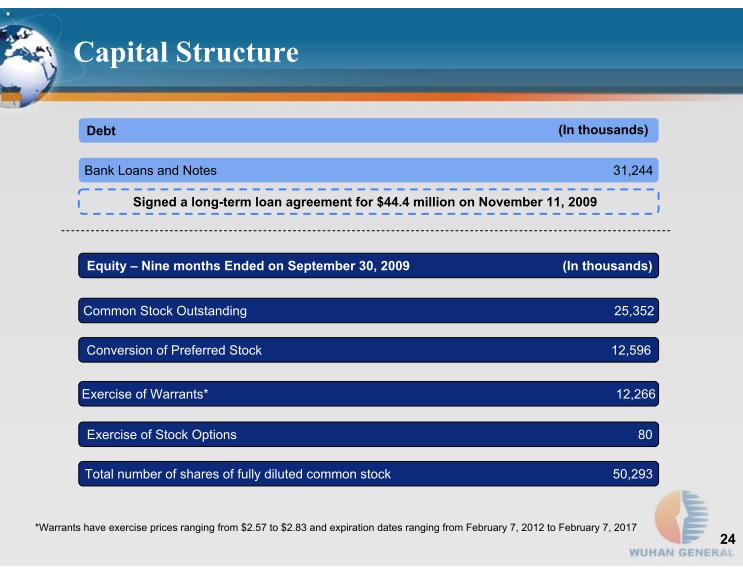
Capital Structure
Bank Loans and Notes
31,244
Equity – Nine months Ended on September 30, 2009 (In
thousands)
Debt
(In thousands)
Common Stock Outstanding 25,352
Conversion of Preferred Stock 12,596
Exercise of Warrants*
12,266
80
*Warrants have exercise prices ranging from $2.57 to $2.83 and expiration dates ranging from February 7, 2012 to February 7, 2017
Total number of shares of fully diluted common stock
50,293
Signed a long-term loan agreement for $44.4 million on November 11, 2009

Attractive Valuation
3.4
1.03
20.7
Average (excluding WUHN)
1.21
0.33
24.8
$0.15
$42.5 M
$3.76
CECE
Cece Environmental Corp.
0.57
0.15
3.22
$2.02
$44.3M
$6.51
MFRI
MFRI Inc.
3.2
3.5
NA
($0.13)
$246.9M
$10.20
FTEK
Fuel Tech Inc.
1.38
0.58
NA
($0.32)
$126.7M
$4.86
FLDR
Flanders Corp
12.86
1.34
42
HK$1.04
HK$37.88B
HK$42.95
HK:1072
Dongfang Electric Corp, Ltd.**
1.08
0.3
12.9
HK$0.53
HK$7.39B
HK$7.39
HK:1133
Harbin Power Equipment Co.** Ltd.
0.9
1.1
8.0*
$0.30*
$93.1M
$2.38
WUHN
Wuhan General Group (China) Inc.
P/B
(mrq)
P/S
(ttm)
P/E
(ttm)
EPS
(ttm)
Market Cap
Price
(11/13/09)
Ticker
*Net income (ttm) excluding non-cash penalties of $5,355,233 (FY 2008) and $1,153,439 (2Q 2009)
** For the period ended June 30, 2009
Summary
Growth opportunities from government mandate for environmental
protection and demand for electricity
Only non-government player among top five blower and turbine producers
Strong capabilities in R&D and design with experienced management team
Potential to take market share from SOEs due to lower costs and greater
flexibility
Strong barriers to entry – brand equity, technology, investment
Thank You
Company Contact:
Mr. Haiming Liu, CFO
Wuhan General Group (China), Inc.
27-5970-0069
Auditor:
Samuel H. Wong & Co. LLP
400 Oyster Point Blvd. ste. 122
South San Francisco
CA 94080
Investor Relations:
Mr. Crocker Coulson, President
CCG Investor Relations Inc.
Phone: +1 646-213-1915 (New York)
www.ccgirasia.com
Legal Counsel:
Paul Davis Fancher
Troutman Sanders LLP
600 Peachtree Street, N.E.
Suite 5200
Atlanta, Georgia 30308-2216
Telephone: (404) 885-3310
E-mail: paul.fancher@troutmansanders.com
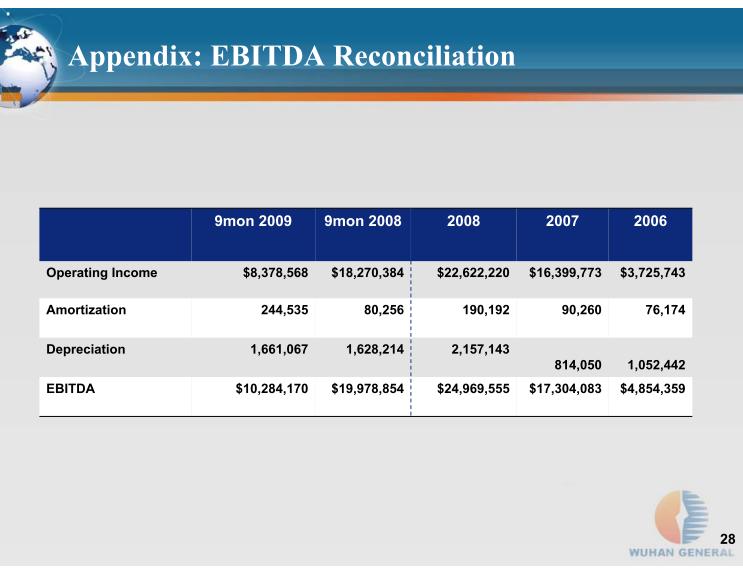
Appendix: EBITDA Reconciliation
$19,978,854
1,628,214
80,256
$18,270,384
9mon 2008
$4,854,359
$17,304,083
$24,969,555
$10,284,170
EBITDA
1,052,442
814,050
2,157,143
1,661,067
Depreciation
76,174
90,260
190,192
244,535
Amortization
$3,725,743
$16,399,773
$22,622,220
$8,378,568
Operating Income
2006
2007
2008
9mon 2009
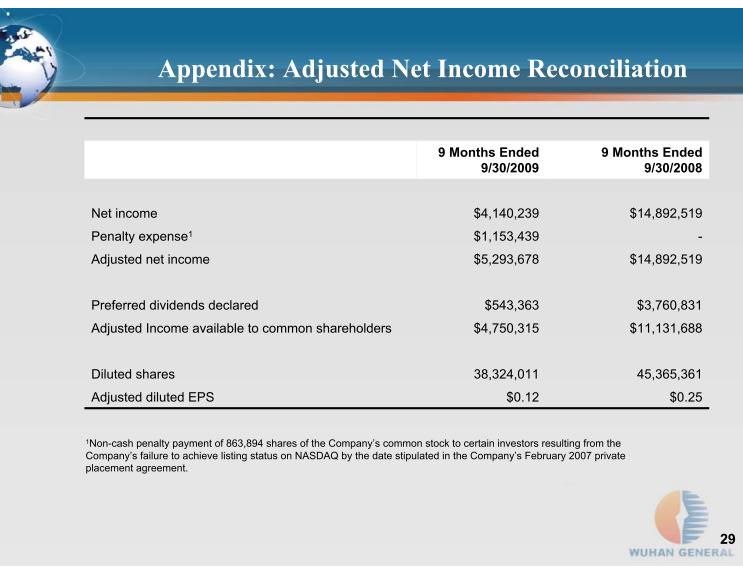
Appendix: Adjusted Net Income Reconciliation
$0.12
38,324,011
$4,750,315
$543,363
$5,293,678
$1,153,439
$4,140,239
9 Months Ended 9/30/2009
$0.25
Adjusted diluted EPS
45,365,361
Diluted shares
$11,131,688
Adjusted Income available to common shareholders
$3,760,831
Preferred dividends declared
$14,892,519
Adjusted net income
-
$14,892,519
Net income
9 Months Ended 9/30/2008
Non-cash penalty payment of 863,894 shares of the Company’s common stock to certain investors resulting from the Company’s failure
to achieve listing status on NASDAQ by the date stipulated in the Company’s February 2007 private placement agreement.