Attached files
UNITED
STATES
SECURITIES
AND EXCHANGE COMMISSION
Washington,
D.C. 20549
FORM
10-Q
[Mark
One]
|
x
|
QUARTERLY
REPORT PURSUANT TO SECTION 13 OR 15(d) OF THE
|
|
SECURITIES
EXCHANGE ACT OF 1934
|
For
the quarterly period ended September 30, 2009
OR
|
o
|
TRANSITION
REPORT PURSUANT TO SECTION 13 OR 15(d) OF THE
|
|
SECURITIES
EXCHANGE ACT OF 1934
|
For
the transition period from ____________ to ____________
Commission
File Number: 000-53159
United
Development Funding III, L.P.
(Exact
Name of Registrant as Specified in Its Charter)
|
Delaware
|
20-3269195
|
|
|
(State
or other jurisdiction of incorporation or organization)
|
(I.R.S.
Employer Identification No.)
|
1301
Municipal Way, Suite 100, Grapevine, Texas 76051
(Address
of principal executive offices)
(Zip
Code)
Registrant’s
telephone number, including area code: (214) 370-8960
N/A
(Former
name, former address and former fiscal year, if changed since last
report)
Indicate by check mark whether the
Registrant: (1) has filed all reports required to be filed by Section
13 or 15(d) of the Securities Exchange Act of 1934 during the preceding 12
months (or for such shorter period that the Registrant was required to file such
reports) and (2) has been subject to such filing requirements for the past 90
days. Yes x No o
Indicate
by check mark whether the registrant has submitted electronically and posted on
its corporate Web site, if any, every Interactive Data File required to be
submitted and posted pursuant to Rule 405 of Regulation S-T (§232.405 of this
chapter) during the preceding 12 months (or for such shorter period that the
registrant was required to submit and post such files). Yes o No o
Indicate
by check mark whether the Registrant is a large accelerated filer, an
accelerated filer, a non-accelerated filer, or a smaller reporting
company. See the definitions of “large accelerated filer,”
“accelerated filer” and “smaller reporting company” in Rule 12b-2 of the
Exchange Act.
Large
accelerated filer o Accelerated
filer o
Non-accelerated
filer x (Do not
check if a smaller reporting
company) Smaller
reporting company o
Indicate
by check mark whether the Registrant is a shell company (as defined in Rule
12b-2 of the Exchange Act).
Yes o No
x
UNITED
DEVELOPMENT FUNDING III, L.P.
FORM
10-Q
Quarter
Ended September 30, 2009
PART
I
FINANCIAL
INFORMATION
|
Item
1.
|
Financial
Statements.
|
|
|
Balance
Sheets as of September 30, 2009 (Unaudited) and December 31, 2008
(Audited)
|
3
|
|
|
Statements
of Operations for the three and nine months ended September 30, 2009 and
2008 (Unaudited)
|
4
|
|
|
Statements
of Cash Flows for the nine months ended September 30, 2009 and 2008
(Unaudited)
|
5
|
|
|
Notes
to Financial Statements (Unaudited)
|
6
|
|
|
Item
2.
|
Management’s
Discussion and Analysis of Financial Condition and Results of
Operations.
|
16
|
|
Item
3.
|
Quantitative
and Qualitative Disclosures About Market Risk.
|
27
|
|
Item
4T.
|
Controls
and Procedures.
|
28
|
PART
II
OTHER
INFORMATION
|
Item
1.
|
Legal
Proceedings.
|
29
|
|
Item
1A.
|
Risk
Factors.
|
29
|
|
Item
2.
|
Unregistered
Sales of Equity Securities and Use of Proceeds.
|
29
|
|
Item
3.
|
Defaults
Upon Senior Securities.
|
30
|
|
Item
4.
|
Submission
of Matters to a Vote of Security Holders.
|
30
|
|
Item
5.
|
Other
Information.
|
30
|
|
Item
6.
|
Exhibits.
|
30
|
|
Signatures.
|
31
|
|
2
PART
I
FINANCIAL
INFORMATION
UNITED DEVELOPMENT FUNDING III,
L.P.
|
September
30, 2009 (Unaudited)
|
December
31, 2008 (Audited)
|
|||||||
|
Assets:
|
||||||||
|
Cash
and cash equivalents
|
$ | 15,251,354 | $ | 15,505,910 | ||||
|
Restricted
cash
|
2,211,734 | 1,205,190 | ||||||
|
Accrued
interest receivable
|
9,677,637 | 2,301,525 | ||||||
|
Accrued
interest receivable – related party
|
85,218 | 683,529 | ||||||
|
Mortgage
notes receivable, net
|
190,206,367 | 169,825,653 | ||||||
|
Mortgage
notes receivable – related party, net
|
56,478,217 | 43,311,599 | ||||||
|
Participation
interest – related party
|
52,541,411 | 39,259,006 | ||||||
|
Deferred
offering costs
|
- | 612,292 | ||||||
|
Other
assets
|
496,265 | 16,708 | ||||||
|
Total
assets
|
$ | 326,948,203 | $ | 272,721,412 | ||||
|
Liabilities
and Partners’ Capital
|
||||||||
|
Liabilities:
|
||||||||
|
Accounts
payable
|
$ | 32,877 | $ | - | ||||
|
Accrued
liabilities
|
130,989 | 416,961 | ||||||
|
Accrued
liabilities – related party
|
3,265,403 | 3,346,306 | ||||||
|
Escrow
payable
|
- | 517,190 | ||||||
|
Line-of-credit
|
15,000,000 | - | ||||||
|
Total
liabilities
|
18,429,269 | 4,280,457 | ||||||
|
Commitments
and contingencies
|
||||||||
|
Partners’
Capital:
|
||||||||
|
Limited
partners’ capital: 17,500,000 units authorized; 17,095,630
units issued and outstanding at September 30, 2009 and 15,019,292 units
issued and outstanding at December 31, 2008
|
308,182,009 | 268,179,990 | ||||||
|
General
partner’s capital
|
336,925 | 260,965 | ||||||
|
Total
partners’ capital
|
308,518,934 | 268,440,955 | ||||||
|
Total
liabilities and partners’ capital
|
$ | 326,948,203 | $ | 272,721,412 | ||||
See
accompanying notes to financial statements (unaudited).
3
UNITED DEVELOPMENT FUNDING III,
L.P.
(Unaudited)
|
Three
Months Ended
|
Nine
Months Ended
|
|||||||||||||||
|
September
30,
|
September
30,
|
|||||||||||||||
|
2009
|
2008
|
2009
|
2008
|
|||||||||||||
|
Revenues:
|
||||||||||||||||
|
Interest
income
|
$ | 10,701,311 | $ | 6,736,945 | $ | 30,550,158 | $ | 15,762,577 | ||||||||
|
Credit
enhancement fees – related party
|
61,342 | - | 76,753 | - | ||||||||||||
|
Mortgage
and transaction service revenues
|
444,964 | 557,197 | 1,904,240 | 1,339,887 | ||||||||||||
|
Total
revenues
|
11,207,617 | 7,294,142 | 32,531,151 | 17,102,464 | ||||||||||||
|
Expenses:
|
||||||||||||||||
|
Interest
expense
|
32,877 | - | 32,877 | 1,500 | ||||||||||||
|
General
and administrative
|
1,124,138 | 1,098,972 | 2,904,825 | 2,850,643 | ||||||||||||
|
Total
expenses
|
1,157,015 | 1,098,972 | 2,937,702 | 2,852,143 | ||||||||||||
|
Net
income
|
$ | 10,050,602 | $ | 6,195,170 | $ | 29,593,449 | $ | 14,250,321 | ||||||||
|
Earnings
allocated to limited partners
|
$ | 9,007,313 | $ | 5,552,100 | $ | 26,521,545 | $ | 12,771,096 | ||||||||
|
Earnings
per limited partnership unit, basic and diluted
|
$ | 0.53 | $ | 0.50 | $ | 1.60 | $ | 1.48 | ||||||||
|
Weighted
average limited partnership units outstanding
|
17,007,588 | 11,189,937 | 16,619,177 | 8,643,331 | ||||||||||||
|
Distributions
per weighted average limited partnership units outstanding
|
$ | 0.49 | $ | 0.45 | $ | 1.44 | $ | 1.36 | ||||||||
See
accompanying notes to financial statements (unaudited).
4
(Unaudited)
|
Nine
Months Ended
|
||||||||
|
September
30,
|
||||||||
|
2009
|
2008
|
|||||||
|
Operating
Activities
|
||||||||
|
Net
income
|
$ | 29,593,449 | $ | 14,250,321 | ||||
|
Adjustments
to reconcile net income to net cash provided by operating
activities:
|
||||||||
|
Provision
for loan losses
|
397,415 | 157,626 | ||||||
|
Depreciation
and amortization
|
41,753 | 44,186 | ||||||
|
Changes
in operating assets and liabilities:
|
||||||||
|
Accrued
interest receivable
|
(7,376,112 | ) | (2,816,153 | ) | ||||
|
Accrued
interest receivable – related party
|
598,311 | (29,221 | ) | |||||
|
Other
assets
|
(521,310 | ) | 14,610 | |||||
|
Accounts
payable
|
32,877 | 326,172 | ||||||
|
Accrued
liabilities
|
(285,972 | ) | 41,825 | |||||
|
Net
cash provided by operating activities
|
22,480,411 | 11,989,366 | ||||||
|
Investing
Activities
|
||||||||
|
Investments
in mortgage notes receivable
|
(57,176,749 | ) | (106,613,512 | ) | ||||
|
Investments
in mortgage notes receivable – related party
|
(36,750,609 | ) | (47,495,486 | ) | ||||
|
Investments
in participation interest – related party
|
(13,282,405 | ) | (24,386,207 | ) | ||||
|
Receipts
from mortgage notes receivable
|
29,279,144 | 59,631,809 | ||||||
|
Receipts
from mortgage notes receivable – related party
|
30,703,467 | 19,942,424 | ||||||
|
Net
cash used in investing activities
|
(47,227,152 | ) | (98,920,972 | ) | ||||
|
Financing
Activities
|
||||||||
|
Net
proceeds from (payments on) line-of-credit
|
15,000,000 | (2,325,028 | ) | |||||
|
Limited
partner contributions
|
35,370,572 | 141,529,952 | ||||||
|
Limited
partner distributions
|
(23,921,770 | ) | (11,738,864 | ) | ||||
|
Limited
partner distribution reinvestment
|
9,164,534 | 4,283,631 | ||||||
|
Limited
partner redemptions
|
(2,852,502 | ) | (1,764,523 | ) | ||||
|
General
partner distributions
|
(2,995,943 | ) | (1,350,908 | ) | ||||
|
Escrow
payable
|
(517,190 | ) | 1,988,638 | |||||
|
Restricted
cash
|
(1,006,544 | ) | (1,988,638 | ) | ||||
|
Payments
of offering costs
|
(4,280,361 | ) | (16,976,797 | ) | ||||
|
Deferred
offering costs
|
612,292 | 530,948 | ||||||
|
Accrued
liabilities – related party
|
(80,903 | ) | 1,374,372 | |||||
|
Net
cash provided by financing activities
|
24,492,185 | 113,562,783 | ||||||
|
Net
increase (decrease) in cash and cash equivalents
|
(254,556 | ) | 26,631,177 | |||||
|
Cash
and cash equivalents at beginning of period
|
15,505,910 | 586,642 | ||||||
|
Cash
and cash equivalents at end of period
|
$ | 15,251,354 | $ | 27,217,819 | ||||
See
accompanying notes to financial statements (unaudited).
5
UNITED
DEVELOPMENT FUNDING III, L.P.
(Unaudited)
A. Nature of
Business
United
Development Funding III, L.P. (which may be referred to as the “Partnership,”
“we,” “us,” “our” or “UDF III”) was organized on June 13, 2005 as a
Delaware limited partnership. Our principal business purpose is to
originate, acquire, service, and otherwise manage, either alone or in
association with others, a diversified portfolio of mortgage loans that are
secured by real property or equity interests that hold real property already
subject to other mortgages (including mortgage loans that are not first in
priority and participation interests in mortgage loans) and to issue or acquire
an interest in credit enhancements to borrowers, such as guaranties or letters
of credit. Our offices are located in Grapevine, Texas.
Our
general partner is UMTH Land Development, L.P., a Delaware limited partnership
(“Land Development”) that is responsible for our overall management, conduct,
and operation. Our general partner has authority to act on our behalf
in all matters respecting us, our business and our property. The
limited partners shall take no part in the management of our business or
transact any business for us and shall have no power to sign for or bind us;
provided, however, that the limited partners, by a majority vote and without the
concurrence of the general partner, have the right to: (a) amend the
Second Amended and Restated Agreement of Limited Partnership, as amended (the
“Partnership Agreement”) governing the partnership, (b) dissolve the
Partnership, (c) remove the general partner or any successor general partner,
(d) elect a new general partner, and (e) approve or disapprove a transaction
entailing the sale of all or substantially all of our real properties acquired
by the Partnership.
B. Basis of
Presentation
The
accompanying unaudited financial statements were prepared in accordance with
accounting principles generally accepted in the United States of America for
interim financial information, with the instructions to Form 10-Q and with
Regulation S-X. They do not include all information and footnotes
required by accounting principles generally accepted in the United States of
America for complete financial statements. However, except as
disclosed herein, there has been no material change to the information disclosed
in our Annual Report on Form 10-K for the year ended December 31, 2008, which
was filed with the Securities and Exchange Commission. The interim
unaudited financial statements should be read in conjunction with the financial
statements filed in our most recent Annual Report. In the opinion of
management, the accompanying unaudited financial statements include all
adjustments, consisting solely of normal recurring adjustments, considered
necessary to present fairly our financial position as of September 30, 2009,
operating results for the three and nine months ended September 30, 2009 and
2008 and cash flows for the nine months ended September 30, 2009 and
2008. Operating results and cash flows for the nine months ended
September 30, 2009 are not necessarily indicative of the results that may be
expected for the year ending December 31, 2009.
Impact
of Recently Issued Accounting Standards
In December
2007, the Federal Accounting Standards Board (“FASB”) issued Statement of
Financial Accounting Standards (“SFAS”) 141 (revised 2007) “Business Combinations,”
currently within the scope of FASB Accounting Standards Codification (“ASC”)
805-10. ASC 805-10 modifies the accounting and disclosure requirements for
business combinations and broadens the scope of the previous standard to apply
to all transactions in which one entity obtains control over another business.
In addition, it establishes new accounting and reporting standards for
non-controlling interests in subsidiaries. The Partnership’s adoption
of this guidance on January 1, 2009 has not had a material impact on the
Partnership’s financial condition or results of operations.
In
February 2008, the FASB issued FASB Staff Position FSP 157-2, “Effective Date of FASB Statement No. 157,” currently
within the scope of ASC 820-10. The effective date of ASC 820-10 for all
nonfinancial assets and nonfinancial liabilities, except for items recognized or
disclosed at fair value in the financial statements on a recurring basis (at
least annually), was delayed until the beginning of the first quarter 2009.
Application of ASC 820-10 did not have a material impact on the Partnership’s
results of operations and financial condition upon adoption on January 1,
2009.
6
In April 2009, the FASB issued FASB
Staff Position No. FAS 107-1 and APB 28-1, “Interim Disclosures about Fair Value
of Financial Instruments,” currently within the scope of ASC
825-10. ASC 825-10 requires disclosures about the fair value of
financial instruments whenever a public company issues financial information for
interim reporting periods. ASC 825-10 is effective for interim
reporting periods ending after June 15, 2009. The Partnership adopted
this staff position upon its issuance, and it had no material impact on its
financial statements. See note F – “Fair Value Measurements” for
these disclosures.
In May
2009, the FASB issued SFAS 165, “Subsequent Events,” currently
within the scope of ASC 855-10. ASC 855-10 establishes general standards of
accounting for and disclosure of events that occur after the balance sheet date
but before financial statements are issued or are available to be issued. This
guidance is effective for interim or annual financial periods ending after
June 15, 2009, and the Partnership adopted this guidance during the three
months ended June 30, 2009. The Partnership’s adoption of this guidance did
not have a material impact on its financial statements.
In June
2009, the FASB issued SFAS 168, “The FASB Accounting Standards
Codification and the Hierarchy of Generally Accepted Accounting Principles,”
currently within the scope of ASC 105-10. ASC 105-10 identifies the ASC
as the authoritative source of generally accepted accounting principles (“GAAP”)
in the United States. The ASC did not change GAAP but reorganizes the
literature. Rules and interpretive releases of the Securities and
Exchange Commission under federal securities laws are also sources of
authoritative GAAP for Securities and Exchange Commission registrants. This
guidance is effective for financial
statements issued for interim and annual periods ending after September 15, 2009
and the Partnership adopted the provisions of this guidance as of September 30,
2009. The Partnership’s adoption of this guidance did not have a
material impact on its financial statements.
Subsequent
Events
We have evaluated subsequent events
through November 16, 2009, which is the date these financial statements were
issued.
C. Registration
Statements
On May
15, 2006, a public offering of our units of limited partnership interest (the
“Offering”) pursuant to a Registration Statement on Form S-11 (File No.
333-127891) was declared effective under the Securities Act of 1933, as
amended. The Offering, at the time of such effectiveness, covered up
to 12,500,000 units of limited partnership interest at a price of $20 per unit
and up to 5,000,000 units of limited partnership interest to be issued pursuant
to our distribution reinvestment plan (the “DRIP”) for $20 per
unit. We had the right to reallocate the units of limited partnership
interest we were offering between the primary offering and our DRIP, and
pursuant to Supplement No. 8 to our prospectus regarding the Offering, which was
filed with the Securities and Exchange Commission on September 4, 2008, we
reallocated the units being offered to be 16,250,000 units offered pursuant to
the primary offering and 1,250,000 units offered pursuant to the
DRIP. Pursuant to Supplement No. 11 to our prospectus regarding the
Offering, which was filed with the Securities and Exchange Commission on March
6, 2009, we further reallocated the units being offered to be 16,500,000 units
offered pursuant to the primary offering and 1,000,000 units offered pursuant to
the DRIP. The primary offering component of the Offering was
terminated on April 23, 2009. We extended the offering of our units
of limited partnership interest pursuant to our DRIP until the earlier of the
sale of all units of limited partnership interest being offered pursuant to our
DRIP or May 15, 2010; provided, however, that our general partner was
permitted to terminate the offering of units pursuant to our DRIP at any earlier
time.
On June
9, 2009, we held a Special Meeting of our limited partners as of April 13, 2009,
at which our limited partners approved three proposals to amend certain
provisions of our Partnership Agreement for the purpose of making
available additional units of limited partnership interest for sale
pursuant to an Amended and Restated Distribution Reinvestment
Plan. On June 12, 2009, we registered 5,000,000 additional units to
be offered pursuant to our Amended and Restated Distribution Reinvestment Plan
in a Registration Statement on Form S-3 (File No. 333-159939) (“Secondary
DRIP”). As such, we ceased offering units under the DRIP portion of
the Offering as of July 21, 2009 and concurrently
commenced our current offering of units pursuant to the Secondary
DRIP.
7
D. Line-of-Credit
On
September 21, 2009, the Partnership entered into a Loan and Security Agreement
(the “Loan Agreement”) with Wesley J. Brockhoeft (the “Lender”) pursuant to
which the Lender has provided the Partnership with a revolving credit facility
in the maximum principal amount of $15 million (the “Credit Facility”). The
interest rate on the Credit Facility is equal to 10% per
annum. Accrued interest on the outstanding principal amount of the
Credit Facility is payable monthly. The Credit Facility is
secured by a first priority lien on all of the Partnership’s existing and future
assets. The Credit Facility matures and becomes due and payable in
full on September 20, 2010. In consideration of the Lender
originating the Credit Facility, the Partnership paid the Lender an origination
fee in the amount of $300,000. On September 30, 2009, $15 million in
principal was outstanding under the Credit Facility.
The
Partnership’s eligibility to borrow up to $15 million under the Loan Agreement
is determined pursuant to a borrowing base. The borrowing base is
equal to the lesser of (a) (i) up to fifty percent (50%) of the aggregate
principal amount outstanding under the Partnership’s eligible notes, or
(ii) up to fifty percent (50%) of the face amount of the Partnership’s
eligible notes, or (iii) 40% of the appraised value of the real property
subject to the liens securing the Partnership’s eligible notes; minus (b) any reserves
required by the Lender. Eligible notes are those promissory notes
which are secured by first liens, meet certain other criteria established by the
Lender, and are otherwise approved by the Lender for inclusion in the borrowing
base. The Loan Agreement requires the Partnership to borrow the full
$15 million of proceeds of the Credit Facility during the first one hundred
eighty days following the date of the Loan Agreement (the “First 180 Day
Period”). If the Partnership prepays any principal of the Credit
Facility during the First 180 Day Period for whatever reason (including upon an
acceleration due to an event of default), the Partnership is required to pay a
prepayment premium to the Lender equal to the amount of interest that such
prepaid principal amount would have accrued between the date of prepayment and
the expiration date of the First 180 Day Period; provided, however, that the
aggregate amount of all interest and any prepayment premiums actually paid by
the Partnership to Lender with respect to accrued interest and any prepayments
of principal on the outstanding principal of the Credit Facility during the
First 180 Day Period shall not exceed $750,000. The Loan Agreement
requires the Partnership to make various representations to the Lender and to
comply with various covenants and agreements, including, without limitation,
maintaining at least $30 million in eligible notes, maintaining an adjusted
tangible net worth of no less than $250 million, maintaining its current line of
business, operating its business in accordance with applicable laws, providing
the Lender with information, financial statements and reports, and not
permitting a change of control to occur.
If a default occurs under the Credit
Facility, the Lender may declare the Credit Facility to be due and payable
immediately. A default may occur under the Credit Facility in various
circumstances including, without limitation, if (i) the Partnership fails to pay
amounts due to the Lender when due under the Loan Agreement, (ii) the
Partnership fails to comply with its covenants and agreements with the Lender,
(iii) the Partnership defaults under obligations for money borrowed in excess of
$500,000, (iv) the Lender deems itself insecure or determines that a material
adverse effect with respect to the Credit Facility, the Partnership, or the
collateral has occurred, (v) a criminal action is filed against the Partnership
under a federal or state racketeering statute, (vi) a bankruptcy action is
filled with respect to the Partnership, (vii) the Partnership conceals, removes,
or permits to be concealed or removed, any of its assets with the intent to
hinder, delay or defraud the Lender or its other creditors, or (viii) the Loan
Agreement or other loan documents are terminated, become void or unenforceable,
or any security interest ceases to be a valid and perfected first priority
security interest in any portion of the collateral. In such event,
the Lender may exercise any rights or remedies it may have, including, without
limitation, increasing the interest rate to twelve percent (12%) per annum,
prohibiting distributions to be made to the Partnership’s partners, or
foreclosure of the Partnership’s assets. Any such event may
materially impair the Partnership’s ability to conduct its
business.
The Partnership intends to utilize the
Credit Facility as transitory indebtedness to provide liquidity and to reduce
and avoid the need for large idle cash reserves, including usage to fund
identified investments pending receipt of proceeds from the partial or full
repayment of loans. Proceeds from the operations of the Partnership will
be used to repay the Credit Facility. The Partnership intends to use the
Credit Facility as a Partnership portfolio administration tool and not to
provide long-term or permanent leverage on Partnership
investments.
8
As of
September 30, 2009, we have issued and outstanding 17,095,630 units of limited
partnership interest in the Offering and the Secondary DRIP, consisting of
16,499,994 units that have been issued to our limited partners pursuant to our
primary offering in exchange for gross proceeds of approximately $330.3 million
(approximately $290.7 million, net of costs associated with the Offering),
716,260 units of limited partnership interest issued to limited partners in
accordance with our DRIP in exchange for gross proceeds of approximately $14.3
million and 157,627 units of limited partnership interest issued to limited
partners in accordance with our Secondary DRIP in exchange for gross proceeds of
approximately $3.2 million, minus 278,251 units of limited partnership interest
that have been repurchased pursuant to our unit redemption program for
approximately $5.6 million. As of December 31, 2008, we have issued and
outstanding 15,019,292 units of limited partnership interest in the Offering,
consisting of 14,739,257 units that have been issued to our limited partners in
exchange for gross proceeds of approximately $294.9 million (approximately
$259.6 million, net of costs associated with the Offering) and another 415,660
units of limited partnership interest issued to limited partners in accordance
with our DRIP in exchange for gross proceeds of approximately $8.3 million, less
135,625 units of limited partnership interest that have been repurchased
pursuant to our unit redemption program for approximately $2.7
million. In addition to the monthly DRIP and Secondary DRIP
distributions, we also distributed approximately $14.8 million and $11.4 million
in cash during 2009 and 2008, respectively, for aggregate monthly distributions
of approximately $29.5 million. Distributions to our general partner are more
fully discussed in Note I.
F. Fair Value
Measurements
In April 2009, the FASB issued FASB
Staff Position No. FAS 107-1 and APB 28-1, “Interim Disclosures about Fair Value
of Financial Instruments,” currently within the scope of ASC
825-10. ASC 825-10 requires disclosures about the fair value of
financial instruments whenever a public company issues financial information for
interim reporting periods. ASC 825-10 is effective for interim
reporting periods ending after June 15, 2009. We adopted this staff
position upon its issuance, and it had no material impact on our financial
statements because we believe the financial assets and liabilities as reported
in the Partnership’s financial statements approximate their respective fair
values.
G. Commitments and
Contingencies
In February 2009, the Partnership
deposited $1.5 million into a money market account (the “Deposit Account”) with
LegacyTexas Bank (“LegacyTexas”) for the purpose of providing collateral to
LegacyTexas for the benefit of UMTH Lending Company, LP, a Delaware limited
partnership (“UMTH Lending”) and an affiliate of the Partnership’s general
partner. The Partnership provided LegacyTexas a security interest in
the Deposit Account as further collateral for a loan (the “Loan”) obtained by
UMTH Lending from LegacyTexas. In consideration of the Partnership
providing the Deposit Account as collateral for the Loan, UMTH Lending agreed to
pay the Partnership a fee equal to 3% per annum of the amount outstanding in the
Deposit Account, for each year that the Deposit Account secures the
Loan. This Deposit Account is included as restricted cash on our
balance sheet. These fees are included in our credit enhancement fees
– related party income account.
In August 2009, the Partnership entered
into a guaranty for the benefit of Texas Capital Bank, National Association
(“Texas Capital”), or its permitted successors and assigns (the “UDF III
Guaranty”), by which the Partnership guarantied the repayment of up to $5
million owed to Texas Capital with respect to that certain promissory note
between UMT Home Finance, LP, a Delaware limited partnership (“UMT Home
Finance”), and Texas Capital Bank. UMT Home Finance is a wholly owned
subsidiary of United Mortgage Trust, a Maryland real estate investment trust
(“UMT”). An affiliate of the Partnership’s general partner serves as
the advisor to UMT. In connection with the UDF III Guaranty, the
Partnership entered into a letter agreement with UMT Home Finance which provides
for UMT Home Finance to pay the Partnership annually, in advance, an amount
equal to 1.0% of the maximum exposure of the Partnership under the UDF III
Guaranty (i.e., $50,000 per annum). These fees are included in our
credit enhancement fees – related party income account.
9
H.
Unit Redemption Program
Limited
partners who have held their units for at least one year may request that the
Partnership repurchase their units. A limited partner wishing to have
units repurchased must mail or deliver in writing a request to the Partnership
indicating such desire. The purchase price of repurchased units,
except as described below for redemptions upon the death of a limited partner,
will be equal to (i) 92% of the purchase price actually paid for any units
held less than two years, (ii) 94% of the purchase price actually paid for any
units held for at least two years but less than three years, (iii) 96% of the
purchase price actually paid for any units held for at least three years but
less than four years, (iv) 98% of the purchase price actually paid for any units
held for at least four years but less than five years, and (v) the lesser of the
purchase price actually paid for any units held at least five years or the
then-current fair market value of the units as determined by the most recent
annual valuation of units. The purchase price for units redeemed upon
the death of a limited partner will be the lesser of (i) the price the limited
partner actually paid for the units or (2) $20 per unit, limited to aggregate
annual redemptions not to exceed 1% of units outstanding in the preceding
12-month period.
The
Partnership will not redeem in excess of 5% of the weighted average number of
units outstanding during the 12-month period immediately prior to the date of
redemption. The general partner will determine from time to time
whether the Partnership has sufficient excess cash from operations to repurchase
units. Generally, the cash available for redemption will be limited
to 1% of the operating cash flow from the previous fiscal year, plus any net
proceeds from the DRIP. If the funds set aside for the unit
redemption program are not sufficient to accommodate all requests, at such time,
if any, when sufficient funds become available, pending requests will be honored
among all requesting limited partners as follows: first, pro rata as
to redemptions upon the death or disability of a limited partner; next, pro rata
as to limited partners who demonstrate, in the discretion of the general
partner, another involuntary exigent circumstance, such as bankruptcy; and,
finally, pro rata as to other redemption requests.
On July
8, 2009, the Partnership modified its unit redemption program such that,
effective June 30, 2009, in order to conserve cash and in response to increasing
requests for redemptions, the Partnership will limit its redemptions primarily
to those requested as a result of death and exigent circumstances, to the extent
the Partnership’s general partner determines there are sufficient funds to
redeem units. In addition, the Partnership intends to make
redemptions on a quarterly basis, as opposed to a monthly basis.
I. Related Party
Transactions
Our
general partner, Land Development, and certain of its affiliates, receive fees
in connection with the Offering and in connection with the acquisition and
management of our assets. No fees are paid in connection with the
offer and sale of units pursuant to the Secondary DRIP. Land
Development also receives reimbursement of certain costs of the
Partnership.
Land
Development received up to 1.5% of the gross offering proceeds (excluding
proceeds from our DRIP) for reimbursement of organization and offering
expenses. We have a related party payable to Land Development of
approximately $612,000 as of December 31, 2008 for organization and offering
costs paid by Land Development related to the Offering. There is no
related party payable to Land Development for organization and offering costs as
of September 30, 2009.
Land
Development is also paid 3% of the net amount available for investment in
mortgages for fees and expenses associated with the selection and origination of
mortgages, including, but not limited to, legal fees and expenses, travel and
communications expenses, costs of appraisals, accounting fees and expenses, and
title insurance funded by us. Such fees are amortized into expense on
a straight line basis.
We also
reimbursed Land Development up to 0.5% of the gross offering proceeds for
expenses related to bona fide due diligence expenses incurred by unaffiliated
selling group members and paid by us through Land Development (except that no
such due diligence expenses shall be paid with respect to sales under the
DRIP).
During
the Offering, our general partner paid a wholesaling fee of up to 1.2% of the
gross offering proceeds (excluding proceeds from sales under the DRIP) to IMS
Securities, Inc., an unaffiliated third party, and we reimbursed our general
partner for such payments. From such amount, IMS Securities, Inc.
reallowed up to 1% of the gross offering proceeds to wholesalers that were
employed by an affiliate of Land Development.
10
Land
Development currently receives a promotional interest equal to 10% of cash
available for distribution prior to the return to the limited partners of all of
their capital contributions plus an 8% annual cumulative (non-compounded) return
on their net capital contributions. After the limited partners
receive a return of their net capital contributions and an 8% annual cumulative
(non-compounded) return on their net capital contributions, Land Development
will receive a subordinated promotional interest of 15% of remaining cash
available for distribution (including net proceeds from a capital transaction or
pro rata portion thereof).
Land
Development receives a carried interest, which is an equity interest in us to
participate in all distributions, other than distributions attributable to its
promotional interest of cash available for distribution and net proceeds from a
capital transaction. If Land Development enters into commitments to
investments in mortgages in excess of 82% of the gross offering proceeds, it
will be entitled to a carried interest equal to (a) 1% for the first 2.5%
of commitments to investments in mortgages above 82% of the gross offering
proceeds (or if commitments to investments in mortgages are above 82% but no
more than 84.5%, 1% multiplied by the fractional amount of commitments to
investments in mortgages above 82%), (b) 1% for the next 2% of additional
commitments to investments in mortgages above 84.5% of the gross offering
proceeds (or if commitments to investments in mortgages are above 84.5% but no
more than 86.5%, 1% multiplied by the fractional amount of commitments to
investments in mortgages above 84.5%) and (c) 1% for each additional 1% of
additional commitments to investments in mortgages above 86.5% of the gross
offering proceeds (or a fractional percentage equal to the fractional amount of
any 1% of additional commitments to investments in mortgages).
For
services rendered in connection with the servicing of our loans, we pay a
monthly mortgage servicing fee to Land Development equal to one-twelfth of 0.25%
of our aggregate outstanding mortgage notes receivable, mortgage notes
receivable – related party and participation interest balances as of the last
day of the month. Such fees are included in general and
administrative expenses.
During
the Offering, UMTH Funding Services, L.P. (“Funding Services”), an affiliate of
Land Development, received 0.8% of the gross offering proceeds (excluding
proceeds from sales under our DRIP) as a marketing support fee for marketing and
promotional services provided to selling group members. Funding
Services also is reimbursed for operating expenses incurred in assisting Land
Development in our management. An additional marketing support fee
was paid directly to unaffiliated participating selected dealers in amounts
determined in the sole discretion of Land Development, but which did not exceed
1% of the gross offering proceeds (excluding proceeds from sales under our
DRIP).
The chart
below summarizes the payment of related party fees and reimbursements associated
with the Offering and origination and management of assets for the nine months
ended September 30, 2009 and 2008:
|
For
the Nine Months Ended
|
||||||
|
Payee
|
Purpose
|
September
30, 2009
|
September
30, 2008
|
|||
|
Land
Development
|
||||||
|
Organization
&
|
||||||
|
Offering
Expenses
|
$ 533,000
|
$ 2,118,000
|
||||
|
Due
Diligence Fees
|
178,000
|
706,000
|
||||
|
Wholesaler
Reimbursement
|
127,000
|
152,000
|
||||
|
Acquisition
& Origination
|
||||||
|
Expenses
and Fees
|
1,195,000
|
3,735,000
|
||||
|
Promotional
Interest
|
2,612,000
|
1,178,000
|
||||
|
Carried
Interest
|
384,000
|
173,000
|
||||
|
Mortgage
Servicing Fee
|
524,000
|
271,000
|
||||
|
Funding
Services
|
||||||
|
Marketing
Support Fees
|
360,000
|
1,795,000
|
||||
|
Operating
Expense
|
||||||
|
Reimbursement
|
702,000
|
318,000
|
||||
11
In January 2007, we issued a secured
promissory note to OU Land Acquisition II, L.P., a Texas limited partnership and
wholly owned subsidiary of United Development Funding, L.P., a Delaware limited
partnership (“UDF I”), in the principal amount of approximately $1.6
million. In connection with the origination therewith, and as
required by our Partnership Agreement and the NASAA Mortgage Program Guidelines,
we obtained an opinion from an independent advisor stating that the loan is fair
and at least as reasonable to us as a loan or credit enhancement to an
unaffiliated borrower in similar circumstances. In July 2009, this
note was paid in full. The secured promissory note, which bore
interest at a rate of 15% per annum, was collateralized by a second lien deed of
trust on approximately 101 acres of land located in Texas and was payable on
June 14, 2010. For the three months ended September 30, 2009 and
2008, we had recognized approximately $6,000 and $62,000, respectively, of
interest income related to this note. For the nine months ended
September 30, 2009 and 2008, we had recognized approximately $150,000 and
$178,000, respectively, of interest income related to this note.
In September 2007, we originated a
secured promissory note to UDF PM, LLC, a Texas limited liability company and
wholly-owned subsidiary of UDF I, in the principal amount of approximately $6.4
million, and in connection therewith as required by our Partnership Agreement
and the NASAA Mortgage Program Guidelines, we obtained an opinion from an
independent advisor stating that the loan is fair and at least as reasonable to
us as a loan or credit enhancement to an unaffiliated borrower in similar
circumstances. The secured promissory note, which bears an interest
rate of 15% per annum, is collateralized by a second lien deed of trust on
approximately 335 finished lots and 15 acres of land located in Texas and is
payable on September 4, 2010. For the three months ended September
30, 2009 and 2008, we had recognized approximately $238,000 and $212,000,
respectively, of interest income related to this note. For the nine
months ended September 30, 2009 and 2008, we had recognized approximately
$523,000 and $523,000, respectively, of interest income related to this
note.
In November 2007, we originated a
secured promissory note to United Development Funding X, L.P. (“UDF X”), a
Delaware limited partnership and wholly-owned subsidiary of our general partner,
in the principal amount of approximately $70 million, and in connection
therewith as required by our Partnership Agreement and the NASAA Mortgage
Program Guidelines, we obtained an opinion from an independent advisor stating
that the loan is fair and at least as reasonable to us as a loan or credit
enhancement to an unaffiliated borrower in similar circumstances. In
August 2008, we amended this revolving credit facility to reduce the commitment
amount to $25 million. The secured promissory note, which bears an
interest rate of 15% per annum, is collateralized by a pledge of 100% of the
ownership interests in UDF X and is payable on November 11, 2012. For
the three months ended September 30, 2009 and 2008, we had recognized
approximately $940,000 and $888,000, respectively, of interest income related to
this note. For the nine months ended September 30, 2009 and 2008, we
had recognized approximately $2.0 million and $1.6 million, respectively, of
interest income related to this note.
In December 2007, we originated a
secured promissory note to UDF Northpointe, LLC (“Northpointe”), a
Texas limited liability company and wholly-owned subsidiary of UDF I, in the
principal amount of approximately $6 million, and in connection therewith as
required by our Partnership Agreement and the NASAA Mortgage Program Guidelines,
we obtained an opinion from an independent advisor stating that the loan is fair
and at least as reasonable to us as a loan or credit enhancement to an
unaffiliated borrower in similar circumstances. The secured
promissory note, which bears an interest rate of 12% per annum, is
collateralized by a second lien deed of trust on 255 finished lots and 110 acres
of land in Texas and is payable on December 28, 2010. In December
2008, Northpointe was purchased by an unrelated third party, thus assuming the
secured promissory note. For the three and nine months ended
September 30, 2008, we had recognized approximately $179,000 and $495,000,
respectively, of interest income related to this note. No interest
income related to this note was recognized during 2009.
In May
2008, a secured promissory note originated in March 2007 to Buffington JV Fund
II, Ltd. (“Buff JV”), a Texas limited partnership of which UDF I has a 50%
partner interest, in the principal amount of approximately $5.3 million was paid
in full. In connection with the origination therewith as required by
our Partnership Agreement and the NASAA Mortgage Program Guidelines, we obtained
an opinion from an independent advisor stating that the loan is fair and at
least as reasonable to us as a loan or credit enhancement to an unaffiliated
borrower in similar circumstances. The secured promissory note, which
bore an interest rate of 13% per annum and was to be payable on June 30, 2009,
was collateralized by a pledge of the 1% ownership interests from Buffington JV
Fund Management, LLC, a Texas limited liability company and the general partner
of Buff JV, and a pledge of the 49% ownership interests from Buffington Asset
Group, Ltd., a Texas limited partnership and a limited partner of Buff
JV. For the nine months ended September 30, 2008, we recognized
approximately $473,000 of interest income related to this note. No
interest income related to this note was recognized during 2009.
12
In August
2008, we originated a secured revolving line of credit to United Development
Funding Land Opportunity Fund, L.P., a Delaware limited partnership (“UDF LOF”),
in the principal amount of up to $25 million, pursuant to a Secured Line of
Credit Promissory Note (the “UDF LOF Note”). Land Development is the
asset manager for, and an affiliate of, UDF LOF. The UDF LOF Note,
which bears interest at a base rate equal to 15% per annum, is secured by a lien
of all of UDF LOF’s existing and future acquired assets and is payable on August
20, 2011. In connection therewith, as required by our Partnership
Agreement and the NASAA Mortgage Program Guidelines, we obtained an opinion from
an independent advisor stating that the UDF LOF Note is fair and at least as
reasonable to us as a transaction with an unaffiliated party in similar
circumstances. For the three months ended September 30, 2009 and
2008, we had recognized approximately $290,000 and $40,000, respectively, of
interest income related to this note. For the nine months ended
September 30, 2009 and 2008, we had recognized approximately $1.4 million and
$40,000, respectively, of interest income related to this note.
In August
2008, we originated a secured promissory note with Buffington Capital Homes,
Ltd., a Texas limited partnership (“Buffington Capital”), in the principal
amount of $2.5 million. Land Development has a minority partner
interest in Buffington Capital. In connection therewith, as required
by our Partnership Agreement and the NASAA Mortgage Program Guidelines, we
obtained an opinion from an independent advisor stating that the Buffington
Capital note is fair and at least as reasonable to us as a transaction with an
unaffiliated party in similar circumstances. The secured note, which
bears interest at 14% per annum, is secured by a first lien on finished lot
inventory that is owned and controlled by Buffington
Capital. Buffington Capital’s payment and performance is guaranteed
by Buffington Land, Ltd., a Texas limited partnership, and is payable on August
12, 2010. For the three months ended September 30, 2009 and 2008, we
had recognized approximately $26,000 and $35,000, respectively, of interest
income related to this note. For the nine months ended September 30,
2009 and 2008, we had recognized approximately $111,000 and $35,000,
respectively, of interest income related to this note.
In August
2008, we originated a secured promissory note with Buffington Texas Classic
Homes, Ltd., a Texas limited partnership (“Buffington Classic”), in the
principal amount of $2 million. Land Development has a minority partner interest
in Buffington Classic. In connection therewith, as required by our
Partnership Agreement and the NASAA Mortgage Program Guidelines, we
obtained an opinion
from an independent advisor stating that the Buffington Classic note is fair and
at least as reasonable to us as a transaction with an unaffiliated party in
similar circumstances. The secured note, which bears interest at 14%
per annum, is secured by a first lien on finished lot inventory that is owned
and controlled by Buffington Classic. Buffington Classic’s payment
and performance is guaranteed by Buffington Land, Ltd., a Texas limited
partnership, and is payable on August 21, 2010. For the three months
ended September 30, 2009 and 2008, we had recognized approximately $29,000 and
$7,000, respectively, of interest income related to this note. For
the nine months ended September 30, 2009 and 2008, we had recognized
approximately $74,000 and $7,000, respectively, of interest income related to
this note.
In August
2008, we originated a secured line of credit to UDF I in the principal amount of
up to $45 million pursuant to a Secured Line of Credit Promissory Note (the “UDF
Note”). In connection therewith, as required by our Partnership
Agreement and the NASAA Mortgage Program Guidelines, we obtained an opinion from
an independent advisor stating that the UDF Note is fair and at least as
reasonable to us as a transaction with an unaffiliated party in similar
circumstances. We agreed in principal to subordinate the UDF Note to
a loan from UDF I’s senior lender. We entered into an intercreditor
agreement with UMT, another lender that has made a $45 million line of credit
loan to UDF I. The UMT and UDF III liens, and the priority of payment
from UDF I to UMT and UDF III, respectively, are of equal rank and
priority. The UMT loan is subordinate to the loan from UDF I’s senior
lender. The UDF Note, which bears interest at 14% per annum, is
collateralized by a lien against all of UDF I’s existing and future acquired
assets, including the loans and investments owned by UDF I, pursuant to a
security agreement executed by UDF I in favor of the Partnership (the “UDF
Security Agreement”) and is payable on December 31, 2009. The UDF
Note was terminated effective September 19, 2008 in order to allow us to enter
into the Economic Interest Participation Agreement discussed
below. For both the three and nine months ended September 30, 2008,
we had recognized approximately $13,000 of interest income related to this
note. No interest income related to this note was recognized during
2009.
13
In September 2008, we originated an
additional secured promissory note with Buffington Classic, in the principal
amount of approximately $290,000. In connection therewith, as
required by our Partnership Agreement and the NASAA Mortgage Program Guidelines,
we obtained an
opinion from an independent advisor stating that the Buffington Classic note is
fair and at least as reasonable to us as a transaction with an unaffiliated
party in similar circumstances. We provided a letter of credit on
behalf of Buffington Classic in the amount of approximately
$290,000. If the letter of credit is drawn upon, then an amount equal
to the drawn amount will be automatically advanced under the secured promissory
note. The secured note bears interest at 14% per annum and
represents a 12-month note period with two 12-month renewal
options. As of September 30, 2009, no amount had been drawn upon this
note; thus, no interest income had been recognized for the three and nine months
ended September 30, 2008 and 2009.
In September 2008, we entered into an
Economic Interest Participation Agreement with UMT pursuant to which UDF III
purchased (i) an economic interest in a $45 million revolving credit facility
(the “UMT Loan”) from UMT to UDF I and (ii) a purchase option to acquire a full
ownership participation interest in the UMT Loan (the “Option”). The
UMT loan was subsequently amended to $60 million as evidenced by a Third Amended
and Restated Secured Line of Credit Promissory Note dated as of August 17, 2009
(the “UMT Note”). The UMT Loan is secured by a security interest
in the assets of UDF I including UDF I’s land development loans and equity
investments pursuant to the First Amended and Restated Security Agreement dated
as of September 30, 2004, executed by UDF I in favor of UMT (the “Security
Agreement”).
Pursuant to the Economic Interest
Participation Agreement, each time UDF I requests an advance of principal under
the UMT Note, we will fund the required amount to UMT and our economic interest
in the UMT Loan increases proportionately. Our economic interest in
the UMT Loan gives us the right to receive payment from UMT of principal and
accrued interest relating to amounts funded by us to UMT which are applied
towards UMT’s funding obligations to UDF I under the UMT Loan. We may
abate our funding obligations under the Economic Interest Participation
Agreement at any time for a period of up to twelve months by giving UMT notice
of the abatement.
The
Option gives us the right to convert our economic interest into a full ownership
participation interest in the UMT Loan at any time by giving written notice to
UMT and paying an exercise price of $100. The participation interest
includes all rights incidental to ownership of the UMT Note and the Security
Agreement, including participation in the management and control of the UMT
Loan. UMT will continue to manage and control the UMT Loan while we
own an economic interest in the UMT Loan. If we exercise our Option
and acquire a participation interest in the UMT Loan, UMT will serve as the loan
administrator but both UMT and us will participate in the control and management
of the UMT Loan. The UMT Note matures on December 31,
2009. The purpose of the UMT Loan is to finance UDF I’s investments
in real estate development projects. The UMT Loan interest rate is
the lower of 14% or the highest rate allowed by law. UDF I may use
the UMT Loan proceeds to finance indebtedness associated with the
acquisition of any assets and to seek income that qualifies under the Real
Estate Investment Trust provisions of the Internal Revenue Code to the extent
such indebtedness, including indebtedness financed by funds advanced under the
UMT Loan and indebtedness financed by funds advanced from any other source,
including senior debt, is no less than 68% of the appraised value of all
subordinate loans and equity interests for land development and/or land
acquisition owned by UDF I and 75% for first lien secured loans for land
development and/or acquisitions owned by UDF I. For the three months ended
September 30, 2009 and 2008, we had recognized approximately $1.6 million and
$102,000, respectively, of interest income related to this note. For
the nine months ended September 30, 2009 and 2008, we had recognized
approximately $4.6 million and $102,000, respectively, of interest income
related to this note.
The UMT Loan is subordinate to UDF I’s
senior debt, which includes a revolving loan in the maximum amount of up to $30
million from Textron Financial Corporation (“Textron”) to UDF I, which is
evidenced by the Loan and Security Agreement between Textron and UDF I dated
June 14, 2006 (the “Textron Loan Agreement”), and all other indebtedness of UDF
I to any national or state chartered banking association or other institutional
lender that is approved by UMT in writing. As of September 30, 2009
and December 31, 2008, approximately $52.5 million and $39.3 million,
respectively, of the Economic Interest Participation Agreement is included in
participation interest – related party.
On June 14, 2009, the Textron Loan
Agreement matured and became due and payable in full. The loan
is in default and as of September 30, 2009, the outstanding balance owing to
Textron under the Textron Loan Agreement is approximately $27.7
million. Effective August 15, 2009, Textron and UDF I entered into a
Forbearance Agreement pursuant to which Textron agreed to forbear in exercising
its rights and remedies under the Textron Loan Agreement until November 15,
2009; provided, that the forbearance period will end earlier if UDF I defaults
under the Forbearance Agreement. Textron and UDF I are currently
engaged in discussions which management believes will result in an agreement
between UDF I and Textron to extend the current Forbearance Agreement for an
additional forbearance period. The interest rate payable on the loan
is 5.5% as of September 30, 2009. In consideration of Textron
entering into the Forbearance Agreement, UDF I agreed to pay Textron a
forbearance fee in the amount of $284,480. Textron has publicly
announced that it is exiting its commercial financing business through a
combination of orderly liquidation and selected sales which are expected to be
substantially complete over the next two to four years. We understand that UDF I
intends to continue to make payments on the loan and management does not believe
that the repayment of the Textron debt will have a material adverse effect on
UDF III’s participation in the UMT subordinate loan to UDF I.
14
Effective December 2008, the
Partnership modified a secured promissory note in the principal amount of
approximately $8.1 million that it had originated with UDF I in December 2006 in
the principal amount of approximately $6.9 million. In connection
with the origination of the promissory note, and as required by our Partnership
Agreement and the NASAA Mortgage Program Guidelines, we obtained an opinion from
an independent advisor stating that the loan is fair and at least as reasonable
to us as a loan or credit enhancement to an unaffiliated borrower in similar
circumstances. UDF I’s obligations under the note are secured by a
first lien deed of trust filed on 190 developed single-family home lots located
in Thornton, Colorado. The note bears interest at a base rate equal
to 12% per annum and interest payments are due monthly. The note
matured on June 30, 2009. For the three months ended September 30,
2009 and 2008, we had recognized approximately $277,000 and $228,000,
respectively, of interest income related to this note. For the nine
months ended September 30, 2009 and 2008, we had recognized approximately
$770,000 and $654,000, respectively, of interest income related to this
note.
In May
2009, Northpointe assigned its obligations associated with its promissory note
and its interests in the collateral by special warranty deed to UDF Northpointe
II, LP (“Northpointe II”), a subsidiary of UDF I. Concurrent with
this assignment, Northpointe entered into a contract for deed with Northpointe
II whereby Northpointe agreed to make payments to Northpointe II for all debt
service payments in consideration for Northpointe II transferring ownership and
possession of the collateral back to Northpointe. For the three and
nine months ended September 30, 2009, we had recognized approximately $229,000
and $373,000, respectively, of interest income related to this note. No interest income related
to this note was recognized during 2008.
In July
2009, we originated a secured promissory note to OU Land Acquisitions, LP (“OU
Land”), a Texas limited partnership and wholly-owned subsidiary of UDF I, in the
principal amount of approximately $2.0 million, and in connection therewith as
required by our Partnership Agreement and the NASAA Mortgage Program Guidelines,
we obtained an opinion from an independent advisor stating that the loan is fair
and at least as reasonable to us as a loan or credit enhancement to an
unaffiliated borrower in similar circumstances. The secured
promissory note, which bears an interest rate of 15% per annum, is
collateralized by a first
lien on 56 acres of land located in Houston, Texas and is payable on June 14,
2010. For both the three and nine months ended September 30, 2009, we
had recognized approximately $74,000 of interest income related to this
note. No interest
income related to this note was recognized during 2008.
On
September 21, 2009, the Partnership entered into the $15 million Credit Facility
with Wesley J. Brockhoeft (as discussed in Note D). In conjunction
with this Credit Facility, the Partnership paid UMTH Funding a debt placement
fee equal to 1% ($150,000) of the Credit Facility. This debt
placement fee is included in other assets on our balance sheet.
For the
nine months ended September 30, 2009, we had recognized approximately $77,000 as
credit enhancement fees – related party as discussed above in Note
G.
An
affiliate of Land Development serves as the advisor to UMT. Land
Development serves as the asset manager of UDF I.
15
Item 2. Management’s Discussion and
Analysis of Financial Condition and Results of Operations.
The
following discussion and analysis should be read in conjunction with our
accompanying financial statements and the notes thereto:
Forward-Looking
Statements
This
section of the quarterly report contains forward-looking statements, including
discussion and analysis of us, our financial condition, amounts of anticipated
cash distributions to our limited partners in the future and other
matters. These forward-looking statements are not historical facts
but are the intent, belief or current expectations of our management based on
their knowledge and understanding of our business and industry. Words
such as “may,” “anticipates,” “expects,” “intends,” “plans,” “believes,”
“seeks,” “estimates,” “would,” “could,” “should” and variations of these words
and similar expressions are intended to identify forward-looking
statements. These statements are not guaranties of future performance
and are subject to risks, uncertainties and other factors, some of which are
beyond our control, are difficult to predict and could cause actual results to
differ materially from those expressed or forecasted in the forward-looking
statements.
Forward-looking
statements that were true at the time made may ultimately prove to be incorrect
or false. We caution you not to place undue reliance on
forward-looking statements, which reflect our management’s view only as of the
date of this Quarterly Report. We undertake no obligation to update
or revise forward-looking statements to reflect changed assumptions, the
occurrence of unanticipated events or changes to future operating
results. Factors that could cause actual results to differ materially
from any forward-looking statements made in this Form 10-Q include changes in
general economic conditions, changes in real estate conditions, development
costs that may exceed estimates, development delays, increases in interest
rates, residential lot take down or purchase rates or inability to sell
residential lots experienced by our borrowers, and the potential need to fund
development costs not completed by the initial borrower or other capital
expenditures out of operating cash flows. The forward-looking
statements should be read in light of the risk factors identified in the “Risk
Factors” section of our Annual Report on Form 10-K for the year ended December
31, 2008, which was filed with the Securities and Exchange Commission, and the
discussion of material trends affecting our business elsewhere in this
report.
Overview
On May
15, 2006, our Registration Statement on Form S-11 (File No. 333-127891),
covering the Offering of up to 12,500,000 units of limited partnership interest
at a price of $20 per unit, was declared effective under the Securities Act of
1933, as amended. The Registration Statement on Form S-11 also
covered up to 5,000,000 units of limited partnership interest to be issued
pursuant to our DRIP for $20 per unit. We had the right to reallocate
the units of limited partnership interest we were offering between the primary
offering and our DRIP, and pursuant to Supplement No. 8 to our prospectus
regarding the Offering, which was filed with the Securities and Exchange
Commission on September 4, 2008, we reallocated the units being offered to be
16,250,000 units offered pursuant to the primary offering and 1,250,000 units
offered pursuant to the DRIP. Pursuant to Supplement No. 11 to our
prospectus regarding the Offering, which was filed with the Securities and
Exchange Commission on March 6, 2009, we further reallocated the units being
offered to be 16,500,000 units offered pursuant to the primary offering and
1,000,000 units offered pursuant to the DRIP. The primary offering
component of the Offering was terminated on April 23, 2009. We
extended the offering of our units of limited partnership interest pursuant to
our DRIP until the earlier of the sale of all units of limited partnership
interest being offered pursuant to our DRIP or May 15, 2010; provided,
however, that our general partner was permitted to terminate the offering of
units pursuant to our DRIP at any earlier time.
On June
9, 2009, we held a Special Meeting of our limited partners as of April 13, 2009,
at which our limited partners approved three proposals to amend certain
provisions of our Partnership Agreement for the purpose of making
available additional units of limited partnership interest for sale
pursuant to an Amended and Restated Distribution Reinvestment
Plan. On June 12, 2009, we registered 5,000,000 additional units to
be offered pursuant to our Secondary DRIP in a Registration Statement on Form
S-3 (File No. 333-159939). As such, we ceased offering units under
the DRIP portion of the Offering as of July 21, 2009 and concurrently
commenced our current offering of units pursuant to the Secondary
DRIP.
We will
experience a relative decrease in liquidity as available funds are expended in
connection with the funding and acquisition of mortgage loans and as amounts
that may be drawn under a new credit facility are repaid.
16
Critical Accounting Policies and
Estimates
Management’s
discussion and analysis of financial condition and results of operations are
based upon our financial statements, which have been prepared in accordance with
GAAP. GAAP consists of a set of standards issued by the FASB and other
authoritative bodies in the form of FASB Statements, Interpretations, FASB Staff
Positions, EITF consensuses and AICPA Statements of Position, among
others. The FASB recognized the complexity of its standard-setting process
and embarked on a revised process in 2004 that culminated in the release on July
1, 2009 of the FASB ASC. The FASB ASC does not change how the Partnership
accounts for its transactions or the nature of related disclosures made.
Rather, the FASB ASC results in changes to how the Partnership references
accounting standards within its reports. This change was made effective by
the FASB for periods ending on or after September 15, 2009. The
Partnership has updated references to GAAP in this Quarterly Report on Form 10-Q
to reflect the guidance in the FASB ASC. The preparation of these
financial statements requires our management to make estimates and assumptions
that affect the reported amounts of assets, liabilities, revenues and expenses,
and related disclosure of contingent assets and liabilities. On a regular
basis, we evaluate these estimates, including investment impairment. These
estimates are based on management’s historical industry experience and on
various other assumptions that are believed to be reasonable under the
circumstances. Actual results may differ from these estimates.
We have identified our most critical accounting policies to be the
following:
Revenue
Recognition
Interest
income on mortgage notes receivable and participation interest – related party
is recognized over the life of the loan and recorded on the accrual
basis. Income recognition is suspended for loans at either the date
at which payments become 90 days past due or when, in the opinion of management,
a full recovery of income and principal becomes doubtful. Income
recognition is resumed when the loan becomes contractually current and
performance is demonstrated to be resumed. As of September 30, 2008,
we were accruing interest on all mortgage notes receivable. As of
September 30, 2009, we were no longer accruing interest on one mortgage note
receivable.
The
Partnership generates mortgage and transaction service revenues by originating
mortgage notes receivable and other loans. In accordance with FASB
ASC 310-20, Receivables-Nonrefundable Fees and
Other Costs, we defer recognition of income from nonrefundable commitment
fees paid by the borrowers and recognize such income on a straight-line basis
over the expected life of such notes. The Partnership also expenses a
3% acquisition and origination fee (“placement fee”) paid to the general partner
to provide for processing and origination costs associated with mortgage notes
receivable held by the Partnership on a straight-line basis. As of
September 30, 2009 and December 31, 2008, approximately $5.2 million and $3.6
million, respectively, of these net deferred fees have been included in mortgage
notes receivable (including related party transactions) and participation
interest – related party.
Determination of the Allowance for Loan Losses
The
allowance for loan losses is our estimate of incurred losses in our portfolio of
mortgage notes receivable, mortgage notes receivable – related party and
participation interest – related party. We periodically perform
detailed reviews of our portfolio of mortgage notes and other loans to determine
if impairment has occurred and to assess the adequacy of the allowance for loan
losses based on historical and current trends and other factors affecting credit
losses. We charge additions to the allowance for loan losses to
current period earnings through the provision for loan
losses. Amounts determined to be uncollectible are charged directly
against (and decrease) the allowance for loan losses (“charged off”), while
amounts recovered on previously charged off accounts increase the
allowance. We exercise significant judgment in estimating the timing,
frequency and severity of losses, which could materially affect the provision
for loan losses and, therefore, net income. As of September 30, 2009
and December 31, 2008, approximately $715,000 and $318,000, respectively,
of allowance for loan losses have been offset against mortgage notes
receivable.
Mortgage
Notes Receivable and Mortgage Notes Receivable – Related Party
Mortgage
notes receivable and mortgage notes receivable – related party are recorded at
the lower of cost or estimated net realizable value. The mortgage
investments are collateralized by land and related improvements to residential
property owned by the borrowers and/or the ownership interests of the
borrower. Currently, the mortgage notes receivable have a term
ranging from four to 51 months. None of such mortgages are insured or
guaranteed by a federally owned or guaranteed mortgage agency. We
originate and/or acquire all mortgage notes receivable and intend to hold the
mortgage notes receivable for the life of the notes.
17
Participation
Interest – Related Party
Participation interest – related party
represents an Economic Interest Participation agreement with UMT, pursuant to
which we purchased (i) an economic interest in a $60 million revolving credit
facility from UMT to UDF I and (ii) a purchase option to acquire a full
ownership participation interest in the credit facility.
Cash
Flow Distributions
Cash
available for distributions represents the funds received by us from operations
(other than proceeds from a capital transaction or a liquidating distribution),
less cash used by us to pay our expenses, debt payments, and amounts set aside
to create a retained earnings reserve (currently at 9.5% of our net income; the
retained earnings reserve is intended to recover some of the organization and
offering expenses incurred in connection with the Offering). Our
general partner receives a monthly distribution for promotional and carried
interest from the cash available for distributions. Monthly
distributions are currently paid to the limited partners at a 9.75% annualized
return on a pro rata basis based on the number of days in the
Partnership. Retained earnings would contain a surplus if the cash
available for distributions less the 9.5% reserve exceeded the monthly
distribution to the general and limited partners. Retained earnings
would contain a deficit if cash available for distributions less the 9.5%
reserve is less than the monthly distribution to general and limited
partners. It is the intent of management to monitor and distribute
such surplus, if any, on an annual basis. The chart below summarizes
the approximate amount of distributions to our general partner and limited
partners and the retained earnings deficit and surplus as of September 30, 2009
and December 31, 2008:
|
As
of September 30,
|
As
of December 31,
|
|||
|
2009
|
2008
|
|||
|
General
Partner
|
$
5,760,000
|
$
2,764,000
|
||
|
Limited
Partners
|
47,021,000
|
(1)
|
23,099,000
|
(2)
|
|
Retained
Earnings Reserve
|
2,883,000
|
600,000
|
||
|
Retained
Earnings Surplus (Deficit)
|
(2,699,000)
|
(2,168,000)
|
________________
(1) approximately
$29.5 million paid in cash and approximately $17.5 million reinvested in 873,887
units of limited partnership interest under the DRIP and Secondary
DRIP.
(2) approximately
$14.8 million paid in cash and approximately $8.3 million reinvested in 415,660
units of limited partnership interest under the DRIP.
Results
of Operations
The
three and nine months ended September 30, 2009 as compared to the three and nine
months ended September 30, 2008.
Revenues
Interest
income for the three months ended September 30, 2009 and 2008 was approximately
$10.7 million and $6.7 million, respectively. Interest income for the
nine months ended September 30, 2009 and 2008 was approximately $30.6 million
and $15.8 million, respectively. The increase in interest income for
the three and nine months ended September 30, 2009 is primarily the result of
our increased mortgage notes receivable portfolio (including related party
transactions) and participation interest – related party portfolios of
approximately $299.2 million as of September 30, 2009, compared to $198.8
million as of September 30, 2008.
18
Credit
enhancement fees – related party for the three and nine months ended September
30, 2009 were approximately $61,000 and $77,000, respectively. For
further discussion of credit enhancement fees – related party, see the Off
Balance Sheet Arrangements discussion below.
Mortgage
and transaction service revenues for the three months ended September 30, 2009
and 2008 were approximately $445,000 and $557,000,
respectively. Mortgage and transaction service revenues for the nine
months ended September 30, 2009 and 2008 were approximately $1.9 million and
$1.3 million, respectively. The Partnership generates mortgage and
transaction service revenues by originating and acquiring mortgage notes
receivable and other loans. In accordance with FASB ASC 310-20, Receivables-Nonrefundable Fees and
Other Costs, we defer recognition of income from nonrefundable commitment
fees and recognize such income on a straight-line basis over the expected life
of such notes. The increase in mortgage and transaction service
revenues for the nine months ended September 30, 2009 is primarily the result of
our increased mortgage notes receivable portfolio (including related party
transactions) and participation interest – related party portfolios of
approximately $299.2 million as of September 30, 2009, compared to $198.8
million as of September 30, 2008.
We expect
revenues to increase commensurate with the additional proceeds raised from the
offering of units pursuant to the Secondary DRIP, our continued
deployment of funds available in a diversified manner to the borrowers and
markets in which we have experience and as markets dictate in accordance with
economic factors conducive for a stable residential market, and our reinvestment
of proceeds from loans that are repaid.
Expenses
Interest
expense for the three and nine months ended September 30, 2009 was approximately
$33,000. There was no interest expense for the three months ended
September 30, 2008. Interest expense for the nine months ended
September 30, 2008 was approximately $1,500. Interest expense in 2009
represents interest associated with a $15 million revolving credit facility that
we entered into in September 2009 with Wesley J. Brockhoeft (“Brockhoeft Credit
Facility”). Interest expense in 2008 represents interest associated
with a $10 million revolving credit facility that we had entered into in
December 2006 with Premier Bank, a Missouri banking association d/b/a Premier
Bank of Texas, which was terminated in December 2008 (“Premier Credit
Facility”). Both the Brockhoeft Credit Facility and the Premier
Credit Facility have been utilized as transitory indebtedness to provide
liquidity and to reduce and avoid the need for large idle cash reserves,
including usage to fund identified investments pending receipt of proceeds from
the sale of our units. Both credit facilities have been used as portfolio
administration tools and not to provide long-term or permanent leverage on our
investments.
General
and administrative expense for both the three months ended September 30, 2009
and 2008 was approximately $1.1 million. General and administrative
expense for both the nine months ended September 30, 2009 and 2008 was
approximately $2.9 million. The decrease in placement fee
amortization for each of these periods was offset by an increase in other
operating expenses primarily associated with the increase in total investors
over the same periods.
We expect
interest expense and general and administrative expense to increase commensurate
with the growth of our portfolio as we continue to deploy funds available in a
diversified manner to the borrowers and markets in which we have experience and
as markets dictate in accordance with economic factors conducive for a stable
residential market.
Cash Flow
Analysis
Cash
flows provided by operating activities for the nine months ended September 30,
2009 were approximately $22.5 million and were comprised primarily of net
income, offset with accrued interest receivable. During the nine months ended
September 30, 2008, cash provided by operating activities was approximately
$12.0 million and was comprised primarily of net income, offset by accrued
interest receivable.
Cash
flows used in investing activities for the nine months ended September 30, 2009
were approximately $47.2 million, resulting from the origination of
mortgage notes receivable, mortgage notes receivable – related party and
participation interest – related party. Cash flows used in investing
activities for the nine months ended September 30, 2008 were approximately $98.9
million, resulting from the origination of mortgage notes receivable, mortgage
notes receivable – related party and participation interest – related
party.
19
Cash
flows provided by financing activities for the nine months ended September 30,
2009 were approximately $24.5 million, and were primarily the result of
funds received from the Brockhoeft Credit Facility as well as the issuance of
limited partnership units, offset with payments of offering costs and
distributions to limited partners. Cash flows provided by financing
activities for the nine months ended September 30, 2008 were approximately
$113.6 million, and were primarily the result of funds received from the
issuance of limited partnership units, offset with payments of offering
costs.
Our cash
and cash equivalents were approximately $15.3 million and $27.2 million as of
September 30, 2009 and 2008, respectively.
Liquidity and Capital
Resources
Our
liquidity requirements will be affected by (1) outstanding loan funding
obligations, (2) our administrative expenses and (3) debt service on senior
indebtedness required to preserve our collateral position and (4) utilization of
the Brockhoeft Credit Facility. We expect that our liquidity will be
provided by (1) loan interest, transaction fees and credit enhancement fee
payments, (2) loan principal payments, (3) sale of loan pools through
securitization and direct sale of loans, (4) proceeds from our DRIP and
Secondary DRIP, and (5) credit lines available to us.
In most
cases, loan interest payments will be funded by an interest reserve and are due
at the maturity of the loan. Interest reserve accounts are funded as
loan proceeds and are intended to provide cash for monthly interest payments
until such time that revenue from the sale of land or developed lots is
sufficient to meet the debt service obligations. In the event that
interest reserves are exhausted prior to realization of sufficient cash from
land or lot sales, interest is due and payable monthly, and if the required
payments are not made, a loan default may occur. If the loan
agreement does not include interest reserve provisions, interest payments are
due and payable monthly. Payment defaults and decreasing land and lot sales may
result in less liquidity and affect our ability to meet our obligations and make
distributions. Limited credit facilities may impact our ability to
meet our obligations or expand our loan portfolio when other sources of cash are
not sufficient.
Increased
liquidity needs could result in the liquidation of loans to raise cash, thereby
reducing the number and amount of loans outstanding and the resultant earnings
realized. We have secured the Brockhoeft Credit Facility that is
utilized as transitory indebtedness to provide liquidity and to reduce the need
for large idle cash reserves.
We expect
our liquidity and capital resources to increase commensurate with the additional
proceeds raised from the offering of units pursuant to the Secondary
DRIP, our continued deployment of funds available in a diversified
manner to the borrowers and markets in which we have experience and as markets
dictate in accordance with economic factors conducive for a stable residential
market, and our reinvestment of proceeds from loans that are
repaid.
Material
Trends Affecting Our Business
We are a
real estate finance limited partnership and derive a substantial portion of our
income by originating, purchasing, participating in, and holding for investment
mortgage loans made directly by us to persons and entities for the acquisition
and development of real property as single-family residential lots that will be
marketed and sold to home builders. We intend to concentrate our
lending activities in the southeast and southwest sections of the United States,
particularly in Texas, Colorado, and Arizona; we believe these areas continue to
experience demand for new construction of single-family homes. Further, we
intend to concentrate our lending activities with national and regional
homebuilders and with developers who sell single-family residential home lots to
such national and regional homebuilders. The U.S. housing market
has suffered a decline over the past three years, particularly in geographic
areas that had experienced rapid growth, steep increases in property values, and
speculation. National and regional homebuilders have responded to
this decline by reducing the number of new homes constructed in 2009 as compared
to 2008 and 2007. However, we expect to see continued healthy demand
for our products as the supply of finished new homes and land is aligned with
our market demand.
Generally,
demand for new homes continued to deteriorate throughout 2008, accelerating with
the cascading events in credit and equity markets in September and October, and
bottoming in early 2009. Since then, we have seen the consumer
confidence index rise from the record low to which it fell in early 2009, but
the index still remains generally depressed, hovering near 50 – historically a
number only reached in recession. Confidence remains particularly
depressed in consumers’ assessment of current conditions – an assessment likely
affected by a soaring national unemployment rate and the persistent high
foreclosure rate in many markets across the country. However, while
job security and economic stability continue to weigh on consumers’ concerns, we
believe that demand for new homes is slowly returning. Though sales
remain low relative to historical standards, we believe that consumers are
cautiously re-entering the marketplace, encouraged by tax credits, low mortgage
rates, and near-record-high home affordability, and that the residential real
estate market is beginning a tentative recovery.
20
Nationally,
new single-family home sales and new home inventory continued to improve in the
third quarter. According to estimates released jointly by the U.S.
Census Bureau and the Department of Housing and Urban Development, the sales of
new single-family residential homes in September 2009 were at a seasonally
adjusted annual rate of 402,000 units – a continued improvement from the second
quarter figure of 399,000 and up significantly (22.2%) from their bottom in
January 2009 of 329,000. Still, sales remain approximately 7.8% below
the September 2008 estimate of 436,000. The seasonally adjusted
estimate of new houses for sale at the end of September 2009 was 251,000, which
represents a supply of 7.5 months at the current sales rate – a reduction of
nearly 30,000 homes from the second quarter supply of
8.4 months. We believe that the drop in the number of new single
family homes for sale by approximately 144,000 units year-over-year reflects the
homebuilding industry’s extensive – and largely successful – efforts to bring
the new home market back to equilibrium by reducing new housing starts and
selling existing new home inventory. According to the same sources
identified above, permits and starts were steadily reduced
month-over-month through 2008, nationally, as a result and in anticipation of an
elevated supply of and decreased demand for new single-family residential
homes. Since the beginning of 2009, however, permits and starts have
risen from their bottoms by 31.6% and 40.3%,
respectively. Single-family homes authorized by building permits in
September 2009 were at a seasonally adjusted annual rate of 450,000 units,
though this is still 14.9% below the September 2008 estimate of 529,000
units. Single-family home starts for September 2009 were at a
seasonally adjusted annual rate of 501,000 units. This is 8.7% below
the September 2008 estimate of 549,000 units. We believe that, as a
result of such reductions, new home inventory levels are approaching equilibrium
even at relatively low levels of demand. As we have stated for
several quarters, we believe that what is necessary to regain prosperity in
housing markets is the return of healthy levels of demand.
The
primary factors affecting new home sales are housing prices, home affordability,
and housing demand. Housing supply may affect both new home prices
and demand for new homes. When new home supplies exceed new home
demand, new home prices may generally be expected to
decline. Declining new home prices may result in diminished new home
demand as people postpone a new home purchase until such time as they are
comfortable that stable price levels have been reached.
Generally,
housing markets are improving but remain challenged across the country. Prices
continue to decline on a national basis with those declines and difficulties
most pronounced in markets that had previously experienced rapid growth, steep
increases in property values, and speculation, such as in California, Florida,
Arizona, and Nevada. However, a few markets, such as Texas, though
weakened from its high in 2007, continue to remain fairly healthy relative to
national trends. The graph below illustrates the declines in national
home price and prices in Arizona, California, Nevada, and Florida, though
recently, price declines have begun to moderate in those states, and certain
markets in California, Arizona, and Florida have even experienced small,
month-over-month price increases, based on the S&P Case-Shiller Home Price
Indices. Further, the chart illustrates how Texas has maintained
price stability and avoided such pronounced declines.
21
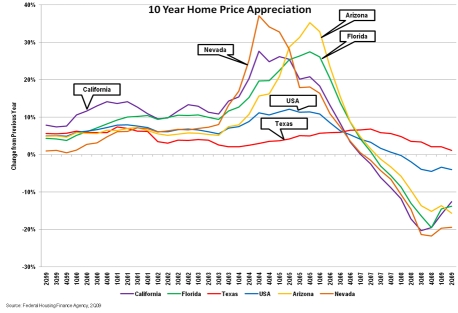
The
Federal Housing Finance Agency (“FHFA”) analyzes the combined mortgage records
of Fannie Mae and Freddie Mac, which form the nation’s largest database of
conventional, conforming mortgage transactions, and produces an all-transactions
house price index that tracks average house price changes in repeat sales or
refinancings of the same single-family properties. The index is based
on data obtained from Fannie Mae and Freddie Mac for mortgages originated over
the past 35 years.
The
Second Quarter 2009 all-transactions house price index reports that over the
past twelve months, home prices have risen 1.12% on average in Texas while,
nationally, home prices have fallen 3.99% over that same
period. According to that same source, only 8 states have seen home
prices increase over the past 12 months, while 42 states and the District of
Columbia have seen home prices fall. Furthermore, only three states,
Texas, North Dakota, and South Dakota, have seen home prices rise by more than
1.0% over the past 12 months while four states, Arizona, Florida, Nevada, and
California, have seen home prices fall by more than 12.0% over that
period. Home prices in the states of Arizona, Florida, California,
and Nevada fell 15.62%, 13.84%, 12.58%, and 19.42%, respectively.
As of
September 30, 2009, substantially all of our loans, approximately 95%, were with
respect to single-family residential development projects in
Texas. Our Texas loans were in the markets of Austin, Houston,
Dallas, San Antonio, and Lubbock. Our remaining loans were made with
respect to single-family residential development projects in Denver, Colorado
(4%) and Kingman, Arizona (1%).
Texas
housing markets have held up as some of the best in the country even as housing
woes continue to beleaguer the national economy. We believe the Texas
markets have remained relatively healthy due to continued strong population
growth, diverse economies, affordable housing, and home building and development
discipline on the part of home builders and developers operating in Texas
markets. Though recent job growth has ceased due to the current
economic climate, the Texas Workforce Commission reports that Texas has added
nearly three quarters of a million new jobs over the past five years, and we
believe that long term employment fundamentals in Texas remain
sound.
According
to numbers publicly released by Residential Strategies, Inc. or Metrostudy,
leading providers of primary and secondary market information, the median new
home prices for September 2009 in the metropolitan areas of Austin, Houston,
Dallas, and San Antonio are $206,888, $189,348, $204,031 and $179,837,
respectively. These amounts are at par with or slightly below the
September 2009 national median sales price of new homes sold of $204,800,
according to estimates released jointly by the U.S. Census Bureau and the
Department of Housing and Urban Development.
Using the
Department of Housing and Urban Development’s estimated 2009 median family
income for the respective metropolitan areas of Austin, Houston, Dallas, and San
Antonio, the median income earner in those areas has 1.42 times, 1.35 times,
1.33 times, and 1.28 times the income required to qualify for a mortgage to
purchase the median priced new home in the respective metropolitan
area. These numbers illustrate the high affordability of Texas
homes. Our measurement of housing affordability, as referenced above,
is determined as the ratio of median family income to the income required to
qualify for a 90 percent, 30-year fixed-rate mortgage to purchase the
median-priced new home, assuming an annual mortgage insurance premium of 50
basis points for private mortgage insurance and a cost that includes estimated
property taxes and insurance for the home.
22
Using the
U.S. Census Bureau’s 2009 income data to project an estimated median income for
the United States of $64,000 and the September 2009 national median sales prices
of new homes sold of $204,800, we conclude that the national median income
earner has 1.25 times the income required to qualify for a mortgage loan to
purchase the median-priced new home in the United States. This estimation
reflects the increase in home affordability in housing markets outside of Texas
over the past 24 months, as new home prices in housing markets outside of Texas
generally have fallen. Indeed, the national median new home price of
$204,800 has fallen by 9.06% from the September 2008 median new home sales price
of $225,200, according to the Department of Housing and Urban
Development. As a result of these falling home prices, we believe
that affordability has been restored to the national housing
market.
Additional
indicators that provide insight into the extent of new home affordability are
the ratio of new home prices to median income and the percentage of income
required for new home payments. Historically, the ratio of new home
prices to median income in stable markets is between 3 and 4, and the average
percentage of monthly income needed to service a conforming mortgage has been
between 19% and 25%, between 29% and 37% for a first-time home purchase.
By each of these historical measures, new home prices are very affordable both
nationally and within the four major Texas
markets.
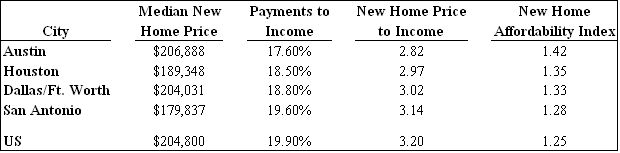
The Third
Quarter 2009 U.S. Market Risk Index, a study prepared by PMI Mortgage Insurance
Co., the U.S. subsidiary of The PMI Group, Inc., which ranks the nation’s 50
largest metropolitan areas through the second quarter of 2009 according to the
likelihood that home prices will be lower in two years, reported that Texas
cities are among the nation’s best for home price stability. This
index analyzes housing price trends, the impact of foreclosure rates, and the
consequence of excess housing supply on home prices. The quarterly
report projects that there is less than a 20% chance that the Dallas/Fort
Worth-area and Houston-area home prices will fall during the next two years; a
9.4% chance that San Antonio-area home prices will fall during the next two
years; and a 39.6% chance that Austin-area home prices will fall during the next
two years. Except for the Austin area, all Texas metropolitan areas
included in the report are in the Top 10 least-likely areas to experience a
decline in home prices in two years. The Austin area is ranked the
sixteenth least-likely area to experience a
decline. Dallas-Plano-Irving, Texas is the nation’s fifth
least-likely metropolitan area, Fort Worth-Arlington, Texas is seventh
least-likely, Houston-Sugar Land-Baytown, Texas is ninth
least-likely, and San Antonio, Texas is second
least-likely.
The FHFA
all-transaction price index reports that Texas had a healthy existing home price
appreciation between the second quarter of 2009 and the second quarter of 2008
of 1.12%. That report provides that existing home price appreciation
between the second quarter of 2009 and the second quarter of 2008 for (a) Austin
was 0.09%; (b) Houston was 2.42%; (c) Dallas was 1.13%; (d) Fort Worth was
1.63%; (e) San Antonio was 0.67%; and (f) Lubbock was 2.27%. The FHFA
tracks average house price changes in repeat sales or refinancings of the same
single-family properties utilizing conventional, conforming mortgage
transactions.
23
We also
believe that changes in population and employment affect new home
demand. The United States Census Bureau reported in its 2008
Estimate of Population Change July 1, 2007 to July 1, 2008 that Texas led the
country in population growth during that period. The estimate
concluded that Texas grew by 483,542 people, or 2.00% – a number that was 1.28
times greater in terms of raw population growth than the next closest state,
California, and more than 2.67 times the second closest state, North
Carolina. According to the same source, Texas also led the country in
population growth during the previous year of July 1, 2006 to July 1, 2007 with
an estimated population growth of 496,751 people, or 2.12%. The
United States Census Bureau also reported that Texas had the most counties of
any state among the 100 fastest-growing counties in the nation with 19 counties
and that Texas had the most counties that added the greatest number of residents
between July 1, 2007 and July 1, 2008. Six of the top 15 counties
were in Texas: Harris (Houston), Tarrant (Fort Worth), Bexar (San Antonio),
Collin (North Dallas), Dallas (Dallas) and Travis
(Austin). Additionally, the United States Census Bureau reported that
four out of Texas’ five major cities – Austin, Houston, Dallas and Fort Worth –
were among the top ten in the nation for population growth from 2007 to 2008 for
metropolitan statistical areas with a population estimate exceeding 1
million. Dallas-Fort Worth-Arlington led the nation in numerical
population growth with an estimated population increase of 146,532, with
Dallas-Plano-Irving showing an estimated increase of 97,036 and Fort
Worth-Arlington showing an estimated increase of
49,496. Houston-Sugarland-Baytown was second in the nation in
numerical population growth with an estimated increase of
130,185. Austin-Round Rock had an estimated population growth of
60,012. San Antonio ranked fifteenth with an estimated population
growth of 46,524 over this same period. The percentage increase in
population for these major Texas cities ranged from 2.34% to 3.77%.
As stated
earlier, the Texas economy has added a net of nearly three quarters of a million
new jobs over the past five years. However, due to the national and
global recession, the Texas economy has begun to slow, beginning in the fourth
quarter of 2008 and continuing through the first three quarters of
2009. Over the twelve month period ending September 2009, the United
States Department of Labor reported that Texas lost approximately 303,700 jobs
and the unemployment rate is 8.2%, up from 5.1% in September
2008. However, the same source states that, nationally, the United
States lost approximately 5,785,000 jobs over that same period, and the
unemployment rate rose to 9.8% from 6.2% in September 2008.
The Texas
Workforce Commission reports that as of September 2009, the unemployment rate
for Austin-Round Rock, Texas was 7.2%, up from 4.6% in September 2008;
Dallas-Fort Worth-Arlington, Texas was 8.3%, up from 5.2%; Houston-Sugar
Land-Baytown, Texas was 8.5%, up from 5.1%; and San Antonio, Texas was 7.1%, up
from 4.9%. In the most recent quarter, Austin experienced a net
loss of 5,500 jobs year-over-year for the twelve month period ending September
30, 2009. During those same 12 months, Houston, Dallas-Fort Worth,
and San Antonio experienced net losses of 76,700, 64,500, and 9,200 jobs,
respectively. However, these cities have added an estimated net total
of 617,000 jobs over the past five years. Austin added 103,700; Dallas-Fort
Worth added 209,800; Houston added 221,800; and San Antonio added
81,700.
Due to
the national and global recession, we believe that Texas will likely suffer a
net loss of jobs in 2009. The National Bureau of Economic Research
has concluded that the U.S. economy entered into a recession in December 2007,
ending an economic expansion that began in November 2001. We believe
that the transition from month-over-month and year-over-year job gains in Texas,
to year-over-year and month-over-month job losses indicates that the Texas
economy has slowed significantly, beginning in the fourth
quarter of 2008 when we believe Texas followed the nation into
recession. However, we also believe that the Texas economy will
continue to outperform the national economy. According to the Texas
Workforce Commission, Texas tends to enter into recessions after the national
economy has entered a recession and usually leads among states in the economic
recovery. In the current downturn, Texas’ recession trailed the
national recession by nearly a year, and the state economy now looks poised for
recovery. Dallas Federal Reserve’s Index of Texas leading indicators has
steadily improved since reaching a low in March 2009 and independent reports and
forecasts are now predicting that Texas MSAs will be among the first to recover
based on employment figures, gross metropolitan product, and home
prices.
In sharp
contrast to the conditions of many homebuilding markets in the country where
unsold housing inventory remains a challenge, new home sales are greater than
new home starts in Texas markets, indicating that home builders in Texas are
focused on preserving a balance between new home demand and new home
supply. Home builders and developers in Texas have remained
disciplined on new home construction and project development. New
home starts have been declining year-over-year and are outpaced by new home
sales in all of our Texas markets where such data is
available. Inventories of finished new homes and total new housing
(finished vacant, under construction, and model homes) remain at generally
healthy and balanced levels in all four major Texas markets, Austin, Dallas-Fort
Worth, Houston, and San Antonio. Each major Texas market is
experiencing a rise in the number of months of finished lot inventories as
homebuilders continue to reduce the number of new home starts, with each major
Texas market reaching elevated levels. Houston has an estimated
inventory of finished lots of approximately 44.6 months, Austin has an estimated
inventory of finished lots of approximately 49.4 months, San Antonio has an
estimated inventory of finished lots of approximately 61.9 months, and
Dallas-Fort Worth has an estimated inventory of finished lots of approximately
81.0 months. A 24-28 month supply is considered equilibrium for
finished lot supplies.
24
The
recent rise in month’s supply of finished lot inventory in Texas markets owes
itself principally to the decrease in the pace of annual starts rather than an
increase in the raw number of developed lots. Indeed, the number of
finished lots dropped by more than 1,200 lots in Austin and San Antonio, more
than 2,000 in Houston, and by more than 3,500 lots in Dallas-Fort Worth in the
third quarter of 2009. Annual starts in each of the Austin, San
Antonio, Houston, and Dallas-Fort Worth markets continue to outpace lot
deliveries. With the discipline evident in these markets, we expect
to see a continued decline in raw numbers of finished lot inventories in coming
quarters as new projects have been significantly reduced.
Texas
markets continue to be some of the strongest homebuilding markets in the
country, though home building in Texas has weakened over the past
year. While the decline in housing starts has caused vacant lot
inventory to become elevated from its previously balanced position, it has also
maintained a balance in the housing inventory. Annual new home sales
in Austin outpace starts 8,107 versus 6,888, with annual new home sales
declining year-over-year by approximately 31.60%. Finished housing
inventory and total new housing inventory (finished vacant, under construction
and model homes) rose to elevated levels of 2.7 months and 7.3 months,
respectively. The generally accepted equilibrium levels for finished
housing inventory and total new housing inventory are a 2-to-2.5 month supply
and a 6.0 month supply, respectively. Like Austin, San Antonio is
also a healthy homebuilding market. Annual new home sales in San
Antonio outpace starts 8,486 versus 7,408, with annual new home sales declining
year-over-year by approximately 19.56%. Finished housing inventory
remained at a healthy level with a 2.3 month supply – within the considered
equilibrium level. Total new housing inventory rose to a slightly elevated 6.4
month supply. Houston, too, is a relatively healthy homebuilding
market. Annual new home sales there outpace starts 23,116 versus
18,458, with annual new home sales declining year-over-year by approximately
33.08%. Finished housing inventory and total new housing inventory
are slightly above equilibrium at a 3.24 month supply and a 7.2 month supply,
respectively. Dallas-Fort Worth is a healthy homebuilding market as
well. Annual new home sales in Dallas-Fort Worth outpace starts
18,055 versus 13,107, with annual new home sales declining year-over-year by
approximately 33.35%. Finished housing inventory declined slightly to
a 3.1 month supply while total new housing inventory rose to a 6.9 month supply,
respectively, each measurement slightly above the considered equilibrium
level. All numbers are as publicly released by Residential
Strategies, Inc. or Metrostudy, leading providers of primary and secondary
market information.
The Real
Estate Center at Texas A&M University has reported that the sales of
existing homes remain relatively healthy in our Texas markets, as
well. Though the year-over-year sales pace has fallen between 11% and
16% in each of the four largest Texas markets, inventory levels have generally
remained stable. In September, the number of months of home inventory
for sale in Austin, Houston, Dallas, Fort Worth, and Lubbock was 6.4 months, 6.5
months, 6.3 months, 6.7 months, and 5.5 months, respectively. San
Antonio’s inventory is more elevated with an 8.1 month supply of homes for
sale. A 6-month supply of inventory is considered a balanced market
with more than 6 months of inventory generally being considered a buyer’s market
and less than 6 months of inventory generally being considered a seller’s
market. Through September 2009, the number of existing homes sold
year-to-date in (a) Austin is 15,651, down 15% year-over-year; (b) San Antonio
is 13,889, down 11% year-over-year; (c) Houston is 44,561, down 14%
year-over-year, (d) Dallas is 34,285, down 16% year-over-year, (e) Fort Worth is
6,288, down 20% year-over-year, and (f) Lubbock is 2,508, down 7%
year-over-year.
In
managing and understanding the markets and submarkets in which we make loans, we
monitor the fundamentals of supply and demand. We track the economic
fundamentals in each of the respective markets, analyzing demographics,
household formation, population growth, employment, migration, immigration, and
housing affordability. We also watch movements in home prices and the
presence of market disruption activity, such as investor or speculator activity
that can create a false impression of demand and result in an oversupply of
homes in a market. Further, we study new home starts, new home
closings, finished home inventories, finished lot inventories, existing home
sales, existing home prices, foreclosures, absorption, prices with respect to
new and existing home sales, finished lots and land, and the presence of sales
incentives, discounts, or both, in a market.
25
Generally,
the residential homebuilding industry is cyclical and highly sensitive to
changes in broader economic conditions, such as levels of employment, consumer
confidence, income, availability of financing for acquisition, construction, and
permanent mortgages, interest rate levels, and demand for
housing. The condition of the resale market for used homes, including
foreclosed homes, also has an impact on new home sales. In general,
housing demand is adversely affected by increases in interest rates, housing
costs, and unemployment and by decreases in the availability of mortgage
financing or in consumer confidence, which can occur for numerous reasons,
including increases in energy costs, interest rates, housing costs, and
unemployment.
We face a
risk of loss resulting from deterioration in the value of the land purchased by
the developer with the proceeds of loans from us, a diminution of the site
improvement and similar reimbursements used to repay loans made by us, and a
decrease in the sales price of the single-family residential lots developed with
the proceeds of loans from us. Deterioration in the value of the
land, a diminution of the site improvement and similar reimbursements, and a
decrease in the sales price of the residential lots can occur in cases where the
developer pays too much for the land to be developed, the developer is unable or
unwilling to develop the land in accordance with the assumptions required to
generate sufficient income to repay the loans made by us, or is unable to sell
the residential lots to homebuilders at a price that allows the developer to
generate sufficient income to repay the loans made by us.
Our
general partner actively monitors the markets and submarkets in which we make
loans, including mortgage markets, homebuilding economies, the supply and demand
for homes, finished lots, and land and housing affordability to mitigate such
risks. Our general partner also actively manages our loan portfolio
in the context of events occurring with respect to the loan and in the market
and submarket in which we made the loan. We anticipate that there may
be defaults on development loans made by us and that we will take action with
respect to such defaults at any such time that we determine it prudent to do so,
including such time as we determine it prudent to maintain and protect the value
of the collateral securing a loan by originating another development loan to
another developer with respect to the same project to maintain and protect the
value of the collateral securing our initial loan.
We face a
risk of loss resulting from adverse changes in interest
rates. Changes in interest rates may affect both demand for our real
estate finance products and the rate of interest on the loans we
make. In most instances, the loans we make will be junior in the
right of repayment to senior lenders, who will provide loans representing 70% to
80% of total project costs. As senior lender interest rates available
to our borrowers increase, demand for our mortgage loans may decrease, and vice
versa.
Developers
to whom we make mortgage loans use the proceeds of such loans to develop raw
real estate into residential home lots. The developers obtain the
money to repay these development loans by selling the residential home lots to
home builders or individuals who will build single-family residences on the
lots, receiving qualifying site improvement reimbursements, and by obtaining
replacement financing from other lenders. If interest rates increase,
the demand for single-family residences may decrease. Also, if
mortgage financing underwriting criteria become stricter, demand for
single-family residences may decrease. In such an interest rate
and/or mortgage financing climate, developers may be unable to generate
sufficient income from the resale of single-family residential lots to repay
loans from us, and developers’ costs of funds obtained from lenders in addition
to us may increase as well. If credit markets deteriorate, developers
may not be able to obtain replacement financing from other
lenders. Accordingly, increases in single-family mortgage interest
rates, decreases in the availability of mortgage financing, or decreases in the
availability of replacement financing could increase the number of defaults on
development loans made by us.
Our general partner is not aware of any
material trends or uncertainties, favorable or unfavorable, other than national
economic conditions affecting real estate and interest rates generally, that it
reasonably anticipates to have a material impact on either the income to be
derived from our investments in mortgage loans or entities that make mortgage
loans, other than those referred to in this Quarterly Report on Form
10-Q. The disruption of mortgage markets, in combination with a
significant amount of negative national press discussing turmoil in mortgage
markets and the poor condition of the national housing industry, including
declining home prices, have made potential new home purchasers and real estate
lenders very cautious. The economic downturn that continues to occur,
the failure of highly respected financial institutions, significant decline in
equity markets around the world, unprecedented administrative and legislative
actions in the United States, and actions taken by central banks around the
globe to stabilize the economy have further caused many prospective home
purchasers in our markets to postpone their purchases. In summary, we
believe there is a general lack of urgency to purchase homes in these times of
economic uncertainty. We believe that this has further slowed the
sales of new homes and expect that this will result in a slowing of the sales of
finished lots developed by our clients in certain markets; however, we do not
anticipate the prices of those lots changing materially. We also
expect that the decrease in the availability of replacement financing may
increase the number of defaults on development loans made by us or extend the
time period anticipated for the repayment of our loans.
26
Off-Balance
Sheet Arrangements
In
February 2009, the Partnership deposited $1.5 million into the Deposit Account
with LegacyTexas for the purpose of providing collateral to LegacyTexas for the
benefit of UMTH Lending Company. The Partnership provided LegacyTexas
a security interest in the Deposit Account as further collateral for the Loan
obtained by UMTH Lending from LegacyTexas. In consideration of the
Partnership providing the Deposit Account as collateral for the Loan, UMTH
Lending agreed to pay the Partnership a fee equal to 3% per annum of the amount
outstanding in the Deposit Account, paid in 12 monthly installments per year for
each year that the Deposit Account secures the Loan. This Deposit
Account is included as restricted cash on our balance sheet. These
fees are included in our credit enhancement fees – related party income
account.
In August
2009, the Partnership entered into the UDF III Guaranty for the benefit of Texas
Capital, or its permitted successors and assigns, by which the Partnership
guarantied the repayment of up to $5 million owed to Texas Capital with respect
to that certain promissory note between UMT Home Finance and Texas Capital
Bank. UMT Home Finance is a wholly owned subsidiary of
UMT. An affiliate of the Partnership’s general partner serves as the
advisor to UMT. In connection with the UDF III Guaranty, the
Partnership entered into a letter agreement with UMT Home Finance which provides
for UMT Home Finance to pay the Partnership annually, in advance, an amount
equal to 1.0% of the maximum exposure of the Partnership under the UDF III
Guaranty (i.e., $50,000 per annum). These fees are included in our
credit enhancement fees – related party income account.
As of
September 30, 2009, we had funded 55 loans, including 18 loans that have been
repaid by the respective borrower in full, totaling approximately $428
million. As of September 30, 2009, we have approximately $50.1
million of commitments to be funded, including $31.3 million to related parties
under the terms of mortgage notes receivable and participation
interest. As of December 31, 2008, we had funded 49 loans, including
14 loans that have been repaid by the respective borrower in full, totaling
approximately $386 million. As of December 31, 2008, we had
approximately $56.4 million of commitments to be funded, including $25.3 million
to related parties under the terms of mortgage notes receivable and
participation interest.
Item 3. Quantitative and Qualitative
Disclosures About Market Risk.
Market
risk is the exposure to loss resulting from adverse changes in market prices,
interest rates, foreign currency exchange rates, commodity prices and equity
prices. A significant market risk to which we are exposed is interest
rate risk, which is sensitive to many factors, including governmental monetary
and tax policies, domestic and international economic and political
considerations, and other factors beyond our control. Changes in
interest rates may impact both demand for our real estate finance products and
the rate of interest on the loans we make. Another significant market
risk is the market price of finished lots. The market price of
finished lots is driven by the demand for new single-family homes and the supply
of unsold homes and finished lots in a market. The change in one or
both of these factors can have a material impact on the cash realized by our
borrowers and resulting collectability of our loans and interest.
27
Demand
for our mortgage loans and the amount of interest we collect with respect to
such loans depends on the ability of borrowers of real estate development loans
to sell single-family lots developed with the proceeds of the loans to
homebuilders.
The
single-family lot and residential homebuilding market is highly sensitive to
changes in interest rate levels. As interest rates available to
borrowers increase, demand for mortgage loans decreases, and vice
versa. Housing demand is also adversely affected by increases in
housing prices and unemployment and by decreases in the availability of mortgage
financing. In addition, from time to time, there are various
proposals for changes in the federal income tax laws, some of which would remove
or limit the deduction for home mortgage interest. If effective
mortgage interest rates increase and/or the ability or willingness of
prospective buyers to purchase new homes is adversely affected, the demand for
new homes may also be negatively affected. As a consequence, demand
for and the performance of our real estate finance products may also be
adversely impacted.
As of
September 30, 2009, our mortgage notes receivable, net, of approximately $190.2
million, mortgage notes receivable – related party, net, of approximately $56.5
million, and participation interest – related party of approximately $52.5
million were all at fixed interest rates, and thus, such mortgage notes
receivable, including mortgage notes receivable – related party, and
participation interest – related party are not subject to change in future
earnings, fair values or cash flows. As of December 31, 2008, our
mortgage notes receivable, net, of approximately $169.8 million, mortgage notes
receivable – related party, net, of approximately $43.3 million, and
participation interest – related party of approximately $39.3 million were all
at fixed interest rates, and thus, such mortgage notes receivable, including
mortgage notes receivable – related party, and participation interest – related
party are not subject to change in future earnings, fair values or cash
flows.
We seek
to mitigate our single-family lot and residential homebuilding market risk by
closely monitoring economic, project market, and homebuilding
fundamentals. We review a variety of data and forecast sources,
including public reports of homebuilders, mortgage originators and real estate
finance companies; financial statements of developers; project appraisals;
proprietary reports on primary and secondary housing market data, including
land, finished lot, and new home inventory and prices and concessions, if any;
and information provided by government agencies, the Federal Reserve Bank, the
National Association of Home Builders, the National Association of Realtors,
public and private universities, corporate debt rating agencies, and
institutional investment banks regarding the homebuilding industry and the
prices of and supply and demand for single-family residential
homes.
In
addition, we further seek to mitigate our single-family lot and residential
homebuilding market risk by assigning an asset manager to each mortgage
note. This asset manager is responsible for monitoring the progress
and performance of the borrower and the project as well as assessing the status
of the marketplace and value of our collateral securing repayment of our
mortgage loan.
See the
“Management’s Discussion and Analysis of Financial Condition and Results of
Operations” section of this Form 10-Q for further discussion regarding our
exposure to market risks.
Evaluation
of Disclosure Controls and Procedures
As
required by Rule 13a-15(b) and Rule 15d-15(b) under the Securities Exchange Act
of 1934, as amended (the “Exchange Act”), the management of Land Development,
our general partner, including its principal executive officer and principal
financial officer, evaluated, as of September 30, 2009, the effectiveness of our
disclosure controls and procedures as defined in Exchange Act Rule 13a-15(e) and
Rule 15d-15(e). Based on that evaluation, the principal executive
officer and the principal financial officer of our general partner concluded
that our disclosure controls and procedures, as of September 30, 2009, were
effective for the purpose of ensuring that information required to be disclosed
by us in this report is recorded, processed, summarized and reported within the
time periods specified by the rules and forms of the Exchange Act and is
accumulated and communicated to management, including the principal executive
officer and the principal financial officer of our general partner, as
appropriate to allow timely decisions regarding required
disclosures.
We
believe, however, that a controls system, no matter how well designed and
operated, can only provide reasonable assurance, and not absolute assurance,
that the objectives of the controls system are met, and an evaluation of
controls can provide only reasonable assurance, and not absolute assurance, that
all control issues and instances of fraud or error, if any, within a partnership
have been detected.
Changes
in Internal Control over Financial Reporting
There have been no changes in our
internal controls over financial reporting that occurred during the
three months ended September 30, 2009 that have materially affected, or are
reasonably likely to materially affect, our internal control over financial
reporting.
28
OTHER INFORMATION
We are
not a party to, and none of our assets are subject to, any material pending
legal proceedings.
There
have been no material changes from the risk factors set forth in our Annual
Report on Form 10-K as filed with the Securities and Exchange
Commission.
Use
of Proceeds from Registered Securities
We did
not have any unregistered sales of securities during the nine months ended
September 30, 2009. On May 15, 2006, our Registration Statement on
Form S-11 (Registration No. 333-127891), covering a public offering of up to
12,500,000 units of limited partnership interest at a price of $20 per unit, was
declared effective under the Securities Act of 1933, as amended. The
Registration Statement also covered up to 5,000,000 units of limited partnership
interest to be issued pursuant to our DRIP for $20 per unit. We had
the right to reallocate the units of limited partnership interest we were
offering between the primary offering and our DRIP, and pursuant to Supplement
No. 8 to our prospectus regarding the Offering, which was filed with the
Securities and Exchange Commission on September 4, 2008, we reallocated the
units being offered to be 16,250,000 units offered pursuant to the primary
offering and 1,250,000 units offered pursuant to the DRIP. Pursuant
to Supplement No. 11 to our prospectus regarding the Offering, which was filed
with the Securities and Exchange Commission on March 6, 2009, we further
reallocated the units being offered to be 16,500,000 units offered pursuant to
the primary offering and 1,000,000 units offered pursuant to the
DRIP. The aggregate offering price for the units was $350 million.
The primary offering component of the Offering was terminated on April 23,
2009. We extended the offering of our units of limited partnership
interest pursuant to our DRIP until the earlier of the sale of all units of
limited partnership interest being offered pursuant to our DRIP or May 15,
2010; provided, however, that our general partner was permitted to terminate the
offering of units pursuant to our DRIP at any earlier time.
On June
9, 2009, we held a Special Meeting of our limited partners as of April 13, 2009,
at which our limited partners approved three proposals to amend certain
provisions of our Partnership Agreement for the purpose of making
available additional units of limited partnership interest for sale
pursuant to an Amended and Restated Distribution Reinvestment
Plan. On June 12, 2009, we registered 5,000,000 additional units to
be offered pursuant to our Secondary DRIP in a Registration Statement on Form
S-3 (File No. 333-159939). As such, we ceased offering units under
the DRIP portion of the Offering as of July 21, 2009 and concurrently
commenced our current offering of units pursuant to the Secondary
DRIP.
As of
September 30, 2009, we have issued an aggregate of 17,095,630 units of limited
partnership interest in the Offering and the Secondary DRIP, consisting of
16,499,994 units that have been issued to our limited partners pursuant to our
primary offering in exchange for gross proceeds of approximately
$330.3 million, 716,260 units of limited partnership interest issued to
limited partners in accordance with our DRIP in exchange for gross proceeds of
approximately $14.3 million and 157,627 units of limited partnership interest
issued to limited partners in accordance with our Secondary DRIP in exchange for
gross proceeds of approximately $3.2 million, minus 278,251 units of limited
partnership interest that have been repurchased pursuant to our unit redemption
program for approximately $5.6 million. The net offering proceeds to
us, after deducting approximately $39.6 million of offering costs, are
approximately $290.7 million. Of the offering costs, approximately
$11.2 million was paid to our general partner or affiliates of our general
partner for organization and offering expenses and $28.4 million was paid to
non-affiliates for selling commissions and other offering fees. As of
September 30, 2009, we had funded 55 loans, including 18 loans that have been
repaid by the respective borrower in full, totaling approximately $428
million. We have approximately $50.1 million of commitments to be
funded, including $31.3 million to related parties, under the terms of mortgage
notes receivable and participation interest. We paid our general
partner approximately $9.2 million for acquisition and origination fee expenses
associated with the mortgage notes receivable.
29
Unit
Redemption Program
Our
general partner has adopted a unit redemption program for our
investors. The purchase price for the redeemed units is set forth in
the prospectus for the Offering, as supplemented. Our general partner
reserves the right in its sole discretion at any time and from time to time to
(1) waive the one-year holding period in the event of the death or bankruptcy of
a limited partner or other exigent circumstances, (2) reject any request for
redemption, (3) change the purchase price for redemptions, or (4) terminate,
suspend and/or reestablish our unit redemption program. Under the
terms of the program, we will not redeem in excess of 5% of the weighted average
number of units outstanding during the twelve-month period immediately prior to
the date of redemption. Our general partner will determine from time
to time whether we have sufficient excess cash from operations to repurchase
units. Generally, the cash available for redemption will be limited
to 1% of the operating cash flow from the previous fiscal year, plus any net
proceeds from our DRIP or Secondary DRIP.
On July
8, 2009, we modified our unit redemption program such that, effective June 30,
2009, in order to conserve cash and in response to increasing requests for
redemptions, we will limit our redemptions primarily to those requested as a
result of death and exigent circumstances, to the extent our general partner
determines there are sufficient funds to redeem units. In addition,
we intend to make redemptions on a quarterly basis, as opposed to a monthly
basis.
No units
of limited partnership interest were repurchased during the quarter ended
September 30, 2009.
Item
3. Defaults Upon Senior Securities.
None.
Item
4. Submission of Matters to a Vote of Security Holders.
None.
Item
5. Other Information.
None.
Item 6. Exhibits.
The
exhibits filed in response to Item 601 of Regulation S-K are listed on the Index
to Exhibits attached hereto.
30
SIGNATURES
Pursuant
to the requirements of the Securities Exchange Act of 1934, the registrant has
duly caused this report to be signed on its behalf by the undersigned thereunto
duly authorized.
United
Development Funding III, L.P.
By: UMTH
Land Development,
L.P.
Its General Partner
Dated: November
16,
2009 By: /s/ Hollis M.
Greenlaw
Hollis M.
Greenlaw
Chief
Executive Officer, and President and Chief Executive Officer of UMT Services,
Inc., sole general partner of UMTH Land Development, L.P.
(Principal
Executive Officer)
By: /s/ Cara D.
Obert
Cara D.
Obert
Chief
Financial Officer
(Principal
Financial Officer)
31
Index to Exhibits
Exhibit
Number Description
|
3.1
|
Second
Amended and Restated Agreement of Limited Partnership of Registrant
(previously filed in and incorporated by reference to Exhibit B to
prospectus dated May 15, 2006, filed pursuant to Rule 424(b)(3) on May 18,
2006)
|
|
3.2
|
Certificate
of Limited Partnership of Registrant (previously filed in and incorporated
by reference to Registrant’s Registration Statement on Form S-11,
Commission File No. 333-127891, filed on August 26,
2005)
|
|
3.3
|
First
Amendment to Second Amended and Restated Agreement of Limited Partnership
of Registrant (previously filed in and incorporated by reference to
Exhibit B to Supplement No. 12 to prospectus dated May 15, 2006, contained
within Post-Effective Amendment No. 4 to Registrant’s Registration
Statement on Form S-11, Commission File No. 333-127891, filed on May
12, 2009)
|
|
3.4
|
Second
Amendment to Second Amended and Restated Agreement of Limited Partnership
of Registrant (previously filed in and incorporated by reference to Form
8-K filed on June 10, 2009)
|
|
4.1
|
Subscription
Agreement (previously filed in and incorporated by reference to Exhibit C
to Supplement No. 12 to prospectus dated May 15, 2006, contained within
Post-Effective Amendment No. 4 to Registrant’s Registration Statement on
Form S-11, Commission File No. 333-127891, filed on May 12,
2009)
|
|
4.2
|
Amended
and Restated Distribution Reinvestment Plan (previously filed in and
incorporated by reference to Registrant’s Registration Statement on Form
S-3, Commission File No. 333-159939, filed on June 12,
2009)
|
|
10.1
|
Loan
and Security Agreement between Registrant, as Borrower, and Wesley J.
Brockhoeft, as Lender, dated as of September 21, 2009 (filed
herewith)
|
|
31.1
|
Rule
13a-14(a)/15d-14(a) Certification of Principal Executive Officer (filed
herewith)
|
|
31.2
|
Rule
13a-14(a)/15d-14(a) Certification of Principal Financial Officer (filed
herewith)
|
|
32.1*
|
Section
1350 Certifications (furnished
herewith)
|
|
|
|
*
|
In
accordance with Item 601(b)(32) of Regulation S-K, this Exhibit is not
deemed “filed” for purposes of Section 18 of the Exchange Act or otherwise
subject to the liabilities of that section. Such certifications
will not be deemed incorporated by reference into any filing under the
Securities Act of 1933, as amended, or the Exchange Act, except to the
extent that the registrant specifically incorporates it by
reference.
|
|
|
32