Attached files
| file | filename |
|---|---|
| 8-K - MAA INVESTOR PRESENTATION NOVEMBER 2009 - MID AMERICA APARTMENT COMMUNITIES INC. | form8-k.htm |

November
2009
2
• Positive
15-Year Track Record
– Top-Tier Returns to
Shareholders
– Proven Strong
Operator
– S&P Small-Cap
600
– Stable Management;
Long Tenure
– Strong Corporate
Governance
• Disciplined
Capital Deployment
– Value
Investor
– Extensive Network
& Deal Flow
– Proven Success with
Joint Ventures
• High
Quality Multifamily Portfolio
– High Growth Sunbelt
Region Focus
– Young Portfolio (~
15 years)
– Two-Tier Market
Strategy
• Strong
Balance Sheet
– Capacity to Pursue
Opportunities
– Superior
Ratios
• Dividend
Payout
• Leverage
• Fixed
Charge
– Debt Financing
Covered through 2010
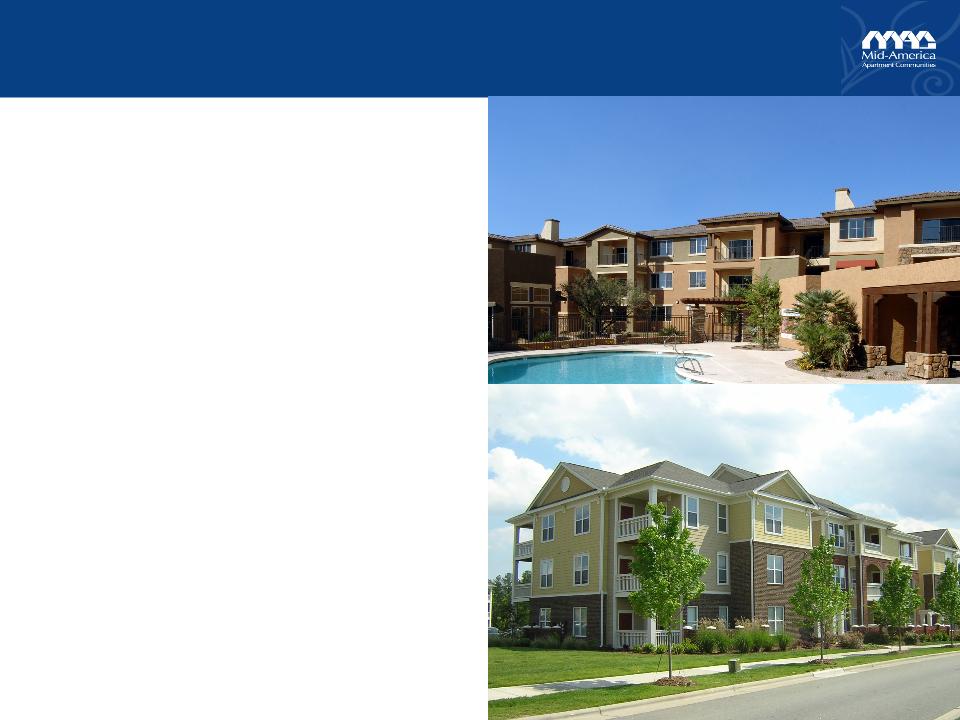
Talus
Ranch, Phoenix, AZ
Providence
at Brier Creek, Raleigh, NC
Strong
Public Company Platform

3
Six+
Year Timeframe Inclusive of
Recovery/Strong
Market Cycle and
Weakening
Market Cycle
Full
Cycle Performance
• MAA began
re-positioning its portfolio
in 2003 resulting in a profile that is
well positioned to compete favorably
in ‘up’ cycles while also holding up
better in ‘down’ cycles
in 2003 resulting in a profile that is
well positioned to compete favorably
in ‘up’ cycles while also holding up
better in ‘down’ cycles
• MAA’s operating
platform has been
significantly strengthened through
expanded asset management focus,
commitment to new technologies and
improved efficiencies
significantly strengthened through
expanded asset management focus,
commitment to new technologies and
improved efficiencies
• MAA’s average
same-store NOI
growth 2003 - 2009 (1st half)
growth 2003 - 2009 (1st half)
– Out-performing the
sector mean
– Strong relative
performance in both
‘up cycle’ and more recent ‘down
cycle’ market environment
‘up cycle’ and more recent ‘down
cycle’ market environment
– MAA has delivered
third strongest
operating performance since 2003
operating performance since 2003
4
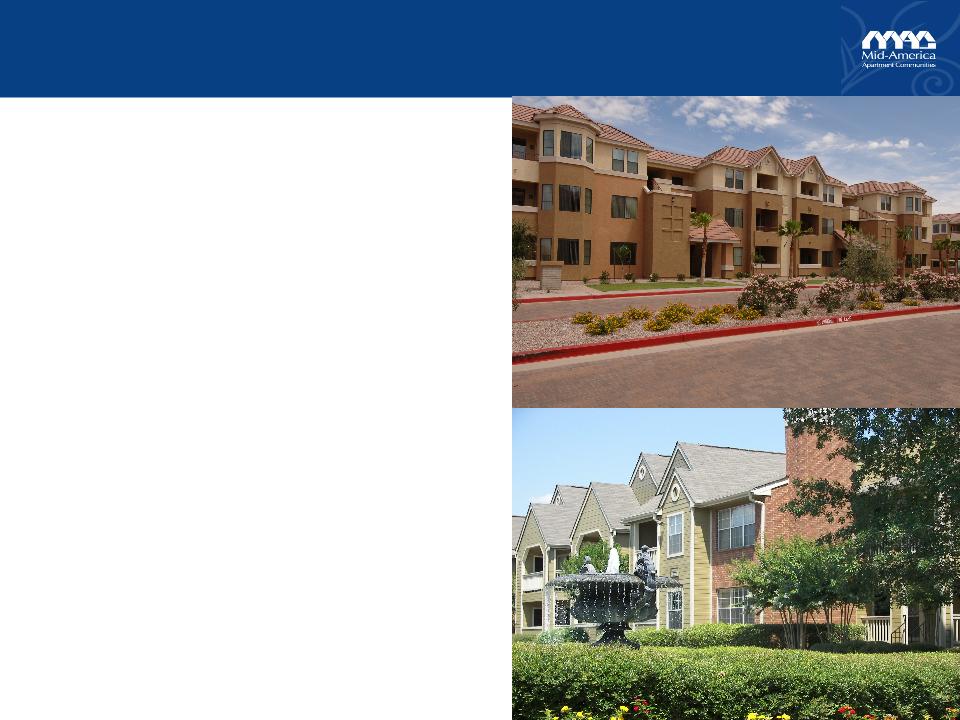
Edge
at Lyon’s Gate, Phoenix, AZ
Eagle
Ridge, Birmingham, AL
Increased
full year FFO guidance based
on
solid core performance
Strong
Third Quarter Results
• FFO per share of
$0.89; top-end of guidance
range
range
• Same store physical
occupancy at 96.0%;
70 basis points ahead of prior year
70 basis points ahead of prior year
• Strong FFO results
driven primarily by better
than expected same store performance; NOI
down 2.1% on prior year comparison
than expected same store performance; NOI
down 2.1% on prior year comparison
• Increased full year
guidance $0.09 per share
($3.74 mid-point); increase over prior year
($3.74 mid-point); increase over prior year
• Fixed charge
coverage ratio at a third quarter
record of 2.59; up from 2.49 at the same point
in prior year
record of 2.59; up from 2.49 at the same point
in prior year
• Completed the
renovation and repositioning of
514 units capturing rent increases averaging
10%
514 units capturing rent increases averaging
10%
• Mid-America
Multifamily Fund II makes initial
investment
investment
• New ancillary income
programs drive 6.8%
growth in fee income
growth in fee income

5
Near-Term Outlook
and 2009 Forecast
• Leasing is expected
to be challenged over the next few quarters as a result of
weak employment conditions
weak employment conditions
– Weak pricing power
has been off-set to some degree with strong occupancy and
expense performance (lower resident turnover)
expense performance (lower resident turnover)
• As a result of
marking rents to market over the course of 2009, until we cycle
through the leases written in 2009 and begin to re-price inventory to what is
expected to be an improving pricing environment in mid to late 2010, the
“math” will work against revenue performance over the next several quarters
through the leases written in 2009 and begin to re-price inventory to what is
expected to be an improving pricing environment in mid to late 2010, the
“math” will work against revenue performance over the next several quarters
• Off-set to weak
pricing trends captured through year-over-year improvement in
occupancy and expense performance will be more challenged in 2010
occupancy and expense performance will be more challenged in 2010
• More upside in
ancillary fee programs in 2010 will help
• Lower expense trends
fueled by lower resident turnover is likely close to
‘bottoming out’
‘bottoming out’
• Expect to see
positive momentum in revenues emerge late 2010

6
Source: Witten
Advisors
Recovery
begins in 2010 and outlook very strong for 2011 and 2012
Strong
Long-Term Outlook
• Eventual recovery in
employment trends will generate a rapid recovery in NOI
– Pent-up demand;
rapid growth of echo boomers; prime rental demographic
• New apartment starts
are predicted to hit a post-WW II low
– Lack of financing;
investment returns insufficient as construction costs stay robust
• Single family home
ownership likely to remain relatively constrained
– Higher
down-payments; tighter credit; higher mortgage interest rates
• Home ownership
currently 67.5% of households
– Peaked at 69.5%; may
revert to more sustainable 30 year level of 64.5%
– Each 1% movement is
1.1 million households
7
|
National MSA
Average
|
1.1%
|
|
Sunbelt Region
MSA Average
|
1.5%
|
Employment Growth
Projections 2009 - 2013
Annual
Compounded Growth Rates
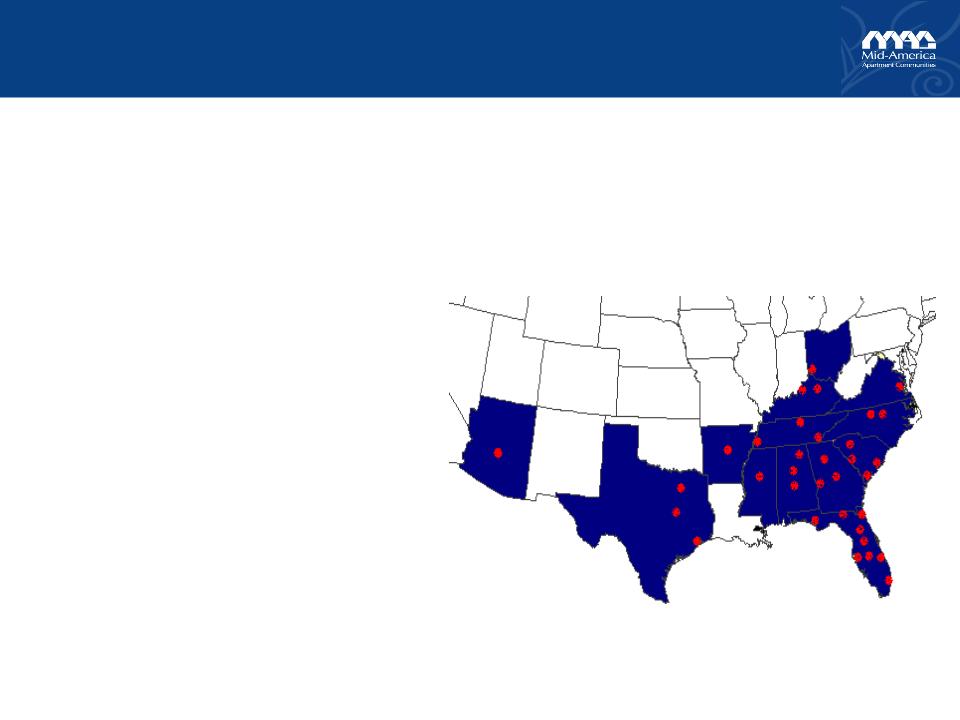
MAA in
7 of the top 10 projected “Echo Boom Household” Markets:
Dallas,
Houston, Atlanta, Phoenix, Austin, South FL, Orlando.
Source: Economy.com
Well
Positioned For Recovery Cycle
• Positive demographic
flows
• Positive migration,
immigration flows
• Low business/living
costs
• Pro-business
regulatory environment
• Good access to
global markets
• Increasing port of
entry for imports
• Good transportation
infrastructure
• Access to skilled
labor
• Diversified
industrial base with
exposure
to
– Financial
industries
– Health/education
– Global
trade
– Leisure
travel
– High
tech
– Logistics
– Manufacturing

8
• 85% of the
properties owned by the Apartment REIT
Sector are concentrated in 25 national markets
Sector are concentrated in 25 national markets
• MAA’s markets -
concentrated in the high growth
Sunbelt region, including a large presence in many of
these “top 25” markets (58% of portfolio) as well as
diversification in other high growth secondary markets
throughout the region - are forecast to out-perform
Sunbelt region, including a large presence in many of
these “top 25” markets (58% of portfolio) as well as
diversification in other high growth secondary markets
throughout the region - are forecast to out-perform
Most
Concentrated Markets Among
The
Multifamily REIT
(sorted
by # of units)
1. Baltimore/Wash
D.C.
2. Los
Angeles
3. San Francisco Bay
Area
4. Atlanta
*
5. Dallas/Ft. Worth
*
6. New York Metro
Area
7. Orlando
*
8. Seattle
9. SE Florida
*
10. Phoenix
*
11. Tampa *
12. Boston
13. San
Diego
14. Denver
15. Houston
*
16. Philadelphia
17. Raleigh
*
18. Austin
*
19. Jacksonville
*
20. Charlotte
21. Chicago
22. Inland
Empire
23. Indianapolis
24. Nashville
*
25. Richmond
* MAA
Market
Source:
Economy.com
Positioned to
Out-Perform - Demand

9
New
Multifamily Supply Projections (REIS Data)
|
Market
|
Average
Annual
Supply (#
of Units)
1999-2009
|
Projected
Average
Annual
Supply
(#
of Units)
2010-2013
|
%
Drop in Average
Annual
Supply
|
|
MAA Markets
(*)
|
58,698
|
24,304
|
59%
|
|
Primary REIT
Markets
|
88,155
|
43,549
|
51%
|
|
United
States
|
129,372
|
68,363
|
47%
|
|
West
Region
|
33,767
|
19,940
|
41%
|
|
Northeast
Region
|
12,395
|
6,792
|
45%
|
|
Midwest
Region
|
13,134
|
7,199
|
45%
|
*
Represents over 75% of MAA’s portfolio
While
delivery of new supply over the next few years is expected to drop
significantly
in most every market across the country, MAA’s portfolio is
particularly
well positioned to see lower levels of new supply pressure.
Positioned to
Out-Perform - Supply
10
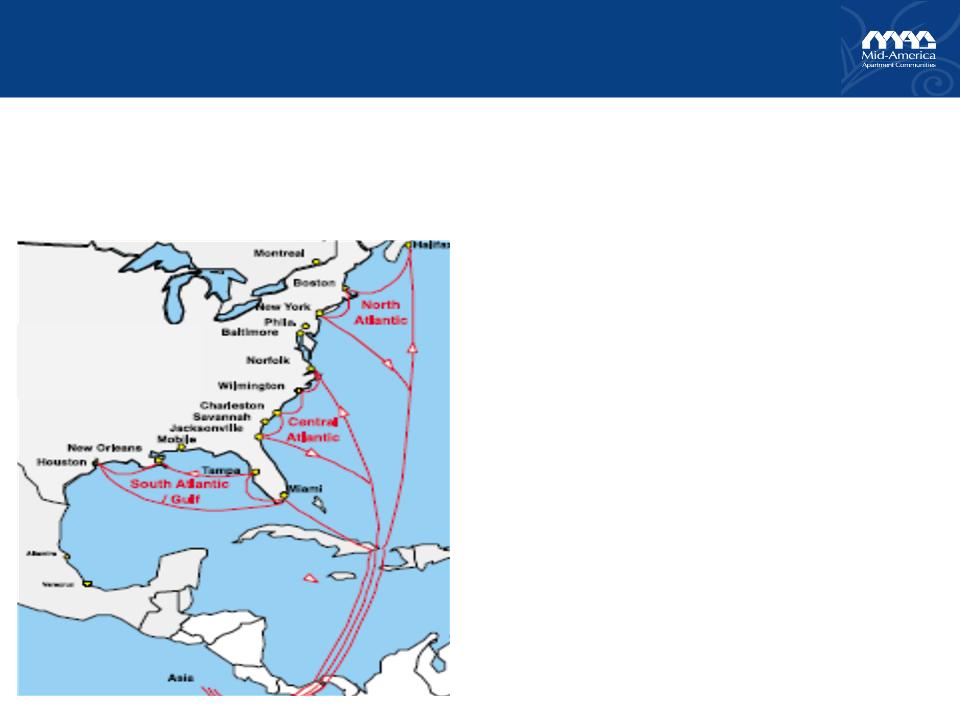
• The Panama canal is
currently undergoing a $5
billion expansion that will allow ships triple the size
of current capacity to pass.
billion expansion that will allow ships triple the size
of current capacity to pass.
• Currently, these
ships port on the West Coast or
reach the East Coast via the Suez Canal.
reach the East Coast via the Suez Canal.
• These ships will now
have a more direct, cost
efficient route to the Gulf Coast and the East Coast.
efficient route to the Gulf Coast and the East Coast.
• The combination of a
well developed rail and truck
delivery network, coupled with the closer access to
the majority of U.S. population (east of the MS
River), makes port access to the U.S. via the Gulf
Coast and East Coast attractive.
delivery network, coupled with the closer access to
the majority of U.S. population (east of the MS
River), makes port access to the U.S. via the Gulf
Coast and East Coast attractive.
• In addition, lower
labor costs, lower taxes and
greater expansion capabilities, makes the Gulf and
Southeast markets very attractive for business
expansion.
greater expansion capabilities, makes the Gulf and
Southeast markets very attractive for business
expansion.
• This route is
expected to gain an increasing market
share, creating jobs and spurring economic
development for the Southeast and affected ports.
share, creating jobs and spurring economic
development for the Southeast and affected ports.
• Ports impacted
include Houston, Tampa, Miami,
Jacksonville, Savannah, Charleston, and Norfolk.
Jacksonville, Savannah, Charleston, and Norfolk.
• Many of these ports
are already beginning upgrades
and dredging projects to accommodate increased
traffic.
and dredging projects to accommodate increased
traffic.
Port
cities likely
to
benefit
Expansion of Panama
Canal Expected
To
Create Additional Long-Term
Employment Growth
For The Southeast
Positioned to
Out-Perform

11
Technology
platform supports efforts to both optimize revenue growth
and
better control expenses
Prospects/Resident
Contact
Pricing
& Fees Optimization
Resident
Screening
Inventory
Management
Billing
& Collections
Well
Positioned For Recovery Cycle
• Pricing
system
– Supported strong
occupancy while achieving optimal pricing in a weak
leasing environment
leasing environment
– Enabled more
comprehensive analysis of ‘market environment’ and leads
to higher quality and faster decision making
to higher quality and faster decision making
– Enabled more
differentiation in ‘price points’ and thereby created more
revenue opportunity without adding complexity for on-site staff
revenue opportunity without adding complexity for on-site staff
• Fee
programs
– Bulk-cable roll-out
has been well received
– New billing platform
has supported opportunity to capture higher fees
without compromising occupancy or turnover
without compromising occupancy or turnover
– “In house” utility
reimbursement billing driven more cost efficiency
• Resident screening
and collections
– Creating more
efficiencies with on-site staff time
– More controlled
lease application review without compromising timing
– Quicker and more
effective collection efforts
• Efficient prospect
and resident contact
– Web based traffic
> 50% of total
– On-line leasing
driving more traffic and driving down cost per new lease
– Electronic payment
processing improving collections efforts and on-site
time
time
• Lower turn
costs
– Inventory management
more efficient
– “Make ready”
process
12
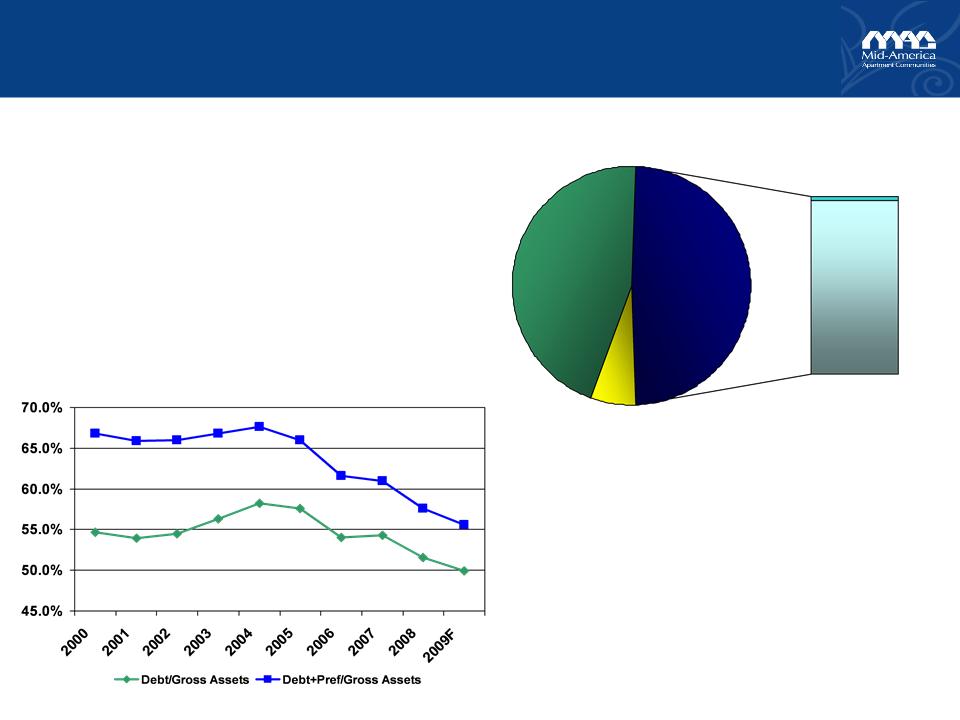
• Leverage and ratios
at historically
strong levels
strong levels
• Plenty of capacity -
$177 MM unused
• No 2009 refinancing,
only $50 MM
(bank line) for 2010 (well underway)
(bank line) for 2010 (well underway)
• Agency loan
maturities well laddered
2011 - 2018
2011 - 2018
Capital
Structure - 9/30/2009
Common
45%
6%
Preferred
Debt
49%
Agency
Debt
97%
Other
Debt
3%
|
|
|
Sector
|
|
|
MAA
|
Median
|
|
Fixed
Charge Coverage
|
2.59
|
2.5
|
|
FFO
Payout ratio 2009
|
66%
|
*
|
|
Debt/Gross
Assets
|
49%
|
57%
|
Sources:
Sector data from Barclays Capital 10-29-09
MAA
3Q Press Release
*Sector
Median impacted by stock dividends and dividend reductions
Strong
Balance Sheet Position

13
Grand
Courtyards, Dallas, TX
Lanier
Club, Atlanta, GA
External Growth
Opportunities
• Improving
opportunities for
attractive acquisitions
attractive acquisitions
– Distressed
markets
– Distressed
lease-ups
– Failed condo/condo
conversions
– Pending refinancing
requirement
• MAA
has balance sheet capacity
– Credit facilities in
place at pre-crisis
pricing
pricing
– Lowest leverage
since the IPO
• Fund
Management
– Fund II: a new $250
MM (total
investment) value-add fund
investment) value-add fund
– MAA share
33%
– Focus on existing
MAA foot-print
– 7+ year-old assets,
6-year hold
– First acquisition
completed in July

14
Lighthouse
Court, Jacksonville, FL
Georgetown
Grove, Savannah, GA
External Growth
Opportunities
• Competitive
advantage over other potential
buyers; particularly in some of select
secondary markets
buyers; particularly in some of select
secondary markets
• MAA’s acquisition
team sources an average
of 200-300 potential acquisition opportunities
each year
of 200-300 potential acquisition opportunities
each year
• Since late 2002, we
have closed on $1 billion
worth of acquisitions
worth of acquisitions
• Ability to move
quickly and with fewer
contingencies than many other private and
less well capitalized buyers
contingencies than many other private and
less well capitalized buyers
• Strong, positive and
long track record with
sellers in the region
sellers in the region
• Best opportunities
at the moment with ‘less
than stabilized’ properties
than stabilized’ properties
• Evidence growing
that newer, high quality
and stabilized properties are trading in the 6
cap range
and stabilized properties are trading in the 6
cap range
• Values likely to
hold and increase
– Cash flows set to
improve in late 2010 and
grow meaningfully in 2011+
grow meaningfully in 2011+
– Long-term
demographics are compelling
– Investor and capital
interest in apartment real
estate likely to increase
estate likely to increase

15
Strong
Management and Governance
• Long-planned CFO
transition effective January 1st
– Al Campbell promoted
to CFO; 11+ years with company; well prepared
– Simon Wadsworth
continues as a Director & Special Advisor to the CEO
– Management depth,
length of tenure, and company commitment to succession
planning facilitates transition
planning facilitates transition
• Active succession
planning and ‘back-up’ assessment processes
• Active leadership
development program
– Strong bench
strength with top 26 managers employed at MAA 11+ avg. years
– Active ‘promotion
from within’ culture and track record
• Very strong Board of
Directors
– Six independent
directors with extensive backgrounds in public company
governance, capital markets, accounting/finance, leadership development, real
estate investing
governance, capital markets, accounting/finance, leadership development, real
estate investing
– MAA’s corporate
governance rating exceeds 90% of the S&P 600 and 91% of
real estate group companies
real estate group companies
16
Village
Oaks, Tampa, FL
Prescott,
Atlanta, GA
MAA
Offers An Attractive Value
• Currently trading at
an implied price
per unit of approximately $65k
per unit of approximately $65k
– Replacement value of
$110k - $120k
– $110k/unit generates
price/share of $105
• Currently trading at
an implied cap rate
in the range of 6.8 - 7.0
in the range of 6.8 - 7.0
– 6.0 cap rate
generates a price/share of $55
• MAA very well
positioned for the
recovery in leasing conditions
recovery in leasing conditions
– Region/Markets will
out-perform
– Balance sheet
strength with capacity
– Strong dividend and
coverage ratios
– Forecast of rapid
market growth 2011-2013
– Limited new supply
risks
• Relative to size and
balance sheet
capacity, MAA offers one of the more
compelling external growth stories in
the sector
capacity, MAA offers one of the more
compelling external growth stories in
the sector

17
ü MAA
Is a Proven Platform
• 15+
Years as a Public Company
• Strong
Operating Platform
• Top-Tier
Performance for Shareholders
• Full
Cycle Performer
ü Opportunity
to Invest Ahead of Recovery
• Balance
Sheet is Strong, With Capacity
• Fund
II New Growth Opportunities
• Strong
Deal Flow
ü Young
Portfolio with Growth Upside
• Invested
in Fastest-Growing Markets
• Portfolio
Provides Stable Earnings
• Superior
Risk-Adjusted Performance
• Positioned
for a Recovering Economy
ü Disciplined
Capital Allocation Drives High
Quality of Earnings
Quality of Earnings
ü Strong
Coverage Ratios and Liquidity
ü MAA’s
Earnings Outlook and Implied Cap
Rate Provide an Attractive Relative
Opportunity Within the Apt Sector
Rate Provide an Attractive Relative
Opportunity Within the Apt Sector
St.
Augustine, Jacksonville, FL
Sky
View Ranch, Phoenix, AZ
Summary

18
Statements
contained in this presentation, which are not historical facts, are
forward-looking statements, as the term is defined in the Private
Securities Litigation Reform Act of 1995. Such forward-looking statements are subject to risks and uncertainties which can cause actual results to
differ materially from those currently anticipated, due to a number of factors, which include, but are not limited to, unfavorable changes in the
apartment market, changing economic conditions, the impact of competition, acquisitions which may not achieve anticipated results and other risk
factors discussed in documents filed with the Securities and Exchange Commission from time to time including the Company’s Annual Report on
Form 10-K and the Company’s Quarterly Report on Form 10-Q. The statements in this presentation are made based upon information currently
known to management and the company assumes no obligation to update or revise any of its forward-looking statements.
Watermark,
Dallas, TX
Safe
Harbor Disclosure