Attached files
| file | filename |
|---|---|
| 8-K - FORM 8-K - FIRST COMMONWEALTH FINANCIAL CORP /PA/ | d8k.htm |
Exhibit 99.1
First Commonwealth
Mid-West Investor Meetings
November 9, 2009
FOX-PITT KELTON
COCHRAN CARONIA WALLER
Institutional Clients
Forward-looking Statements
This presentation contains forward-looking statements that describe our future plans, strategies and expectations. Forward-looking statements can be identified by the fact that they do not relate strictly to historical or current facts. They often include words such as “believe,” “expect,” “anticipate,” “intend,” “plan,” “estimate” or words of similar meaning, or future or conditional verbs such as “will,” “would,” “should,” “could” or “may.” All forward-looking statements are based on assumptions and involve risks and uncertainties, many of which are beyond our control and which may cause our actual results, performance or achievements to differ materially from the results, performance or achievements contemplated by the forward-looking statements. These risks and uncertainties include, among other things:
Continued weakness in economic and business conditions, nationally and in our market areas, which could increase credit- related losses and expenses and/or limit growth.
Further declines in the market value of investment securities that are considered to be other-than-temporary, which would negatively impact our earnings and capital levels.
Increases in defaults by borrowers and other delinquencies could result in increases in our provision for credit losses and related expenses.
Changes in legislative or regulatory requirements applicable to us and our subsidiaries could increase costs, limit certain operations and adversely affect results of operations.
Fluctuations in interest rates and market prices could reduce our net interest margin and asset valuations and increase our expenses.
Reduced wholesale funding capacity or higher borrowing costs due to capital constraints at the Federal Home Loan Bank, which would reduce our liquidity and negatively impact earnings and net interest margin.
Competitive pressures among depository and other financial institutions nationally and in our market areas may increase significantly.
Our inability to manage growth effectively, including the successful expansion of our customer support, administrative infrastructure and internal management systems, could adversely affect our results of operations and prospects.
The inability to successfully execute our strategic growth initiatives, which could limit further revenue and earnings growth.
Changes in tax requirements, including tax rate changes, new tax laws and revised tax law interpretations may increase our tax expense or adversely affect our customers’ businesses.
The consequences of continued bank acquisitions and mergers in our market areas, resulting in fewer but much larger and financially stronger competitors, could increase competition for financial services to our detriment.
Other risks and uncertainties described in this presentation and the other reports that First Commonwealth files with the Securities and Exchange Commission, including its most recent Annual Report on Form 10-K.
In light of these risks, uncertainties and assumptions, you should not place undue reliance on any forward-looking statements in this presentation. We undertake no obligation to publicly update or otherwise revise any forward-looking statements, whether as a result of new information, future events or otherwise.
First Commonwealth
2
Company Information
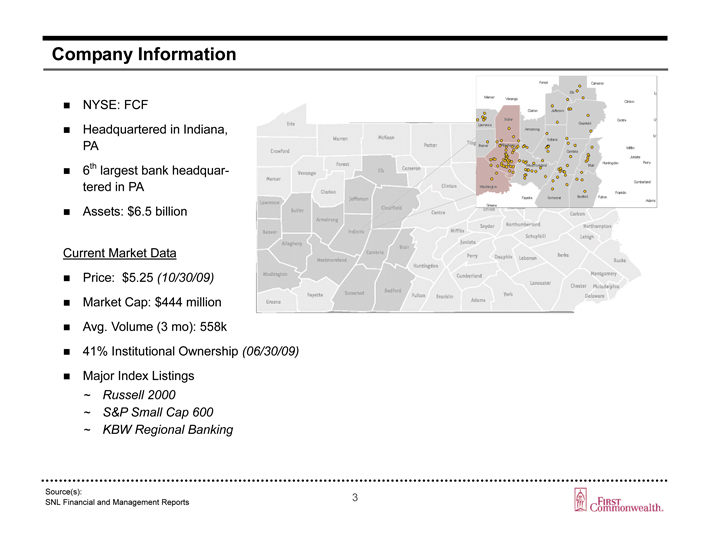
NYSE: FCF
Headquartered in Indiana, PA
6th largest bank headquartered in PA
Assets: $6.5 billion
Current Market Data
Price: $5.25 (10/30/09)
Market Cap: $444 million
Avg. Volume (3 mo): 558k
41% Institutional Ownership (06/30/09)
Major Index Listings
~ Russell 2000
~ S&P Small Cap 600
~ KBW Regional Banking
Source(s):
SNL Financial and Management Reports
First Commonwealth
3
Summary of 3Q09 Earnings
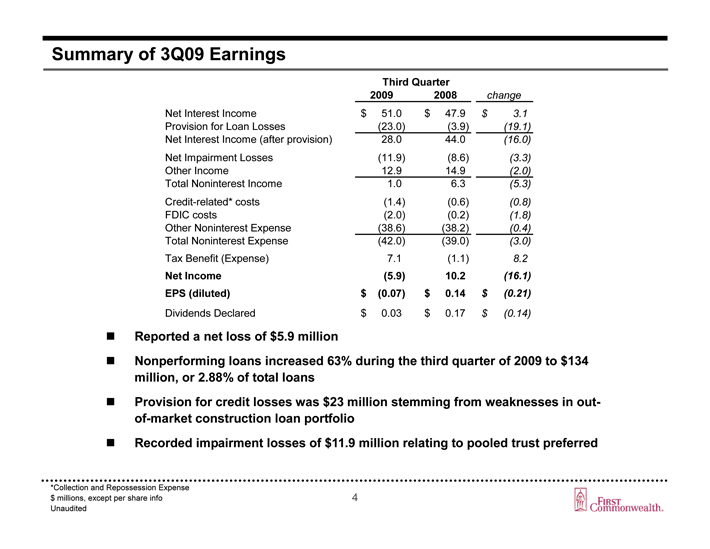
Third Quarter 2009 2008 change
Net Interest Income $ 51.0 $ 47.9 $ 3.1
Provision for Loan Losses (23.0) (3.9) (19.1)
Net Interest Income (after provision) 28.0 44.0 (16.0)
Net Impairment Losses (11.9) (8.6) (3.3)
Other Income 12.9 14.9 (2.0)
Total Noninterest Income 1.0 6.3 (5.3) Credit-related* costs (1.4) (0.6) (0.8)
FDIC costs (2.0) (0.2) (1.8)
Other Noninterest Expense (38.6) (38.2) (0.4)
Total Noninterest Expense (42.0) (39.0) (3.0)
Tax Benefit (Expense) 7.1 (1.1) 8.2
Net Income (5.9) 10.2 (16.1)
EPS (diluted) $ (0.07) $ 0.14 $ (0.21)
Dividends Declared $ 0.03 $ 0.17 $ (0.14)
Reported a net loss of $5.9 million
Nonperforming loans increased 63% during the third quarter of 2009 to $134 million, or 2.88% of total loans
Provision for credit losses was $23 million stemming from weaknesses in out-of-market construction loan portfolio
Recorded impairment losses of $11.9 million relating to pooled trust preferred
*Collection and Repossession Expense
$ millions, except per share info Unaudited
4
First Commonwealth
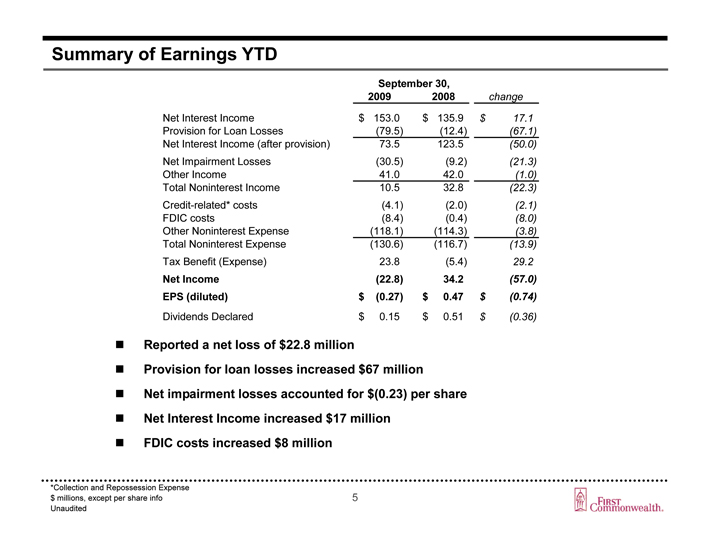
Summary of Earnings YTD
September 30,
2009 2008 change
Net Interest Income $ 153.0 $ 135.9 $ 17.1
Provision for Loan Losses (79.5) (12.4) (67.1)
Net Interest Income (after provision) 73.5 123.5 (50.0)
Net Impairment Losses (30.5) (9.2) (21.3)
Other Income 41.0 42.0 (1.0)
Total Noninterest Income 10.5 32.8 (22.3)
Credit-related* costs (4.1) (2.0) (2.1)
FDIC costs (8.4) (0.4) (8.0)
Other Noninterest Expense (118.1) (114.3) (3.8)
Total Noninterest Expense (130.6) (116.7) (13.9)
Tax Benefit (Expense) 23.8 (5.4) 29.2
Net Income (22.8) 34.2 (57.0)
EPS (diluted) $ (0.27) $ 0.47 $ (0.74)
Dividends Declared $ 0.15 $ 0.51 $ (0.36)
Reported a net loss of $22.8 million
Provision for loan losses increased $67 million
Net impairment losses accounted for $(0.23) per share
Net Interest Income increased $17 million
FDIC costs increased $8 million
*Collection and Repossession Expense
$ millions, except per share info
Unaudited
5
First Commonwealth
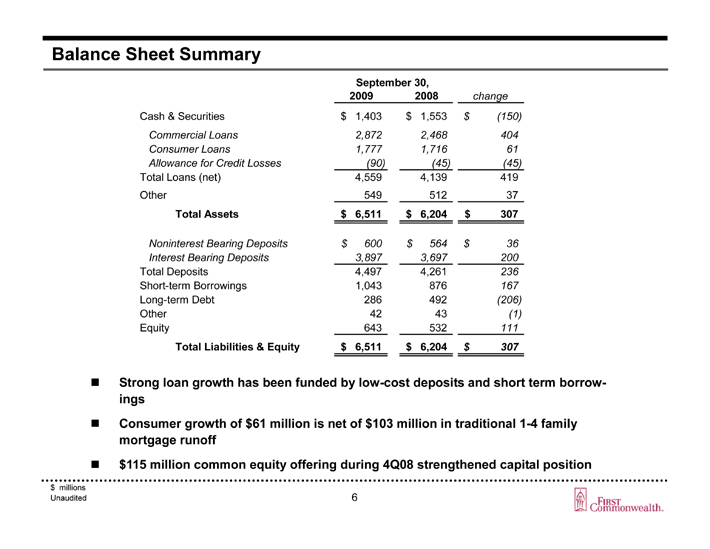
Balance Sheet Summary
September 30,
2009 2008 change
Cash & Securities $ 1,403 $ 1,553 $ (150)
Commercial Loans 2,872 2,468 404
Consumer Loans 1,777 1,716 61
Allowance for Credit Losses (90) (45) (45)
Total Loans (net) 4,559 4,139 419
Other 549 512 37
Total Assets $ 6,511 $ 6,204 $ 307
Noninterest Bearing Deposits $ 600 $ 564 $ 36
Interest Bearing Deposits 3,897 3,697 200
Total Deposits 4,497 4,261 236
Short-term Borrowings 1,043 876 167
Long-term Debt 286 492 (206)
Other 42 43 (1)
Equity 643 532 111
Total Liabilities & Equity $ 6,511 $ 6,204 $ 307
Strong loan growth has been funded by low-cost deposits and short term borrowings
Consumer growth of $61 million is net of $103 million in traditional 1-4 family mortgage runoff
$115 million common equity offering during 4Q08 strengthened capital position
$ millions Unaudited
6
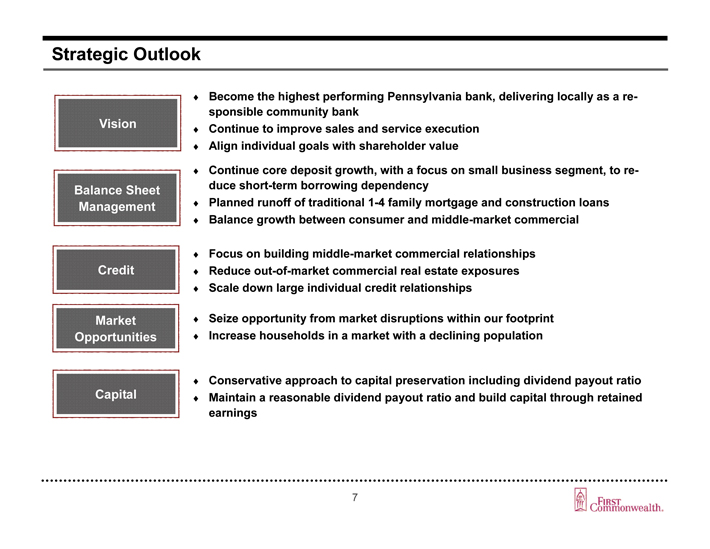
Strategic Outlook
Vision
Become the highest performing Pennsylvania bank, delivering locally as a responsible community bank
Continue to improve sales and service execution
Align individual goals with shareholder value
Balance Sheet Management
Continue core deposit growth, with a focus on small business segment, to reduce short-term borrowing dependency
Planned runoff of traditional 1-4 family mortgage and construction loans
Balance growth between consumer and middle-market commercial
Credit
Focus on building middle-market commercial relationships
Reduce out-of-market commercial real estate exposures
Scale down large individual credit relationships
Market Opportunities
Seize opportunity from market disruptions within our footprint
Increase households in a market with a declining population
Capital
Conservative approach to capital preservation including dividend payout ratio
Maintain a reasonable dividend payout ratio and build capital through retained earnings
First Commonwealth
7
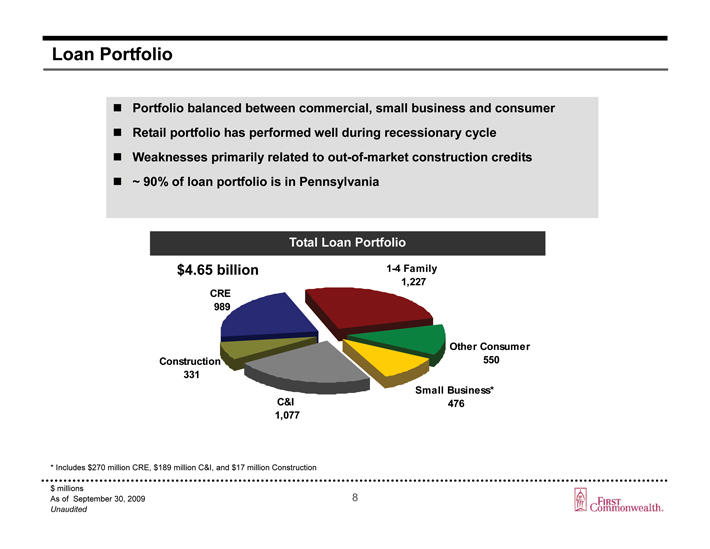
Loan Portfolio
Portfolio balanced between commercial, small business and consumer
Retail portfolio has performed well during recessionary cycle
Weaknesses primarily related to out-of-market construction credits
~ 90% of loan portfolio is in Pennsylvania
Total Loan Portfolio
$4.65 billion
CRE 989
1-4 Family
1,227
Construction 331
Other Consumer 550
C&I 1,077
Small Business* 476
* Includes $270 million CRE, $189 million C&I, and $17 million Construction
$ millions
As of September 30, 2009
Unaudited
8
First Commonwealth
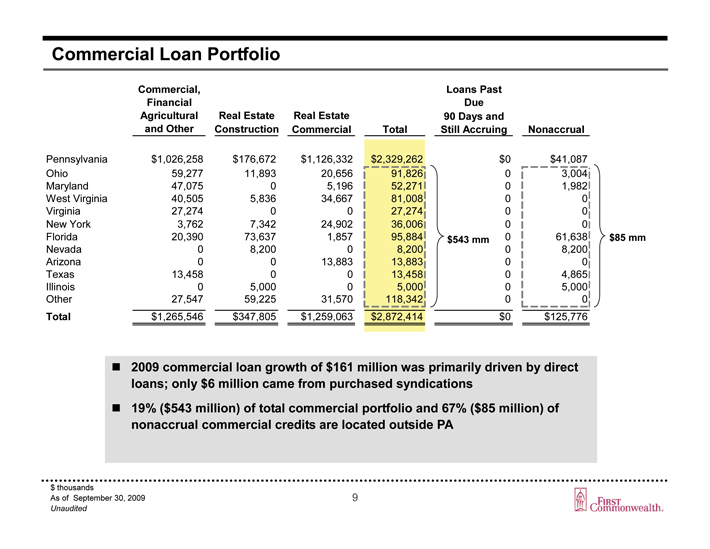
Commercial Loan Portfolio
Commercial, Financial Agricultural and Other
Real Estate Construction
Real Estate Commercial
Total
Loans Past Due 90 Days and Still Accruing
Nonaccrual
Pennsylvania $1,026,258 $176,672 $1,126,332 $2,329,262 $0 $41,087
Ohio 59,277 11,893 20,656 91,826 0 3,004
Maryland 47,075 0 5,196 52,271 0 1,982
West Virginia 40,505 5,836 34,667 81,008 0 0
Virginia 27,274 0 0 27,274 0 0
New York 3,762 7,342 24,902 36,006 0 0
Florida 20,390 73,637 1,857 95,884 $543 mm 0 61,638 $85 mm
Nevada 0 8,200 0 8,200 0 8,200
Arizona 0 0 13,883 13,883 0 0
Texas 13,458 0 0 13,458 0 4,865
Illinois 0 5,000 0 5,000 0 5,000
Other 27,547 59,225 31,570 118,342 0 0
Total $1,265,546 $347,805 $1,259,063 $2,872,414 $0 $125,776
2009 commercial loan growth of $161 million was primarily driven by direct loans; only $6 million came from purchased syndications
19% ($543 million) of total commercial portfolio and 67% ($85 million) of nonaccrual commercial credits are located outside PA
$ thousands
As of September 30, 2009
Unaudited
9
First Commonwealth
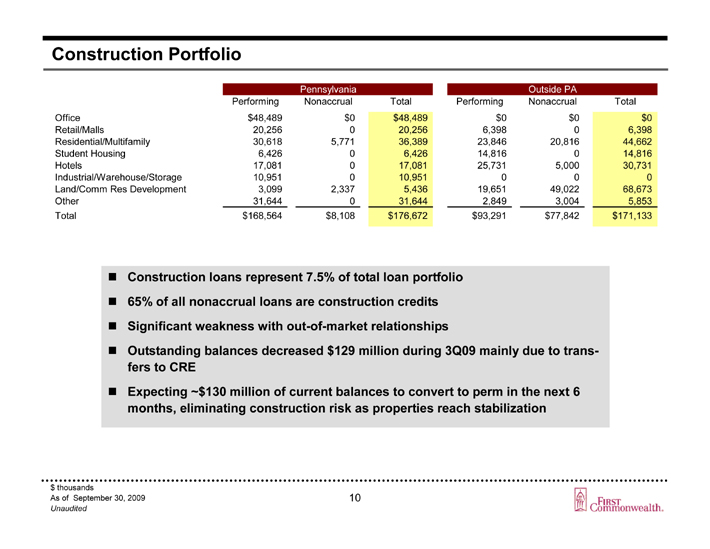
Construction Portfolio
Pennsylvania Outside PA
Performing Nonaccrual Total Performing Nonaccrual Total
Office $48,489 $0 $48,489 $0 $0 $0
Retail/Malls 20,256 0 20,256 6,398 0 6,398
Residential/Multifamily 30,618 5,771 36,389 23,846 20,816 44,662
Student Housing 6,426 0 6,426 14,816 0 14,816
Hotels 17,081 0 17,081 25,731 5,000 30,731
Industrial/Warehouse/Storage 10,951 0 10,951 0 0 0
Land/Comm Res Development 3,099 2,337 5,436 19,651 49,022 68,673
Other 31,644 0 31,644 2,849 3,004 5,853
Total $168,564 $8,108 $176,672 $93,291 $77,842 $171,133
Construction loans represent 7.5% of total loan portfolio
65% of all nonaccrual loans are construction credits
Significant weakness with out-of-market relationships
Outstanding balances decreased $129 million during 3Q09 mainly due to transfers to CRE
Expecting ~$130 million of current balances to convert to perm in the next 6 months, eliminating construction risk as properties reach stabilization
$ thousands
As of September 30, 2009
Unaudited
10
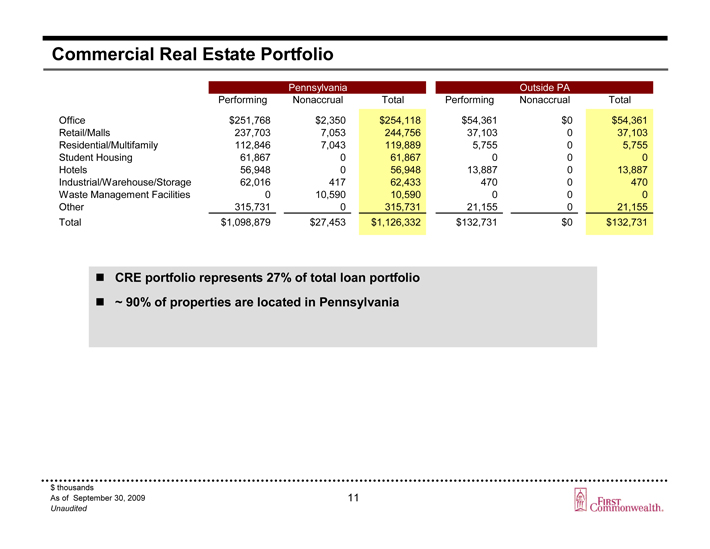
Commercial Real Estate Portfolio
Pennsylvania Outside PA
Performing Nonaccrual Total Performing Nonaccrual Total
Office $251,768 $2,350 $254,118 $54,361 $0 $54,361
Retail/Malls 237,703 7,053 244,756 37,103 0 37,103
Residential/Multifamily 112,846 7,043 119,889 5,755 0 5,755
Student Housing 61,867 0 61,867 0 0 0
Hotels 56,948 0 56,948 13,887 0 13,887
Industrial/Warehouse/Storage 62,016 417 62,433 470 0 470
Waste Management Facilities 0 10,590 10,590 0 0 0
Other 315,731 0 315,731 21,155 0 21,155
Total $1,098,879 $27,453 $1,126,332 $132,731 $0 $132,731
CRE portfolio represents 27% of total loan portfolio
90% of properties are located in Pennsylvania
$ thousands
As of September 30, 2009
Unaudited
11
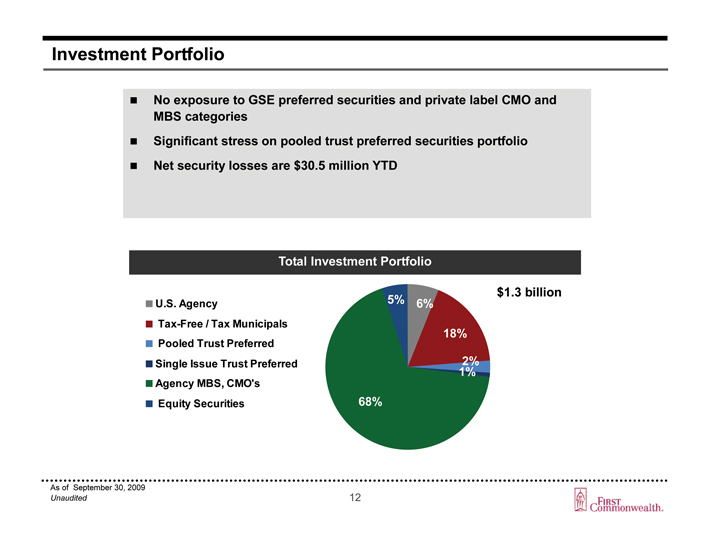
Investment Portfolio
No exposure to GSE preferred securities and private label CMO and MBS categories
Significant stress on pooled trust preferred securities portfolio
Net security losses are $30.5 million YTD
Total Investment Portfolio
U.S. Agency
Tax-Free / Tax Municipals
Pooled Trust Preferred
Single Issue Trust Preferred
Agency MBS, CMO’s Equity Securities
$1.3 billion
As of September 30, 2009 Unaudited
12
First Commonwealth
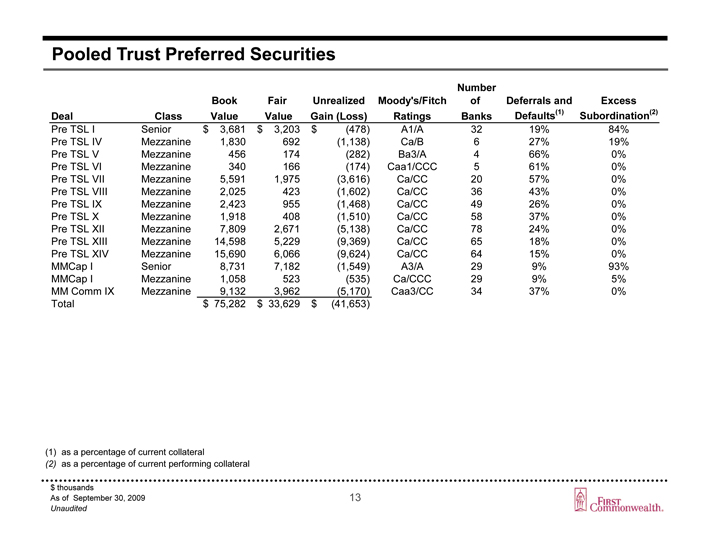
Pooled Trust Preferred Securities
Number
Book Fair Unrealized Moody’s/Fitch of Deferrals and Excess Defaults(1) Subordination(2) Deal Class Value Value Gain (Loss) Ratings Banks
Pre TSL I Senior $ 3,681 $ 3,203 $ (478) A1/A 32 19% 84% Pre TSL IV Mezzanine 1,830 692 (1,138) Ca/B 6 27% 19% Pre TSL V Mezzanine 456 174 (282) Ba3/A 4 66% 0% Pre TSL VI Mezzanine 340 166 (174) Caa1/CCC 5 61% 0% Pre TSL VII Mezzanine 5,591 1,975
(3,616) Ca/CC 20 57% 0% Pre TSL VIII Mezzanine 2,025 423 (1,602) Ca/CC 36 43% 0% Pre TSL IX Mezzanine 2,423 955 (1,468) Ca/CC 49 26% 0% Pre TSL X Mezzanine 1,918 408 (1,510) Ca/CC 58 37% 0% Pre TSL XII Mezzanine 7,809 2,671 (5,138) Ca/CC 78 24% 0% Pre TSL XIII Mezzanine 14,598 5,229 (9,369) Ca/CC 65 18% 0% Pre TSL XIV Mezzanine 15,690 6,066 (9,624) Ca/CC 64 15% 0% MMCap I Senior 8,731 7,182 (1,549) A3/A 29 9% 93% MMCap I Mezzanine 1,058 523 (535) Ca/CCC 29 9% 5% MM Comm IX Mezzanine 9,132 3,962 (5,170) Caa3/CC 34 37% 0% Total $ 75,282 $ 33,629 $ (41,653)
(1) as a percentage of current collateral
(2) as a percentage of current performing collateral
$ thousands
As of September 30, 2009
Unaudited
13
First Commonwealth
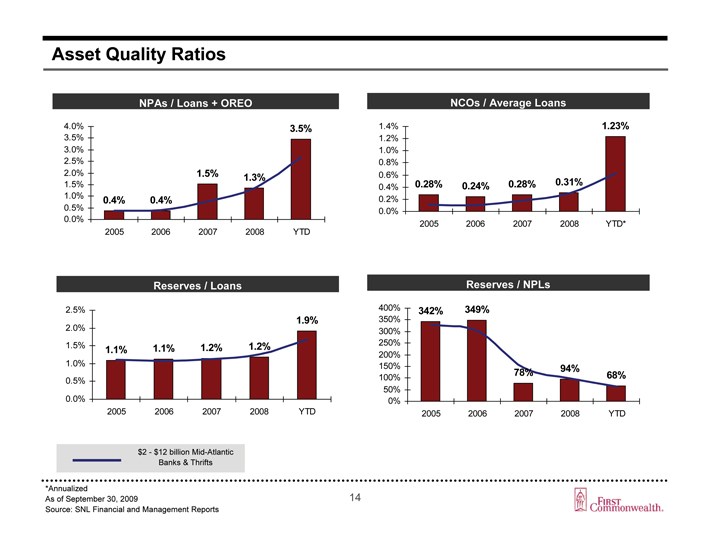
Asset Quality Ratios
NPAs / Loans + OREO NCOs / Average Loans
Reserves / Loans Reserves / NPLs
*Annualized
As of September 30, 2009
Source: SNL Financial and Management Reports
14
First Commonwealth
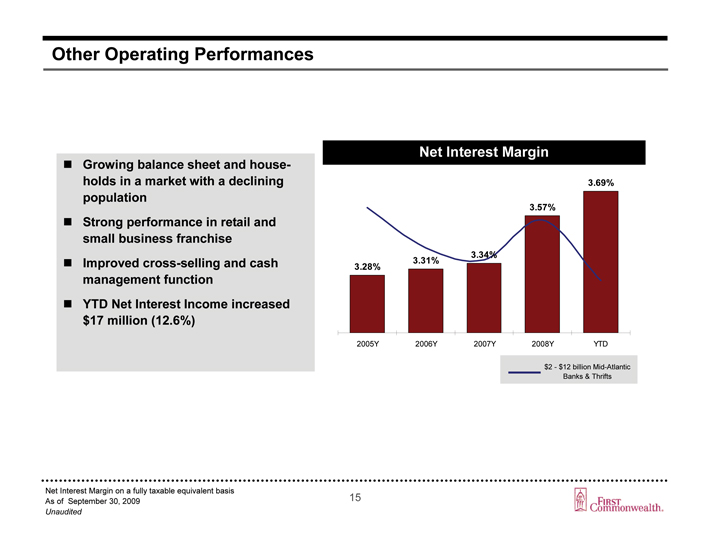
Other Operating Performances
Growing balance sheet and households in a market with a declining population
Strong performance in retail and small business franchise
Improved cross-selling and cash management function
YTD Net Interest Income increased $17 million (12.6%)
Net Interest Margin
Net Interest Margin on a fully taxable equivalent basis
As of September 30, 2009
Unaudited
15
First Commonwealth
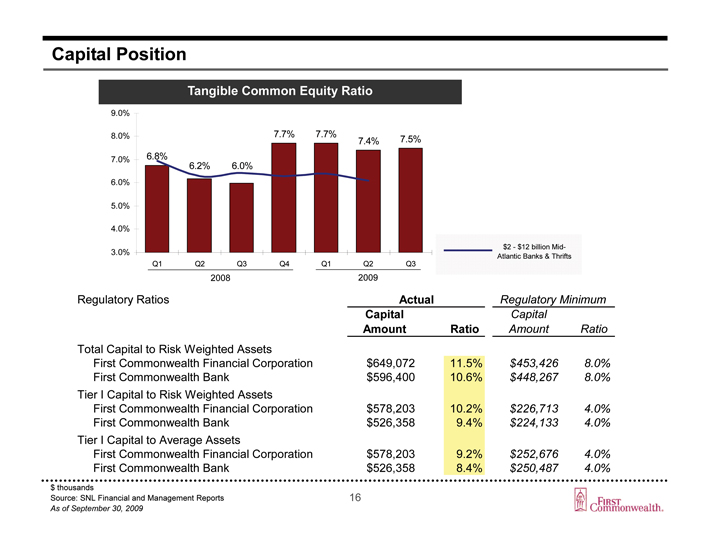
Capital Position
Tangible Common Equity Ratio
Regulatory Ratios
Actual Regulatory Minimum
Total Capital to Risk Weighted Assets
First Commonwealth Financial Corporation
First Commonwealth Bank
Tier I Capital to Risk Weighted Assets
First Commonwealth Financial Corporation
First Commonwealth Bank
Tier I Capital to Average Assets
First Commonwealth Financial Corporation
First Commonwealth Bank
Capital Capital
Amount Ratio Amount Ratio
$649,072 11.5% $453,426 8.0% $596,400 10.6% $448,267 8.0%
$578,203 10.2% $226,713 4.0% $526,358 9.4% $224,133 4.0%
$578,203 9.2% $252,676 4.0% $526,358 8.4% $250,487 4.0%
$ thousands
Source: SNL Financial and Management Reports
As of September 30, 2009
16
First Commonwealth
Investment Thesis
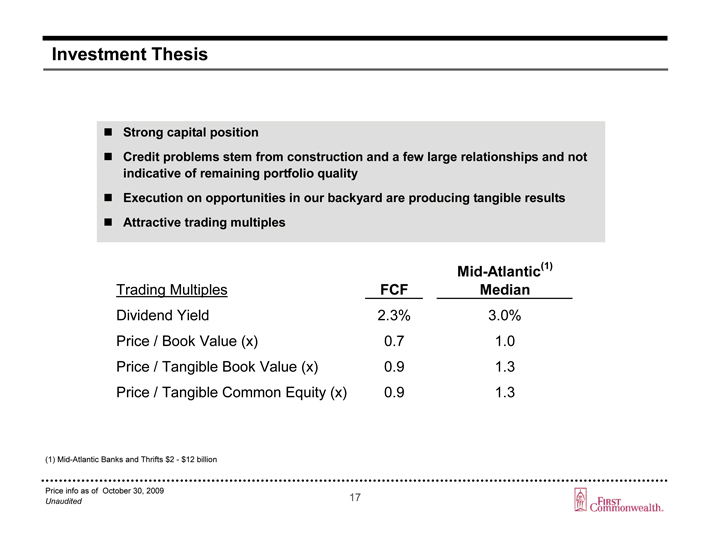
Strong capital position
Credit problems stem from construction and a few large relationships and not indicative of remaining portfolio quality
Execution on opportunities in our backyard are producing tangible results
Attractive trading multiples
Trading Multiples FCF Mid-Atlantic(1) Median
Dividend Yield 2.3% 3.0%
Price / Book Value (x) 0.7 1.0
Price / Tangible Book Value (x) 0.9 1.3
Price / Tangible Common Equity (x) 0.9 1.3
(1) Mid-Atlantic Banks and Thrifts $2 - $12 billion
Price info as of October 30, 2009
Unaudited
17
First Commonwealth
Supplemental Information
First Commonwealth
Deposit Growth
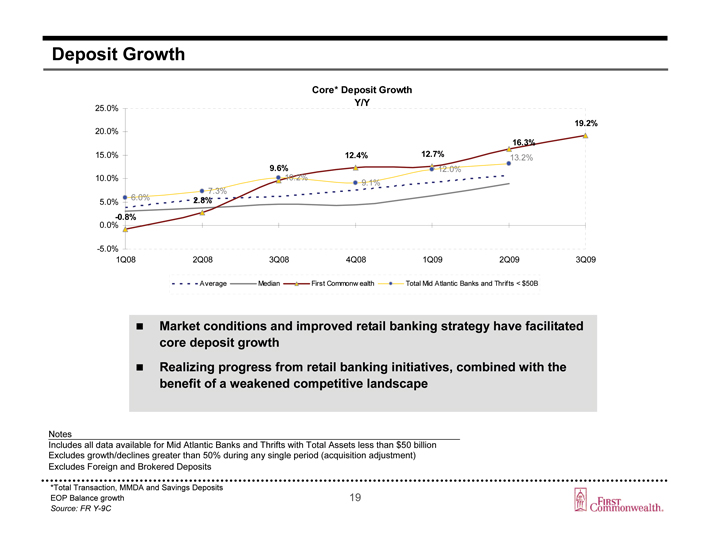
Core* Deposit Growth Y/Y
Average Median First Commonwealth Total Mid Atlantic Banks and Thrifts < $50B
Market conditions and improved retail banking strategy have facilitated core deposit growth
Realizing progress from retail banking initiatives, combined with the benefit of a weakened competitive landscape
Notes
Includes all data available for Mid Atlantic Banks and Thrifts with Total Assets less than $50 billion
Excludes growth/declines greater than 50% during any single period (acquisition adjustment)
Excludes Foreign and Brokered Deposits
*Total Transaction, MMDA and Savings Deposits
EOP Balance growth
Source: FR Y-9C
19
First Commonwealth
Deposit Growth
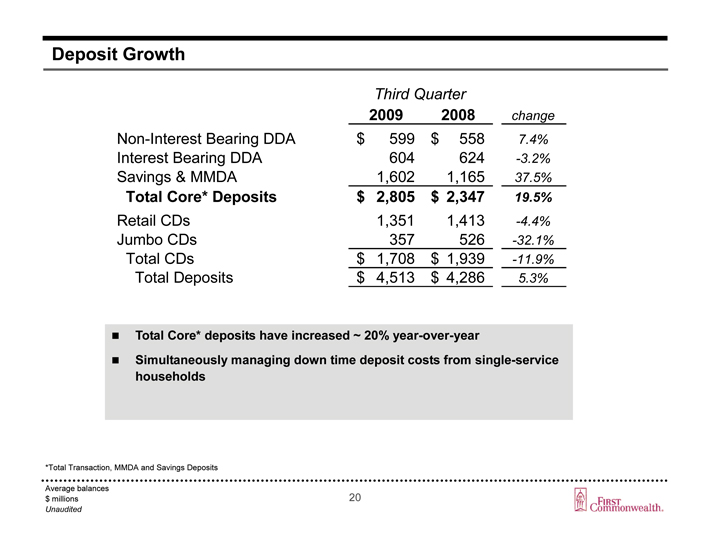
Third Quarter
2009 2008 change
Non-Interest Bearing DDA
$ 599 $ 558 7.4%
Interest Bearing DDA
604 624 -3.2%
Savings & MMDA
1,602 1,165 37.5%
Total Core* Deposits
$ 2,805 $ 2,347 19.5%
Retail CDs
1,351 1,413 -4.4%
Jumbo CDs
357 526 -32.1%
Total CDs
$ 1,708 $ 1,939 -11.9%
Total Deposits
$ 4,513 $ 4,286 5.3%
Total Core* deposits have increased ~ 20% year-over-year
Simultaneously managing down time deposit costs from single-service households
*Total Transaction, MMDA and Savings Deposits
Average balances
$ millions
Unaudited
20
First Commonwealth
Net Charge-offs and Nonaccruals
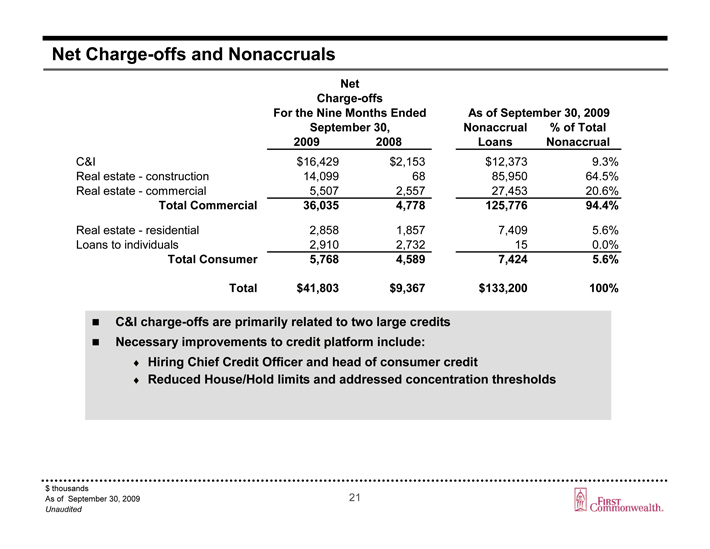
Net Charge-offs
For the Nine Months Ended As of September 30, 2009 September 30, Nonaccrual % of Total 2009 2008 Loans Nonaccrual
C&I $16,429 $2,153 $12,373 9.3%
Real estate - construction 14,099 68 85,950 64.5%
Real estate - commercial 5,507 2,557 27,453 20.6%
Total Commercial 36,035 4,778 125,776 94.4%
Real estate - residential 2,858 1,857 7,409 5.6%
Loans to individuals 2,910 2,732 15 0.0%
Total Consumer 5,768 4,589 7,424 5.6% Total $41,803 $9,367 $133,200 100%
C&I charge-offs are primarily related to two large credits
Necessary improvements to credit platform include:
Hiring Chief Credit Officer and head of consumer credit
Reduced House/Hold limits and addressed concentration thresholds
$ thousands
As of September 30, 2009
Unaudited
21
First Commonwealth
Nonaccrual Loans by State
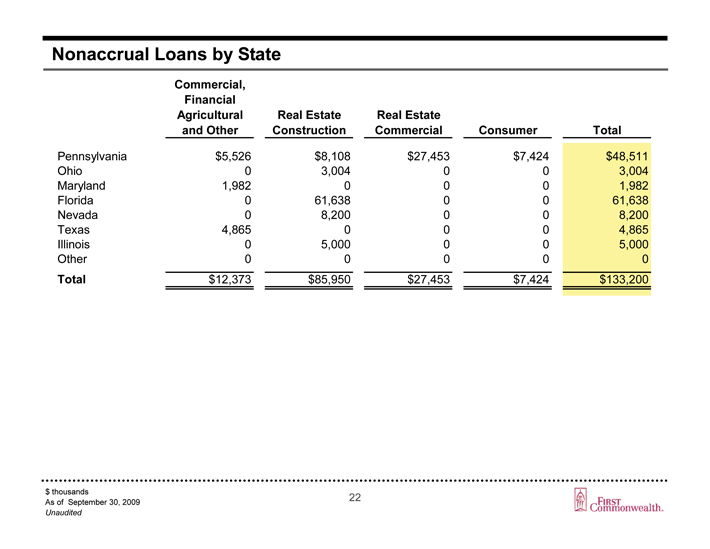
Commercial, Financial
Agricultural Real Estate Real Estate and Other Construction Commercial Consumer Total
Pennsylvania $5,526 $8,108 $27,453 $7,424 $48,511 Ohio 0 3,004 0 0 3,004 Maryland 1,982 0 0 0 1,982 Florida 0 61,638 0 0 61,638 Nevada 0 8,200 0 0 8,200 Texas 4,865 0 0 0 4,865 Illinois 0 5,000 0 0 5,000 Other 0 0 0 0 0 Total $12,373 $85,950 $27,453 $7,424 $133,200
$ thousands
As of September 30, 2009
Unaudited
22
First Commonwealth
Purchased Syndication Portfolio*
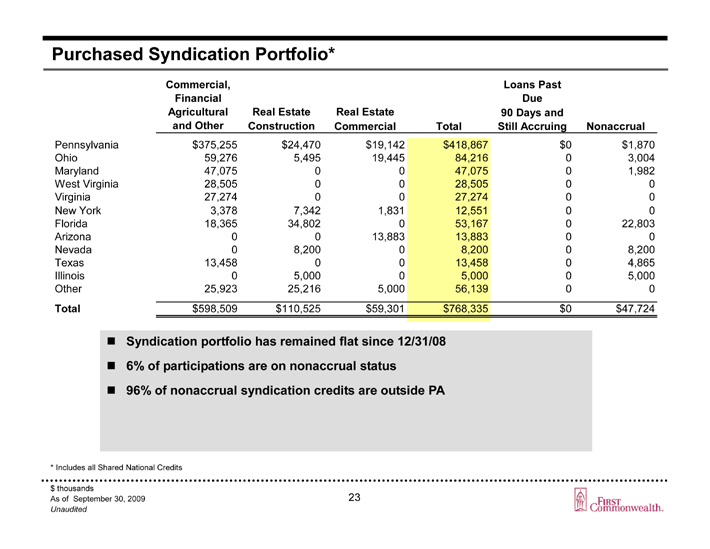
Commercial, Loans Past
Financial Due
Agricultural Real Estate Real Estate 90 Days and
and Other Construction Commercial Total Still Accruing Nonaccrual
Pennsylvania $375,255 $24,470 $19,142 $418,867 $0 $1,870
Ohio 59,276 5,495 19,445 84,216 0 3,004
Maryland 47,075 0 0 47,075 0 1,982
West Virginia 28,505 0 0 28,505 0 0
Virginia 27,274 0 0 27,274 0 0
New York 3,378 7,342 1,831 12,551 0 0
Florida 18,365 34,802 0 53,167 0 22,803
Arizona 0 0 13,883 13,883 0 0
Nevada 0 8,200 0 8,200 0 8,200
Texas 13,458 0 0 13,458 0 4,865
Illinois 0 5,000 0 5,000 0 5,000
Other 25,923 25,216 5,000 56,139 0 0
Total $598,509 $110,525 $59,301 $768,335 $0 $47,724
Syndication portfolio has remained flat since 12/31/08 6% of participations are on nonaccrual status 96% of nonaccrual syndication credits are outside PA
* Includes all Shared National Credits
$ thousands
As of September 30, 2009
Unaudited
23
Shared National Credit (SNC) Portfolio
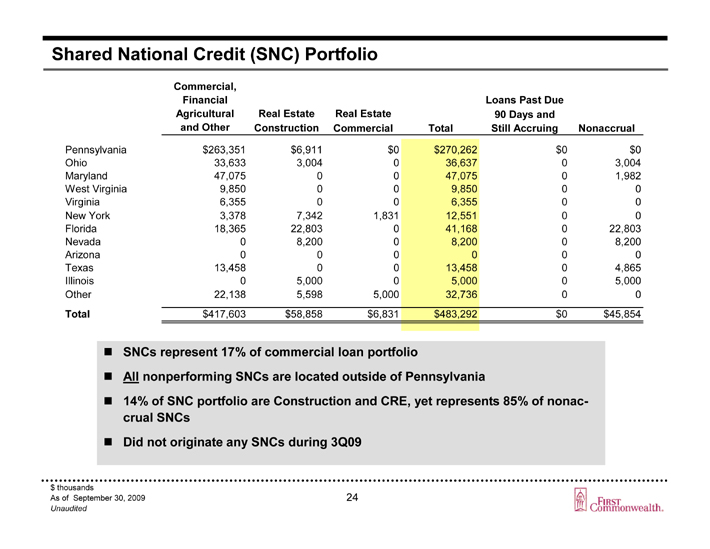
Commercial,
Financial Loans Past Due
Agricultural Real Estate Real Estate 90 Days and
and Other Construction Commercial Total Still Accruing Nonaccrual
Pennsylvania $263,351 $6,911 $0 $270,262 $0 $0
Ohio 33,633 3,004 0 36,637 0 3,004
Maryland 47,075 0 0 47,075 0 1,982
West Virginia 9,850 0 0 9,850 0 0
Virginia 6,355 0 0 6,355 0 0
New York 3,378 7,342 1,831 12,551 0 0
Florida 18,365 22,803 0 41,168 0 22,803
Nevada 0 8,200 0 8,200 0 8,200
Arizona 0 0 0 0 0 0
Texas 13,458 0 0 13,458 0 4,865
Illinois 0 5,000 0 5,000 0 5,000
Other 22,138 5,598 5,000 32,736 0 0
Total $417,603 $58,858 $6,831 $483,292 $0 $45,854
SNCs represent 17% of commercial loan portfolio
All nonperforming SNCs are located outside of Pennsylvania
14% of SNC portfolio are Construction and CRE, yet represents 85% of nonaccrual SNCs
Did not originate any SNCs during 3Q09
$ thousands
As of September 30, 2009
Unaudited
24
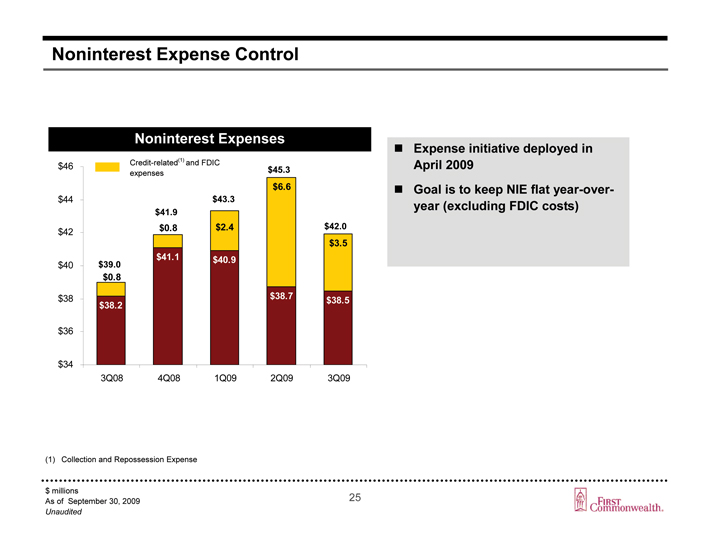
Noninterest Expense Control
Noninterest Expenses
Expense initiative deployed in April 2009
Goal is to keep NIE flat year-over-year (excluding FDIC costs)
(1) Collection and Repossession Expense
$ millions
As of September 30, 2009
Unaudited
25
First Commonwealth
Contact Information
First Commonwealth Financial Corporation
Member NYSE: FCF
Old Courthouse Square
22 North Sixth Street
Indiana, Pennsylvania 15701
For More Information Contact:
Donald A. Lawry
Vice President / Investor Relations
First Commonwealth Financial Corporation
(724) 465-4660
26
First Commonwealth
