Attached files
Table of Contents
Exhibit 13
Table of Contents
WASHINGTON FEDERAL, INC.
ANNUAL REPORT 2009
425 Pike Street, Seattle, WA 98101

| 1 | ||
| 2 | ||
| Management’s Discussion and Analysis of Financial Condition and Results of Operations |
5 | |
| 11 | ||
| 12 | ||
| 17 | ||
| Management’s Report on Internal Control over Financial Reporting |
37 | |
| 37 | ||
| 39 | ||
| 40 | ||
| 41 |
A SHORT HISTORY
Washington Federal, Inc. (Company or Washington Federal) is a unitary thrift holding company headquartered in Seattle, Washington. Its principal subsidiary is Washington Federal Savings, which operates 150 offices in eight western states.
The Company had its origin on April 24, 1917, as Ballard Savings and Loan Association. In 1935, the state-chartered Company converted to a federal charter, became a member of the Federal Home Loan Bank (FHLB) system and obtained federal deposit insurance. In 1958, Ballard Federal Savings and Loan Association merged with Washington Federal Savings and Loan Association of Bothell, and the latter name was retained for wider geographical acceptance. In 1971, Seattle Federal Savings and Loan Association, with three offices, merged into the Company, and at the end of 1978, was joined by the 10 offices of First Federal Savings and Loan Association of Mount Vernon.
On November 9, 1982, the Company converted from a federal mutual to a federal stock association. In 1987 and 1988, acquisitions of United First Federal, Provident Federal Savings and Loan, and Northwest Federal Savings and Loan, all headquartered in Boise, Idaho, added 28 Idaho offices to the Company. In 1988, the acquisition of Freedom Federal Savings and Loan Association in Corvallis, Oregon, added 13 Oregon offices, followed in 1990 by the eight Oregon offices of Family Federal Savings.
In 1991, the Company added three branches with the acquisition of First Federal Savings and Loan Association of Idaho Falls, Idaho, and acquired the deposits of First Western Savings Association of Las Vegas, Nevada, in Portland and Eugene, Oregon, where they were doing business as Metropolitan Savings Association. In 1993, 10 branches were added with the acquisition of First Federal Savings Bank of Salt Lake City, Utah. In 1994, the Company expanded into Arizona.
In 1995, the stockholders approved a reorganization whereby Washington Federal Savings became a wholly owned subsidiary of a newly formed holding company, Washington Federal, Inc. That same year, the Company purchased West Coast Mutual Savings Bank with its one branch in Centralia, Washington, and opened six additional branches. In 1996, the Company acquired Metropolitan Bancorp of Seattle, adding eight offices in Washington in addition to opening four branches in existing markets. Between 1997 and 1999, Washington Federal Savings continued to develop its branch network, opening a total of seven branches and consolidating three offices into existing locations.
In 2000, the Company expanded into Las Vegas, opening its first branch in Nevada along with two branches in Arizona. In 2001, the Company opened two additional branches in Arizona and its first branch in Texas with an office in the Park Cities area of Dallas. In 2002, Washington Federal Savings opened five full-service branches in existing markets. In 2003, the Company purchased United Savings and Loan Bank with its four branches in the Seattle metropolitan area, added one new branch in Puyallup, Washington, and consolidated one branch in Nampa, Idaho. In 2005, the Company consolidated two branches in Mount Vernon, Washington, into one and opened branches in Plano, Texas, and West Bend, Oregon. In 2006, the Company opened locations in Klamath Falls, Oregon, Richardson, Texas and another in Las Vegas, Nevada. During 2006, a branch in Medford, Oregon, was opened.
The Company acquired First Federal Banc of the Southwest, Inc., the holding company for First Federal Bank located in Roswell, New Mexico, on February 13, 2007. First Federal Bank had 13 branch locations, 11 in New Mexico and two in El Paso, Texas.
The Company acquired First Mutual Bancshares, Inc. (“First Mutual”), the holding company for First Mutual Bank, on February 1, 2008. First Mutual had 12 branches primarily located in the eastside of Seattle. The Company also opened a location in Redmond, Oregon in 2008.
During 2009, the Company opened two new locations, one in Las Vegas, Nevada and the other in Prescott Valley, Arizona.
The Company obtains its funds primarily through deposits from the general public, from repayments of loans, borrowings and retained earnings. These funds are used largely to make loans to individuals and business for the purchase of new and existing homes, construction and land loans, commercial real estate, commercial and industrial loans, and for investments.
Table of Contents

| September 30, | 2009 | 2008 | % Change | ||||||||
|
|
(In thousands, except per share data) |
| |||||||||
| Assets |
$ | 12,582,475 | $ | 11,830,141 | 6 | % | |||||
| Cash and cash equivalents |
498,388 | 82,600 | 503 | ||||||||
| Investment securities |
21,259 | 49,001 | -57 | ||||||||
| Loans receivable, net |
8,983,430 | 9,501,620 | -5 | ||||||||
| Mortgage-backed securities |
2,282,865 | 1,551,603 | 47 | ||||||||
| Customer accounts |
7,842,310 | 7,169,539 | 9 | ||||||||
| FHLB advances and other borrowings |
2,879,530 | 3,175,908 | -9 | ||||||||
| Stockholders’ equity |
1,745,485 | 1,332,674 | 31 | ||||||||
| Net income available to common shareholders |
40,684 | 62,332 | -35 | ||||||||
| Diluted earnings per share |
0.46 | 0.71 | -35 | ||||||||
| Dividends per share |
0.20 | 0.84 | -76 | ||||||||
| Stockholders’ equity per share |
15.55 | 15.16 | 3 | ||||||||
| Shares outstanding |
112,248 | 87,916 | — | ||||||||
| Return on average stockholders’ equity |
2.87 | % | 4.59 | % | — | ||||||
| Return on average assets |
0.33 | 0.55 | — | ||||||||
| Efficiency ratio |
27.30 | 27.23 | — | ||||||||
|
1 |
Table of Contents

Dear Stockholder,
It is my privilege to report that your Company completed another successful year, although results were dampened considerably by the most difficult economic environment since the Great Depression. Net income amounted to $40,684,000, or $.46 per share, a decline of 35% from fiscal 2008 and a 70% reduction from near-peak earnings posted in 2007. In that year, lower earnings became inevitable after the credit bubble that had been building for years finally burst. Consumers and businesses alike responded rationally to the prospect of difficult times ahead by reducing spending as they moved to pay down debt and increase liquid reserves. The ensuing slack demand for virtually everything meant that asset values declined, and those asset classes already in excess supply, such as housing, were hit particularly hard. Washington Federal, with 95% of its assets in some way tied to residential real estate, was clearly in harm’s way. Under the circumstances, the Company has thus far weathered the economic downturn and the housing correction quite well.
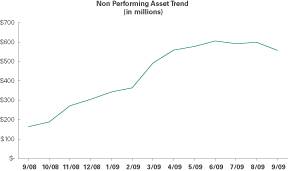
Non-performing assets, defined as loans on which we are no longer accruing interest, plus foreclosed collateral, increased sharply and were the primary focus of management attention during the year. At year-end, total non-performing assets amounted to $557 million, which is a three-fold increase over the $164 million at the prior year’s end. As the adjacent chart indicates, the year-end total is actually a decline from the $606 million reported on June 30, 2009, enabling us to feel somewhat encouraged that we may have passed the peak in problem assets for this cycle. The majority of problem loans originated in the Company’s land and construction lending portfolio, although new, early-stage problems from that source have slowed from a flood to a trickle. Not so with the mortgage portfolio, where quality indicators show some deterioration, primarily due to loss of income related to unemployment. We expect losses to increase from that segment in the new fiscal year, but remain very hopeful that, overall, problem assets and loan losses from all sources will be lower in the new fiscal year.
Fortunately, the Company’s core business of earning a spread between loans and deposits was very strong last year. Net interest income, which is that spread measured in dollars, increased by 23% to $373 million during the year. The sizable increase came as a result of the Company’s large fixed rate mortgage portfolio being funded short-term with lower cost deposits as interest rates declined during the fiscal year. The increase in net interest income is particularly notable given the rise in nonperforming assets, on which we earn nothing. The improvement in net interest income was very timely in aiding our ability to absorb lost interest and principal writedowns on the loan portfolio.
Operating expenses increased by $20 million, or 23%, over the prior year because they include a full year of operating expenses related to our acquisition of First Mutual versus only eight months last year, as well as a $10 million increase in FDIC insurance premiums. Our operating efficiency ratio, an expression of the number of pennies spent to produce a dollar of net revenue, was .27 last year and continues to be among the best in the industry. Tight control over spending has always been a Washington Federal trademark and has been especially important during the past few quarters – sometimes making the difference between profitability and operating at a loss. Stockholders can expect management to continue to be careful stewards of the Company’s resources.
The economic crisis we faced during much of the past year led management and the board to make three important capital planning decisions. The most difficult choice was to cut the cash dividend in December 2008. We know that this caused some personal hardships for many loyal stockholders, yet it was the correct decision for the Company in hindsight. As soon as the future becomes more predictably prosperous, we’ll commence cautiously increasing the dividend once again.
Another important capital decision was to accept a preferred stock investment from the U.S. Treasury in November 2008 under their Troubled Asset Relief Program (“TARP”). I wish we could call that decision correct in hindsight also, but history reveals otherwise. After averting disaster by making TARP investments in the country’s largest banks and investment banks, the U.S. Treasury selected Washington Federal as one of 22 regional institutions to participate in the program. The investment was not needed or sought after by us. We were contacted unilaterally by the Treasury through our primary regulator and strongly urged to participate. The idea seemed to be to get capital into the hands of strong
2
Table of Contents

institutions who would use the funds to help heal the system by maintaining the flow of credit and who would also be able to repay the funds one day with a profit to the Treasury. The Fall of 2008 was among the most uncertain and dark times ever faced by the international financial community and it seemed at the time as though the government was picking winners and losers. Not wanting to appear unqualified for the funds and risk panicking already nervous depositors, we chose to accept the investment. Unfortunately, the U.S. government, the Treasury and the regulators failed to get ahead of public sentiment in explaining the program and it backfired. Even strong institutions like Washington Federal were perceived to have been “bailed-out” by the government at the expense of taxpayers. In response to public pressure, follow-on legislation was subsequently passed by Congress adding burdensome requirements not anticipated in November, but also allowing for early repurchase of the preferred stock. In May 2009, we most happily returned the funds in full and it should be noted that the Treasury earned a very nice return on their investment. What we believed at the time was an act of responsible corporate citizenship left us feeling that, indeed, “no good deed goes unpunished”.
Finally, in September 2009, the Company returned to the capital markets for the first time since going public in 1982. A $350 million offering of common stock was more than four times oversubscribed and provided market validation of our business model and recognition of the Company’s long track record of success. Strong demand enabled us to command a price for the stock that was a mere 1% below the pre-announcement price. Our lead underwriter advised us that it was the second-best outcome of the year and it compared very favorably to the 15% average discount off the pre-announcement price being received by other issuers during the summer. The additional capital will provide important flexibility in managing the balance sheet when interest rates inevitably rise, and it also gives us the equity needed to take market share from our troubled competitors.
Other important events include steady progress on Project Tritan, which is a major rewrite of our in-house core data processing system. By the time you read these words, 85% of our branches will have been converted to the new system with the balance to be completed early in 2010. As part of the project, internet banking was added as an additional customer service in February and we now have 29,000 customers using the system. Check scanning equipment was installed in each of our branches, which not only allows us to comply with regulations requiring digital processing of items known as Check 21, but also enhances efficiency by speeding up the clearing process and providing better service to our clients. Ninety-seven percent of checks deposited now clear on the same day and clients can obtain a copy of the front and back of each scanned item using our internet banking portal.
As part of a strategic plan approved by the board of directors in May of last year, the Company is also planning to update its branding. Deferred maintenance on many of our Washington Federal signs, coupled with the need to replace the signage on acquired branches in New Mexico and Washington, make this a good time to introduce a fresh look to call attention to the Company at a time when we stand out from the competition in very positive ways. We plan to introduce our new image in the Spring of 2010 and look forward to your comments.
Looking ahead, the overall economy is showing signs of improvement, yet we expect the new fiscal year to burden us with many of the same challenges as the last. The housing market is still oversupplied and the unemployment rate continues to increase, meaning that credit costs will remain elevated. Consumers and businesses alike are still behaving defensively and continue to reduce their debt and increase their rainy day funds. This means that while deposits will remain relatively inexpensive, loan demand will be weak, limiting the prospect of industry-wide revenue growth. We also expect that interest rates may begin to rise later next year, resulting in pressure on spread income. We are already taking steps to be prepared for that possibility. Meanwhile, Congress is ramping up to pass new legislation that will make our business more complex and therefore more expensive to run. Also, large FDIC insurance premiums will clearly be required to replenish the insurance fund. It’s an irony of the business that those who do things right get to pay for those who fail. It hardly seems fair, but we are happy to be in the former camp rather than the latter.
On the other hand, for companies like Washington Federal with plenty of capital, the opportunities are truly immense. It is well known that there are numerous financial institutions operating within our market territory that are likely to fail, giving us the potential opportunity to work with the FDIC to remove risky assets from the system and, at the same time, earn a reasonable profit with limited risk on our part. Likewise, the condition of the industry puts the Company in a strong position to grow organically by acquiring customers from competitors one at a time as depositors seek safety, borrowers migrate to well-capitalized institutions that have the ability to lend, and both seek certainty in their banking relationship.
3
Table of Contents
TO OUR STOCKHOLDERS (CONTINUED)

(Back row - from left to right) Mark A. Schoonover, Executive Vice President and Chief Credit Officer, Linda S. Brower, Executive Vice President, Jack B. Jacobson, Executive Vice President, Rick J. Collette, Executive Vice President (Front row - from left to right) Brent J. Beardall, Executive Vice President and Chief Financial Officer, Roy M. Whitehead, Chairman, President and Chief Executive Officer, Edwin C. Hedlund, Executive Vice President and Secretary.
All in all, and with the qualifier that significant risks remain, we expect that the new fiscal year will result in at least modestly improving trends for the Company. We are among the strongest financial institutions in the country and as well positioned as any in the western U.S. to benefit from current market conditions. You can help by remembering to refer your friends, neighbors and acquaintances to Washington Federal for their banking needs. We will treat them as trusted and honored clients, not simply as targets for profit maximization. In other words, we’ll do what’s right for them even if it means we lose an opportunity to make an extra buck.
I’d like to extend special appreciation to our stockholders, who remained loyal and supportive through a very volatile period for the stock, our loyal employees who make a difference every day in the lives of our clients, and to the board of directors for their calm and sensible advice in very uneasy times. Thanks also go to the investors who entrusted us with new capital during the past year. We will do everything within our power to reward that trust and make your investment a profitable one.
The Annual Meeting of Stockholders is scheduled to take place at 2:00 pm, January 20, 2010, at the Sheraton Hotel in downtown Seattle. I look forward to seeing you there.
Sincerely,

Roy M. Whitehead
Chairman, President and Chief Executive Officer
4
Table of Contents

MANAGEMENT’S DISCUSSION AND ANALYSIS OF
FINANCIAL CONDITION AND RESULTS OF OPERATIONS
In addition to historical information, this Annual Report on Form 10-K includes certain “forward-looking statements,” as defined in the Securities Act of 1933, as amended, and the Securities Exchange Act of 1934, as amended, based on current management expectations. Actual results could differ materially from those management expects. Such forward-looking statements include statements regarding Washington Federal’s intentions, beliefs or current expectations as well as the assumptions on which such statements are based. Stockholders and potential stockholders are cautioned that any such forward-looking statements are not guarantees of future performance and involve risks and uncertainties, and that actual results may differ materially from those contemplated by such forward-looking statements. Factors that could cause future results to vary from current management expectations include, but are not limited to: general economic conditions; legislative and regulatory changes; monetary fiscal policies of the federal government; changes in tax policies; rates and regulations of federal, state and local tax authorities; changes in interest rates; deposit flows; cost of funds; demand for loan products; demand for financial services; competition; changes in the quality or composition of the Company’s loan and investment portfolios; changes in accounting principles; policies or guidelines and other economic, competitive, governmental and technological factors affecting Washington Federal’s operations, markets, products services and fees. Washington Federal undertakes no obligation to update or revise any forward-looking statements to reflect changed assumptions, the occurrence of unanticipated events or changes to future operating results over time.
| GENERAL |
Washington Federal, Inc. (Company or Washington Federal) is a unitary thrift holding company. The Company’s primary operating subsidiary is Washington Federal Savings, a federally-chartered savings and loan association. |
The Company’s fiscal year end is September 30th. All references to 2009, 2008 and 2007 represent balances as of September 30, 2009, September 30, 2008, and September 30, 2007, or activity for the fiscal years then ended.
On September 15, 2009, the Company issued additional common stock in a follow on offering for the first time since going public in 1982. Net proceeds received totaled $333,176,688 upon the issuance of 24,150,000 additional common shares. The proceeds will be used for general corporate purposes, which may include capital to support growth and acquisition opportunities.
| CRITICAL ACCOUNTING POLICIES |
Preparation of financial statements in conformity with accounting principles generally accepted in the United States of America requires the use of estimates and assumptions that affect reported amounts of certain assets, liabilities, revenues and expenses in the Company’s consolidated financial statements. Accordingly, estimated amounts may fluctuate from one reporting period to another due to changes in assumptions underlying estimated values. |
The Company has determined that the only accounting policy deemed critical to an understanding of the consolidated financial statements of Washington Federal relates to the methodology for determining the valuation of the allowance for loan losses, as described below.
The Company maintains an allowance for loan losses to absorb losses inherent in the loan portfolio. The allowance is based on ongoing, quarterly assessments of the probable and estimable losses inherent in the loan portfolio. The Company’s methodology for assessing the appropriateness of the allowance consists of several key elements, which include the general allowance and specific allowances.
The general loan loss allowance is established by applying a loss percentage factor to the different loan types. The allowance is provided based on Management’s continuing evaluation of the pertinent factors underlying the quality of the loan portfolio, including changes in the size and composition of the loan portfolio, actual loan loss experience, current economic conditions, collateral values, geographic concentrations, seasoning of the loan portfolio, specific industry conditions and the duration of the current business cycle. The recovery of the carrying value of loans is susceptible to future market conditions beyond the Company’s control, which may result in losses or recoveries differing from those provided.
Specific allowances are established for loans which are individually evaluated, in cases where Management has identified significant conditions or circumstances related to a loan that Management believes indicate the probability that a loss has been incurred.
5
Table of Contents

MANAGEMENT’S DISCUSSION AND ANALYSIS OF
FINANCIAL CONDITION AND RESULTS OF OPERATIONS (CONTINUED)
| INTEREST RATE RISK |
The Company accepts a high level of interest rate volatility as a result of its policy to originate fixed-rate single-family home loans that are longer-term than the short-term characteristics of its liabilities of customer accounts and borrowed money. The following table shows the estimated repricing periods for earning assets and paying liabilities. |
| Repricing Period | ||||||||||||||||
| Within One Year |
After 1 year - before 4 Years |
Thereafter | Total | |||||||||||||
| (In thousands) | ||||||||||||||||
| As of September 30, 2009 |
||||||||||||||||
| Earning Assets * |
$ | 2,929,902 | $ | 4,247,528 | $ | 4,753,808 | $ | 11,931,238 | ||||||||
| Paying Liabilities |
(7,068,190 | ) | (3,652,513 | ) | (1,137 | ) | (10,721,840 | ) | ||||||||
| Excess (Liabilities) Assets |
$ | (4,138,288 | ) | $ | 595,015 | $ | 4,752,671 | |||||||||
| Excess as % of Total Assets |
-32.9 | % | ||||||||||||||
| Policy limit for one year excess |
-60.0 | % | ||||||||||||||
| * | Asset repricing period includes estimated prepayments based on historical activity |
At September 30, 2009, the Company had approximately $4.1 billion more liabilities subject to repricing in the next year than assets, which amounted to a negative maturity gap of 33% of total assets. As of September 30, 2008, the amount of excess liabilities subject to repricing within one year was approximately $4.0 billion, or 34%, of total assets. The increase of approximately $150 million of liabilities in excess of assets repricing within one year was due to the continued growth of long term assets, primarily 30 year mortgage-backed securities, funded primarily through growth of short term customer deposits. Although the absolute dollar amount of the one year gap increased by approximately $150 million, the negative maturity gap percentage actually decreased by 1%, due to the growth in the balance sheet. By having an excess of liabilities repricing within one year over assets, the Company is subject to decreasing net interest income should interest rates rise. However, if the size and/or mix of the balance sheet changes, rising rates may not cause a decrease in net interest income. The Company’s interest rate risk approach has never resulted in the recording of a monthly operating loss, although there can be no assurance that this will always be the case.
The Company’s net interest spread increased from 2.85% at September 30, 2008 to 3.17% at September 30, 2009. Net interest spread represents the difference between the contractual rates of earning assets and the contractual rates of paying liabilities as of a specific date. The spread increased primarily because rates on customer accounts decreased by 129 basis points over the prior year while rates on earning assets decreased by 51 basis points (see Period End Spread table on page 11). This increase in spread was driven by falling short term market interest rates.
During 2009, the Company chose to grow earning assets by increasing the amount of cash and investments by $1,119,309,000. Offsetting this growth was the net decrease in loans outstanding of $518,190,000. This growth was primarily funded by growth in customer accounts of $672,771,000 and a net increase in equity of $412,811,000. Stockholders’ equity of $1,745,485,000 at September 30, 2009, provides management with flexibility in managing interest rate risk, by providing the ability to borrow additional funds or grow customer accounts and still maintain sufficient capital levels.
| ASSET QUALITY & ALLOWANCE FOR LOAN LOSSES |
The Company maintains an allowance to absorb losses inherent in the loan portfolio. The allowance is based on ongoing, quarterly assessments of the probable and estimable losses inherent in the loan portfolio. The Company’s methodology for assessing the appropriateness of the allowance consists of several key elements, which include the general allowance and specific allowances. |
The general portion of the loan loss allowance is established by applying a loss percentage factor to the different loan types. Management believes loan types are the most relevant factor to group loans for the allowance calculation as the risk characteristics in these groups are similar. The allowances are provided based on Management’s continuing evaluation of the pertinent factors underlying the quality of the loan portfolio, including changes in the size and composition of the loan portfolio, actual loan loss experience, current economic conditions, geographic concentrations, seasoning of the loan portfolio, specific industry conditions, and the duration of the current business cycle. The recovery of the carrying value of loans is susceptible to future market conditions beyond the Company’s control, which may result in losses or recoveries differing from those provided.
During 2009, the Company enhanced its general reserve allowance calculation to be more reflective of the current economic environment. Changes included shortening the look-back period for determining historical loss factors “HLF” and modifying the methodology to give more weighting to risks by asset type rather than geographic exposure. In addition to utilizing the HLF to calculate the general reserve, we utilize a qualitative risk factor ”QRF”, which is determined by loan type and allows management to augment reserve levels to reflect the current environment and portfolio performance trends.
6
Table of Contents
By shortening the look-back period the Company has taken into account the current housing environment where home values have declined substantially from the housing peak of 2007. We monitor delinquency trends as well as regional economic conditions including employment and housing values when determining the QRF.
Washington Federal did not originate many of the “high risk” loan types, such as Option ARM or interest only long-term loans, that have caused significant losses throughout the industry.
Specific allowances are established for loans which are individually evaluated, in cases where Management has identified significant conditions or circumstances related to a loan that Management believes indicate the probability that a loss has been incurred.
Loans for commercial purposes, including multi-family loans, builder construction loans and commercial loans are reviewed on an individual basis to assess the ability of the borrowers to continue to service all of their principal and interest obligations. If a loan shows signs of weakness, it is downgraded and, if warranted, placed on non-accrual status. Updated valuations are generally obtained from external sources on collateral dependent commercial loans when a loan exhibits weakness or is modified. The Company has an asset quality review function that reports the results of its internal reviews to the Board of Directors on a quarterly basis.
Non-performing assets were $557,120,000, or 4.43%, of total assets, at September 30, 2009, compared to $164,191,000, or 1.39%, of total assets, at September 30, 2008. This significant increase in non-performing assets is a result of the significant decline in housing values in the western United States and the national recession that occurred during 2009. Total delinquencies over 30 days were $456,318,000, or 5.08%, of net loans at
September 30, 2009, compared to $236,848,000, or 2.49%, of net loans at September 30, 2008.
The following table details non-performing asset by type, comparing 2009 and 2008.
| September 30, | |||||||||||||
| Non-Performing Assets | 2009 | 2008 | $ Change | % Change | |||||||||
| (In thousands) | |||||||||||||
| Non-accrual loans: |
|||||||||||||
| Single-family residential |
$ | 116,268 | $ | 38,017 | $ | 78,251 | 206 | % | |||||
| Construction – speculative |
50,348 | 33,003 | 17,345 | 53 | % | ||||||||
| Construction – custom |
— | 1,315 | (1,315 | ) | — | ||||||||
| Land – acquisition & development |
187,061 | 51,562 | 135,499 | 263 | % | ||||||||
| Land – consumer lot loans |
— | — | — | — | |||||||||
| Multi-Family |
4,368 | 748 | 3,620 | 484 | % | ||||||||
| Commercial real estate |
2,733 | 1,929 | 804 | 42 | % | ||||||||
| Commercial & industrial |
18,823 | — | 18,823 | NA | |||||||||
| HELOC |
— | — | — | — | |||||||||
| Consumer |
656 | 535 | 121 | — | |||||||||
| Total non-accrual loans |
380,257 | 127,109 | 253,148 | 199 | % | ||||||||
| Total REO & REHI |
176,863 | 37,082 | 139,781 | 377 | % | ||||||||
| Total non-performing assets |
$ | 557,120 | $ | 164,191 | $ | 392,929 | 239 | % | |||||
The significant increase in overall non-performing assets is the result of declining home values, rising unemployment and deteriorating economic conditions in the Company’s eight state market territory.
Speculative construction loans and land acquisition and development loans are the weakest performing segments of the portfolio. The amount of non-performing assets in those categories increased considerably due to lower new home sales and construction starts during the year.
In response to the deteriorating credit quality of our loan portfolio, the allowance for loan loss increased by $81,778,000 or 95% over 2008. $59,461,000 of the allowance is calculated under the formulas contained in our methodology and the remaining $107,375,000 is made up of specific reserves on loans that were deemed to be impaired at September 30, 2009.
| LIQUIDITY AND CAPITAL RESOURCES |
The principal sources of funds for the Company’s activities are retained earnings, loan repayments (including prepayments), net deposit inflows, repayments and sales of investments and borrowings. Washington Federal’s principal sources of revenue are interest on loans and interest and dividends on investments. |
The Company’s net worth at September 30, 2009, was $1,745,485,000, or 13.9%, of total assets. This is an increase of $412,811,000 from September 30, 2008, when net worth was $1,332,674,000, or 11.3%, of total assets. The Company’s net worth increased due in part to the issuance of additional common stock which resulted in net proceeds of $333,177,000, an increase in accumulated other comprehensive income of $51,959,000 resulting from
7
Table of Contents
MANAGEMENT’S DISCUSSION AND ANALYSIS OF
FINANCIAL CONDITION AND RESULTS OF OPERATIONS (CONTINUED)
| an increase in the value of our investment portfolio, net income before accrual of preferred dividends of $48,172,000, proceeds from the issuance of preferred stock and warrants of $200,000,000 and purchases by the Employee Stock Ownership Plan of $1,341,000. Net worth was reduced by the preferred stock redemption of $200,000,000, as well as cash dividends paid of $18,847,000 and $5,361,000 on common stock and preferred stock, respectively. The Company paid out 43% of its 2009 earnings in cash dividends to common shareholders, compared with 118% last year. Over the long term, the Company would prefer its dividend payout ratio to be less than 50%. |
On November 14, 2008, the Company entered into a Letter Agreement (“Agreement”) with the United States Department of the Treasury (“Treasury”) to participate in the Troubled Asset Relief Program Capital Purchase Program (“CPP”). Pursuant to the Agreement, the Company issued and sold to the Treasury (i) 200,000 shares of the Company’s Fixed Rate Cumulative Perpetual Preferred Stock (“Preferred Stock”), and (ii) a warrant to purchase 1,707,456 shares of the Company’s common stock, par value $1.00 per share, for an aggregate purchase price for both the preferred stock and warrants of $200 million in cash. The Preferred Stock qualified as Tier 1 capital and paid cumulative dividends at a rate of 5% per annum for the first five years, and 9% per annum thereafter. On May 27, 2009, the Company repurchased the $200 million of Preferred Stock, resulting in a charge of $2.0 million to net income available to common shareholders. The Company has decided not to repurchase the 1.7 million warrants issued in conjunction with the preferred stock at this time.
Washington Federal Saving’s percentage of net worth to total assets is over two times the minimum required under Office of Thrift Supervision (OTS) regulations (see Note M). Management believes this strong net worth position will help the Company manage its interest rate risk and will enable it to compete more effectively.
Customer accounts increased $672,771,000, or 9.4%, from one year ago. Management’s strategy has been to remain competitive in deposit pricing to attract new deposit relationships necessary to fund asset growth. Deposit growth benefited from the disruption in the market place caused by the failure or distressed acquisition of several competitors.
The Company has a credit line with the FHLB Seattle equal to 50% of total assets, providing a substantial source of liquidity if needed. FHLB advances are collateralized as provided for in the Advances, Pledge and Security Agreement by all FHLB stock owned by the Company, deposits with the FHLB and certain mortgages or deeds of trust securing such properties as provided in the agreements with the FHLB.
The Company’s cash and cash equivalents amounted to $498,388,000 at September 30, 2009, a 503.4% increase from the cash and cash equivalents balance of $82,600,000 one year ago. The primary factor in the increased cash balance was the equity offering which resulted in net proceeds of $333,177,000 which were received by the Company on September 21, 2009, only 9 days prior to the balance sheet date. Additionally, see “Interest Rate Risk” above and the “Statement of Cash Flows” included in the financial statements.
| CHANGES IN FINANCIAL POSITION |
Available-for-sale and held-to-maturity securities. The Company purchased $1,175,321,000 of securities during 2009, all of which have been classified as available-for-sale. |
The Company sold $18,453,000 of available-for-sale securities in the current year. As of September 30, 2009, the Company had net unrealized gains in its available-for-sale portfolio of $86,057,000, as compared to net unrealized gains of $3,907,000 as of September 30, 2008. The increase in net unrealized gains was primarily a result of the increase in value of long term fixed rate assets as long term market interest rates have decreased.
Loans receivable. Loans receivable decreased $518,190,000, or 5.5%, to $8,983,430,000 at September 30, 2009, from $9,501,620,000 one year earlier. The decrease resulted primarily from loan repayments (including prepayments) of $2,116,355,000, which exceeded originations by $275,895,000. The Company’s decision not to originate and hold in its loan portfolio 30 year fixed-rate loans at rates below 5.00%, due to the duration risk associated with such low mortgage rates, contributed to the net run off of the loan portfolio. Additionally, during the year, $254,742,000 of loans were transferred to real estate owned as foreclosures. The following table shows the change in the geographic distribution by state of the gross loan portfolio from 2008 to 2009.
| 2009 | 2008 | |||||
| Washington |
43.9 | % | 43.7 | % | ||
| Oregon |
17.0 | % | 16.6 | % | ||
| Idaho |
7.3 | % | 8.2 | % | ||
| Arizona |
8.5 | % | 8.2 | % | ||
| Utah |
7.8 | % | 7.8 | % | ||
| New Mexico |
4.1 | % | 4.0 | % | ||
| Texas |
1.7 | % | 1.1 | % | ||
| Nevada |
1.7 | % | 1.4 | % | ||
| Other |
8.0 | % | 9.0 | % | ||
| 100.0 | % | 100.0 | % | |||
8
Table of Contents
Real estate held for sale. The balance of real estate held for sale at September 30, 2009 was $176,863,000, an increase of $139,756,000 from one year ago. This significant increase is a result of the foreclosure of non-performing loans as discussed in the “Asset Quality” section above.
Intangible assets. The Company’s intangible assets are made up of $251,653,000 of goodwill, servicing rights intangible of $2,469,000, as well as the unamortized balances of the core deposit intangible of $2,675,000 at September 30, 2009.
Customer accounts. Customer accounts at September 30, 2009 totaled $7,842,310,000 compared with $7,169,539,000 at September 30, 2008, a 9.4% increase. See “Liquidity and Capital Resources” above.
FHLB advances and other borrowings. Total borrowings decreased $296,378,000, or 9.3%, to $2,879,530,000 at September 30, 2009 as the Company chose to fund asset growth with a mix of customer accounts and stockholders’ equity. See “Interest Rate Risk” above.
Contractual obligations. The following table presents, as of September 30, 2009, the Company’s significant fixed and determinable contractual obligations, within the categories described below, by payment date or contractual maturity.
| Contractual Obligations | Total | Less than 1 Year |
1 to 5 Years |
Over 5 Years | ||||||||
| (In thousands) | ||||||||||||
| Debt obligations* |
$ | 2,879,530 | $ | 600 | $ | 528,930 | $ | 2,350,000 | ||||
| Operating lease obligations |
8,713 | 2,610 | 4,632 | 1,471 | ||||||||
| $ | 2,888,243 | $ | 3,210 | $ | 533,562 | $ | 2,351,471 | |||||
| * | Represents final maturities of debt obligations. See a description in Notes H and I. |
These contractual obligations, except for the operating leases, are included in the Consolidated Statements of Financial Condition. The payment amounts represent those amounts contractually due.
| RESULTS OF OPERATIONS |
GENERAL |
See Note P, “Selected Quarterly Financial Data (Unaudited),” which highlights the quarter-by-quarter results for the years ended September 30, 2009 and 2008.
Net income mentioned below refers to net income available to common shareholders, which consists of net income less dividends accrued on the preferred stock that was repaid in full in May 2009. See Liquidity and Capital Resources above for a full discussion of the preferred stock transaction.
COMPARISON OF 2009 RESULTS WITH 2008
In 2009 net income decreased $21,648,000, or 34.7% from 2008, primarily as a result of an $193,000,000 provision for loan losses which resulted from the significant decline in asset quality and higher net charge offs. In addition, the other expenses increased $19,840,000 in 2009 over the prior year, due primarily to increased FDIC insurance costs of $9,896,000, which resulted from the significant increase in bank failures during the year that necessitated replenishment of the deposit insurance fund.
In comparing operating results of 2009 versus 2008 it is important to understand that 2009 had 12 months of operating results, both income and expense, from the First Mutual acquisition; 2008 had only 8 months of operating results from the First Mutual acquisition.
Interest income on loans and mortgage-backed securities increased only $427,000, or 0.1%, in 2009 due to a 7.7% increase in the average outstanding balance of loans and mortgage-backed securities, offset by a 46 basis point decrease in the weighted average yield during the year from 6.51% in 2008 to 6.04% in 2009.
Interest and dividend income on investment securities and cash equivalents decreased $10,081,000, or 76.8%, in 2009 from 2008. This decrease was primarily due to a decrease in the weighted average rate earned on investment securities, cash equivalents and FHLB stock, which decreased 284 basis points to 0.85%. The Company’s required investment in FHLB stock, which amounted to $144,495,000 as of 2009, produced a yield of only 0.28% during the year.
Interest expense on customer accounts decreased 26.3% to $191,435,000 for 2009 from $259,769,000 for 2008. The decrease primarily related to a 131 basis point decrease in the average cost of customer accounts to 2.56% during the year compared to 3.87% one year ago, offset by a 11.5% increase in the average balance of customer accounts over the prior year. Interest expense on FHLB advances and other borrowings decreased to $127,192,000 in 2009 from $137,872,000 in 2008 due to a decrease in the average cost of borrowings for the year ended September 30, 2009 to 3.93% from 4.41% for the same period one year ago. Partially offsetting the decrease in average cost of borrowings was an increase in the average balance of borrowings to $3,235,231,000 during 2009 from $3,122,950,000 during 2008.
9
Table of Contents
MANAGEMENT’S DISCUSSION AND ANALYSIS OF
FINANCIAL CONDITION AND RESULTS OF OPERATIONS (CONTINUED)
The Company recorded a $193,000,000 provision for loan losses in 2009 compared to $60,516,000 in 2008. The current year provision is due to the significant increase in the Company’s non-performing asset balances. Non-performing assets increased by $392,929,000 over 2008. Non-accrual loans as a percentage of total loans increased from 1.34% in 2008 to 4.23% in 2009. Economic conditions deteriorated in the primary markets served by the Company, as evidenced by an increase in unemployment, a reduction in the number of home sales and weak consumer confidence. Total delinquencies over 30 days were $456,318,000, or 4.97% of net loans at September 30, 2009 compared to $236,848,000, or 2.49% of net loans at September 30, 2008. Actual net charge-offs during 2009 were $111,222,000. Management believes the allowance for loan losses, totaling $166,836,000, is sufficient to absorb estimated losses inherent in the portfolio.
Total other income increased $78,200,000, or 132.1%, in 2009 from 2008. The increase in 2009 was driven primarily by the other than temporary impairment (“OTTI”) charge of $87,747,000 in the prior year. Additionally in 2008, the Company reported $13,123,000 of gain on the sale of real estate.
Compensation expense increased $4,265,000, or 8.1%, in 2009 primarily due to full year of operations combined with First Mutual. Personnel, including part-time employees considered on a full-time equivalent basis, increased to 1,105 at September 30, 2009 compared to 1,095 one year ago.
Occupancy expense increased $1,836,000, or 16.4%, during the year primarily due to the 12 additional branches acquired in the First Mutual transaction. The branch network increased to 150 offices at September 30, 2009 versus 148 offices one year ago.
FDIC insurance expense increased to $9,896,000 for 2009 from $792,000 in 2008 as a result of the significant increase in bank failures during the year which has depleted the FDIC fund. The FDIC has undertaken to replenish the FDIC fund through special assessments are higher insurance premiums for all insured depository institutions. Other expenses increased $2,160,000 during the year primarily related to the operating costs added from First Mutual and increased information technology spending. Operating expense for 2009 and 2008 equaled .87% and .77% of average assets, respectively. Despite the increase in operating expenses, the Company continues to operate as one of the most efficient financial institutions in the country.
The loss on real estate acquired through foreclosure increased from $1,021,000 in 2008 to $16,354,000 in 2009 due to the growth in balances of real estate acquired through foreclosure and the resulting loss on sale of some of those properties stemming from continued declines in real estate values in the western United States.
Income tax expense decreased $5,937,000, or 17.7%, in 2009 due to a lower taxable income base. Additionally, 2009 included $1,500,000 of additional tax related to a tax liability arising from the First Mutual acquisition (see Note A). The effective tax rate was 36.40% for 2009 versus 34.96% for 2008.
COMPARISON OF 2008 RESULTS WITH 2007
In 2008 net income decreased $72,685,000, or 53.8% from 2007, primarily as a result of an $87,747,000 pretax OTTI charge recognized in September 2008 on FHLMC and FNMA preferred stock. The value of these securities declined significantly after the U.S. Government placed both companies into conservatorship in September 2008. See related discussion in the “Changes in Financial Position” section above. In addition, the provision for loan losses increased $58,966,000 in 2008 over the prior year, due to the decline in asset quality and higher net charge offs.
In comparing operating results of 2008 versus 2007 it is important to understand that 2007 had 8 months of operating results, both income and expense, from the First Federal acquisition. 2008 had a full 12 months of operating results from the First Federal acquisition and 8 months from the First Mutual acquisition.
Interest income on loans and mortgage-backed securities increased $85,902,000, or 14.3%, in 2008 due to a 17.7% increase in the average outstanding balance of loans and mortgage-backed securities, offset by a 19 basis point decrease in the weighted average yield during the year from 6.70% in 2007 to 6.51% in 2008.
Interest and dividend income on investment securities and cash equivalents decreased $3,156,000, or 19.4%, in 2008 from 2007. This decrease was primarily due to a decrease in the average combined balance of investment securities, cash equivalents and FHLB stock, which decreased 10.2% to $355,440,000 for the year ended September 30, 2008 versus $396,008,000 for the year ended September 30, 2007. In addition to the decrease in balance, the weighted average yield on investment securities, cash equivalents and FHLB stock decreased from 4.11% in 2007 to 3.69% in 2008. The Company’s required investment in FHLB stock, which amounted to $144,874,000 as of 2008, produced a yield of only 1.22% during the year.
Interest expense on customer accounts increased 6.5% to $259,769,000 for 2008 from $243,837,000 for 2007. The increase primarily related to a 17.4% increase in the average balance of customer accounts over the prior year, offset by a 39 basis point decrease in the average cost of customer accounts to 3.87% during the year compared to 4.26% one year ago. Interest expense on FHLB advances and other borrowings increased to $137,872,000 in 2008 from $114,664,000 in 2007 due to an increase in the average balance of borrowings to $3,122,950,000 during 2008 from $2,497,555,000 during 2007. Offsetting the increase in average balance, the average cost of borrowings for the year ended September 30, 2008 decreased to 4.41% from 4.59% for the same period one year ago.
10
Table of Contents
The Company recorded a $60,516,000 provision for loan losses in 2008 compared to $1,550,000 in 2007. The 2008 provision was due to the 16.0% growth in loans receivable over the prior year and the significant increase in the Company’s non-performing asset balances. Non-performing assets increased by $148,260,000 over 2007. Non-accrual loans as a percentage of total loans increased from .18% in 2007 to 1.34% in 2008. Economic conditions deteriorated in the primary markets served by the Company, as evidenced by an increase in unemployment, a reduction in the number of home sales and weak consumer confidence. Total delinquencies over 30 days were $236,848,000, or 2.49% of net loans at September 30, 2008 compared to $48,405,000, or .59% of net loans at September 30, 2007. Actual net charge-offs during 2008 were $15,193,000. Management believes the allowance for loan losses, totaling $85,058,000, is sufficient to absorb estimated losses inherent in the portfolio.
Total other income decreased $74,432,000, or 488.4%, in 2008 from 2007. The decrease in 2008 was driven primarily by the OTTI charge of $87,747,000 discussed in the “Changes in Financial Position” section above. Partially offsetting the OTTI charge was $13,123,000 of gain on the sale of real estate.
Compensation expense increased $9,266,000, or 21.3%, in 2008 primarily due to the addition of approximately 169 staff members in February 2008 from the First Mutual transaction and annual performance increases for existing staff. Personnel, including part-time employees considered on a full-time equivalent basis, increased to 1,095 at September 30, 2008 compared to 886 one year ago.
Occupancy expense increased $2,493,000, or 28.6%, during the year primarily due to the 12 additional branches acquired in the First Mutual transaction. The branch network increased to 148 offices at September 30, 2008 versus 135 offices one year ago.
Amortization expense increased to $2,441,000 for 2008 from $1,819,000 in 2007 as a result of the acquisition. Other expenses increased $8,859,000 during the year primarily related to the operating costs added from First Mutual and First Federal and increased information technology spending. Operating expense for 2008 and 2007 equaled .77% and .67% of average assets, respectively. Despite the increase in operating expenses, the Company continues to operate as one of the most efficient financial institutions in the country.
Income tax expense decreased $40,788,000 or 54.9%, in 2008 due to a lower taxable income base. The effective tax rate was 34.96% for 2008 versus 35.49% for 2007.
PERIOD END SPREAD – AS OF THE DATE SHOWN
| Dec 31 2007 |
Mar 31 2008 |
Jun 30 2008 |
Sep 30 2008 |
Dec 31 2008 |
Mar 31 2009 |
Jun 30 2009 |
Sep 30 2009 |
|||||||||||||||||
| Interest rate on loans and mortgage-backed securities |
6.49 | % | 6.41 | % | 6.35 | % | 6.33 | % | 6.22 | % | 6.17 | % | 6.12 | % | 6.04 | % | ||||||||
| Interest rate on investment securities* |
4.63 | 4.28 | 4.35 | 2.78 | 1.22 | 1.68 | 0.69 | 0.45 | ||||||||||||||||
| Combined |
6.42 | 6.35 | 6.30 | 6.26 | 6.11 | 6.09 | 5.99 | 5.75 | ||||||||||||||||
| Interest rate on customer accounts |
4.33 | 3.91 | 3.52 | 3.25 | 2.99 | 2.54 | 2.14 | 1.96 | ||||||||||||||||
| Interest rate on borrowings |
4.47 | 4.37 | 3.83 | 3.77 | 3.64 | 4.08 | 4.25 | 4.25 | ||||||||||||||||
| Combined |
4.38 | 4.05 | 3.61 | 3.41 | 3.20 | 2.98 | 2.72 | 2.58 | ||||||||||||||||
| Interest rate spread |
2.04 | % | 2.30 | % | 2.69 | % | 2.85 | % | 2.91 | % | 3.11 | % | 3.27 | % | 3.17 | % | ||||||||
| * | Includes municipal bonds at tax-equivalent rates and cash equivalents |
The interest rate spread increased during 2009 from 2.85% at September 30, 2008 to 3.17% at September 30, 2009. See “Interest Rate Risk” on page 5.
11
Table of Contents

| Year ended September 30, | 2009 | 2008 | 2007 | 2006 | 2005 | ||||||||||||
| (In thousands, except per share data) | |||||||||||||||||
| Interest income |
$ | 691,774 | $ | 701,428 | $ | 618,682 | $ | 529,883 | $ | 461,901 | |||||||
| Interest expense |
318,627 | 397,641 | 358,501 | 273,361 | 195,260 | ||||||||||||
| Net interest income |
373,147 | 303,787 | 260,181 | 256,522 | 266,641 | ||||||||||||
| Provision for (reversal of) loan losses |
193,000 | 60,516 | 1,550 | 535 | (134 | ) | |||||||||||
| Other income |
2,655 | (60,212 | ) | 15,569 | 16,252 | 7,852 | |||||||||||
| Other expense |
107,060 | 87,220 | 64,888 | 53,579 | 52,319 | ||||||||||||
| Income before income taxes |
75,742 | 95,839 | 209,312 | 218,660 | 222,308 | ||||||||||||
| Income taxes |
27,570 | 33,507 | 74,295 | 75,558 | 76,419 | ||||||||||||
| Net income |
48,172 | 62,332 | 135,017 | 143,102 | 145,889 | ||||||||||||
| Preferred dividends accrued |
7,488 | — | — | — | — | ||||||||||||
| Net income available to common shareholders |
$ | 40,684 | $ | 62,332 | $ | 135,017 | $ | 143,102 | $ | 145,889 | |||||||
| Per share data |
|||||||||||||||||
| Basic earnings |
$ | 0.46 | $ | 0.71 | $ | 1.55 | $ | 1.64 | $ | 1.68 | |||||||
| Diluted earnings |
0.46 | 0.71 | 1.54 | 1.64 | 1.67 | ||||||||||||
| Cash dividends |
0.20 | 0.84 | 0.83 | 0.81 | 0.78 | ||||||||||||
| September 30, | 2009 | 2008 | 2007 | 2006 | 2005 | ||||||||||||
| (In thousands) | |||||||||||||||||
| Total assets |
$ | 12,582,475 | $ | 11,830,141 | $ | 10,285,417 | $ | 9,069,020 | $ | 8,234,450 | |||||||
| Loans and mortgage-backed securities |
11,266,295 | 11,053,223 | 9,601,947 | 8,457,759 | 7,084,274 | ||||||||||||
| Investment securities |
21,259 | 49,001 | 240,391 | 256,650 | 214,993 | ||||||||||||
| Cash and cash equivalents |
498,388 | 82,600 | 61,378 | 45,722 | 637,791 | ||||||||||||
| Customer accounts |
7,842,310 | 7,169,539 | 5,996,785 | 5,311,726 | 5,031,505 | ||||||||||||
| FHLB advances |
2,078,930 | 1,998,308 | 1,760,979 | 1,500,000 | 1,230,000 | ||||||||||||
| Other borrowings |
800,600 | 1,177,600 | 1,075,000 | 870,000 | 655,000 | ||||||||||||
| Stockholders’ equity |
1,745,485 | 1,332,674 | 1,318,127 | 1,262,720 | 1,187,308 | ||||||||||||
| Number of |
|||||||||||||||||
| Customer accounts |
305,129 | 298,926 | 281,778 | 249,533 | 232,707 | ||||||||||||
| Mortgage loans |
44,453 | 47,331 | 44,713 | 36,955 | 38,014 | ||||||||||||
| Offices |
150 | 148 | 135 | 123 | 122 | ||||||||||||
12
Table of Contents

CONSOLIDATED STATEMENTS OF FINANCIAL CONDITION
| September 30, | 2009 | 2008 | ||||||
| (In thousands, except share data) |
||||||||
| ASSETS |
||||||||
| Cash and cash equivalents |
$ | 498,388 | $ | 82,600 | ||||
| Available-for-sale securities, including encumbered securities of $860,655 and $762,857 |
2,201,083 | 1,476,067 | ||||||
| Held-to-maturity securities, including encumbered securities of $80,717 and $98,917 |
103,042 | 124,537 | ||||||
| Loans receivable, net |
8,983,430 | 9,501,620 | ||||||
| Interest receivable |
53,288 | 54,365 | ||||||
| Premises and equipment, net |
133,477 | 133,357 | ||||||
| Real estate held for sale |
176,863 | 37,107 | ||||||
| FHLB stock |
144,495 | 144,874 | ||||||
| Intangible assets, including goodwill of $251,653 |
256,797 | 260,158 | ||||||
| Other assets |
31,612 | 15,456 | ||||||
| $ | 12,582,475 | $ | 11,830,141 | |||||
| LIABILITIES AND STOCKHOLDERS’ EQUITY |
||||||||
| Liabilities |
||||||||
| Customer accounts |
||||||||
| Savings and demand accounts |
$ | 7,786,467 | $ | 7,146,045 | ||||
| Repurchase agreements with customers |
55,843 | 23,494 | ||||||
| 7,842,310 | 7,169,539 | |||||||
| FHLB advances |
2,078,930 | 1,998,308 | ||||||
| Other borrowings, primarily securities sold under agreements to repurchase |
800,600 | 1,177,600 | ||||||
| Advance payments by borrowers for taxes and insurance |
38,376 | 37,206 | ||||||
| Federal and state income taxes, including net deferred liabilities of $449 and assets of $1,236 |
18,075 | 33,716 | ||||||
| Accrued expenses and other liabilities |
58,699 | 81,098 | ||||||
| 10,836,990 | 10,497,467 | |||||||
| Stockholders’ equity |
||||||||
| Common stock, $1.00 par value, 300,000,000 shares authorized, 129,320,072 and 105,092,724 shares issued; 112,247,748 and 87,916,286 shares outstanding |
129,320 | 105,093 | ||||||
| Paid-in capital |
1,574,555 | 1,261,032 | ||||||
| Accumulated other comprehensive income, net of tax |
54,431 | 2,472 | ||||||
| Treasury stock, at cost; 17,072,324 and 17,176,438 shares |
(208,985 | ) | (210,250 | ) | ||||
| Retained earnings |
196,164 | 174,327 | ||||||
| 1,745,485 | 1,332,674 | |||||||
| $ | 12,582,475 | $ | 11,830,141 | |||||
| SEE NOTES TO CONSOLIDATED FINANCIAL STATEMENTS |
13 |
Table of Contents

CONSOLIDATED STATEMENTS OF OPERATIONS
| Year ended September 30, | 2009 | 2008 | 2007 | |||||||||
| (In thousands, except per share data) | ||||||||||||
| INTEREST INCOME |
||||||||||||
| Loans |
$ | 579,244 | $ | 599,878 | $ | 526,923 | ||||||
| Mortgage-backed securities |
109,486 | 88,425 | 75,478 | |||||||||
| Investment securities |
3,044 | 13,125 | 16,281 | |||||||||
| 691,774 | 701,428 | 618,682 | ||||||||||
| INTEREST EXPENSE |
||||||||||||
| Customer accounts |
191,435 | 259,769 | 243,837 | |||||||||
| FHLB advances and other borrowings |
127,192 | 137,872 | 114,664 | |||||||||
| 318,627 | 397,641 | 358,501 | ||||||||||
| Net interest income |
373,147 | 303,787 | 260,181 | |||||||||
| Provision for loan losses |
193,000 | 60,516 | 1,550 | |||||||||
| Net interest income after provision for loan losses |
180,147 | 243,271 | 258,631 | |||||||||
| OTHER INCOME (LOSS) |
||||||||||||
| Other than temporary impairment charge |
— | (87,747 | ) | — | ||||||||
| Gain on sale of real estate held for sale |
— | 13,123 | — | |||||||||
| Other |
19,009 | 15,433 | 15,241 | |||||||||
| 19,009 | (59,191 | ) | 15,241 | |||||||||
| OTHER EXPENSE |
||||||||||||
| Compensation and fringe benefits |
57,097 | 52,832 | 43,566 | |||||||||
| Amortization of intangibles |
3,331 | 2,441 | 1,819 | |||||||||
| Occupancy expense |
13,049 | 11,213 | 8,720 | |||||||||
| FDIC insurance |
10,688 | 792 | 668 | |||||||||
| Other |
25,105 | 22,945 | 14,210 | |||||||||
| Deferred loan origination costs |
(2,210 | ) | (3,003 | ) | (4,095 | ) | ||||||
| 107,060 | 87,220 | 64,888 | ||||||||||
| Gain (loss) on real estate acquired through foreclosure, net |
(16,354 | ) | (1,021 | ) | 328 | |||||||
| Income before income taxes |
75,742 | 95,839 | 209,312 | |||||||||
| Income taxes |
||||||||||||
| Current |
56,075 | 81,158 | 74,464 | |||||||||
| Deferred |
(28,505 | ) | (47,651 | ) | (169 | ) | ||||||
| 27,570 | 33,507 | 74,295 | ||||||||||
| Net income |
48,172 | 62,332 | 135,017 | |||||||||
| Preferred dividends accrued |
7,488 | — | — | |||||||||
| NET INCOME available to common shareholders |
$ | 40,684 | $ | 62,332 | $ | 135,017 | ||||||
| PER SHARE DATA |
||||||||||||
| Basic earnings per share |
$ | 0.46 | $ | 0.71 | $ | 1.55 | ||||||
| Diluted earnings per share |
0.46 | 0.71 | 1.54 | |||||||||
| Cash dividends |
0.20 | 0.84 | 0.83 | |||||||||
| Basic weighted average number of shares outstanding |
88,689,553 | 87,675,978 | 87,357,444 | |||||||||
| Diluted weighted average number of shares outstanding, including dilutive stock options |
88,711,694 | 87,818,580 | 87,696,225 | |||||||||
|
14 |
SEE NOTES TO CONSOLIDATED FINANCIAL STATEMENTS |
Table of Contents

CONSOLIDATED STATEMENTS OF STOCKHOLDERS’ EQUITY
| Common Stock |
Preferred Stock |
Paid-in Capital |
Retained Earnings |
Accumulated Other Comprehensive Income (loss) |
Treasury Stock |
Total | ||||||||||||||||||||
| (In thousands) | ||||||||||||||||||||||||||
| Balance at September 30, 2006 |
$ | 104,467 | $ | — | $ | 1,246,025 | $ | 123,133 | $ | (5,975 | ) | $ | (204,930 | ) | $ | 1,262,720 | ||||||||||
| Comprehensive income: |
||||||||||||||||||||||||||
| Net Income |
135,017 | 135,017 | ||||||||||||||||||||||||
| Other comprehensive income, |
||||||||||||||||||||||||||
| Unrealized losses on securities |
(7,058 | ) | (7,058 | ) | ||||||||||||||||||||||
| Reclassification adjustment |
— | — | ||||||||||||||||||||||||
| Total comprehensive income |
127,959 | |||||||||||||||||||||||||
| Dividends on common stock |
(72,467 | ) | (72,467 | ) | ||||||||||||||||||||||
| Compensation expense related to |
1,095 | 1,095 | ||||||||||||||||||||||||
| Proceeds from exercise of |
389 | 5,174 | 5,563 | |||||||||||||||||||||||
| Tax benefit related to |
1,189 | 1,189 | ||||||||||||||||||||||||
| Restricted stock |
65 | 234 | — | 299 | ||||||||||||||||||||||
| Proceeds from Employee |
773 | 844 | 1,617 | |||||||||||||||||||||||
| Treasury stock |
(9,848 | ) | (9,848 | ) | ||||||||||||||||||||||
| Balance at September 30, 2007 |
$ | 104,921 | $ | — | $ | 1,254,490 | $ | 185,683 | $ | (13,033 | ) | $ | (213,934 | ) | $ | 1,318,127 | ||||||||||
| Comprehensive income: |
||||||||||||||||||||||||||
| Net income |
62,332 | 62,332 | ||||||||||||||||||||||||
| Other comprehensive income, |
||||||||||||||||||||||||||
| Unrealized gains on securities |
72,540 | 72,540 | ||||||||||||||||||||||||
| Reclassification adjustment |
(57,035 | ) | (57,035 | ) | ||||||||||||||||||||||
| Total comprehensive income |
77,837 | |||||||||||||||||||||||||
| Dividends on common stock |
(73,688 | ) | (73,688 | ) | ||||||||||||||||||||||
| Compensation expense related to |
1,286 | 1,286 | ||||||||||||||||||||||||
| Proceeds from exercise of |
146 | 2,052 | 2,198 | |||||||||||||||||||||||
| Tax benefit related to |
348 | 348 | ||||||||||||||||||||||||
| Restricted stock |
26 | 769 | — | 795 | ||||||||||||||||||||||
| Proceeds from Employee |
2,087 | 3,684 | 5,771 | |||||||||||||||||||||||
| Treasury stock |
— | — | ||||||||||||||||||||||||
| Balance at September 30, 2008 |
$ | 105,093 | $ | — | $ | 1,261,032 | $ | 174,327 | $ | 2,472 | $ | (210,250 | ) | $ | 1,332,674 | |||||||||||
| Comprehensive income: |
||||||||||||||||||||||||||
| Net income |
48,172 | 48,172 | ||||||||||||||||||||||||
| Other comprehensive income, |
||||||||||||||||||||||||||
| Unrealized gains on securities |
51,273 | 51,273 | ||||||||||||||||||||||||
| Reclassification adjustment |
686 | 686 | ||||||||||||||||||||||||
| Total comprehensive income |
100,131 | |||||||||||||||||||||||||
| Preferred stock issuance |
197,873 | 197,873 | ||||||||||||||||||||||||
| Preferred stock discount and accretion |
2,127 | (2,127 | ) | — | ||||||||||||||||||||||
| Dividends on common stock |
(18,847 | ) | (18,847 | ) | ||||||||||||||||||||||
| Dividends on preferred stock |
(5,361 | ) | (5,361 | ) | ||||||||||||||||||||||
| Preferred stock redemption |
(200,000 | ) | (200,000 | ) | ||||||||||||||||||||||
| Compensation expense related to |
1,327 | 1,327 | ||||||||||||||||||||||||
| Proceeds from exercise of |
13 | 145 | 158 | |||||||||||||||||||||||
| Proceeds from issuance |
24,150 | 309,027 | 333,177 | |||||||||||||||||||||||
| Tax benefit related to |
22 | 22 | ||||||||||||||||||||||||
| Restricted stock |
64 | 799 | — | 863 | ||||||||||||||||||||||
| Issuance of Warrants |
2,127 | 2,127 | ||||||||||||||||||||||||
| Proceeds from Employee |
76 | 1,265 | 1,341 | |||||||||||||||||||||||
| Treasury stock |
— | — | ||||||||||||||||||||||||
| Balance at September 30, 2009 |
$ | 129,320 | $ | — | $ | 1,574,555 | $ | 196,164 | $ | 54,431 | $ | (208,985 | ) | $ | 1,745,485 | |||||||||||
| SEE NOTES TO CONSOLIDATED FINANCIAL STATEMENTS |
15 |
Table of Contents

CONSOLIDATED STATEMENTS OF CASH FLOWS
| Year ended September 30, | 2009 | 2008 | 2007 | |||||||||
| (In thousands) | ||||||||||||
| CASH FLOWS FROM OPERATING ACTIVITIES |
||||||||||||
| Net income |
$ | 48,172 | $ | 62,332 | $ | 135,017 | ||||||
| Adjustments to reconcile net income to net cash provided by operating activities |
||||||||||||
| Amortization (accretion) of fees, discounts, premiums and intangible assets, net |
4,813 | 2,951 | 776 | |||||||||
| Depreciation |
5,153 | 4,281 | 3,296 | |||||||||
| Stock option compensation expense |
1,327 | 1,286 | 1,095 | |||||||||
| Provision for loan losses |
193,000 | 60,516 | 1,550 | |||||||||
| Loss (gain) on investment securities and real estate held for sale, net |
15,101 | (12,655 | ) | (339 | ) | |||||||
| Other than temporary impairment |
— | 87,747 | — | |||||||||
| Decrease (increase) in accrued interest receivable |
1,077 | 185 | (5,320 | ) | ||||||||
| Increase (decrease) in income taxes payable |
(45,831 | ) | (48,910 | ) | 1,878 | |||||||
| FHLB stock dividends |
(15 | ) | (103 | ) | (178 | ) | ||||||
| Decrease (increase) in other assets |
(16,156 | ) | (586 | ) | 2,541 | |||||||
| Increase (decrease) in accrued expenses and other liabilities |
(22,399 | ) | 5,186 | 2,490 | ||||||||
| Net cash provided by operating activities |
184,242 | 162,230 | 142,806 | |||||||||
| CASH FLOWS FROM INVESTING ACTIVITIES |
||||||||||||
| Loans originated |
||||||||||||
| Single-family residential |
(855,213 | ) | (857,334 | ) | (827,270 | ) | ||||||
| Construction – speculative |
(102,630 | ) | (218,145 | ) | (518,024 | ) | ||||||
| Construction – custom |
(262,952 | ) | (303,844 | ) | (337,575 | ) | ||||||
| Land – acquisition & development |
(45,425 | ) | (148,221 | ) | (443,793 | ) | ||||||
| Land – consumer lot loans |
(14,681 | ) | (25,909 | ) | (42,299 | ) | ||||||
| Multi-family |
(97,621 | ) | (105,805 | ) | (98,453 | ) | ||||||
| Commercial real estate |
(117,447 | ) | (66,876 | ) | (16,266 | ) | ||||||
| Commercial & industrial |
(243,240 | ) | (187,748 | ) | (10,320 | ) | ||||||
| HELOC |
(85,754 | ) | (63,855 | ) | (5,074 | ) | ||||||
| Consumer |
(15,497 | ) | (96,438 | ) | (2,871 | ) | ||||||
| (1,840,460 | ) | (2,074,175 | ) | (2,301,945 | ) | |||||||
| Loan principal repayments |
2,116,355 | 1,845,324 | 1,718,798 | |||||||||
| Other changes in loans, net |
(204,386 | ) | (269,088 | ) | (128,564 | ) | ||||||
| FHLB stock redeemed |
394 | 748 | 1,762 | |||||||||
| Available-for-sale securities purchased |
(1,175,321 | ) | (313,950 | ) | (328,101 | ) | ||||||
| Principal payments and maturities of available-for-sale securities |
513,218 | 240,368 | 252,417 | |||||||||
| Available-for-sale securities sold |
18,453 | 72,030 | 44,041 | |||||||||
| Principal payments and maturities of held-to-maturity securities |
21,691 | 13,983 | 46,781 | |||||||||
| Net cash paid for acquisition |
— | (166,859 | ) | (35,221 | ) | |||||||
| Proceeds from sales of real estate held for sale |
98,822 | 39,193 | 5,401 | |||||||||
| Premises and equipment purchased |
(5,273 | ) | (22,334 | ) | (2,484 | ) | ||||||
| Net cash used by investing activities |
(456,507 | ) | (634,760 | ) | (727,115 | ) | ||||||
| CASH FLOWS FROM FINANCING ACTIVITIES |
||||||||||||
| Net increase in customer accounts |
672,771 | 426,000 | 305,554 | |||||||||
| Net increase in short-term borrowings |
(377,000 | ) | 102,000 | 105,000 | ||||||||
| Proceeds from long-term borrowings |
100,000 | 436,313 | 490,210 | |||||||||
| Repayments of long-term borrowings |
(19,378 | ) | (408,821 | ) | (228,204 | ) | ||||||
| Proceeds from exercise of common stock options and related tax benefit |
180 | 2,546 | 6,752 | |||||||||
| Dividends paid on common stock |
(18,847 | ) | (73,688 | ) | (72,467 | ) | ||||||
| Dividends paid on preferred stock |
(5,361 | ) | — | — | ||||||||
| Net proceeds from follow on stock offering |
333,177 | — | — | |||||||||
| Proceeds from issuance of preferred stock and warrants |
200,000 | — | — | |||||||||
| Preferred stock redeemed |
(200,000 | ) | — | — | ||||||||
| Proceeds from Employee Stock Ownership Plan |
1,341 | 5,771 | 1,617 | |||||||||
| Treasury stock purchased, net |
— | — | (9,848 | ) | ||||||||
| Increase in advance payments by borrowers for taxes and insurance |
1,170 | 3,631 | 1,351 | |||||||||
| Net cash provided by financing activities |
688,053 | 493,752 | 599,965 | |||||||||
| Increase in cash and cash equivalents |
415,788 | 21,222 | 15,656 | |||||||||
| Cash and cash equivalents at beginning of year |
82,600 | 61,378 | 45,722 | |||||||||
| Cash and cash equivalents at end of year |
$ | 498,388 | $ | 82,600 | $ | 61,378 | ||||||
|
16 |
SEE NOTES TO CONSOLIDATED FINANCIAL STATEMENTS |
Table of Contents
| Year ended September 30, | 2009 | 2008 | 2007 | ||||||||
| (In thousands) | |||||||||||
| CASH FLOWS FROM OPERATING ACTIVITIES |
|||||||||||
| SUPPLEMENTAL DISCLOSURES OF CASH FLOW INFORMATION |
|||||||||||
| Noncash investing activities |
|||||||||||
| Real estate acquired through foreclosure |
$ | 254,742 | $ | 58,509 | $ | 5,951 | |||||
| Cash paid during the year for |
|||||||||||
| Interest |
325,157 | 391,209 | 355,688 | ||||||||
| Income taxes |
77,761 | 83,239 | 70,942 | ||||||||
| The following summarizes the non-cash activities related to the First Mutual acquisition (2008) and the First Federal acquisition (2007) |
|||||||||||
| Fair value of assets and intangibles acquired, including goodwill |
(1,186,754 | ) | (576,750 | ) | |||||||
| Fair value of liabilities assumed |
1,005,769 | 480,033 | |||||||||
| Cash paid out for acquisition |
(180,985 | ) | (96,717 | ) | |||||||
| Plus cash acquired |
14,126 | 61,496 | |||||||||
| Net cash paid out for acquisition |
$ | — | $ | (166,859 | ) | $ | (35,221 | ) | |||
| SEE NOTES TO CONSOLIDATED FINANCIAL STATEMENTS |
17 |
Table of Contents

NOTES TO CONSOLIDATED FINANCIAL STATEMENTS
YEARS ENDED SEPTEMBER 30, 2009, 2008 AND 2007
| NOTE A |
SUMMARY OF SIGNIFICANT ACCOUNTING POLICIES |
Principles of consolidation. The consolidated financial statements include the accounts of Washington Federal, Inc. (Company or Washington Federal) and its wholly owned subsidiaries. Intercompany transactions and balances have been eliminated.
Description of business. Washington Federal is a unitary thrift holding company. The Company’s principal operating subsidiary is Washington Federal Savings. The Company is principally engaged in the business of attracting savings deposits from the general public and investing these funds, together with borrowings and other funds, in one-to-four family residential real estate loans, multi-family real estate and commercial loans. The Company conducts its activities through a network of 150 offices located in Washington, Oregon, Idaho, Utah, Arizona, Nevada, New Mexico, and Texas.
On February 1, 2008, the Company acquired 100% of the outstanding shares of First Mutual. The merger agreement provided for the merger of First Mutual with and into the Company, followed by the merger of First Mutual Bank, a state savings bank and wholly owned subsidiary of First Mutual, into the Company’s wholly owned subsidiary, Washington Federal Savings and Loan Association. As a result of the acquisition, Washington Federal added 169 employees and 12 branches primarily located on the rapidly growing eastside of Seattle. The acquisition was accounted for as a purchase transaction with the total cash consideration funded through internal sources. As of February 1, 2008, the fair value of First Mutual’s assets and liabilities prior to the acquisition were: loans $933 million, investments $24 million, cash $14 million, property $35 million, other assets $29 million, deposits $744 million, borrowings $209 million and other liabilities $14 million. The purchase price was $219,849,000, which included $180,985,000 paid in cash as well as $38,864,000 of assumed liabilities (see related discussion in the following paragraph). The purchase price has been allocated to the underlying assets and liabilities based on estimated fair values at the date of acquisition. Results of operations are included from the date of acquisition. The Company acquired assets with an estimated fair value of $1,186,754,000 and assumed liabilities with an estimated fair value of $1,005,769,000. The acquisition produced goodwill of $149,246,000 and a core deposit intangible of $2,523,000.
During the quarter ended June 30, 2009, the Company became aware of a tax liability of $39 million resulting from the acquisition of First Mutual, Inc. in February 2008. Although substantial uncertainty remains as to the ultimate outcome of this matter, under current U.S. accounting rules, the Company should have recorded this as an income tax liability, with a corresponding increase to goodwill, in purchase accounting. As a result, the Company has corrected the September 30, 2008, consolidated balance sheet for the $39 million increase in income tax liability and goodwill from amounts previously reported of $0 and $213 million, respectively. The only income statement impact was $1.5 million of additional tax expense recognized in the quarter ended June 30, 2009, resulting from interest due on the tax liability. The Company is in discussions with the IRS regarding this matter and will pursue all available remedies to mitigate the financial impact to the Company.
The balance of the Company’s intangible assets was as follows, which includes the additional goodwill discussed above:
| Goodwill | Servicing Rights Intangible |
Core Deposit Intangible |
Non- Compete Agreements |
Total | |||||||||||||||
| (In thousands) | |||||||||||||||||||
| Balance at September 30, 2007 |
$ | 102,407 | $ | — | $ | 4,733 | $ | 105 | $ | 107,245 | |||||||||
| First Mutual acquisition |
149,246 | 4,233 | 2,523 | 0 | 156,002 | ||||||||||||||
| Additions |
— | 552 | — | — | 552 | ||||||||||||||
| Accumulated amortization |
— | (1,201 | ) | (2,335 | ) | (105 | ) | (3,641 | ) | ||||||||||
| Balance at September 30, 2008 |
251,653 | 3,584 | 4,921 | — | 260,158 | ||||||||||||||
| Additions |
— | — | — | — | — | ||||||||||||||
| Accumulated amortization |
— | (1,115 | ) | (2,246 | ) | (3,361 | ) | ||||||||||||
| Balance at September 30, 2009 |
$ | 251,653 | $ | 2,469 | $ | 2,675 | $ | — | $ | 256,797 | |||||||||
The Company’s fiscal year end is September 30th. All references to 2009, 2008 and 2007 represent balances as of September 30, 2009, September 30, 2008 and September 30, 2007, or activity for the fiscal years then ended. References to net income in this document refer to net income available to common shareholders.
18
Table of Contents
NOTES TO CONSOLIDATED FINANCIAL STATEMENTS (CONTINUED)
Cash and cash equivalents. Cash and cash equivalents include cash on hand, amounts due from banks, overnight investments and repurchase agreements with an initial maturity of three months or less.
Investments and mortgage-backed securities. The Company accounts for investments and mortgage-backed securities in two categories: held-to-maturity and available-for-sale.
Held-to-maturity securities – Securities classified as held-to-maturity are accounted for at amortized cost, but the Company must have both the positive intent and the ability to hold those securities to maturity. There are very limited circumstances under which securities in the held-to-maturity category can be sold without jeopardizing the cost basis of accounting for the remainder of the securities in this category.
Available-for-sale securities – Securities not classified as held-to-maturity are considered to be available-for-sale. Gains and losses realized on the sale of these securities are based on the specific identification method. Unrealized gains and losses for available-for-sale securities are excluded from earnings and reported as a net amount in the accumulated other comprehensive income component of stockholders’ equity.
The Company periodically evaluates each of its investments in debt and equity securities, classified as available-for-sale or held-to-maturity, with a decline in market value below the amortized cost of the investment, to determine whether or not the decline is deemed to be other-than-temporary. If it is determined that the impairment is other than temporary for equity securities, the impairment loss is recognized in earnings equal to the difference between the investment’s cost and its fair value. If it is determined that the impairment is other than temporary for debt securities, the Company will recognize the credit component of an other-than-temporary impairment in earnings and the noncredit component in other comprehensive income when the Company does not intend to sell the security and it is more likely than not that the Company will not be required to sell the security prior to recovery. In evaluating investments with declines in value, the Company considers the length of the time and the extent to which the market value has been less than cost, the financial condition and near-term prospects of the issuer, and the Company’s intent or plans to sell with regard to the investment.
Premiums and discounts on investments are deferred and recognized over the life of the asset using the effective interest method.
Realized gains and losses on securities sold as well as other than temporary impairment charges are shown on the Consolidated Statements of Operations under the Other Income (Loss) heading.
Loans receivable. Loans receivable more than 90 days past due are placed on non-accrual status and an allowance for accrued interest is established. Any interest ultimately collected is credited to income in the period of recovery.
The Company maintains an allowance for loan losses to absorb losses inherent in the loan portfolio. The allowance is based on ongoing, quarterly assessments of the probable and estimable losses inherent in the loan portfolio. The Company’s methodology for assessing the appropriateness of the allowance consists of two components, which include the general allowance and specific allowances.
The general loan loss allowance is established by applying a loss percentage factor to the different loan types. The allowances are provided based on Management’s continuing evaluation of the pertinent factors underlying the quality of the loan portfolio, including changes in the size and composition of the loan portfolio, actual loan loss experience, current economic conditions, collateral values, geographic concentrations, seasoning of the loan portfolio, specific industry conditions, and the duration of the current business cycle. The recovery of the carrying value of loans is susceptible to future market conditions beyond the Company’s control, which may result in losses or recoveries differing from those provided.
Specific allowances are established for loans which are individually evaluated, in cases where Management has identified significant conditions or circumstances related to a loan that Management believes indicate the probability that a loss has been incurred.
Loans for commercial purposes, including multi-family loans, builder construction loans and commercial loans are reviewed on an individual basis to assess the ability of the borrowers to continue to service all of their principal and interest obligations. If a loan shows signs of weakness, it is downgraded and, if warranted, placed on non-accrual status. The Company has an asset quality review function that reports the results of its internal reviews to the Board of Directors on a quarterly basis.
19
Table of Contents
Impaired loans consist of loans receivable that are not expected to be repaid in accordance with their contractual terms and are measured using the fair value of the collateral. Smaller balance loans are excluded from this analysis.
Premises and equipment. Premises and equipment are stated at cost, less accumulated depreciation. Depreciation is computed on the straight-line method over the estimated useful lives of the respective assets. Expenditures are capitalized for betterments and major renewals. Charges for ordinary maintenance and repairs are expensed to operations as incurred.
Real estate held for sale. Properties acquired in settlement of loans or acquired for development are recorded at the lower of cost or fair value less selling costs.
Intangible assets. Goodwill represents the excess of the cost of businesses acquired over the fair value of the net assets acquired. The core deposit intangibles and non-compete agreement intangible are acquired assets that lack physical substance but can be distinguished from goodwill. Goodwill is evaluated for impairment on an annual basis. Other intangible assets are amortized over their estimated lives and are subject to impairment testing when events or circumstances change. If circumstances indicate that the carrying value of the assets may not be recoverable, an impairment charge could be recorded. No impairment of intangible assets has ever been identified. The Company amortizes the three core deposit intangibles on an accelerated basis over their estimated lives of 7, 3 and 8 years; the non-compete agreement intangible, which was fully amortized as of September 30, 2009, was amortized on a straight-line basis over its life of five years.
The table below presents the estimated core deposit intangible asset amortization expense for the next five years:
| Year ended September 30, | Amortization expense | ||
| (In thousands) | |||
| 2010 |
$ | 1,031 | |
| 2011 |
330 | ||
| 2012 |
330 | ||
| 2013 |
330 | ||
| 2014 |
330 | ||
Deferred fees and discounts on loans. Loan discounts and loan fees are deferred and recognized over the life of the loans using the effective interest method.
Accounting for stock-based compensation. The Company records an expense for the estimated fair value of equity awards over the vesting period. See Note L for additional information. 2,885,440 stock options were antidilutive as of September 30, 2009.
Use of estimates. The preparation of financial statements in conformity with accounting principles generally accepted in the United States of America requires Management to make estimates and assumptions that affect the reported amounts of assets and liabilities and disclosure of contingent assets and liabilities at the date of the financial statements and the reported amounts of revenues and expenses during the reporting period. Significant estimates reported in the financial statements include the allowance for loan losses, intangible assets, deferred taxes and contingent liabilities. Actual results could differ from these estimates.
New accounting pronouncements. In September 2006, the Financial Accounting Standards Board (“FASB”) issued Accounting Standards Codification (“ASC”) 820-10, Fair Value Measurements and Disclosures. This standard defines fair value, establishes a framework for measuring fair value and expands disclosures about fair value measurements. This standard establishes a fair value hierarchy for the assumptions used to measure fair value and clarifies assumptions about risk and the effect of a restriction on the sale or use of an asset. No additional fair value measurements are required under this standard. The Company adopted this standard effective October 1, 2008. See Notes B and Q for disclosures related to the adoption of this standard.
In April 2009, the FASB issued ASC 320-10-65, Investments-Debt are Equity Securities. This standard amends the other-than-temporary impairment guidance in U.S. generally accepted accounting principles (“GAAP”) for debt securities to make it more operational and to improve the presentation and disclosure of other-than-temporary impairments on debt and equity securities. This standard was effective for interim and annual reporting periods ending after June 15, 2009 with early adoption
20
Table of Contents
NOTES TO CONSOLIDATED FINANCIAL STATEMENTS (CONTINUED)
| permitted for periods ending after March 15, 2009. The Company adopted this standard effective June 30, 2009, and its adoption did not have a material effect on the Company’s financial position or results of operations. |
In April 2009, the FASB issued ASC 825-10-65, Financial Instruments. This standard requires disclosures about the fair value of financial instruments for interim reporting periods of publicly traded companies as well as in annual financial statements. This standard also amends ACS 270-10, Interim Reporting, to require those disclosures in summarized financial information at interim reporting periods. The Company adopted this standard effective June 30, 2009.
In April 2009, the FASB issued ASC 820-10-65, Fair Value Measurements and Disclosures. This standard provides additional guidance for estimating fair value in accordance with ASC 820-10, when the transaction volume and level of market activity for the asset or liability have significantly decreased. This standard also includes guidance on identifying circumstances that indicate a transaction is not orderly. The Company adopted this standard effective June 30, 2009, and its adoption did not have a material effect on the Company’s financial position or results of operations.
In May 2009, the FASB issued ASC 855-10, Subsequent Events. This standard establishes guidelines under which an entity shall recognize and disclose events that occur after a balance sheet date but before the related financial statements are issued or are available to be issued. ASC 855-10 is effective for fiscal years and interim periods ending after June 15, 2009. Adoption of this standard as of June 30, 2009 had no impact on the Company’s consolidated financial position or results of operations. See related disclosure at the end of Note A.
In June 2009, the FASB issued ASC 105-10, Generally Accepted Accounting Principles. ASC 105-10 was effective for fiscal years and interim periods ending after September 15, 2009 and is the sole source of authoritative U.S. GAAP. Adoption of ASC 105-10 as of September 30, 2009 did not have a material impact on the Company’s consolidated financial position or results of operations as it did not alter existing U.S. GAAP.
Accounting pronouncements not yet adopted. In June 2009, the FASB issued SFAS No. 166, “Accounting for Transfers of Financial Assets—an amendment of FASB Statement No. 140.” SFAS No. 166 amends SFAS No. 140 to improve the relevance and comparability of the information that a reporting entity provides in its financial statements about a transfer of financial assets; the effects of a transfer on its financial position, financial performance, and cash flows; and the transferor’s continuing involvement, if any, in transferred financial assets. SFAS No. 166 is effective for interim and annual reporting periods that begin after November 15, 2009. The Company is currently assessing the impact of the adoption of SFAS No. 166 on its consolidated financial position and results of operations.
In June 2009, the FASB also issued SFAS No. 167, “Amendments to FASB Interpretation No. 46(R).” SFAS No. 167 significantly changes the criteria for determining whether the consolidation of a variable interest entity is required. SFAS No. 167 also addresses the effect of changes required by SFAS No. 166 on FASB Interpretation No. 46(R), “Consolidation of Variable Interest Entities,” and concerns regarding the application of certain provisions of Interpretation No. 46(R), including concerns that the accounting and disclosures under the Interpretation do not always provide timely and useful information about an entity’s involvement in a variable interest entity. SFAS No. 167 is effective for interim and annual reporting periods that begin after November 15, 2009. The Company is currently assessing the impact of the adoption of SFAS No. 167 on its consolidated financial position and results of operations.
Business segments. As the Company manages its business and operations on a consolidated basis, management has determined that there is one reportable business segment.
Reclassifications. Certain reclassifications have been made to the financial statements for years prior to September 30, 2009 to conform to current year classifications.
Subsequent events review. Events occurring subsequent to the date of the balance sheet have been evaluated for potential recognition or disclosure in the consolidated financial statements through November 2, 2009, the date of the filing of the consolidated financial statements with the Securities and Exchange Commission.
21
Table of Contents
| NOTE B |
INVESTMENT SECURITIES |
| September 30, | 2009 | |||||||||||||||
| Amortized Cost |
Gross Unrealized | Fair Value |
Yield | |||||||||||||
| Gains | Losses | |||||||||||||||
| (In thousands) | ||||||||||||||||
| Available-for-sale securities |
||||||||||||||||
| U.S. government and agency securities due |
||||||||||||||||
| Within 1 year |
$ | 500 | $ | 15 | $ | — | $ | 515 | 4.00 | % | ||||||
| 1 to 5 years |
— | — | — | — | 0.00 | % | ||||||||||
| 5 to 10 years |
9,300 | 4,009 | — | 13,309 | 10.38 | % | ||||||||||
| Over 10 years |
— | — | — | — | 0.00 | % | ||||||||||
| Mortgage-Backed Securities |
||||||||||||||||
| Agency pass-through certificates |
2,105,227 | 82,041 | (9 | ) | 2,187,259 | 5.77 | % | |||||||||
| 2,115,027 | 86,065 | (9 | ) | 2,201,083 | 5.79 | % | ||||||||||
| Held-to-maturity securities |
||||||||||||||||
| Tax-exempt municipal bonds due |
||||||||||||||||
| 1 to 5 years |
1,140 | 100 | — | 1,240 | 6.60 | % | ||||||||||
| 5 to 10 years |
— | — | — | — | 0.00 | % | ||||||||||
| Over 10 years |
6,295 | 445 | — | 6,740 | 5.72 | % | ||||||||||
| U.S. government and agency securities due |
||||||||||||||||
| 1 to 5 years |
— | — | — | — | 0.00 | % | ||||||||||
| Mortgage-Backed Securities |
||||||||||||||||
| Agency pass-through certificates |
95,607 | 3,676 | — | 99,283 | 5.57 | % | ||||||||||
| 103,042 | 4,221 | — | 107,263 | 5.59 | % | |||||||||||
| $ | 2,218,069 | $ | 90,286 | $ | (9 | ) | $ | 2,308,346 | 5.78 | % | ||||||
| September 30, | 2008 | |||||||||||||||
| Amortized Cost |
Gross Unrealized | Fair Value |
Yield | |||||||||||||
| Gains | Losses | |||||||||||||||
| (In thousands) | ||||||||||||||||
| Available-for-sale securities |
||||||||||||||||
| U.S. government and agency securities due |
||||||||||||||||
| Within 1 year |
$ | 25,500 | $ | — | $ | (452 | ) | $ | 25,048 | 5.96 | % | |||||
| 1 to 5 years |
— | — | — | — | 0.00 | % | ||||||||||
| 5 to 10 years |
11,753 | 4,978 | (548 | ) | 16,183 | 8.21 | % | |||||||||
| Over 10 years |
— | — | — | — | 0.00 | % | ||||||||||
| Mortgage-Backed Securities |
||||||||||||||||
| Agency pass-through certificates |
1,434,907 | 10,425 | (10,496 | ) | 1,434,836 | 5.75 | % | |||||||||
| 1,472,160 | 15,403 | (11,496 | ) | 1,476,067 | 5.77 | % | ||||||||||
| Held-to-maturity securities |
||||||||||||||||
| Tax-exempt municipal bonds due |
||||||||||||||||
| 1 to 5 years |
1,470 | 105 | — | 1,575 | 6.60 | % | ||||||||||
| 5 to 10 years |
— | — | — | — | 0.00 | % | ||||||||||
| Over 10 years |
6,300 | 431 | — | 6,731 | 5.72 | % | ||||||||||
| U.S. government and agency securities due |
||||||||||||||||
| 1 to 5 years |
— | — | — | — | 0.00 | % | ||||||||||
| Mortgage-Backed Securities |
||||||||||||||||
| Agency pass-through certificates |
116,767 | 704 | (2,429 | ) | 115,042 | 5.56 | % | |||||||||
| 124,537 | 1,240 | (2,429 | ) | 123,348 | 5.58 | % | ||||||||||
| $ | 1,596,697 | $ | 16,643 | $ | (13,925 | ) | $ | 1,599,415 | 5.76 | % | ||||||
$18,453,000 of available-for-sale securities were sold in 2009, resulting in a net gain of $1,063,000. $72,030,000 of available-for-sale securities were sold in 2008, resulting in no gain. $44,041,000 of available-for-sale securities were sold in 2007, resulting in a gain of $11,000.
Substantially all mortgage-backed securities have contractual due dates that exceed 10 years.
22
Table of Contents
NOTES TO CONSOLIDATED FINANCIAL STATEMENTS (CONTINUED)
During the fourth quarter of 2008, the Company recorded an other than temporary impairment charge of $87,747,000 on its investment in Freddie Mac and Fannie Mae preferred stock. The value of these securities declined significantly after the U.S. Government placed both companies into conservatorship in September 2008. The securities were sold during 2009 at a small gain relative to their carrying value after the impairment charge.
The following table shows the unrealized gross losses and fair value of securities at September 30, 2009, by length of time that individual securities in each category have been in a continuous loss position. The Company had only $270,000 in fair value of securities in a continuous loss position for 12 or more months at September 30, 2009, which consisted of mortgage-backed securities. Management believes that the declines in fair value of these investments are not an other than temporary impairment.
| As of September 30, | 2009 | |||||||||||||||||||
| Less than 12 months | 12 months or more | Total | ||||||||||||||||||
| Unrealized Gross Losses |
Fair Value |
Unrealized Gross Losses |
Fair Value |
Unrealized Gross Losses |
Fair Value | |||||||||||||||
| (In thousands) | ||||||||||||||||||||
| U.S. agency securities |
$ | — | $ | — | $ | — | $ | — | $ | — | $ | — | ||||||||
| Agency pass-through certificates |
— | — | (9 | ) | 270 | (9 | ) | 270 | ||||||||||||
| $ | — | $ | — | $ | (9 | ) | $ | 270 | $ | (9 | ) | $ | 270 | |||||||
| NOTE C |
LOANS RECEIVABLE |
| September 30, | 2009 | 2008 | ||||
| (In thousands) | ||||||
| Single-family residential |
$ | 6,785,723 | $ | 6,868,956 | ||
| Construction – speculative |
267,430 | 439,616 | ||||
| Construction – custom |
258,839 | 317,894 | ||||
| Land – acquisition & development |
519,130 | 724,421 | ||||
| Land – consumer lot loans |
195,812 | 210,816 | ||||
| Multi-family |
705,212 | 683,508 | ||||
| Commercial Real Estate |
294,109 | 282,138 | ||||
| Commercial and Industrial |
119,019 | 151,844 | ||||
| HELOC |
122,184 | 80,407 | ||||
| Consumer |
120,081 | 153,072 | ||||
| 9,387,539 | 9,912,672 | |||||
| Less |
||||||
| Allowance for probable losses |
166,836 | 85,058 | ||||
| Loans in process |
200,919 | 288,579 | ||||
| Deferred net loan origination fees |
36,354 | 37,415 | ||||
| 404,109 | 411,052 | |||||
| $ | 8,983,430 | $ | 9,501,620 | |||
The Company originates fixed and adjustable interest rate loans, which at September 30, 2009 consisted of the following:
| Fixed-Rate | Adjustable-Rate | |||||||||
| Term to Maturity | Book Value | Term to Rate Adjustment | Book Value | |||||||
| (In thousands) | (In thousands) | |||||||||
| Within 1 year |
$ | 97,620 | Less than 1 year | $ | 881,102 | |||||
| 1 to 3 years |
129,597 | 1 to 3 years | 146,815 | |||||||
| 3 to 5 years |
122,676 | 3 to 5 years | 257,038 | |||||||
| 5 to 10 years |
399,300 | 5 to 10 years | 310,085 | |||||||
| 10 to 20 years |
676,587 | 10 to 20 years | 45,837 | |||||||
| Over 20 years |
6,160,633 | Over 20 years | 160,249 | |||||||
| $ | 7,586,413 | $ | 1,801,126 | |||||||
23
Table of Contents
At September 30, 2009 and 2008, approximately $57,124,000 and $65,576,000 of fixed-rate loan origination commitments were outstanding, respectively. Loans serviced for others at September 30, 2009 and 2008 were approximately $132,751,000 and $157,045,000, respectively.
Permanent single-family residential loans receivable included adjustable-rate loans of $229,580,000 and $424,377,000 at September 30, 2009 and 2008, respectively. These loans have interest rate adjustment limitations and are generally indexed to the 1-year Treasury Bill rate or the Fannie Mae 30 year/30 day commit rate published each Wednesday in the Wall Street Jourrnal.
Gross loans by geographic concentration were as follows:
| September 30, 2009 |
Single- family residential |
Multi- family |
Land - acquisition |
Land - consumer lot loans |
Construction - custom |
Construction - speculative |
Commercial real estate |
Commercial & industrial |
Consumer | HELOC | Total | ||||||||||||||||||||||
| (In thousands) | |||||||||||||||||||||||||||||||||
| Washington |
$ | 2,800,450 | $ | 220,929 | $ | 297,163 | $ | 92,076 | $ | 172,762 | $ | 154,836 | $ | 198,837 | $ | 102,895 | $ | 12,699 | $ | 74,284 | $ | 4,126,931 | |||||||||||
| Oregon |
1,094,773 | 304,433 | 54,620 | 40,443 | 39,643 | 43,146 | — | — | 5,881 | 7,445 | 1,590,384 | ||||||||||||||||||||||
| Other |
656,652 | 9,209 | — | 2 | — | — | — | — | 82,983 | — | 748,846 | ||||||||||||||||||||||
| Idaho |
570,571 | 33,995 | 27,520 | 23,322 | 12,366 | 19,768 | — | — | 136 | 3,416 | 691,094 | ||||||||||||||||||||||
| Arizona |
626,835 | 68,899 | 51,127 | 17,607 | 8,622 | 23,195 | — | — | 953 | 5,312 | 802,550 | ||||||||||||||||||||||
| Utah |
597,599 | 52,411 | 31,902 | 11,237 | 19,194 | 10,118 | — | — | 54 | 6,342 | 728,857 | ||||||||||||||||||||||
| New Mexico |
168,006 | 5,930 | 40,743 | 7,974 | 1,057 | 13,213 | 95,272 | 16,124 | 5,554 | 25,060 | 378,933 | ||||||||||||||||||||||
| Texas |
131,337 | 3,385 | 8,285 | 1,058 | 5,195 | 843 | — | — | 11,313 | — | 161,416 | ||||||||||||||||||||||
| Nevada |
139,500 | 6,021 | 7,770 | 2,093 | — | 2,311 | — | — | 508 | 325 | 158,528 | ||||||||||||||||||||||
| $ | 6,785,723 | $ | 705,212 | $ | 519,130 | $ | 195,812 | $ | 258,839 | $ | 267,430 | $ | 294,109 | $ | 119,019 | $ | 120,081 | $ | 122,184 | $ | 9,387,539 | ||||||||||||
| Percentage of gross loans by geographic concentration as a % of total were as follows:
| |||||||||||||||||||||||||||||||||
| September 30, 2009 |
Single- family residential |
Multi- family |
Land - acquisition & development |
Land - consumer lot loans |
Construction - custom |
Construction - speculative |
Commercial real estate |
Commercial & industrial |
Consumer | HELOC | Total | ||||||||||||||||||||||
| (As a % of total gross loans) | |||||||||||||||||||||||||||||||||
| Washington |
29.8% | 2.4% | 3.2% | 1.0% | 1.8% | 1.6% | 2.1% | 1.1% | 0.1% | 0.8% | 43.9% | ||||||||||||||||||||||
| Oregon |
11.7% | 3.2% | 0.6% | 0.4% | 0.4% | 0.5% | 0.0% | 0.0% | 0.1% | 0.1% | 17.0% | ||||||||||||||||||||||
| Other |
7.0% | 0.1% | 0.0% | 0.0% | 0.0% | 0.0% | 0.0% | 0.0% | 0.9% | 0.0% | 8.0% | ||||||||||||||||||||||
| Idaho |
6.1% | 0.4% | 0.3% | 0.2% | 0.1% | 0.2% | 0.0% | 0.0% | 0.0% | 0.0% | 7.3% | ||||||||||||||||||||||
| Arizona |
6.7% | 0.7% | 0.5% | 0.2% | 0.1% | 0.2% | 0.0% | 0.0% | 0.0% | 0.1% | 8.5% | ||||||||||||||||||||||
| Utah |
6.4% | 0.6% | 0.3% | 0.1% | 0.2% | 0.1% | 0.0% | 0.0% | 0.0% | 0.1% | 7.8% | ||||||||||||||||||||||
| New Mexico |
1.8% | 0.1% | 0.4% | 0.1% | 0.0% | 0.1% | 1.0% | 0.2% | 0.1% | 0.3% | 4.1% | ||||||||||||||||||||||
| Texas |
1.4% | 0.0% | 0.1% | 0.0% | 0.1% | 0.0% | 0.0% | 0.0% | 0.1% | 0.0% | 1.7% | ||||||||||||||||||||||
| Nevada |
1.5% | 0.1% | 0.1% | 0.0% | 0.0% | 0.0% | 0.0% | 0.0% | 0.0% | 0.0% | 1.7% | ||||||||||||||||||||||
| 72.40% | 7.60% | 5.50% | 2.00% | 2.70% | 2.70% | 3.10% | 1.30% | 1.30% | 1.40% | 100.00% | |||||||||||||||||||||||
| Percentage of gross loans by type and geographic concentration as % of each type were as follows:
| |||||||||||||||||||||||||||||||||
| September 30, 2009 |
Single- family residential |
Multi- family |
Land - acquisition & development |
Land - consumer lot loans |
Construction - custom |
Construction - speculative |
Commercial real estate |
Commercial & industrial |
Consumer | HELOC | |||||||||||||||||||||||
| (As a % of gross loans by type) | |||||||||||||||||||||||||||||||||
| Washington |
41.3% | 31.3% | 57.4% | 47.0% | 66.8% | 57.9% | 67.6% | 86.5% | 10.6% | 60.8% | |||||||||||||||||||||||
| Oregon |
16.1% | 43.2% | 10.5% | 20.7% | 15.3% | 16.1% | 0.0% | 0.0% | 4.9% | 6.1% | |||||||||||||||||||||||
| Other |
9.7% | 1.3% | 0.0% | 0.0% | 0.0% | 0.0% | 0.0% | 0.0% | 69.2% | 0.0% | |||||||||||||||||||||||
| Idaho |
8.4% | 4.8% | 5.3% | 11.9% | 4.8% | 7.4% | 0.0% | 0.0% | 0.1% | 2.8% | |||||||||||||||||||||||
| Arizona |
9.2% | 9.8% | 9.8% | 9.0% | 3.3% | 8.7% | 0.0% | 0.0% | 0.8% | 4.3% | |||||||||||||||||||||||
| Utah |
8.8% | 7.4% | 6.1% | 5.7% | 7.4% | 3.8% | 0.0% | 0.0% | 0.0% | 5.2% | |||||||||||||||||||||||
| New Mexico |
2.5% | 0.8% | 7.8% | 4.1% | 0.4% | 4.9% | 32.4% | 13.5% | 4.6% | 20.5% | |||||||||||||||||||||||
| Texas |
1.9% | 0.5% | 1.6% | 0.5% | 2.0% | 0.3% | 0.0% | 0.0% | 9.4% | 0.0% | |||||||||||||||||||||||
| Nevada |
2.1% | 0.9% | 1.5% | 1.1% | 0.0% | 0.9% | 0.0% | 0.0% | 0.4% | 0.3% | |||||||||||||||||||||||
| 100.00% | 100.00% | 100.00% | 100.00% | 100.00% | 100.00% | 100.00% | 100.00% | 100.00% | 100.00% | ||||||||||||||||||||||||
24
Table of Contents
NOTES TO CONSOLIDATED FINANCIAL STATEMENTS (CONTINUED)
At September 30, 2009, the Company’s recorded investment in impaired loans was $531,817,000, of which $318,543,000 have allocated reserves of $107,375,000. At September 30, 2008, the Company’s recorded investment in impaired loans was $134,438,000, of which $98,654,000 had allocated reserves of $28,755,000. The average balance of impaired loans during 2009, 2008 and 2007 was $442,321,000, $82,176,000 and $7,773,000, and interest income from impaired loans was $27,158,000, $5,284,000 and $522,000, respectively.
| NOTE D |
ALLOWANCE FOR LOSSES ON LOANS |
| Year ended September 30, | 2009 | 2008 | ||||||
| (In thousands) | ||||||||
| Balance at beginning of year |
$ | 85,058 | $ | 28,520 | ||||
| Provision for loan losses |
193,000 | 60,516 | ||||||
| Charge-offs |
(112,873 | ) | (15,193 | ) | ||||
| Recoveries |
1,651 | 34 | ||||||
| Acquired reserves |
— | 11,181 | ||||||
| Balance at end of year |
$ | 166,836 | $ | 85,058 | ||||
| NOTE E |
INTEREST RECEIVABLE |
| September 30, | 2009 | 2008 | ||||||
| (In thousands) | ||||||||
| Loans receivable |
$ | 54,908 | $ | 50,816 | ||||
| Allowance for uncollected interest on loans receivable |
(12,773 | ) | (4,489 | ) | ||||
| Mortgage-backed securities |
10,543 | 7,422 | ||||||
| Investment securities |
610 | 616 | ||||||
| $ | 53,288 | $ | 54,365 | |||||
| NOTE F |
PREMISES AND EQUIPMENT |
| September 30, | 2009 | 2008 | ||||||||
| (In thousands) | ||||||||||
| Estimated Useful Life |
||||||||||
| Land |
— | $ | 60,060 | $ | 60,065 | |||||
| Buildings |
25 - 40 | 92,499 | 90,679 | |||||||
| Leasehold improvements |
7 - 15 | 5,512 | 5,532 | |||||||
| Furniture, fixtures and equipment |
2 - 10 | 19,863 | 17,008 | |||||||
| 177,934 | 173,284 | |||||||||
| Less accumulated depreciation and amortization |
(44,457 | ) | (39,927 | ) | ||||||
| $ | 133,477 | $ | 133,357 | |||||||
The Company has non-cancelable operating leases for branch offices. Future minimum net rental commitments for all non-cancelable leases, including maintenance and associated costs, were as follows: $3 million for 2010, $2 million for 2011, $1 million for 2012, $1 million for 2013 and $2 million thereafter. Rental expense, including amounts paid under month-to-month cancelable leases, amounted to $2,710,000, $2,613,000 and $2,487,000 in 2009, 2008 and 2007, respectively.
25
Table of Contents
| NOTE G |
CUSTOMER ACCOUNTS |
| September 30, | 2009 | 2008 | ||||
| (In thousands) | ||||||
| Checking accounts, .75% and under |
$ | 526,321 | $ | 516,972 | ||
| Passbook and statement accounts, .50% and under |
197,025 | 188,546 | ||||
| Insured money market accounts, .01% to 1.00% |
1,214,812 | 1,231,542 | ||||
| Certificate accounts |
||||||
| Less than 2.00% |
1,765,881 | 11,951 | ||||
| 2.00% to 2.99% |
3,220,833 | 880,676 | ||||
| 3.00% to 3.99% |
457,425 | 2,887,138 | ||||
| 4.00% to 4.99% |
370,967 | 1,346,039 | ||||
| 5.00% to 5.99% |
33,203 | 83,181 | ||||
| Total certificates |
5,848,309 | 5,208,985 | ||||
| Repurchase agreements with customers, .01% to 3.50% |
55,843 | 23,494 | ||||
| $ | 7,842,310 | $ | 7,169,539 | |||
| Certificate maturities are as follows: |
||||||
| September 30, | 2009 | 2008 | ||||
| (In thousands) | ||||||
| Within 1 year |
$ | 4,732,493 | $ | 4,557,174 | ||
| 1 to 2 years |
747,839 | 377,619 | ||||
| 2 to 3 years |
156,402 | 98,202 | ||||
| Over 3 years |
211,575 | 175,990 | ||||
| $ | 5,848,309 | $ | 5,208,985 | |||
Customer accounts over $100,000 totaled $2,835,393,000 as of September 30, 2009 and $2,423,000,000 as of September 30, 2008.
Interest expense on customer accounts consisted of the following:
| Year ended September 30, | 2009 | 2008 | 2007 | |||||||||
| (In thousands) | ||||||||||||
| Checking accounts |
$ | 3,144 | $ | 6,813 | $ | 5,572 | ||||||
| Passbook and statement accounts |
1,441 | 2,724 | 2,902 | |||||||||
| Insured money market accounts |
16,488 | 25,571 | 22,309 | |||||||||
| Certificate accounts |
170,001 | 224,973 | 213,242 | |||||||||
| 191,074 | 260,081 | 244,025 | ||||||||||
| Repurchase agreements with customers |
1,061 | 547 | 817 | |||||||||
| 192,135 | 260,628 | 244,842 | ||||||||||
| Less early withdrawal penalties |
(700 | ) | (859 | ) | (1,005 | ) | ||||||
| $ | 191,435 | $ | 259,769 | $ | 243,837 | |||||||
| Weighted average interest rate at end of year |
1.96 | % | 3.25 | % | 4.36 | % | ||||||
| Weighted daily average interest rate during the year |
2.56 | % | 3.87 | % | 4.26 | % | ||||||
26
Table of Contents
NOTES TO CONSOLIDATED FINANCIAL STATEMENTS (CONTINUED)
| NOTE H |
FHLB ADVANCES |
Maturity dates of FHLB advances were as follows:
| September 30, | 2009 | 2008 | ||||
| (In thousands) | ||||||
| FHLB advances |
||||||
| Within 1 year |
$ | — | $ | — | ||
| 1 to 3 years |
428,930 | 448,308 | ||||
| 4 to 5 years |
100,000 | 100,000 | ||||
| More than 5 years |
1,550,000 | 1,450,000 | ||||
| $ | 2,078,930 | $ | 1,998,308 | |||
$1,750,000,000 of the 2009 advances and $1,650,000,000 of the 2008 advances included in the above table are callable by the FHLB. If these callable advances were to be called at the earliest call dates, the maturities of all FHLB advances would be as follows:
| September 30, | 2009 | 2008 | ||||
| (In thousands) | ||||||
| FHLB advances |
||||||
| Within 1 year |
$ | 400,000 | $ | 200,000 | ||
| 1 to 3 years |
1,028,930 | 848,308 | ||||
| 4 to 5 years |
650,000 | 875,000 | ||||
| More than 5 years |
— | 75,000 | ||||
| $ | 2,078,930 | $ | 1,998,308 | |||
Financial data pertaining to the weighted-average cost and the amount of FHLB advances were as follows:
| September 30, | 2009 | 2008 | 2007 | |||||||||
| (In thousands) | ||||||||||||
| Weighted average interest rate at end of year |
4.39 | % | 4.45 | % | 4.79 | % | ||||||
| Weighted daily average interest rate during the year |
4.23 | % | 4.65 | % | 4.81 | % | ||||||
| Daily average of FHLB advances |
$ | 2,243,242 | $ | 2,022,596 | $ | 1,623,864 | ||||||
| Maximum amount of FHLB advances at any month end |
2,743,026 | 2,205,801 | 1,800,000 | |||||||||
| Interest expense during the year |
94,804 | 94,048 | 78,033 | |||||||||
FHLB advances are collateralized as provided for in the Advances, Pledge and Security Agreement by all FHLB stock owned by the Company, deposits with the FHLB and certain mortgages or deeds of trust securing such properties as provided in the agreements with the FHLB. As a member of the FHLB of Seattle, the Company currently has a credit line of 50% of the total assets of the Company, subject to collateralization requirements.
| NOTE I |
OTHER BORROWINGS |
Maturity dates of securities sold under agreements to repurchase (reverse repurchase agreements) and other borrowings were as follows:
| September 30, | 2009 | 2008 | ||||
| (In thousands) | ||||||
| Reverse repurchase agreements and other borrowings: |
||||||
| Within 1 year |
$ | 600 | $ | 377,600 | ||
| 1 to 3 years |
— | 300,000 | ||||
| 4 to 5 years |
— | — | ||||
| More than 5 years |
800,000 | 500,000 | ||||
| $ | 800,600 | $ | 1,177,600 | |||
27
Table of Contents
$500,000,000 of the 2009 and 2008 reverse repurchase agreements and other borrowings included in the above table are callable by the counterparty. If these were to be called at the earliest call dates, the maturities of the reverse repurchase agreements and other borrowings would be as follows:
| September 30, | 2009 | 2008 | ||||
| (In thousands) | ||||||
| Reverse repurchase agreements and other borrowings: |
||||||
| Within 1 year |
$ | 600 | $ | 377,600 | ||
| 1 to 3 years |
300,000 | 600,000 | ||||
| 4 to 5 years |
200,000 | 200,000 | ||||
| More than 5 years |
300,000 | — | ||||
| $ | 800,600 | $ | 1,177,600 | |||
Other borrowings on the Consolidated Statements of Financial Condition at both September 30, 2009 and 2008 included the $800,000,000 of reverse repurchase agreements presented in the table above. In addition, 2008 had $377,000,000 of short-term Fed funds borrowings due October 1, 2008, bearing weighted average interest rates of 2.00% as of September 30, 2008.
The Company enters into sales of reverse repurchase agreements. Fixed-coupon reverse repurchase agreements are treated as financings, and the obligations to repurchase securities sold are reflected as a liability in the consolidated statements of financial condition. During the three years ended September 30, 2009, all of the Company’s transactions were fixed-coupon reverse repurchase agreements. The dollar amount of securities underlying the agreements remain in the asset accounts. The securities pledged are registered in the Company’s name, and principal and interest payments are received by the Company; however, the securities are held by the designated trustee of the broker. Upon maturity of the agreements, the identical securities pledged as collateral will be returned to the Company.
Financial data pertaining to the weighted-average cost and the amount of securities sold under agreements to repurchase and other borrows were as follows:
| September 30, | 2009 | 2008 | 2007 | |||||||||
| (In thousands) | ||||||||||||
| Reverse repurchase agreements |
||||||||||||
| Weighted average interest rate at end of year |
3.90 | % | 4.19 | % | 4.19 | % | ||||||
| Weighted daily average interest rate during the year |
3.90 | % | 4.26 | % | 4.07 | % | ||||||
| Daily average of securities sold under agreements to repurchase |
$ | 800,000 | $ | 803,825 | $ | 785,753 | ||||||
| Maximum securities sold under agreements to repurchase at any month end |
800,000 | 800,000 | 900,000 | |||||||||
| Interest expense during the year |
31,061 | 34,260 | 31,962 | |||||||||
| Other borrowings |
||||||||||||
| Weighted average interest rate at end of year |
0.00 | % | 2.00 | % | 5.14 | % | ||||||
| Weighted daily average interest rate during the year |
0.69 | % | 3.23 | % | 5.31 | % | ||||||
| Daily average of securities sold under agreements to repurchase |
$ | 191,989 | $ | 296,529 | $ | 87,939 | ||||||
| Maximum other borrowings at any month end |
240,600 | 475,000 | 275,000 | |||||||||
| Interest expense during the year |
1,327 | 9,564 | 4,669 | |||||||||
28
Table of Contents
NOTES TO CONSOLIDATED FINANCIAL STATEMENTS (CONTINUED)
| NOTE J |
INCOME TAXES |
The Consolidated Statements of Financial Condition at September 30, 2009 and 2008 include net deferred tax liabilities and assets of $449,000 and $1,236,000, respectively, that have been provided for the temporary differences between the tax basis and the financial statement carrying amounts of liabilities and assets. The major sources of these temporary differences and their deferred tax effects were as follows:
| September 30, | 2009 | 2008 | |||||
| (In thousands) | |||||||
| Deferred tax assets |
|||||||
| Loan loss reserves |
$ | 89,020 | $ | 34,856 | |||
| Investment security deferred loss |
— | 32,247 | |||||
| Delinquent accrued interest |
5,320 | 1,834 | |||||
| Other, net |
— | 475 | |||||
| Total deferred tax assets |
94,340 | 69,412 | |||||
| Deferred tax liabilities |
|||||||
| Federal Home Loan Bank stock dividends |
33,492 | 33,545 | |||||
| Valuation adjustment on available-for-sale securities |
31,626 | 1,436 | |||||
| Loan origination costs |
14,223 | 16,037 | |||||
| Depreciation |
12,544 | 13,258 | |||||
| Deferred gain on forward commitments |
1,546 | 2,091 | |||||
| Core deposit intangible |
983 | 1,809 | |||||
| Other, net |
375 | — | |||||
| Total deferred tax liabilities |
94,789 | 68,176 | |||||
| Net deferred tax liability (asset) |
$ | 449 | $ | (1,236 | ) | ||
A reconciliation of the statutory federal income tax rate to the effective income tax rate follows:
| Year ended September 30, | 2009 | 2008 | 2007 | ||||||
| Statutory income tax rate |
35 | % | 35 | % | 35 | % | |||
| Dividend received deduction |
0 | -1 | -1 | ||||||
| Other differences |
-1 | -1 | 0 | ||||||
| State income tax |
2 | 2 | 2 | ||||||
| Effective income tax rate |
36 | % | 35 | % | 36 | % |
On October 1, 2007, the Company adopted ASC 740-10, Income Taxes. A reconciliation of the beginning and ending amount of unrecognized tax benefits is as follows:
| 2009 | 2008 | |||||||
| (In thousands) | ||||||||
| Balance at beginning of year |
$ | 43,108 | $ | 3,485 | ||||
| Tax positions related to current year: |
||||||||
| Additions |
— | 39,654 | ||||||
| Reductions |
— | — | ||||||
| Tax positions related to prior years: |
||||||||
| Additions |
1,706 | 1,344 | ||||||
| Reductions |
— | — | ||||||
| Settlements with taxing authorities |
— | (1,322 | ) | |||||
| Lapses in statutes of limitations |
(33 | ) | (53 | ) | ||||
| Balance at end of year |
$ | 44,781 | $ | 43,108 | ||||
As of September 30, 2009 and 2008, the Company’s liability for uncertain tax positions was $42.8 million and $41.7 million, respectively. Included in the balance of unrecognized tax benefits at September 30, 2009, are $1.5 million of tax benefits that, if recognized, would affect the effective tax rate. The Company records interest and penalties related to uncertain tax positions in income tax
29
Table of Contents
expense. As of September 30, 2009 and 2008, there was approximately $3.3 million and $1.6 million, respectively, of accrued interest and $0.3 million and $0.3 million, respectively, of accrued penalties.
Based on current information the Company does not expect any changes in the amount of unrecognized tax benefits over the next twelve months to have a significant impact on the results of operations or the financial position of the Company.
The Company’s federal income tax returns for 2005 through 2008 are open tax years. State income tax returns are generally subject to examination for a period of three to five years after filing of the respective return. The state impact of any federal changes remains subject to examination by various states for a period of up to two years after formal notification to the states. The Company has various federal and state income tax returns in the process of examination, administrative appeals or litigation. The Company’s unrecognized tax benefits are related to state returns open from 1999 through 2008 and a federal audit of an acquisition’s 2008 tax return.
The Company has been examined by the Internal Revenue Service through the year ended September 30, 1990. There were no material changes made to the Company’s originally reported taxable income as a result of this examination.
| NOTE K |
PROFIT SHARING RETIREMENT PLAN AND EMPLOYEE STOCK OWNERSHIP PLAN |
The Company maintains a Profit Sharing Retirement Plan and Employee Stock Ownership Plan (Plan) for the benefit of its employees. Company contributions are made semi-annually as approved by the Board of Directors. Such amounts are not in excess of amounts permitted by the Employee Retirement Income Security Act of 1974.
Plan participants may make voluntary after-tax contributions of their considered earnings as defined by the Plan. In addition, participants may make pre-tax contributions up to the statutory limits through the 401(k) provisions of the Plan. The annual addition from contributions to an individual participant’s account in this Plan cannot exceed the lesser of 100% of base salary or $46,000. Under provisions of the Plan, employees are eligible to participate on the date of hire and become fully vested in the Company’s contributions following six years of service. In August 1995 the Company received a favorable determination from the Internal Revenue Service to include an Employee Stock Ownership feature as part of the Plan. This feature allows employees to direct a portion of their vested account balance toward the purchase of Company stock. Company contributions to the Plan amounted to $4,200,000, $3,595,000 and $2,631,000 for the years ended September 30, 2009, 2008 and 2007, respectively.
| NOTE L |
STOCK OPTION PLANS |
The Company has two equity-based compensation plans (Plans) which provide for a combination of stock options and stock grants. Option awards are granted with an exercise price equal to the market price of the Company’s stock at the date of grant; those option awards generally vest based on 7 years of continuous service and have 10-year contractual terms. Beginning with options awarded in 2008, the vesting period was reduced to 5 years of continuous service. The Company’s policy is to issue new shares upon option exercises. Stockholders authorized 4,480,101 shares and 4,099,480 shares of common stock, as adjusted for stock splits and stock dividends, to be reserved pursuant to the 1994 Stock Option and Stock Appreciation Rights Plan (the 1994 Plan) and the 2001 Long-Term Incentive Plan (the 2001 Plan), respectively. The two Plans are substantially similar. Of the 8,579,581 total shares authorized by stockholders under the two Plans, 2,383,910 shares remain available for issuance. Each of the Plans has been approved by the Company’s stockholders.
The fair value of options granted is estimated on the date of grant using the Black-Scholes option-pricing model. This model requires input of highly subjective assumptions, changes to which can materially affect the fair value estimate. Additionally, there may be other factors that would otherwise have a significant effect on the value of employee stock options granted but are not considered by the model. Expected volatility is based on the historical volatility of the Company’s stock. The risk-free
30
Table of Contents
NOTES TO CONSOLIDATED FINANCIAL STATEMENTS (CONTINUED)
| interest rate is based on the U.S. Treasury yield curve that is in effect at the time of grant with a remaining term equal to the options’ expected life. The expected term represents the period of time that options granted are expected to be outstanding. The following weighted-average assumptions were used to estimate the fair value of options granted during the periods indicated: |
| Year ended September 30, | 2009 | 2008 | 2007 | ||||||
| Annual dividend yield |
3.83 | % | 3.66 | % | 3.62 | % | |||
| Expected volatility |
24 | % | 17 | % | 12 | % | |||
| Risk-free interest rate |
1.73 | % | 2.48 | % | 4.45 | % | |||
| Expected life |
4.5 years | 4.5 years | 4.5 years |
During 2009, 2008 and 2007, the Company recognized $1,327,000, $1,286,000 and 1,095,000 of compensation cost for stock options, net of forfeitures.
A summary of option activity under the Plans as of September 30, 2009, and changes during the year then ended is as follows:
| Options | Shares | Weighted Average Exercise Price |
Weighted Average Remaining Contractual Term |
Aggregate Intrinsic Value (In thousands) | ||||||
| Outstanding at September 30, 2008 |
2,669,413 | $ | 20.90 | |||||||
| Granted |
389,380 | 11.52 | ||||||||
| Exercised |
-20,619 | 10.50 | ||||||||
| Forfeited |
-152,499 | 19.86 | ||||||||
| Outstanding at September 30, 2009 |
2,885,675 | $ | 19.75 | 6.0 years | $ | 3,229 | ||||
| Exercisable at September 30, 2009 |
1,178,360 | $ | 18.52 | 3.0 years | $ | 1,258 | ||||
The weighted average grant date fair value of options granted during the years 2009, 2008 and 2007 was $1.60, $2.54 and $2.38, respectively. The total intrinsic value of options exercised during the years ended September 30, 2009, 2008 and 2007 was $65,000, $1,234,000 and $3,928,000, respectively. Likewise, the total grant date fair value of options exercised during the years ended September 30, 2009, 2008 and 2007 was $57,000, $441,000 and $1,040,000, respectively.
A summary of the status of the Company’s nonvested options as of September 30, 2009, and changes during the year then ended is as follows:
| Nonvested Options | Shares | Weighted Average Grant Date Fair Value | |||
| Outstanding at September 30, 2008 |
1,869,183 | $ | 3.14 | ||
| Granted |
389,380 | 1.60 | |||
| Vested |
-443,471 | 3.34 | |||
| Forfeited |
-107,777 | 2.73 | |||
| Outstanding at September 30, 2009 |
1,707,315 | $ | 2.76 | ||
As of September 30, 2009, unrecognized compensation cost for stock options, net of forfeitures, totaled $3,363,000, which is expected to be recognized over a weighted average remaining period of 1.8 years.
Cash received from option exercises for the years ended September 30, 2009, 2008 and 2007 was $158,000, $2,198,000 and $5,563,000, respectively. The actual tax benefit realized for the tax deductions from option exercises totaled $21,000, $337,000 and $1,132,000, respectively, for the years ended September 30, 2009, 2008 and 2007.
The Company also grants shares of restricted stock pursuant to its plans. These shares of restricted stock vest over a period of one to seven years. The Company has issued a total of 263,235 shares of restricted stock, with a fair market value at the date of grant of $5.2 million. As of September 30, 2009, 124,686 shares remained restricted. The Company accounts for restricted stock grants by
31
Table of Contents
| recording the fair value of the grant to compensation expense over the vesting period. Compensation expense related to restricted stock was $864,000, $795,000 and $298,000 for the years ended September 30, 2009, 2008 and 2007, respectively. |
| NOTE M |
STOCKHOLDERS’ EQUITY |
On November 14, 2008, the Company entered into a Letter Agreement with the United States Department of the Treasury (“Treasury”) to participate in the Troubled Asset Relief Program Capital Purchase Program (“CPP”). Pursuant to the Agreement, the Company issued and sold to the Treasury (i) 200,000 shares of the Company’s Fixed Rate Cumulative Perpetual Preferred Stock, and (ii) a warrant to purchase 1,707,456 shares of the Company’s common stock, par value $1.00 per share, for an aggregate purchase price for both the preferred stock and warrants of $200 million in cash. The Preferred Stock qualified as Tier 1 capital and paid cumulative dividends at a rate of 5% per annum for the first five years, and 9% per annum thereafter. On May 27, 2009, the Company repurchased the $200 million of preferred stock. The Company has decided not to repurchase the 1.7 million warrants issued in conjunction with the preferred stock at this time due to the contractual restrictions on negotiating the value of such warrants.
On September 15, 2009, the Company issued additional common stock in a follow on offering for the first time since going public in 1982. Net proceeds received totaled $333,176,688 upon the issuance of 24,150,000 additional common shares. The use of the proceeds from this offering will be used for general corporate purposes, which may include capital to support growth and acquisition opportunities.
Washington Federal Savings is subject to various regulatory capital requirements administered by the Office of Thrift Supervision (OTS). Failure to meet minimum capital requirements can initiate certain mandatory and possibly additional discretionary action by regulators that, if undertaken, could have a direct material effect on the Company’s financial statements. Under capital adequacy guidelines and the regulatory framework for prompt corrective action, Washington Federal Savings must meet specific capital guidelines that involve quantitative measures of Washington Federal Savings’ assets, liabilities and certain off-balance sheet items as calculated under regulatory accounting practices. Washington Federal Savings’ capital amounts and classification are also subject to qualitative judgments by the regulators about capital components, risk-weightings and other factors.
As of September 30, 2009 and 2008, the OTS categorized Washington Federal Savings as well capitalized under the regulatory framework for prompt corrective action. To be categorized as well capitalized, Washington Federal Savings must maintain minimum total risk-based, Tier 1 risk-based and Tier 1 leverage ratios as set forth in the following table. There are no conditions or events since that notification that Management believes have changed Washington Federal Savings’ categorization.
| Actual | Capital Adequacy Guidelines |
Well Capitalized Under Prompt Corrective Action Provisions |
||||||||||||||||
| Capital | Ratio | Capital | Ratio | Capital | Ratio | |||||||||||||
| September 30, 2009 | (In thousands) | |||||||||||||||||
| Total capital to risk-weighted assets |
1,469,857 | 21.57 | % | 545,034 | 8.00 | % | 681,293 | 10.00 | % | |||||||||
| Tier I capital to risk-weighted assets |
1,414,885 | 20.77 | % | N/A | N/A | 408,776 | 6.00 | % | ||||||||||
| Core capital to adjusted tangible assets |
1,414,885 | 11.56 | % | N/A | N/A | 612,094 | 5.00 | % | ||||||||||
| Core capital to total assets |
1,414,885 | 11.56 | % | 367,257 | 3.00 | % | N/A | N/A | ||||||||||
| Tangible capital to tangible assets |
1,414,885 | 11.56 | % | 183,628 | 1.50 | % | N/A | N/A | ||||||||||
| September 30, 2008 |
(In thousands) | |||||||||||||||||
| Total capital to risk-weighted assets |
$ | 1,128,345 | 16.59 | % | $ | 544,064 | 8.00 | % | $ | 680,080 | 10.00 | % | ||||||
| Tier I capital to risk-weighted assets |
1,077,788 | 15.85 | % | N/A | N/A | 408,048 | 6.00 | % | ||||||||||
| Core capital to adjusted tangible assets |
1,077,788 | 9.32 | % | N/A | N/A | 578,322 | 5.00 | % | ||||||||||
| Core capital to total assets |
1,077,788 | 9.32 | % | 346,993 | 3.00 | % | N/A | N/A | ||||||||||
| Tangible capital to tangible assets |
1,077,788 | 9.32 | % | 173,496 | 1.50 | % | N/A | N/A | ||||||||||
32
Table of Contents
NOTES TO CONSOLIDATED FINANCIAL STATEMENTS (CONTINUED)
At periodic intervals, the OTS and the Federal Deposit Insurance Corporation (FDIC) routinely examine the Company’s financial statements as part of their oversight of the savings and loan industry. Based on their examinations, these regulators can direct that the Company’s financial statements be adjusted in accordance with their findings. The extent to which forthcoming regulatory examinations may result in adjustments to the financial statements cannot be determined; however, no adjustments were proposed as a result of the most recent OTS examination which concluded in November 2008.
The Company has an ongoing stock repurchase program. No shares were repurchased during 2009 or 2008. As of September 30, 2009, Management had authorization from the Board of Directors to repurchase up to 2.9 million additional shares.
| NOTE N |
FAIR VALUES OF FINANCIAL INSTRUMENTS |
U.S. GAAP, requires disclosure of fair value information about financial instruments, whether or not recognized on the statement of financial condition, for which it is practicable to estimate those values. Certain financial instruments and all non-financial instruments are excluded from the disclosure requirements. Accordingly, the aggregate fair value estimates presented do not reflect the underlying fair value of the Company. Although Management is not aware of any factors that would materially affect the estimated fair value amounts presented, such amounts have not been comprehensively revalued for purposes of these financial statements since that date, and therefore, estimates of fair value subsequent to that date may differ significantly from the amounts presented below.
| 2009 | 2008 | |||||||||||
| Carrying Amount |
Estimated Fair Value |
Carrying Amount |
Estimated Fair Value | |||||||||
| (In thousands) | ||||||||||||
| Financial assets |
||||||||||||
| Cash and cash equivalents |
$ | 498,388 | $ | 498,388 | $ | 82,600 | $ | 82,600 | ||||
| Available-for-sale securities: |
||||||||||||
| Equity securities |
— | — | 3,456 | 3,456 | ||||||||
| Obligations of U.S. government |
13,824 | 13,824 | 37,775 | 37,775 | ||||||||
| Obligations of states and political subdivisions |
— | — | — | — | ||||||||
| Obligations of foreign governments |
— | — | — | — | ||||||||
| Corporate debt securities |
— | — | — | — | ||||||||
| Mortgage-backed securities |
||||||||||||
| Agency pass-through certificates |
2,187,259 | 2,187,259 | 1,434,836 | 1,434,836 | ||||||||
| Other debt securities |
— | — | — | — | ||||||||
| Total available-for-sale securities |
2,201,083 | 2,201,083 | 1,476,067 | 1,476,067 | ||||||||
| Held-to-maturity securities: |
||||||||||||
| Equity securities |
— | — | — | — | ||||||||
| Obligations of U.S. government |
— | — | — | — | ||||||||
| Obligations of states and political subdivisions |
7,435 | 7,980 | 7,770 | 8,306 | ||||||||
| Obligations of foreign governments |
— | — | — | — | ||||||||
| Corporate debt securities |
— | — | — | — | ||||||||
| Mortgage-backed securities |
95,607 | 99,283 | 116,767 | 115,042 | ||||||||
| Other debt securities |
— | — | — | — | ||||||||
| Total held-to-maturity securities |
103,042 | 107,263 | 124,537 | 123,348 | ||||||||
| Loans receivable |
8,983,430 | 9,223,038 | 9,501,620 | 9,564,456 | ||||||||
| FHLB stock |
144,495 | 144,495 | 144,874 | 144,874 | ||||||||
| Financial liabilities |
||||||||||||
| Customer accounts |
7,842,310 | 7,861,129 | 7,169,539 | 7,173,684 | ||||||||
| FHLB advances and other borrowings |
2,879,530 | 2,968,519 | 3,175,908 | 3,153,797 | ||||||||
The following methods and assumptions were used to estimate the fair value of financial instruments:
Cash and cash equivalents – The carrying amount of these items is a reasonable estimate of their fair value.
33
Table of Contents
Available-for-sale securities and held-to-maturity securities – Estimated fair value for investment securities is based on quoted market prices.
Loans receivable – For certain homogeneous categories of loans, such as fixed- and variable-rate residential mortgages, fair value is estimated using quoted market prices for securities backed by similar loans, adjusted for differences in loan characteristics. The fair value of other loan types is estimated by discounting the future cash flows and estimated prepayments using the current rates at which similar loans would be made to borrowers with similar credit ratings and for the same remaining term. Some loan types were valued at carrying value because of their floating rate or expected maturity characteristics. Net deferred loan fees is not included in the fair value calculation but is included in the carrying amount.
FHLB stock – The fair value is based upon the redemption value of the stock which equates to its carrying value.
Customer accounts – The fair value of demand deposits, savings accounts, and money market accounts is the amount payable on demand at the reporting date. The fair value of fixed-maturity certificates of deposit is estimated by discounting the estimated future cash flows using the rates currently offered for deposits with similar remaining maturities.
FHLB advances and other borrowings – The fair value of FHLB advances and other borrowings is estimated by discounting the estimated future cash flows using rates currently available to the Company for debt with similar remaining maturities.
| NOTE O |
FINANCIAL INFORMATION – WASHINGTON FEDERAL, INC. |
The following Washington Federal, Inc. (parent company only) financial information should be read in conjunction with the other notes to the Consolidated Financial Statements.
| Statements of Financial Condition |
||||||||
| September 30, | 2009 | 2008 | ||||||
| (In thousands) | ||||||||
| Assets |
||||||||
| Cash |
$ | 39,249 | $ | 4,787 | ||||
| Investment in subsidiary |
1,726,113 | 1,342,195 | ||||||
| Dividend receivable and other assets |
434 | 18,434 | ||||||
| Total assets |
$ | 1,765,796 | $ | 1,365,416 | ||||
| Liabilities |
||||||||
| Borrowed money |
$ | 14,310 | $ | 14,310 | ||||
| Dividend payable and other liabilities |
6,001 | 18,432 | ||||||
| Total liabilities |
20,311 | 32,742 | ||||||
| Stockholders’ equity |
||||||||
| Common stock, $1.00 par value, 300,000,000 shares authorized, 129,320,072 and 105,092,724 shares issued; 112,247,748 and 87,916,286 shares outstanding |
129,320 | 105,093 | ||||||
| Paid-in capital |
1,574,555 | 1,261,032 | ||||||
| Accumulated other comprehensive income, net of tax |
54,431 | 2,472 | ||||||
| Treasury stock, at cost; 17,072,324 and 17,176,438 shares |
(208,985 | ) | (210,250 | ) | ||||
| Retained earnings |
196,164 | 174,327 | ||||||
| Total stockholders’ equity |
1,745,485 | 1,332,674 | ||||||
| Total liabilities and stockholders’ equity |
$ | 1,765,796 | $ | 1,365,416 | ||||
34
Table of Contents
NOTES TO CONSOLIDATED FINANCIAL STATEMENTS (CONTINUED)
| Statements of Operations |
||||||||||
| Year ended September 30, | 2009 | 2008 | 2007 | |||||||
| (In thousands) | ||||||||||
| Income |
||||||||||
| Dividends from subsidiary |
$ | 18,833 | $ | 65,000 | $ | 66,000 | ||||
| Other |
24 | 24 | 14 | |||||||
| Total Income |
18,857 | 65,024 | 66,014 | |||||||
| Expense |
||||||||||
| Miscellaneous |
1,996 | 1,245 | 765 | |||||||
| Total Expense |
1,996 | 1,245 | 765 | |||||||
| Net income before equity in undistributed net income of subsidiary |
16,861 | 63,779 | 65,249 | |||||||
| Equity to undistributed net income of subsidiary |
30,611 | (1,881 | ) | 69,500 | ||||||
| Income before income taxes |
47,472 | 61,898 | 134,749 | |||||||
| Income tax benefit |
700 | 434 | 268 | |||||||
| Net income |
$ | 48,172 | $ | 62,332 | $ | 135,017 | ||||
| Preferred dividends accrued |
7,488 | — | — | |||||||
| Net income available to common shareholders |
$ | 40,684 | $ | 62,332 | $ | 135,017 | ||||
| Statements of Cash Flows |
||||||||||||
| Year ended September 30, | 2009 | 2008 | 2007 | |||||||||
| (In thousands) | ||||||||||||
| Cash Flows From Operating Activities |
||||||||||||
| Net income |
$ | 48,172 | $ | 62,332 | $ | 135,017 | ||||||
| Adjustments to reconcile net income to net cash provided (used) by operating activities |
||||||||||||
| Equity in undistributed net income of subsidiaries |
(30,611 | ) | 1,881 | (69,500 | ) | |||||||
| Decrease (increase) in other assets |
18,000 | (5,124 | ) | 2,690 | ||||||||
| Increase (decrease) in other liabilities |
(11,589 | ) | 551 | (463 | ) | |||||||
| Net cash provided by operating activities |
23,972 | 59,640 | 67,744 | |||||||||
| Cash Flows From Financing Activities |
||||||||||||
| Proceeds from exercise of common stock options and related tax benefit |
180 | 2,546 | 6,752 | |||||||||
| Proceeds from Employee Stock Ownership Plan |
1,341 | 5,771 | 1,617 | |||||||||
| Net proceeds from follow on stock offering |
333,177 | — | — | |||||||||
| Downstream stock offering proceeds to the Bank |
(300,000 | ) | — | — | ||||||||
| Proceeds from issuance of preferred stock and warrants |
200,000 | — | — | |||||||||
| Preferred stock redeemed |
(200,000 | ) | — | — | ||||||||
| Increase in borrowings |
— | 4,000 | 10,310 | |||||||||
| Treasury stock purchased |
— | — | (9,848 | ) | ||||||||
| Dividends paid on preferred stock |
(5,361 | ) | ||||||||||
| Dividends paid on common stock |
(18,847 | ) | (73,688 | ) | (72,467 | ) | ||||||
| Net cash provided (used) by financing activities |
10,490 | (61,371 | ) | (63,636 | ) | |||||||
| Increase (decrease) in cash |
34,462 | (1,731 | ) | 4,108 | ||||||||
| Cash at beginning of year |
4,787 | 6,518 | 2,410 | |||||||||
| Cash at end of year |
$ | 39,249 | $ | 4,787 | $ | 6,518 | ||||||
35
Table of Contents
| NOTE P |
SELECTED QUARTERLY FINANCIAL DATA (UNAUDITED) |
The following is a summary of the unaudited interim results of operations by quarter:
| Year ended September 30, 2009 | First Quarter |
Second Quarter |
Third Quarter |
Fourth Quarter |
||||||||||||
| (In thousands, except per share data) | ||||||||||||||||
| Interest income |
$ | 178,539 | $ | 176,168 | $ | 169,801 | $ | 167,266 | ||||||||
| Interest expense |
88,526 | 82,686 | 75,548 | 71,867 | ||||||||||||
| Net interest income |
90,013 | 93,482 | 94,253 | 95,399 | ||||||||||||
| Provision for loan losses |
35,000 | 54,000 | 52,200 | 51,800 | ||||||||||||
| Other operating income |
4,175 | 4,388 | 5,345 | 5,101 | ||||||||||||
| Other operating expense |
25,826 | 26,780 | 35,719 | 35,089 | ||||||||||||
| Income before income taxes |
33,362 | 17,090 | 11,679 | 13,611 | ||||||||||||
| Income taxes |
11,844 | 6,074 | 5,646 | 4,006 | ||||||||||||
| Net income |
21,518 | 11,016 | 6,033 | 9,605 | ||||||||||||
| Preferred dividends accrued |
1,349 | 2,606 | 3,533 | — | ||||||||||||
| Net income available to common shareholders |
$ | 20,169 | $ | 8,410 | $ | 2,500 | $ | 9,605 | ||||||||
| Basic earnings per share |
$ | 0.23 | $ | 0.10 | $ | 0.03 | $ | 0.11 | ||||||||
| Diluted earnings per share |
0.23 | 0.10 | 0.03 | 0.11 | ||||||||||||
| Cash dividends per share |
0.05 | 0.05 | 0.05 | 0.05 | ||||||||||||
| Return on average assets |
0.66 | % | 0.27 | % | 0.08 | % | 0.31 | % | ||||||||
| Year ended September 30, 2008 | First Quarter |
Second Quarter |
Third Quarter |
Fourth Quarter |
||||||||||||
| (In thousands, except per share data) | ||||||||||||||||
| Interest income |
$ | 166,592 | $ | 176,852 | $ | 180,481 | $ | 177,503 | ||||||||
| Interest expense |
101,299 | 103,279 | 99,817 | 93,246 | ||||||||||||
| Net interest income |
65,293 | 73,573 | 80,664 | 84,257 | ||||||||||||
| Provision for loan losses |
1,000 | 9,500 | 13,216 | 36,800 | ||||||||||||
| Other operating income (loss) |
4,387 | 12,940 | 7,560 | (84,078 | ) | |||||||||||
| Other operating expense |
17,243 | 22,078 | 23,581 | 25,339 | ||||||||||||
| Income (loss) before income taxes |
51,437 | 54,935 | 51,427 | (61,960 | ) | |||||||||||
| Income taxes |
18,389 | 19,483 | 18,258 | (22,623 | ) | |||||||||||
| Net income (loss) |
$ | 33,048 | $ | 35,452 | $ | 33,169 | $ | (39,337 | ) | |||||||
| Basic earnings (loss) per share |
$ | 0.38 | $ | 0.40 | $ | 0.38 | $ | (0.45 | ) | |||||||
| Diluted earnings (loss) per share |
0.38 | 0.40 | 0.38 | (0.45 | ) | |||||||||||
| Cash dividends per share |
0.21 | 0.21 | 0.21 | 0.21 | ||||||||||||
| Return on average assets |
1.26 | % | 1.27 | % | 1.12 | % | -1.33 | % | ||||||||
| NOTE Q |
FAIR VALUE MEASUREMENTS |
U.S. GAAP defines fair value as the exchange price that would be received for an asset or paid to transfer a liability (an exit price) in the principal or most advantageous market for the asset or liability in an orderly transaction between market participants on the measurement date. U.S. GAAP also establishes a fair value hierarchy which requires an entity to maximize the use of observable inputs and minimize the use of unobservable inputs when measuring fair value. The standard describes three levels of inputs that may be used to measure fair value:
Level 1: Quoted prices (unadjusted) for identical assets or liabilities in active exchange markets that the entity has the ability to access as of the measurement date.
Level 2: Significant other observable inputs other than Level 1 prices, such as quoted prices for similar assets or liabilities, quoted prices in markets that are not active and other inputs that are observable or can be corroborated by observable market data.
Level 3: Significant unobservable inputs that reflect a company’s own assumptions about the assumptions that market participants would use in pricing an asset or liability.
36
Table of Contents
NOTES TO CONSOLIDATED FINANCIAL STATEMENTS (CONTINUED)
The following is a description of the valuation methodologies used to measure and report fair value of financial assets and liabilities on a recurring or nonrecurring basis:
Measured on a Recurring Basis
Securities
Securities available for sale are recorded at fair value on a recurring basis. Fair value is determined with quoted prices for similar assets or liabilities, quoted prices in markets that are not active and other inputs that are observable or can be corroborated by observable market data (Level 2).
The following table presents the balance of assets measured at fair value on a recurring basis at September 30, 2009:
| Fair Value at September 30, 2009 | ||||||||||||
| Level 1 | Level 2 | Level 3 | Total | |||||||||
| (In thousands) | ||||||||||||
| Available-for-sale securities |
||||||||||||
| Equity securities |
$ | — | $ | 515 | $ | — | $ | 515 | ||||
| Obligations of U.S. government |
— | 13,309 | — | 13,309 | ||||||||
| Obligations of states and political subdivisions |
— | — | — | — | ||||||||
| Obligations of foreign governments |
— | — | — | — | ||||||||
| Corporate debt securities |
— | — | — | — | ||||||||
| Mortgage-backed securities |
||||||||||||
| Agency pass-through certificates |
— | 2,187,259 | — | 2,187,259 | ||||||||
| Other debt securities |
— | — | — | — | ||||||||
| Balance at end of period |
$ | — | $ | 2,201,083 | $ | — | $ | 2,201,083 | ||||
Measured on a Nonrecurring Basis
Impaired Loans
From time to time, and on a nonrecurring basis, fair value adjustments to collateral dependent loans are recorded to reflect write-downs of principal balances based on the current appraised or estimated value of the collateral. This new estimated fair value is net of anticipated selling costs.
REO/REHI
Real estate owned/held for investment consists principally of properties acquired through foreclosure and are carried at the lower of cost or estimated fair value less anticipated selling costs.
The following table presents the aggregated balance of assets measured at estimated fair value on a nonrecurring basis for the year ended September 30, 2009, and the total losses resulting from these fair value adjustments for the quarter and year ended September 30, 2009:
| Through September 30, 2009 | Quarter Ended September 30, 2009 |
Year Ended September 30, 2009 | ||||||||||||||||
| Level 1 | Level 2 | Level 3 | Total | Total Losses | Total Losses | |||||||||||||
| (In thousands) | ||||||||||||||||||
| Impaired loans (1) |
$ | — | $ | — | $ | 506,339 | $ | 506,339 | $ | 25,578 | $ | 141,209 | ||||||
| REO/REHI (2) |
— | — | 206,563 | 206,563 | 12,449 | 29,256 | ||||||||||||
| Balance at end of period |
$ | — | $ | — | $ | 712,902 | $ | 712,902 | $ | 38,027 | $ | 170,465 | ||||||
| (1) | The loss represents remeasurements of collateral dependent loans. |
| (2) | The loss represents charge-offs on REO/REHI. |
There were no liabilities carried at fair value, measured on a recurring or nonrecurring basis, at September 30, 2009.
37
Table of Contents

MANAGEMENT’S REPORT ON INTERNAL
CONTROL OVER FINANCIAL REPORTING
The management of Washington Federal, Inc. (the “Company”) is responsible for establishing and maintaining adequate internal control over financial reporting. The Company’s internal control system was designed to provide reasonable assurance to the Company’s management and Board of Directors regarding the preparation and fair presentation of published financial statements.
The Company’s management assessed the effectiveness of the Company’s internal control over financial reporting as of September 30, 2009. In making this assessment, the Company’s management used the criteria set forth by the Committee of Sponsoring Organizations of the Treadway Commission (COSO) in Internal Control-Integrated Framework. Based on its assessment, the Company’s management believes that as of September 30, 2009, the Company’s internal control over financial reporting was effective based on those criteria.
The Company’s independent auditors, Deloitte & Touche LLP, an independent registered public accounting firm, have issued an audit report on the Company’s internal control over financial reporting and their report follows.
October 30, 2009

Roy M. Whitehead
Chairman, President and
Chief Executive Officer

Brent J. Beardall
Executive Vice President and
Chief Financial Officer
REPORT OF INDEPENDENT REGISTERED
PUBLIC ACCOUNTING FIRM
To the Board of Directors and Stockholders of
Washington Federal, Inc.
Seattle, Washington
We have audited the accompanying consolidated statements of financial condition of Washington Federal, Inc. and subsidiaries (the “Company”) as of September 30, 2009 and 2008, and the related consolidated statements of operations, stockholders’ equity, and cash flows for each of the three years in the period ended September 30, 2009. These consolidated financial statements are the responsibility of the Company’s management. Our responsibility is to express an opinion on these consolidated financial statements based on our audits.
We conducted our audits in accordance with the standards of the Public Company Accounting Oversight Board (United States). Those standards require that we plan and perform the audit to obtain reasonable assurance about whether the financial statements are free of material misstatement. An audit includes examining, on a test basis, evidence supporting the amounts and disclosures in the financial statements. An audit also includes assessing the accounting principles used and significant estimates made by management, as well as evaluating the overall financial statement presentation. We believe that our audits provide a reasonable basis for our opinion.
In our opinion, such consolidated financial statements present fairly, in all material respects, the consolidated financial position of Washington Federal, Inc. and subsidiaries as of September 30, 2009 and 2008, and the results of their operations and their cash flows for each of the three years in the period ended September 30, 2009, in conformity with accounting principles generally accepted in the United States of America.
We have also audited, in accordance with the standards of the Public Company Accounting Oversight Board (United States), the Company’s internal control over financial reporting as of September 30, 2009, based on the criteria established in Internal Control—Integrated Framework issued by the Committee of Sponsoring Organizations of the Treadway Commission and our report dated October 30, 2009 expressed an unqualified opinion on the Company’s internal control over financial reporting.

DELOITTE & TOUCHE LLP
Seattle, Washington
October 30, 2009
38
Table of Contents
REPORT OF INDEPENDENT REGISTERED PUBLIC ACCOUNTING FIRM
To the Board of Directors and Stockholders of
Washington Federal, Inc.
Seattle, Washington
We have audited the internal control over financial reporting of Washington Federal, Inc. and subsidiaries (the “Company”) as of September 30, 2009, based on criteria established in Internal Control—Integrated Framework issued by the Committee of Sponsoring Organizations of the Treadway Commission. The Company’s management is responsible for maintaining effective internal control over financial reporting and for its assessment of the effectiveness of internal control over financial reporting, included in the accompanying Management’s Report on Internal Control over Financial Reporting. Our responsibility is to express an opinion on the Company’s internal control over financial reporting based on our audit.
We conducted our audit in accordance with the standards of the Public Company Accounting Oversight Board (United States). Those standards require that we plan and perform the audit to obtain reasonable assurance about whether effective internal control over financial reporting was maintained in all material respects. Our audit included obtaining an understanding of internal control over financial reporting, assessing the risk that a material weakness exists, testing and evaluating the design and operating effectiveness of internal control based on the assessed risk, and performing such other procedures as we considered necessary in the circumstances. We believe that our audit provides a reasonable basis for our opinion.
A company’s internal control over financial reporting is a process designed by, or under the supervision of, the company’s principal executive and principal financial officers, or persons performing similar functions, and effected by the company’s board of directors, management, and other personnel to provide reasonable assurance regarding the reliability of financial reporting and the preparation of financial statements for external purposes in accordance with generally accepted accounting principles. A company’s internal control over financial reporting includes those policies and procedures that (1) pertain to the maintenance of records that, in reasonable detail, accurately and fairly reflect the transactions and dispositions of the assets of the company; (2) provide reasonable assurance that transactions are recorded as necessary to permit preparation of financial statements in accordance with generally accepted accounting principles, and that receipts and expenditures of the company are being made only in accordance with authorizations of management and directors of the company; and (3) provide reasonable assurance regarding prevention or timely detection of unauthorized acquisition, use, or disposition of the company’s assets that could have a material effect on the financial statements.
Because of the inherent limitations of internal control over financial reporting, including the possibility of collusion or improper management override of controls, material misstatements due to error or fraud may not be prevented or detected on a timely basis. Also, projections of any evaluation of the effectiveness of the internal control over financial reporting to future periods are subject to the risk that the controls may become inadequate because of changes in conditions, or that the degree of compliance with the policies or procedures may deteriorate.
In our opinion, the Company maintained, in all material respects, effective internal control over financial reporting as of September 30, 2009, based on the criteria established in Internal Control—Integrated Framework issued by the Committee of Sponsoring Organizations of the Treadway Commission.
We have also audited, in accordance with the standards of the Public Company Accounting Oversight Board (United States), the consolidated financial statements as of and for the year ended September 30, 2009, of the Company and our report dated October 30, 2009, expressed an unqualified opinion on those consolidated financial statements.
DELOITTE & TOUCHE LLP
Seattle, Washington
October 30, 2009
39
Table of Contents
The following graphs compare the cumulative total return to Washington Federal stockholders (stock price appreciation plus reinvested dividends) to the cumulative total return of the Nasdaq Stock Market Index (U.S. Companies) and the Nasdaq Financial Stocks Index for the five year period ended September 30, 2009 and since Washington Federal first became a publicly traded company on November 9, 1982, respectively. The graphs assume that $100 was invested on September 30, 2004 and November 9, 1982, respectively, in Washington Federal Common Stock, the Nasdaq Stock Market Index and the Nasdaq Financial Stocks Index, and that all dividends were reinvested. Management of Washington Federal cautions that the stock price performance shown in the graphs below should not be considered indicative of potential future stock price performance.
PERFORMANCE GRAPHS OPEN
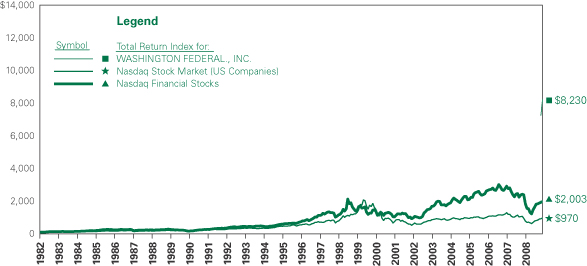
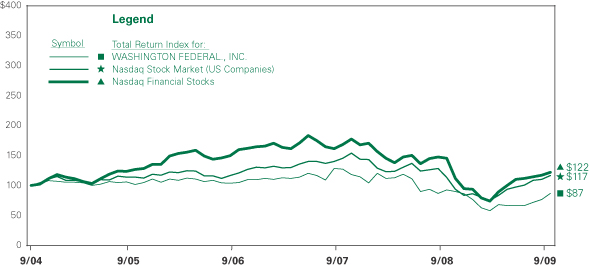
40
Table of Contents

GENERAL CORPORATE AND STOCKHOLDERS’ INFORMATION
| Corporate |
425 Pike Street |
| Headquarters |
Seattle, Washington 98101 |
| (206) 624-7930 |
| Independent |
Deloitte & Touche LLP |
| Auditors |
Seattle, Washington |
| Transfer Agent, Registrar and Dividend |
Stockholder inquiries regarding transfer requirements, cash or stock dividends, lost certificates, consolidating records, correcting a name or changing an address should be directed to the transfer agent: |
| Disbursing Agent |
American Stock Transfer & Trust Company |
| 59 Maiden Lane |
| Plaza Level |
| New York, NY 10038 |
Telephone: 1-888-888-0315
www.amstock.com
| Annual Meeting |
The annual meeting of stockholders will be held on January 20, 2010, at 2 p.m., Pacific Time at Sheraton Hotel, 1400 Sixth Avenue, Seattle, Washington |
| Form 10-K |
To find out more about the Company, please visit our website. The Company uses its website to distribute financial and other material information about the Company. This report and all SEC filings of the Company are available through the Company’s website: |
| www.washingtonfederal.com |
| Stock Information |
Washington Federal, Inc. is traded on the NASDAQ Global Select Market. The common stock symbol is WFSL. At September 30, 2009, there were approximately 1,994 stockholders of record. |
| Stock Prices | |||||||||
| Quarter Ended | High | Low | Dividends | ||||||
| December 31, 2007 |
$ | 27.09 | $ | 20.94 | $ | 0.210 | |||
| March 31, 2008 |
25.21 | 19.05 | 0.210 | ||||||
| June 30, 2008 |
24.63 | 18.10 | 0.210 | ||||||
| September 30, 2008 |
24.00 | 13.63 | 0.210 | ||||||
| December 31, 2008 |
19.80 | 11.97 | 0.050 | ||||||
| March 31, 2009 |
15.03 | 9.94 | 0.050 | ||||||
| June 30, 2009 |
14.78 | 11.33 | 0.050 | ||||||
| September 30, 2009 |
16.98 | 12.14 | 0.050 | ||||||
| Our Board of Directors’ dividend policy is to review our financial performance, capital adequacy, regulatory compliance and cash resources on a quarterly basis, and, if such review is favorable, to declare and pay a cash dividend to shareholders. |
41
Table of Contents

DIRECTORS, OFFICERS AND OFFICES
| CORPORATE HEADQUARTERS
425 Pike Street Seattle, WA 98101 (206) 624-7930
BOARD OF DIRECTORS
ROY M. WHITEHEAD Chairman, President and Chief Executive Officer
DEREK L. CHINN Former President and Chief Executive Officer, United Savings and Loan Bank
JOHN F. CLEARMAN Former Chief Financial Officer, Milliman USA, Inc.
JAMES J. DOUD, JR. Former Executive Vice President and Chief Operating Officer of Matthew G. Norton Co.
H. DENNIS HALVORSON Former Chief Executive Officer, United Bank
ANNA C. JOHNSON Senior Partner Scan East West Travel
THOMAS J. KELLEY Faculty member, Albers School of Business, Seattle University and retired partner, Arthur Andersen LLP
THOMAS F. KENNEY Vice President Finance Haggen, Inc.
CHARLES R. RICHMOND Former Executive Vice President, Washington Federal
BARBARA L. SMITH, Phd. Owner, B. Smith Consulting Group
DIRECTORS EMERITI
W. ALDEN HARRIS KERMIT O. HANSON |
EXECUTIVE MANAGEMENT COMMITTEE
ROY M. WHITEHEAD Chairman, President and Chief Executive Officer
BRENT J. BEARDALL Executive Vice President and Chief Financial Officer
LINDA S. BROWER Executive Vice President Human Resources & Deposit Operations
RICHARD J. COLLETTE Executive Vice President Business Banking
EDWIN C. HEDLUND Executive Vice President Mortgage & Consumer Lending and Corporate Secretary
JACK B. JACOBSON Executive Vice President Commercial Real Estate
MARK A. SCHOONOVER Executive Vice President |
DEPARTMENT MANAGERS
Accounting CHAD J. LEONARD Vice President and Controller
ROBERT C. ZIRK Vice President Internal Controls and Taxes
Business Banking-Bellevue THOMAS E. KASANDERS Senior Vice President
Commercial Real Estate THOMAS R. POZARYCKI Vice President
FRED H. REININGER Senior Vice President
Compliance PAUL I. TYLER Senior Vice President and General Counsel
Consumer Underwriting MICHAEL R. BUSH Senior Vice President
Credit Administration DAVID J. DANIEL Vice President
MARC A. RASMUSSEN Vice President
DALE R. SULLIVAN Senior Vice President
Special Assets RONALD MCKENZIE, Senior Vice President
Commercial Appraisal Review JAMES CORBIN, Vice President
Corporate Real Estate KEITH D. TAYLOR Senior Vice President and Treasurer
Data Processing TERRY O. PERMENTER Senior Vice President
Deposit Operations TERESA M. RODIN Vice President
Internal Audit BARBARA A. MURPHY Senior Vice President
Loan Servicing JUDY R. GRAMS Vice President
Marketing and Investor Relations CATHY E. COOPER Senior Vice President
Mortgage Loan Operations LEANN H. BURKE Vice President
Wholesale Loan Production PATRICK J. CARSON Vice President
Wholesale Underwriting COLLEEN E. WELLS Senior Vice President |
SUBSIDIARIES
First Insurance Agency, Inc. 1501 Riverside Drive Mount Vernon, WA 98273 1-800-562-2555 DUANE E. HENSON President |
SOUTH SOUND WASHINGTON
17 Office Locations Division Manager GREGORY J. TOSO Senior Vice President 9919 Bridgeport Way S.W. Lakewood, WA 98499
MIDSOUND WASHINGTON
14 Office Locations Division Manager LISA M. KING Senior Vice President 5809 196th S.W. Lynnwood, WA 98036
EASTSIDE WASHINGTON
14 Office Locations Division Manager VICTOR I. MIZUMORI Senior Vice President 400 108th Ave. NE Bellevue, WA 98004
NORTHERN WASHINGTON
9 Office Locations Division Manager GREGORY A. PECK Senior Vice President 1501 Riverside Drive Mount Vernon, WA 98273
WESTERN IDAHO
10 Office Locations Division Manager ROBERT P. LINK Senior Vice President 1001 W. Idaho St. Boise, ID 83701
EASTERN IDAHO
6 Office Locations Division Manager JEFFREY B. HARRIS Vice President 500 North Capital Idaho Falls, ID 83402 |
OREGON
28 Office Locations Division Manager PEGGY L. HOBIN Senior Vice President 14990 SW Bangy Rd. Lake Oswego, OR 97035
UTAH
10 Office Locations Division Manager MARLISE G. FISHER Senior Vice President 505 East 200 South Salt Lake City, UT 84102
NEW MEXICO
13 Office Locations Division Manager R. HAL BAILEY Senior Vice President 4301 The 25 Way NE Albuquerque, NM 87109
PHOENIX ARIZONA
13 Office Locations Division Manager JOHN J. PIRTLE Senior Vice President 2196 E. Camelback Road, Suite 100 Phoenix, AZ 85016
TUCSON ARIZONA
8 Office Locations Division Manager GEORGIA E. VELARDE Senior Vice President 5151 E. Broadway Blvd., Suite 105 Tucson, AZ 85711
NEVADA
4 Office Locations Division Manager PAMELA K. CALLAHAN Vice President 9340 Sun City Blvd. #103 Las Vegas, NV 89134
TEXAS
4 Office Locations Division Manager RONDA F. TOMLINSON Senior Vice President 5900 Chapel Hill Blvd. Plano, TX 75093 |
42
Table of Contents
![]()
Table of Contents