Attached files
| file | filename |
|---|---|
| 8-K - FORM 8-K - ENCORE CAPITAL GROUP INC | d8k.htm |
 Encore Capital Group Investor Presentation November 2009 Leveraging Intellectual Capital Leveraging Intellectual Capital Exhibit 99.1 |
| Encore
Capital Group 1 CAUTIONARY NOTE ABOUT FORWARD-LOOKING STATEMENTS This presentation contains forward-looking statements within the meaning of the
Private Securities Litigation Reform Act of 1995 (the “Reform
Act”). The words “believe,” “expect,” “anticipate,” “estimate,” “project,” or the negation thereof or similar expressions constitute forward-looking statements within the meaning of the Reform
Act. These statements may include, but are not limited to, projections
of revenues, income or loss, estimates of capital expenditures, plans for
future operations, products or services, and financing needs or plans, as
well as assumptions relating to these matters. Such statements involve risks, uncertainties and other factors that may cause actual results, performance or achievements of the Company and its subsidiaries to be materially different from any future results, performance or achievements expressed or implied by such forward-looking statements. For a
discussion of these factors, we refer you to the Company's reports filed
with the Securities and Exchange Commission, including its Annual Report on
Form 10-K for the year ended December 31, 2008 and its Quarterly Report
on Form 10-Q for the quarter ended September 30, 2009. In light of
the significant uncertainties inherent in the forward-looking statements
included herein, the inclusion of such information should not be regarded as
a representation by the Company or by any other person or entity that the
objectives and plans of the Company will be achieved. For all forward-looking statements, the Company claims the protection of the safe-harbor
for forward-looking statements contained in the Reform Act. FORWARD-LOOKING STATEMENTS |
 Encore Capital Group 2 INVESTMENT HIGHLIGHTS • Increasing supply combined with decreasing demand is creating an opportunity for well capitalized companies • Sophisticated analytics, differentiated servicing strategies and our high performing, low cost site in India enable us to generate superior returns in today’s challenging economic times • Disciplined purchasing strategy allowed us to succeed over the past few years without entering the then dramatically overpriced “fresh”
portfolio market • Demonstrated history of generating strong cash flows • Strategically positioned to take advantage of significant near-term growth prospects |
 Encore Capital Group 3 AGENDA • Company snapshot and industry overview • Current environment and key operating metrics • Operational competitive advantages • Additional financial information |
 Encore Capital Group 4 ENCORE IS A LEADING PLAYER IN THE DEBT RECOVERY INDUSTRY Distressed consumer debt purchasing (95% of revenue) •Purchase and collection of charged-off consumer receivables (primarily credit card) •Robust business model emphasizing consumer intelligence and operational specialization •Invested ~$1.4B to acquire receivables with a face value of ~$45B •Acquired >25MM consumer accounts since inception Bankruptcy servicing (5% of revenue) •Process secured consumer bankruptcy accounts for leading auto lenders and other financial institutions •Proprietary software dedicated to bankruptcy servicing •Operational platform that integrates lenders, trustees, and consumers |
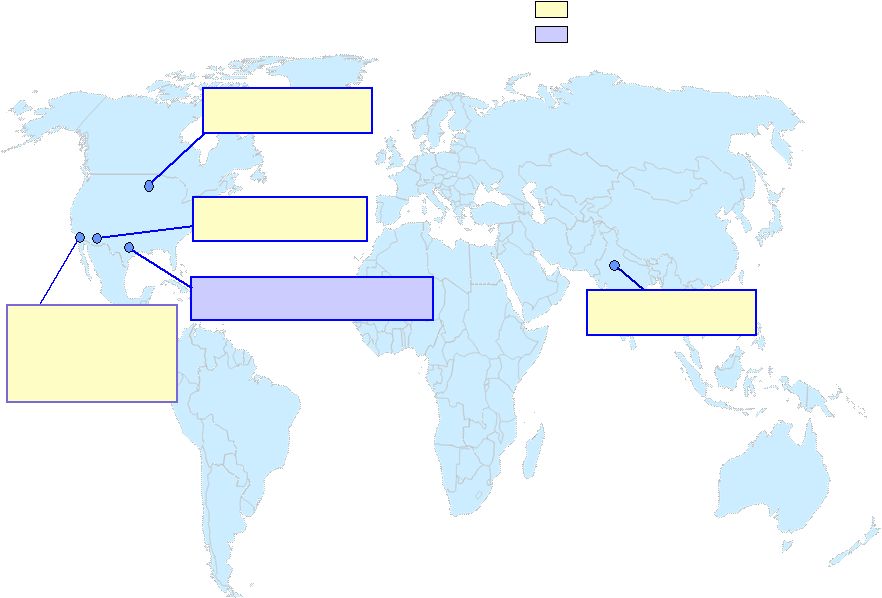 Encore Capital Group 5 WE OPERATE IN FIVE DIFFERENT SITES ACROSS THE U.S. AND INDIA San Diego, CA • Headquarters • Call center site St Cloud, MN • Call center site Arlington, TX • Bankruptcy servicing Phoenix, AZ Delhi, India Defaulted consumer debt purchasing Bankruptcy servicing business • Call center site • Call center site |
 Encore Capital Group OUR LONG-TERM FINANCIAL MODEL IS NOT BASED ON MONTHLY CASH PAYMENTS AND GIVES THE CONSUMER TIME TO RECOVER 6 CONSUMER Opens unsecured credit line, credit card or consumer loan Consumer either cannot or will not make payments ISSUER Delinquency cycle (days 30-180) Attempt rehabilitation and escalate consequences Consumer is “charged-off” by issuer on day 181 Issuer offers to sell unsecured, charged-off debt to Encore ENCORE Price portfolio using industry-leading models Based on consumer behavior at the account level Focused on willingness and ability-to-pay Create liquidation strategy and set goals Effort sloping through empirical and statistical modeling Collect debt through the application of unique collections platforms and unrivaled collection professionals (84 month window) Legal Outsourcing Call Centers Direct Mail Collection Agency Outsourcing Sales channel No/Low effort |
 Encore Capital Group 7 AT THE PEAK OF THE COLLECTION CYCLE, WE WILL GENERATE PAYMENTS FROM FEWER THAN 1% OF OUR ACCOUNTS PER MONTH Portfolio Face Amount $15,000,000 Average Balance $3,000 Number of Accounts 5,000 Purchase Factor $0.05 Purchase Price $750,000 Projected Return (2.7x) $2,025,000 Only requires 20% payers, at a 67.5% settlement rate, to achieve expected returns over a seven year period. This equates to: – Year 1: ~ 7.0% (350 consumers) – Year 2: ~ 5.5% (270 consumers) – Year 3: ~ 4.5% (220 consumers) – Year 4: ~ 2.0% (100 consumers) – Years 5+: ~1.0% (60 consumers) ILLUSTRATIVE |
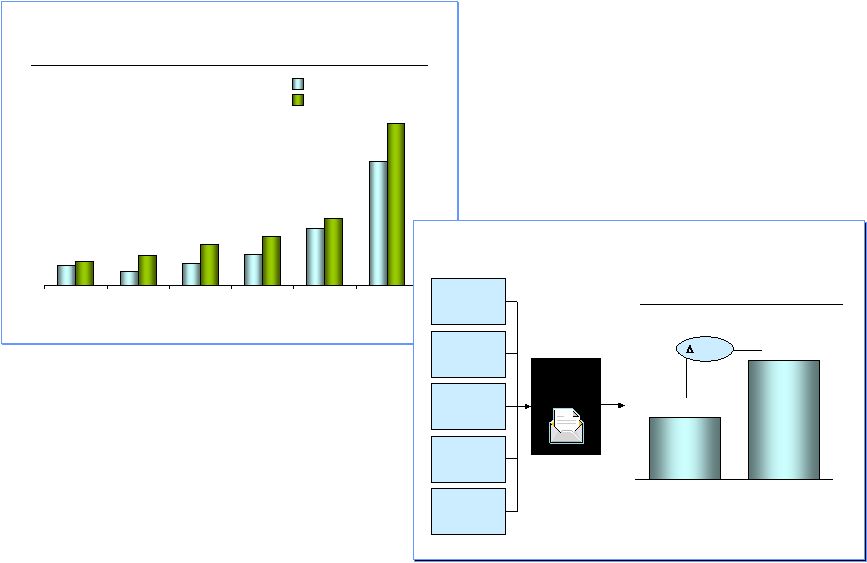
 Encore Capital Group THE INDUSTRY HAS GONE THROUGH SEVERAL DISTINCT STAGES OVER THE LAST 10 YEARS 8 0 50 100 150 200 250 300 0 1 2 3 4 5 6 7 8 9 Demand Supply • Issuers are relatively naïve about the value of consumer debt • Modest demand for delinquent consumer paper leads to low prices An emerging market 2001 2003 • Issuers improve their delinquent credit card valuation methods • The number of buyers increases dramatically as private equity enters and small players borrow and invest heavily for growth • Buyers fall prey to the “winner’s curse” as they price portfolios well outside reasonable collection expectations Overconfidence and irrational pricing 2005 2007 • As credit markets close, buyers are unable to fund new and existing contracts • Consumer charge-off rates at all-time highs Significant opportunity 2009 |
 Encore Capital Group 9 Several competitors are now known to have overpaid for portfolios and are in financial distress or have exited the industry Between 2005 and 2007, we remained disciplined and avoided high priced portfolios that did not meet internal hurdle rates In late 2005, we established call center in India We believe it is the only successful late-stage collections platform in India, at 1/3 the cost of the U.S. Legal collections represented nearly 50% of the $400 million in total collections for 2008 with improved net liquidation We have maintained our analytic leadership position, and have strengthened it, with novel models and technologies Credit markets effectively closed following Lehman collapse in September 2008 Beginning in 2006, we started accelerating legal collections In July 2008, we raised $105 million of additional capital In 2008, we built and implemented industry’s first known ability-to- pay (Capability) model WE ARE WELL POSITIONED TODAY BECAUSE OF KEY STRATEGIC DECISIONS MADE DURING THE PERIOD OF OVERCONFIDENCE AND IRRATIONAL PRICING rd |
 Encore Capital Group 10 * See Reconciliation of Adjusted EBITDA to GAAP Net Income at the end of the
presentation 2009 Q3 Actual 2008 Q3 Actual Adjusted Q3 YOY Growth Variance $125,710 $27,933 29% $97,777 Collections $80,386 $14,013 21% $66,373 Revenue $70,023 $22,773 48% $47,250 Adjusted EBITDA* $9,004 $5,976 197% $3,028 Net Income $77,734 $11,627 18% $66,107 Purchases $0.37 $0.24 185% $0.13 EPS, FD ($000s, except EPS and ratios) OUR THIRD QUARTER RESULTS REFLECT THE CONTINUED IMPACT OF THESE DECISIONS |
 Encore Capital Group 11 AGENDA • Company snapshot and industry overview • Current environment and key operating metrics • Operational competitive advantages • Additional financial information |
 Encore Capital Group 12 • Charge-offs are at 10.7% as of September 2009, near August 2009’s highest
levels, with an expected peak of 12% in early 2010 • The 19 largest domestic banks are expected to charge-off $82.4 billion of credit
card debt by the end of 2010 • Some analysts believe that unemployment above 10% could lead to higher charge-off
rates and up to $200 billion in losses across the whole industry by
2010 • At fresh purchase rates between $0.06 and $0.07 of face value, potential overall spend is $12 - $14 billion, while current demand is closer to $2 - $4 billion Moody’s Credit Card Charge-off Index 0.0% 2.0% 4.0% 6.0% 8.0% 10.0% 12.0% WE ARE OPERATING IN A PERIOD OF UNPRECEDENTED SUPPLY |
 Encore Capital Group 13 Reduction in demand for delinquent credit card assets Large purchasing mistakes force key players to the sidelines (Asta) Bigger players exiting the market (Arrow, IDT), a trend
we expect will continue through 2010 Access to capital remains tight across the industry; constraining purchasing (CarVal - West, AACC, NCO) Shutdown of the secondary market puts pressure on resellers’ models, leading to further buying restraint AND AN EQUALLY DRAMATIC REDUCTION IN DEMAND |
 Encore Capital Group 14 4.25% 4.25% 4.50% 5.25% 9.75% 12.50% 12.55% 9.00% 6.50% 2001 2002 2003 2004 2005 2006 2007 2008 2009 Fresh credit card portfolio prices – a top 10 issuer (% on a dollar of face) EXAMPLE THESE SUPPLY AND DEMAND DYNAMICS HAVE DRIVEN PRICING TO 5-YEAR LOWS |
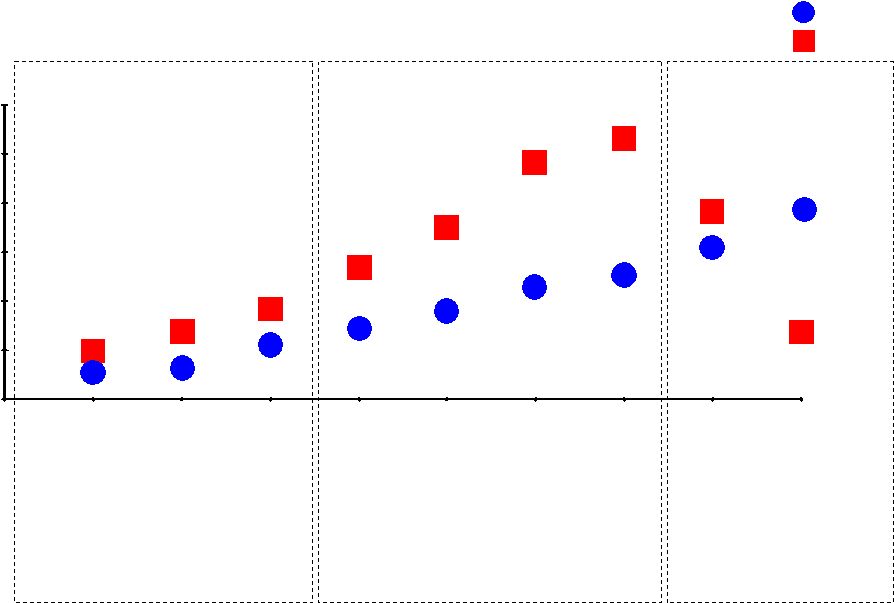
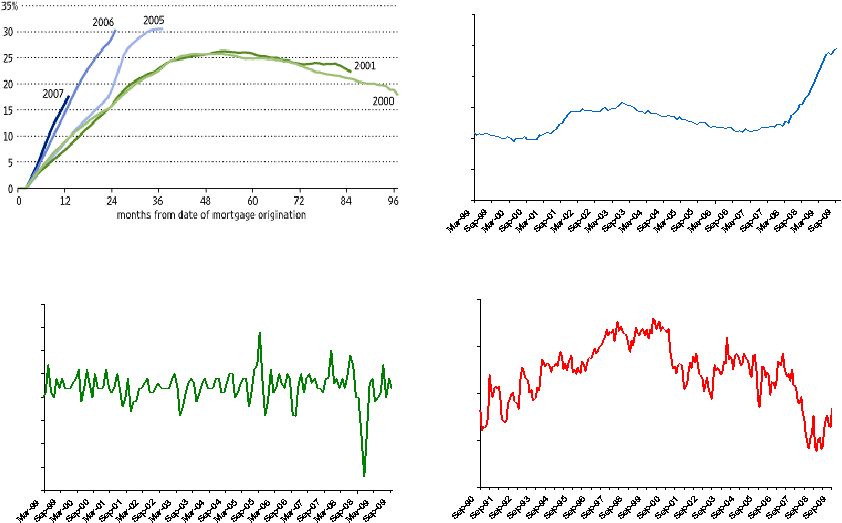 Encore Capital Group -2.0% -1.5% -1.0% -0.5% 0.0% 0.5% 1.0% 1.5% 2.0% 15 40 60 80 100 120 0.0% 2.0% 4.0% 6.0% 8.0% 10.0% 12.0% THE GENERAL PERCEPTION IS THAT COLLECTIONS ARE PROBABLY DECLINING ALONG WITH PRICES, DUE TO ECONOMIC CONDITIONS High mortgage defaults Near all-time high unemployment rate Low consumer sentiment Volatile consumer price
index Source: Wall Street Journal, Loan Performance, University of Michigan,
U.S. Bureau of Labor Statistics |
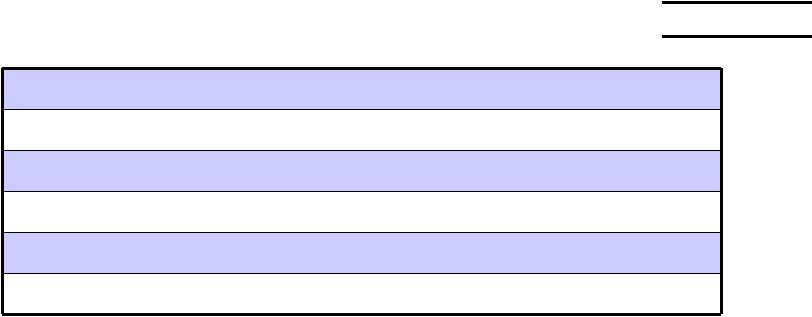
 Encore Capital Group 16 IN CONTRAST, OUR PERFORMANCE HAS GENERALLY REMAINED CONSISTENT Metric Recent trend • Payer rates • Slightly upward • Average payment size • Stable • Single vs. multi-payers • More payment plans • Broken payer rates • Mild improvement • Settlement rates • Steady |
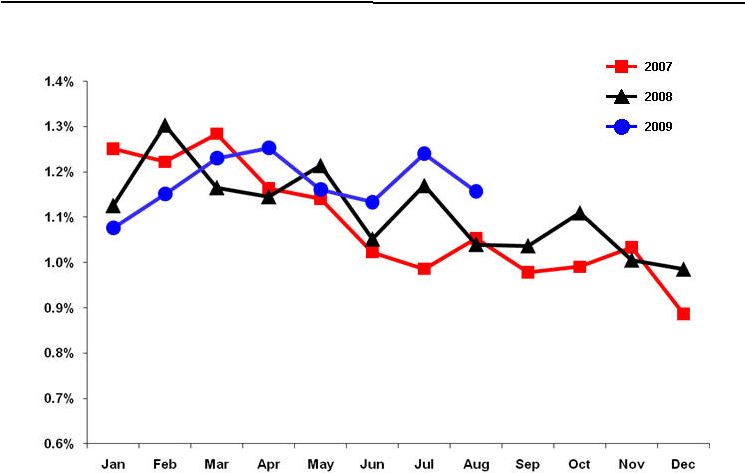 Encore Capital Group 17 MOST NOTABLY, OUR PAYER RATES ARE NOT DECLINING RELATIVE TO SEASONAL PATTERNS Overall payer rate for all active inventory (Percent) |
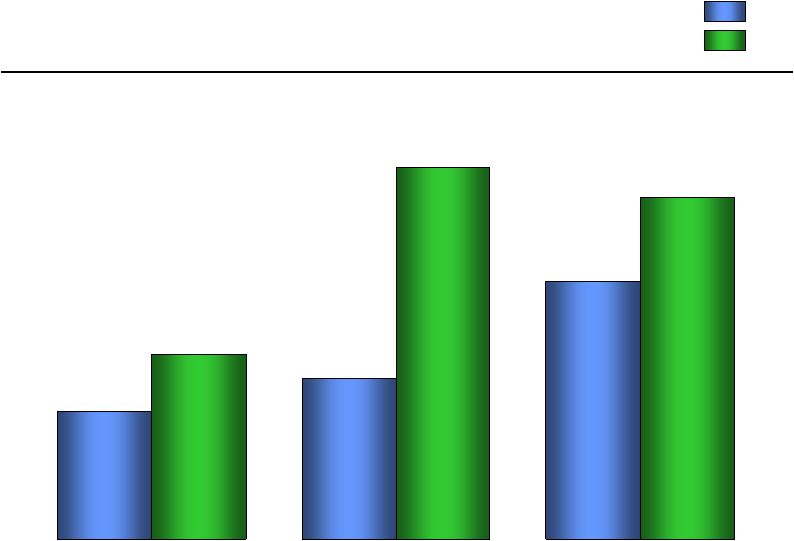 Encore Capital Group 18 $47.9 $66.1 $52.5 $55.9 $82.0 $77.7 Q1 Q2 Q3 2008 Quarterly Purchases for 2008 and 2009 ($ millions) GIVEN OUR STRONG RETURNS, WE ARE ABLE TO PURCHASE PORTFOLIOS AT AN INCREASING RATE 2009 |
 Encore Capital Group 19 AGENDA • Company snapshot and industry overview • Current environment and key operating metrics • Operational competitive advantages • Additional financial information |
 Encore Capital Group 20 OUR STRONG PERFORMANCE IS THE RESULT OF OUR DIFFERENTIATED OPERATING PLATFORM Highly analytic and sophisticated methods for understanding and predicting consumer payment behavior First-mover, offshore collection strategy that provides significant cost advantages Leading legal collection platform with expanded portfolio penetration and
improved liquidation Exceptionally stable, productive and tenured call center professionals Encore’s unique collection strategy |
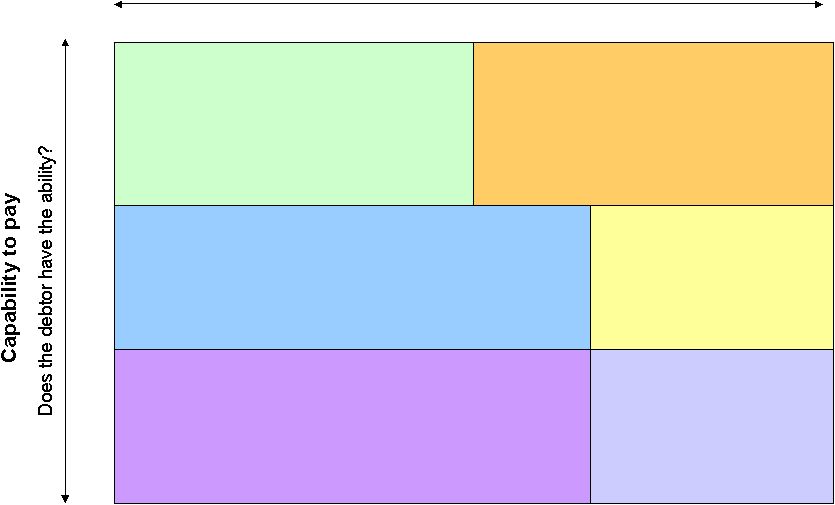 Encore Capital Group 21 OUR ANALYTIC INSIGHT ALLOWS US TO MATCH OUR COLLECTION TACTICS TO THE INDIVIDUAL CONSUMER’S PAYER BEHAVIOR Willingness to pay Is the debtor willing to resolve the debt on fair terms? H H L L Minimal discounts and direct to legal Minimal discounts, collect mainly through mail and outbound calls Minimal to no effort Significant discounts, smaller payments and longer payment plans through call center and mail Pre-legal collections and litigation collections Moderate discounts, use of payment plans and creative communications through call center and mail |
 Encore Capital Group Core competency in understanding the payer behavior of distressed consumers Account sales Monitoring Legal Outsourcing Legal effort model with Capability Call Centers Call effort model with Capability Direct Mail Letter effort model with Capability Collection Agency Outsourcing Agency effort model with Capability Collections operations that optimize effort and profitability Cross-channel coordination and optimization Consumer behavior research Market data and insight Portfolio valuation Pre-purchase model Continuous feedback between operations and valuation 22 OUR TEAM OF STATISTICIANS HAS BUILT MODELS THAT OPTIMIZE OUR PURCHASING AND COLLECTION STRATEGIES |
 Encore Capital Group 23 WE HAVE SEVERAL OPERATIONAL MODELS THAT PREDICT CONSUMERS’ WILLINGNESS TO PAY Encore Capital Group -Confidential IN ADDITION, OUR CALL PRIORITIZATION MODEL SIGNIFICANTLY ENHANCES OUR COLLECTION RESULTS Encore dialer model score bands $0.08 $0.10 $0.14 $0.17 $0.23 $0.55 $0.07 $0.05 $0.07 $0.11 $0.19 $0.42 1-150 151-300 301-500 501-800 801-1500 1500+ Random calling (2005) Model-sloped calling (2007) Average amount collected per call ($) • Average improvement: 50% • Enables allocation of effort based on unit yield to optimize call center variable costs 25 Encore Capital Group - Confidential ANOTHER EXAMPLE OF OUR INVESTMENT IN ANALYTICS IS OUR PROPRIETARY MAIL RESPONSE MODEL Collections per letter mailed Random mail selection Prioritization using Encore direct mail effort sloping model $2.90 $5.60 = 93% Mail response score Number of letters mailed Measures of credit quality Geography Amount owed When is debt being collected? ($) |
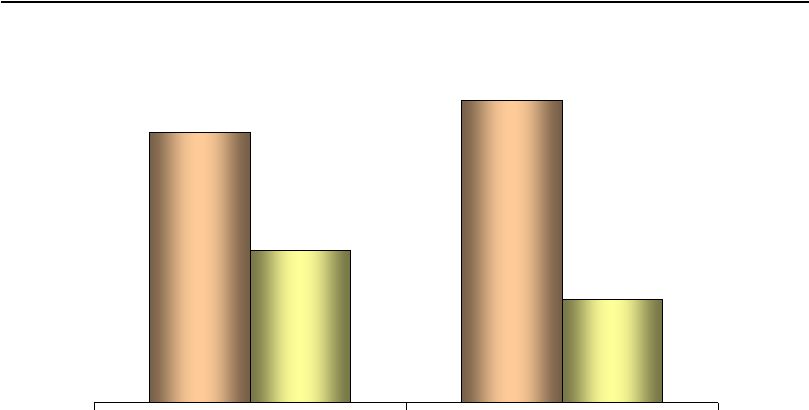 Encore Capital Group 24 OUR NEW LEGAL MODEL HAS RESULTED IN FEWER LAWSUITS BUT HAS NOT REDUCED LEGAL COLLECTIONS 49.8 55.6 Q3 08 Q3 09 Legal collections and costs as a percentage of collections 51.0% 46.9% $ $ ($ millions) |
 Encore Capital Group 25 INNOVATION IN THE LEGAL CHANNEL IS IMPORTANT BECAUSE IT CONTINUES TO BE OUR LARGEST SOURCE OF COLLECTIONS Legal collections as a percentage of gross collections 20% 30% 48% 48% 2003 2005 2007 YTD 2009 |
 Encore Capital Group 26 0.0% 5.0% 10.0% 15.0% 20.0% 25.0% 1 3 5 7 9 11 13 15 17 19 21 23 25 27 29 31 33 35 37 39 Month WHICH IS THE RESULT OF OUR ABILITY TO IDENTIFY CONSUMERS WHO DO NOT FIT THE TRADITIONAL LEGAL SELECTION MODEL Cumulative liquidation for a specific type of “unwilling consumer” Historical “unwilling consumers” accounts performance Lower credit quality performance Higher credit quality performance 3.8% 23.5% 15.3% |
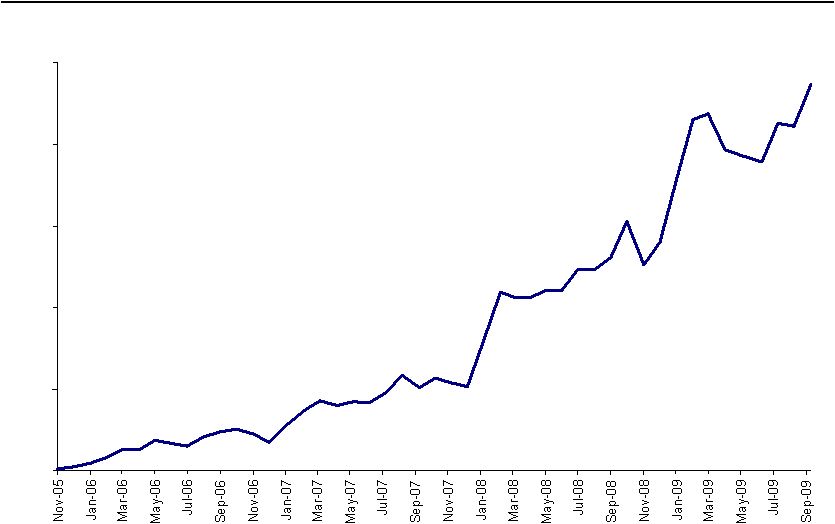 Encore Capital Group 27 $0.0 $1.0 $2.0 $3.0 $4.0 $5.0 ANOTHER AREA OF FOCUS HAS BEEN OUR DEVELOPMENT OF A SUCCESSFUL LATE STAGE COLLECTION CALL CENTER IN INDIA Gross collections (India) ($ millions) |
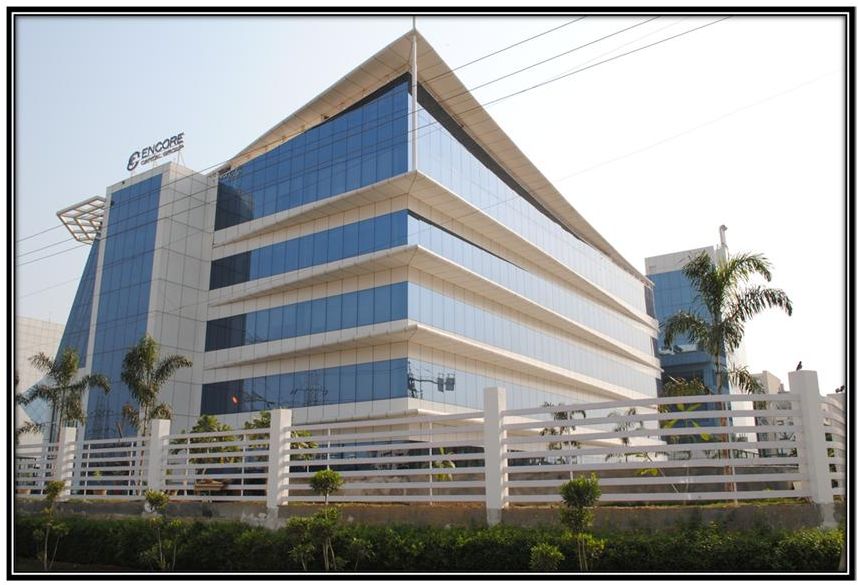 Encore Capital Group AND WE JUST MOVED INTO A NEW INDIA FACILITY, WHICH GIVES US THE ABILITY TO INCREASE HEADCOUNT TO OVER 1,100 COLLECTORS 28 |
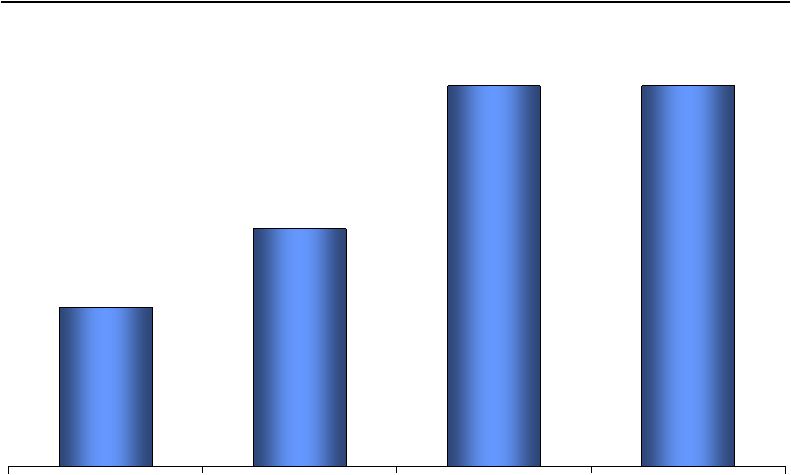
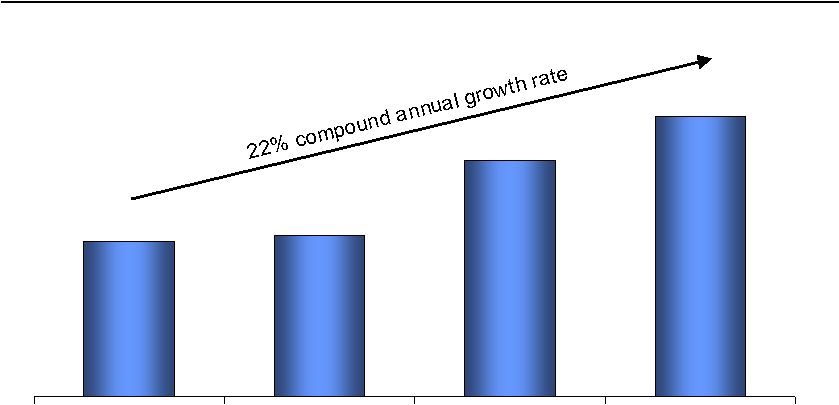 Encore Capital Group $25 $26 $38 $45 2006 2007 2008 2009 YTD 29 DOMESTICALLY, OUR COLLECTOR OUTPUT HAS DRAMATICALLY INCREASED Average monthly collections per active domestic collector ($ thousands) |
 Encore Capital Group 16.8% 12.6% Q3 08 Q3 09 30 THIS IMPROVED OUTPUT COMES AT A SIGNIFICANTLY LOWER COST Collection sites direct cost per dollar collected Note: This dramatic decrease cannot be seen in our overall results due to the costs
associated with the growth of our Legal Outsourcing channel |
 Encore Capital Group OUR INDUSTRY IS UNDER AN INCREASING AMOUNT OF SCRUTINY WHICH, WHILE TIME CONSUMING, MAY INCREASE BARRIERS TO ENTRY 31 • Engaged in active lobbying efforts and working with trade organizations both to support
a balanced agenda and to better inform legislators • Attending hearings held by the FTC that focus on the use of the legal channel
Proposed legislation, mostly at the state level, aims to increase disclosure, limit
statutes and expand licensing requirements • In response, we are shifting purchasing to fresher paper – Longer periods of time before the statute expires – Linked directly with the issuer Individual states are increasing requirements for pursuing litigation and obtaining
default judgments Increased attention from the FTC and State Attorneys General • Extensive focus on compliance – Partnered with the Better Business Bureau (BBB) to review our practices – Maintain automated call monitoring software and quality assurance teams – Dedicated in-house team of lawyers and compliance specialists
|
 Encore Capital Group 32 AGENDA • Company snapshot and industry overview • Current environment and key operating metrics • Operational competitive advantages • Additional financial information |
 Encore Capital Group 33 WE HAVE DEMONSTRATED A TRACK RECORD OF COLLECTION GROWTH Quarterly gross collections ($ millions) 125.7 59.9 83.9 75.8 85.6 97.8 |
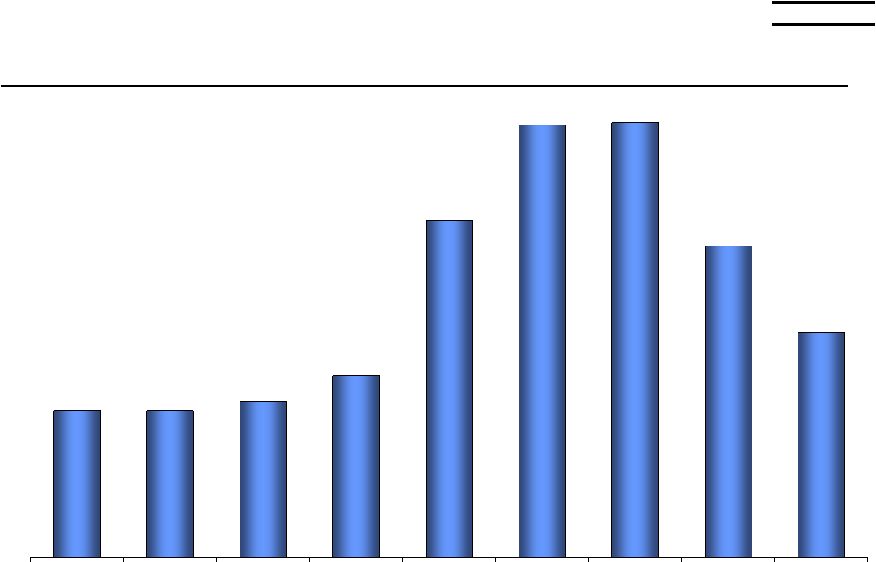
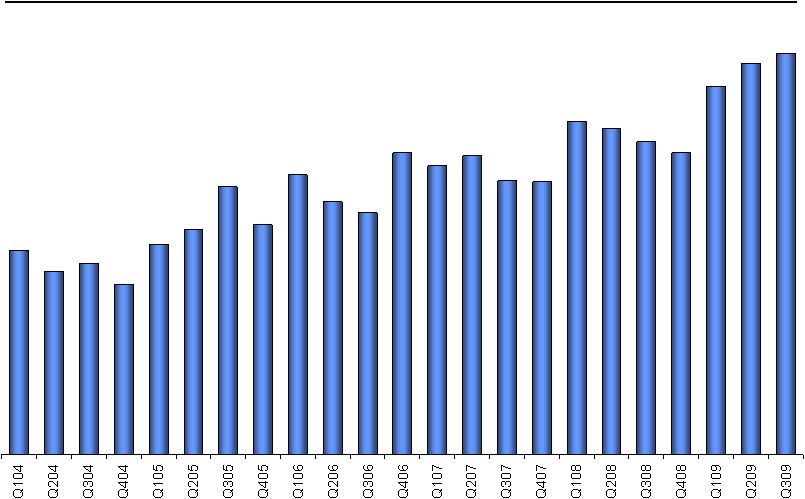
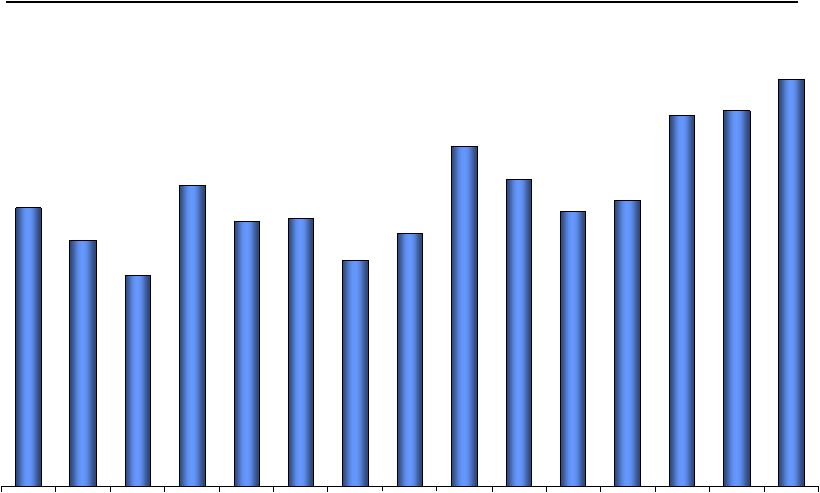 Encore Capital Group 34 AND A SIGNIFICANT POSITIVE TREND IN OPERATING CASH FLOW Adjusted EBITDA* by quarter ($ millions) * See Reconciliation of Adjusted EBITDA to GAAP Net Income at the end of the
presentation $70.0 $48.0 $42.4 $36.4 $51.9 $45.6 $46.1 $39.0 $43.5 $58.5 $53.0 $47.3 $49.3 $63.8 $64.7 Q1 06 Q2 06 Q3 06 Q4 06 Q1 07 Q2 07 Q3 07 Q4 07 Q1 08 Q2 08 Q3 08 Q408 Q1 09 Q2 09 Q3 09 |
 Encore Capital Group Cumulative Collections through September 30, 2009 Year of Purchase Purchase Price <2003 2003 2004 2005 2006 2007 2008 2009 Total CCM 2003 195,661 $331,683 $126,730 $105,982 $74,843 $54,248 $24,055 $12,880 $6,507 $736,928 3.8 2003 88,505 59,038 86,958 69,932 55,131 26,653 13,897 6,375 317,984 3.6 2004 101,330 39,400 79,845 54,832 34,625 19,116 8,964 236,782 2.3 2005 192,591 66,491 129,809 109,078 67,346 34,259 406,983 2.1 2006 141,973 42,354 92,265 70,743 36,406 241,768 1.7 2007 204,318 68,048 145,272 89,091 302,411 1.5 2008 227,991 69,049 128,905 197,954 0.9 2009 215,015 52,523 52,523 0.2 Total $1,367,384 $331,683 $185,768 $232,340 $291,111 $336,374 $354,724 $398,303 $363,030 $2,493,333 1.8 35 THE BUSINESS MODEL LAYERS IN CONSISTENT MULTI-PERIOD GROWTH < |
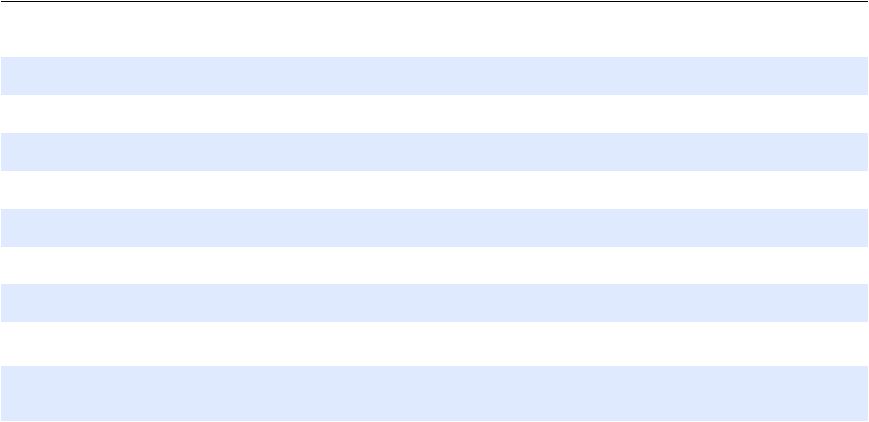
 Encore Capital Group 36 $757 $892 $1,063 $1,188 Y/E 2006 Y/E 2007 Y/E 2008 Q3 2009 Estimated remaining gross collections ($ millions) THIS LEADS TO AN INCREASE IN OUR RESERVOIR OF FUTURE VALUE |
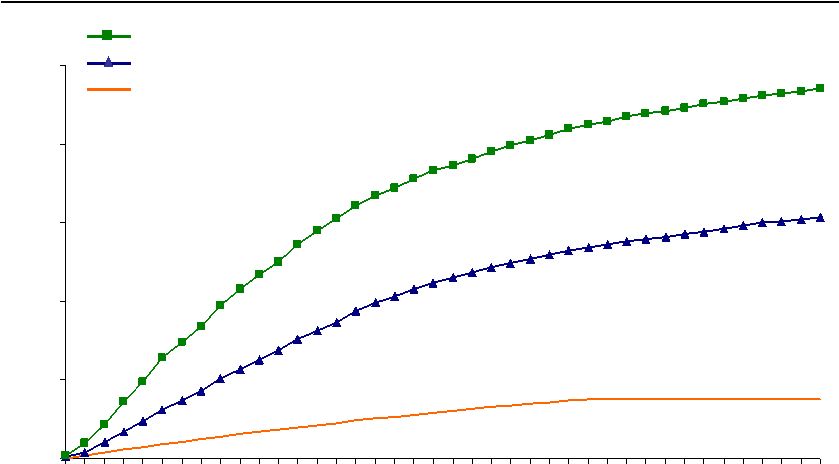
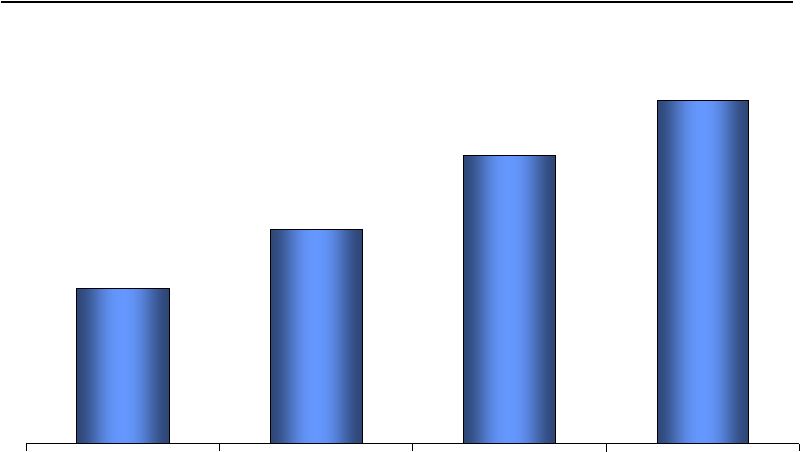
 Encore Capital Group 37 MOREOVER, WE BELIEVE OUR INITIAL FORECASTS ARE CONSERVATIVE Cumulative collections (initial expectation vs. actual) ($ millions, Jan 01 – Sept 09) $- $250 $500 $750 $1,000 $1,250 $1,500 $1,750 $2,000 $2,250 $2,500 Actual cash collections Original projections |
 Encore Capital Group WHILE THERE IS VARIABILITY AT THE POOL GROUP LEVEL, IN AGGREGATE OUR FORECASTS ARE HIGHLY ACCURATE 38 Collections vs. forecast 80.0% 90.0% 100.0% 110.0% 120.0% Q1 07 Q2 07 Q3 07 Q4 07 Q1 08 Q2 08 Q3 08 Q4 08 Q1 09 Q2 09 Q3 09 Forecast Variance ($ millions) 2007 2008 2009 YTD Forecast $348.1 $401.1 $346.4 Actual $355.2 $398.6 $363.3 Variance 2% (1%) 5% |
 Encore Capital Group 39 ($ millions) Cash flow leverage ratio Debt Trailing 4-quarter adjusted EBITDA Debt/Adj. EBITDA [Maximum 1.75x] Minimum net worth Total stockholders' equity Minimum net worth Excess room Interest coverage ratio Trailing 4-quarter EBIT Trailing 4-quarter consolidated interest expense EBIT/Interest expense [Minimum 2.0x] 2007 272.4 172.8 1.58 171.5 136.7 34.8 51.8 18.0 2.9 2008 311.3 211.1 1.47 195.9 146.2 49.7 47.2 15.6 3.0 *Not adjusted for APB 14-1, prior to 2009 * * * Q3 09 324.4 250.3 1.30 231.9 158.5 73.3 57.3 16.4 3.5 WE ARE WELL WITHIN OUR FINANCIAL COVENANTS AND HAVE AMPLE ROOM TO GROW THE BUSINESS |
 Encore Capital Group AND WE ARE ACTIVELY WORKING ON THE REFINANCING OF OUR CREDIT FACILITY, WHICH MATURES IN MAY 2010 • With the recent improvement in the credit markets, we have been proactive in our renewal discussions 40 • Our goal is to expand the size of our facility above the current $335 million, in order to take advantage of significant opportunities in the purchasing market • We are confident that we will be able to refinance the facility prior to its maturity in May 2010, if not sooner • We are also investigating additional sources of financing to provide the most flexibility for the company |
 Encore Capital Group 41 INVESTMENT HIGHLIGHTS • Increasing supply combined with decreasing demand is creating opportunity for well capitalized companies • Sophisticated analytics, differentiated servicing strategies and our high performing, low cost site in India enable us to generate superior returns in today’s challenging economic times • Disciplined purchasing strategy allowed us to succeed over the past few years without entering the then dramatically overpriced “fresh”
portfolio market • Demonstrated history of generating strong cash flows • Strategically positioned to take advantage of significant near-term growth prospects |
 Encore Capital Group 42 Reconciliation of Adjusted EBITDA to GAAP Net Income (Unaudited, In Thousands) Three Months Ended Note: The periods 3/31/06 through 12/31/08 have been adjusted to reflect the retrospective application of APB 14-1; with the filing of our Form10-Q on 7/30/09, adjustments were made to this table for net income, interest expense and
provision for income taxes. 3/31/06 6/30/06 9/30/06 12/31/06 3/31/07 6/30/07 9/30/07 12/31/07 3/31/08 6/30/08 9/30/08 12/31/08 3/31/09 6/30/09 9/30/09 GAAP net income, as reported 4,078 6,870 4,574 5,952 4,991 (1,515) 4,568 4,187 6,751 6,162 3,028 (2,095) 8,997 6,641 9,004 Interest expense 4,274 4,155 3,994 4,367 4,042 4,506 4,840 5,260 5,200 4,831 5,140 5,401 4,273 3,958 3,970 Contingent interest expense 4,687 4,235 3,824 5,774 3,235 888 - - - - - - - - - Pay-off of future contingent interest - - - - - 11,733 - - - - - - - - - Provision for income taxes 2,801 5,288 3,249 4,098 3,437 (1,031) 1,315 2,777 4,509 4,225 2,408 (1,442) 5,973 4,166 5,948 Depreciation and amortization 960 968 964 1,002 869 840 833 810 722 766 674 652 623 620 652 Amount applied to principal on receivable portfolios 29,867 19,398 18,340 29,421 28,259 29,452 26,114 29,498 40,212 35,785 35,140 46,364 42,851 48,303 49,188 Stock-based compensation expense 1,381 1,464 1,490 1,334 801 1,204 1,281 1,001 1,094 1,228 860 382 1,080 994 1,261 Adjusted EBITDA 48,048 42,378 36,435 51,948 45,634 46,077 38,951 43,533 58,488 52,997 47,250 49,262 63,797 64,682 70,023 |