Attached files
| file | filename |
|---|---|
| 8-K - 8-K - MARKWEST ENERGY PARTNERS L P | a09-32378_18k.htm |
Exhibit 99.1
|
|
Platt’s 2nd Annual Appalachian Gas Conference Pittsburgh, Pennsylvania October 29, 2009 |
|
|
2 Forward-Looking Statements This presentation contains forward-looking statements and information. These forward-looking statements, which in many instances can be identified by words like “could,” “may,” “will,” “should,” “expects,” “plans,” “project,” “anticipates,” “believes,” “planned,” “proposed,” “potential,” and other comparable words, regarding future or contemplated results, performance, transactions, or events, are based on MarkWest Energy Partners, L.P. (“MarkWest” and “Partnership”) current information, expectations and beliefs, concerning future developments and their potential effects on MarkWest. Although we believe that the expectations reflected in the forward-looking statements are reasonable, we can give no assurance that such expectations will prove to be correct, and actual results, performance , distributions , events or transactions could vary significantly from those expressed or implied in such statements and are subject to a number of uncertainties and risks. Among the factors that could cause results, performance, distributions, events or transactions to differ materially from those expressed or implied, are those risks discussed in our Annual Report on Form 10-K for the year ended December 31, 2008, and our Quarterly Report on Form 10-Q for the quarter ended June 30, 2009, as filed with the SEC. You are urged to carefully review and consider the cautionary statements and other disclosures, including those under the heading “Risk Factors,” made in those documents. If any of the uncertainties or risks develop into actual events or occurrences, or if underlying assumptions prove incorrect, it could cause actual results to vary significantly from those expressed in the presentation, and our business, financial condition, or results of operations could be materially adversely affected. Key uncertainties and risks that may directly affect MarkWest’s performance, future growth, results of operations, and financial condition, include, but are not limited to: Fluctuations and volatility of natural gas, Natural Gas Liquids (“NGLs”) products, and oil prices; A reduction in natural gas or refinery off-gas production which we gather, transport, process, and/or fractionate; A reduction in the demand for the products we produce and sell; Financial credit risks / failure of customers to satisfy payment or other obligations under our contracts; Effects of our debt and other financial obligations, access to capital, or our future financial or operational flexibility or liquidity; Construction, procurement, and regulatory risks in our development projects; Hurricanes, fires, and other natural and accidental events impacting our operations, and adequate insurance coverage; Terrorist attacks directed at our facilities or related facilities; Changes in and impacts of laws and regulations affecting our operations; and Failure to integrate recent or future acquisitions. |
|
|
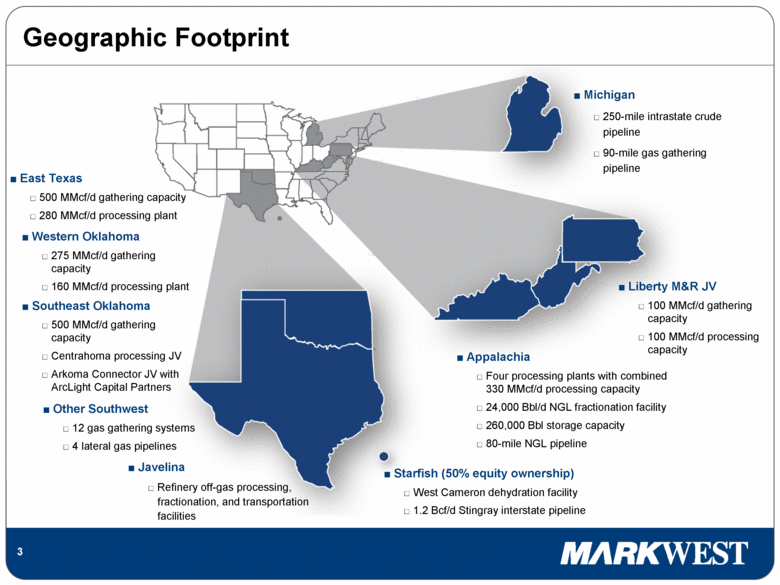
3 Geographic Footprint Michigan 250-mile intrastate crude pipeline 90-mile gas gathering pipeline Western Oklahoma 275 MMcf/d gathering capacity 160 MMcf/d processing plant Southeast Oklahoma 500 MMcf/d gathering capacity Centrahoma processing JV Arkoma Connector JV with ArcLight Capital Partners Starfish (50% equity ownership) West Cameron dehydration facility 1.2 Bcf/d Stingray interstate pipeline Appalachia Four processing plants with combined 330 MMcf/d processing capacity 24,000 Bbl/d NGL fractionation facility 260,000 Bbl storage capacity 80-mile NGL pipeline Javelina Refinery off-gas processing, fractionation, and transportation facilities East Texas 500 MMcf/d gathering capacity 280 MMcf/d processing plant Other Southwest 12 gas gathering systems 4 lateral gas pipelines Liberty M&R JV 100 MMcf/d gathering capacity 100 MMcf/d processing capacity |
|
|
4 Growth Driven by Customer Satisfaction R A N G E RESOURCES MarkWest Ranked # 1 in 2006 and #2 in 2009 Natural Gas Midstream Services Customer Satisfaction EnergyPoint Research, Inc. Customer Satisfaction Survey |
|
|
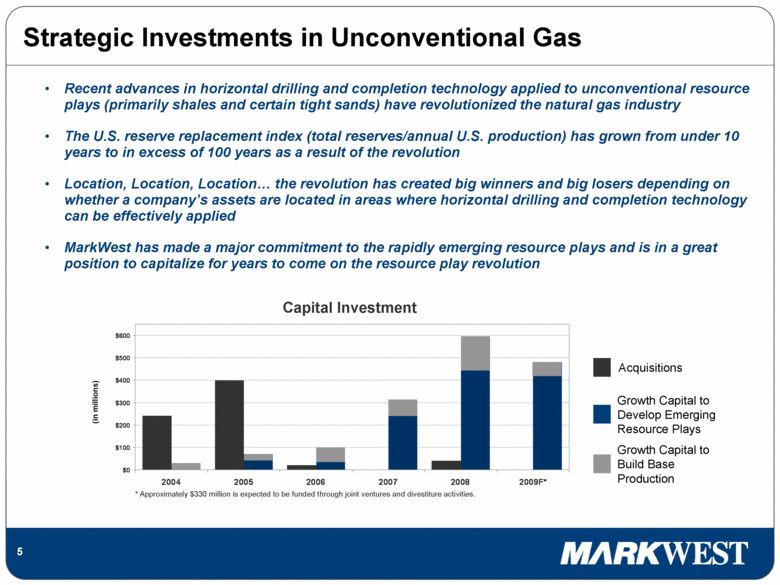
5 Strategic Investments in Unconventional Gas Capital Investment (in millions) Acquisitions Growth Capital to Develop Emerging Resource Plays * Approximately $330 million is expected to be funded through joint ventures and divestiture activities. Growth Capital to Build Base Production Recent advances in horizontal drilling and completion technology applied to unconventional resource plays (primarily shales and certain tight sands) have revolutionized the natural gas industry The U.S. reserve replacement index (total reserves/annual U.S. production) has grown from under 10 years to in excess of 100 years as a result of the revolution Location, Location, Location the revolution has created big winners and big losers depending on whether a company’s assets are located in areas where horizontal drilling and completion technology can be effectively applied MarkWest has made a major commitment to the rapidly emerging resource plays and is in a great position to capitalize for years to come on the resource play revolution $0 $100 $200 $300 $400 $500 $600 2004 2005 2006 2007 2008 2009F* |
|
|
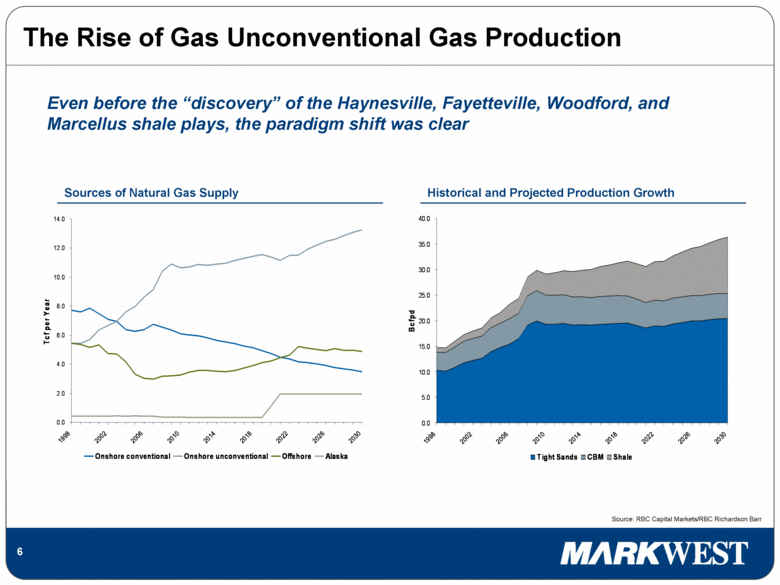
6 The Rise of Gas Unconventional Gas Production Sources of Natural Gas Supply Historical and Projected Production Growth Source: RBC Capital Markets/RBC Richardson Barr Even before the “discovery” of the Haynesville, Fayetteville, Woodford, and Marcellus shale plays, the paradigm shift was clear 0.0 2.0 4.0 6.0 8.0 10.0 12.0 14.0 1998 2002 2006 2010 2014 2018 2022 2026 2030 Tcf per Year Onshore conventional Onshore unconventional Offshore Alaska 0.0 5.0 10.0 15.0 20.0 25.0 30.0 35.0 40.0 Bcfpd 1998 2002 2006 2010 2014 2018 2022 2026 2030 Tight Sands CBM Shale |
|
|
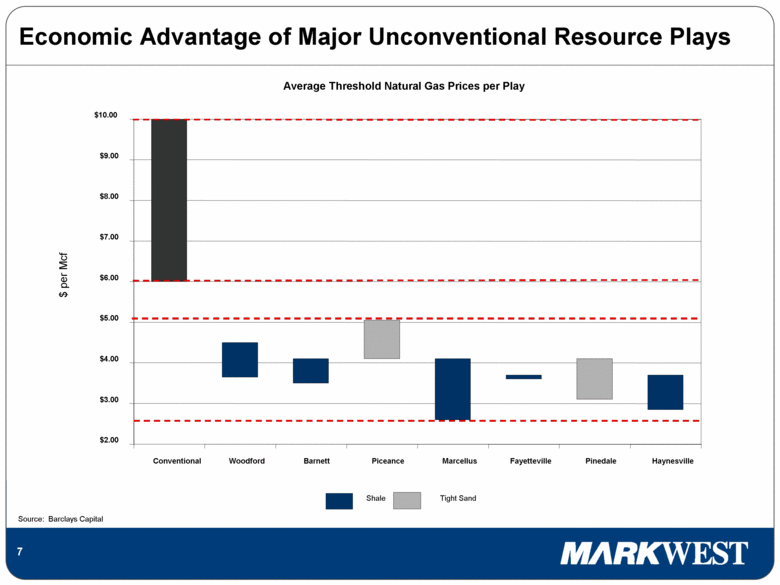
7 Source: Barclays Capital Economic Advantage of Major Unconventional Resource Plays Average Threshold Natural Gas Prices per Play $2.00 $3.00 $4.00 $5.00 $6.00 $7.00 $8.00 $9.00 $10.00 Conventional Woodford Barnett Piceance Marcellus Fayetteville Pinedale Haynesville $ per Mcf Shale Tight Sand |
|
|
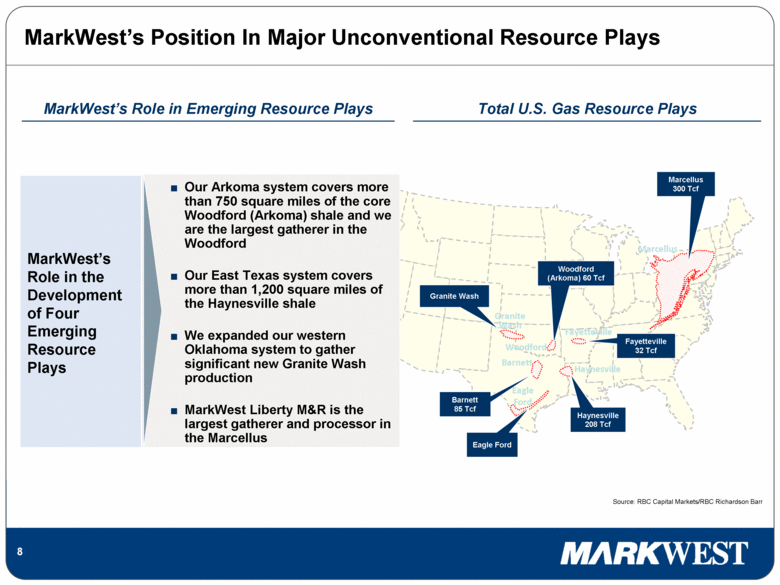
8 MarkWest’s Position In Major Unconventional Resource Plays Marcellus Barnett Haynesville Marcellus 300 Tcf Fayetteville 32 Tcf Fayetteville Woodford (Arkoma) 60 Tcf Granite Wash Barnett 85 Tcf Eagle Ford Haynesville 208 Tcf Woodford Eagle Ford Total U.S. Gas Resource Plays MarkWest’s Role in Emerging Resource Plays Source: RBC Capital Markets/RBC Richardson Barr Granite Wash Our Arkoma system covers more than 750 square miles of the core Woodford (Arkoma) shale and we are the largest gatherer in the Woodford Our East Texas system covers more than 1,200 square miles of the Haynesville shale We expanded our western Oklahoma system to gather significant new Granite Wash production MarkWest Liberty M&R is the largest gatherer and processor in the Marcellus MarkWest’s Role in the Development of Four Emerging Resource Plays |
|
|
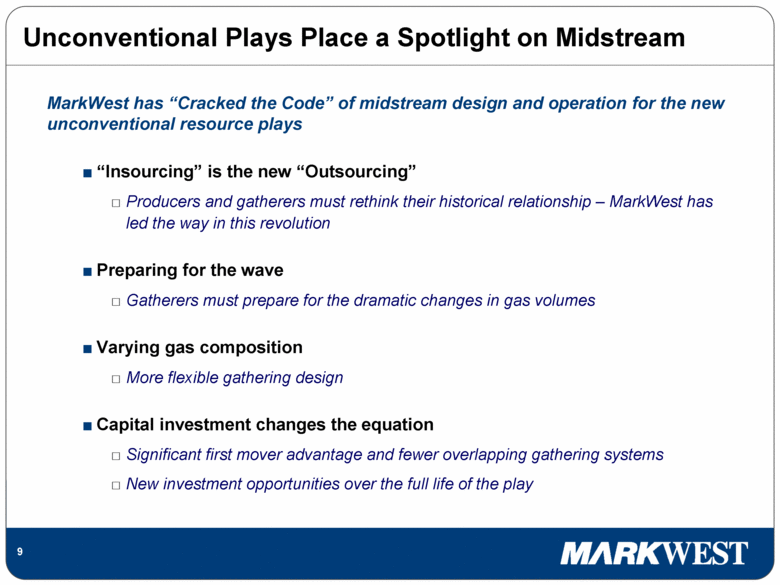
9 Unconventional Plays Place a Spotlight on Midstream “Insourcing” is the new “Outsourcing” Producers and gatherers must rethink their historical relationship – MarkWest has led the way in this revolution Preparing for the wave Gatherers must prepare for the dramatic changes in gas volumes Varying gas composition More flexible gathering design Capital investment changes the equation Significant first mover advantage and fewer overlapping gathering systems New investment opportunities over the full life of the play MarkWest has “Cracked the Code” of midstream design and operation for the new unconventional resource plays |
|
|
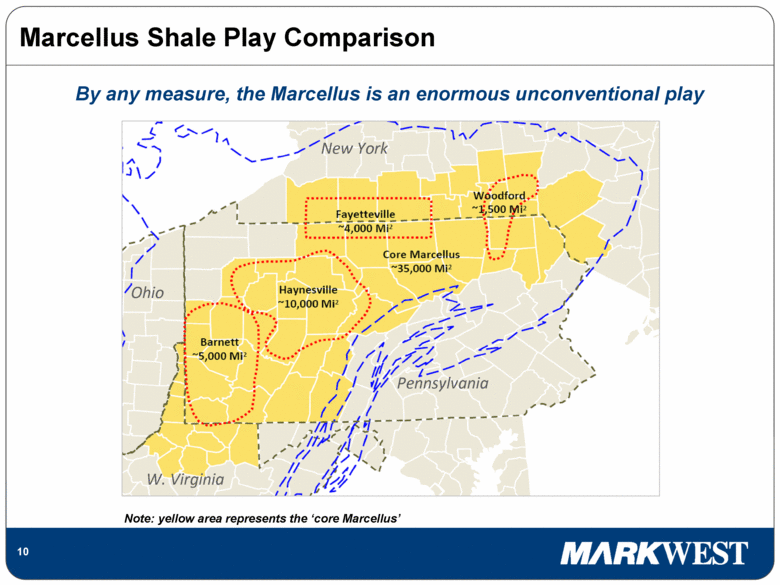
10 Marcellus Shale Play Comparison Pennsylvania New York Ohio W. Virginia Note: yellow area represents the ‘core Marcellus’ By any measure, the Marcellus is an enormous unconventional play |
|
|
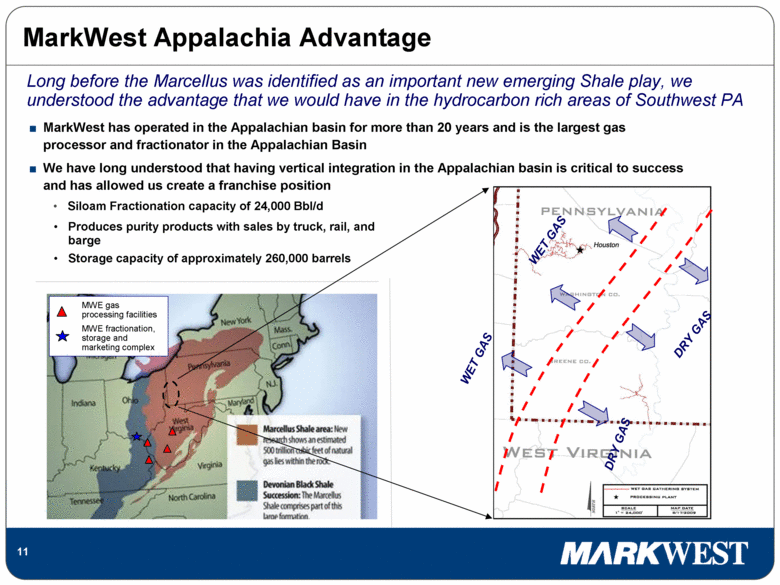
11 MarkWest Appalachia Advantage MarkWest has operated in the Appalachian basin for more than 20 years and is the largest gas processor and fractionator in the Appalachian Basin We have long understood that having vertical integration in the Appalachian basin is critical to success and has allowed us create a franchise position Siloam Fractionation capacity of 24,000 Bbl/d MWE gas processing facilities MWE fractionation, storage and marketing complex Produces purity products with sales by truck, rail, and barge Storage capacity of approximately 260,000 barrels DRY GAS DRY GAS WET GAS WET GAS Long before the Marcellus was identified as an important new emerging Shale play, we understood the advantage that we would have in the hydrocarbon rich areas of Southwest PA |
|
|
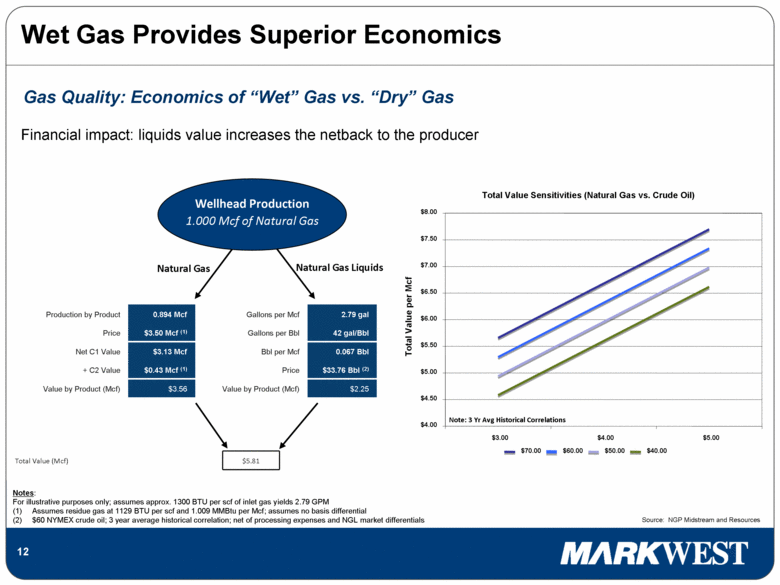
12 Gas Quality: Economics of “Wet” Gas vs. “Dry” Gas Notes: For illustrative purposes only; assumes approx. 1300 BTU per scf of inlet gas yields 2.79 GPM Assumes residue gas at 1129 BTU per scf and 1.009 MMBtu per Mcf; assumes no basis differential $60 NYMEX crude oil; 3 year average historical correlation; net of processing expenses and NGL market differentials Production by Product 0.894 Mcf Gallons per Mcf 2.79 gal Price $3.50 Mcf (1) Gallons per Bbl 42 gal/Bbl Net C1 Value $3.13 Mcf Bbl per Mcf 0.067 Bbl + C2 Value $0.43 Mcf (1) Price $33.76 Bbl (2) Value by Product (Mcf) $3.56 Value by Product (Mcf) $2.25 Natural Gas Natural Gas Liquids Wellhead Production 1.000 Mcf of Natural Gas Financial impact: liquids value increases the netback to the producer Total Value (Mcf) $5.81 Wet Gas Provides Superior Economics Total Value Sensitivities (Natural Gas vs. Crude Oil) $4.00 $4.50 $5.00 $5.50 $6.00 $6.50 $7.00 $7.50 $8.00 $3.00 $4.00 $5.00 Total Value per Mcf $70.00 $60.00 $50.00 $40.00 Note: 3 Yr Avg Historical Correlations Source: NGP Midstream and Resources |
|
|
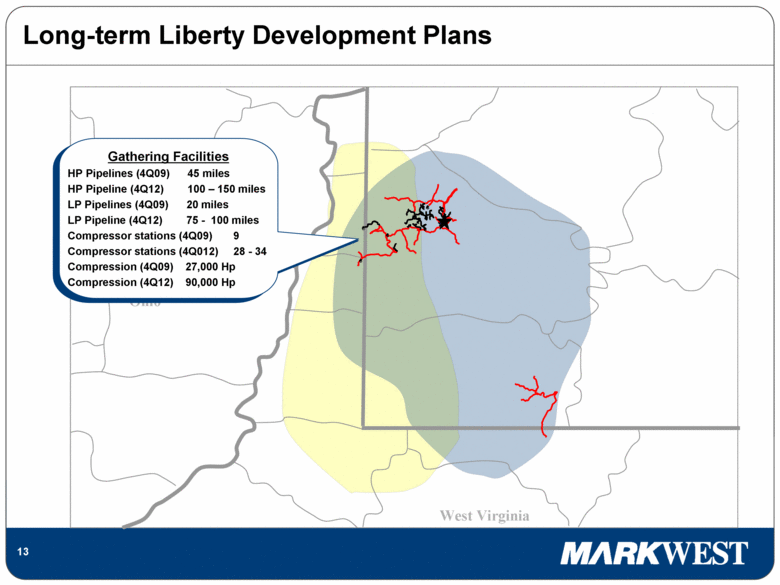
13 Long-term Liberty Development Plans Ohio West Virginia Gathering Facilities HP Pipelines (4Q09) 45 miles HP Pipeline (4Q12) 100 – 150 miles LP Pipelines (4Q09) 20 miles LP Pipeline (4Q12) 75 - 100 miles Compressor stations (4Q09) 9 Compressor stations (4Q012) 28 - 34 Compression (4Q09) 27,000 Hp Compression (4Q12) 90,000 Hp |
|
|
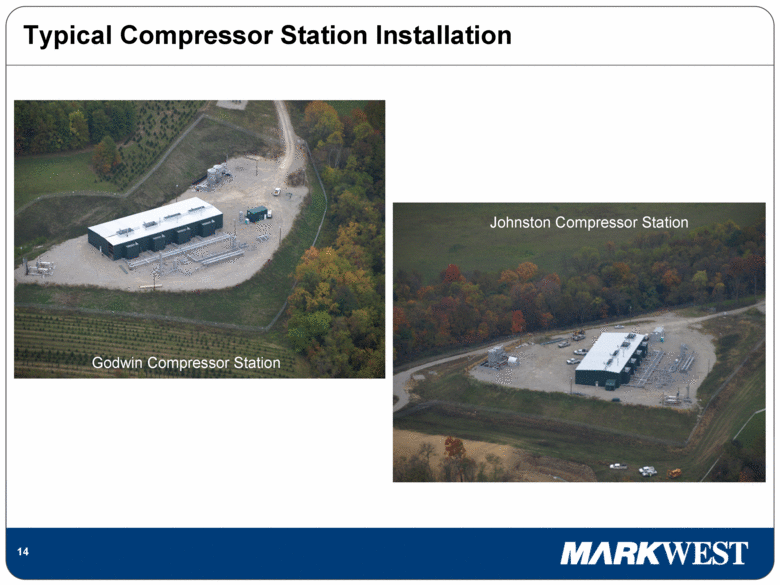
14 Typical Compressor Station Installation Johnston Compressor Station Godwin Compressor Station |
|
|
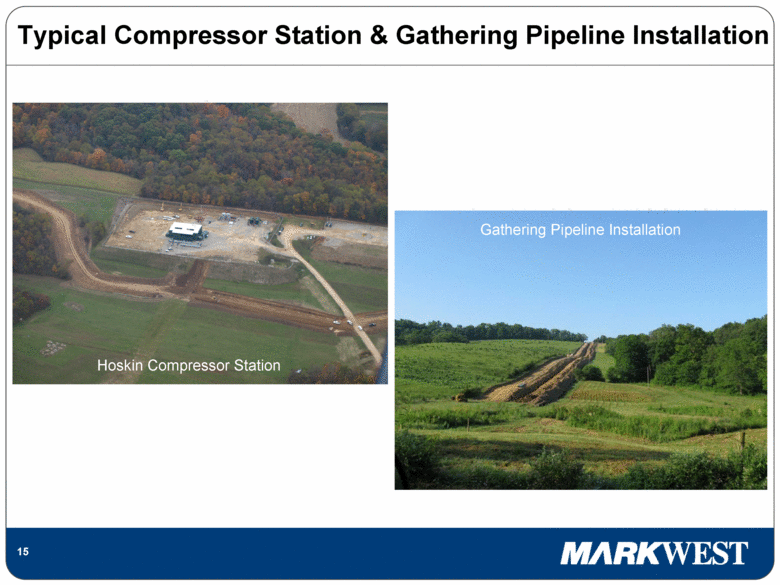
15 Typical Compressor Station & Gathering Pipeline Installation Hoskin Compressor Station Gathering Pipeline Installation |
|
|
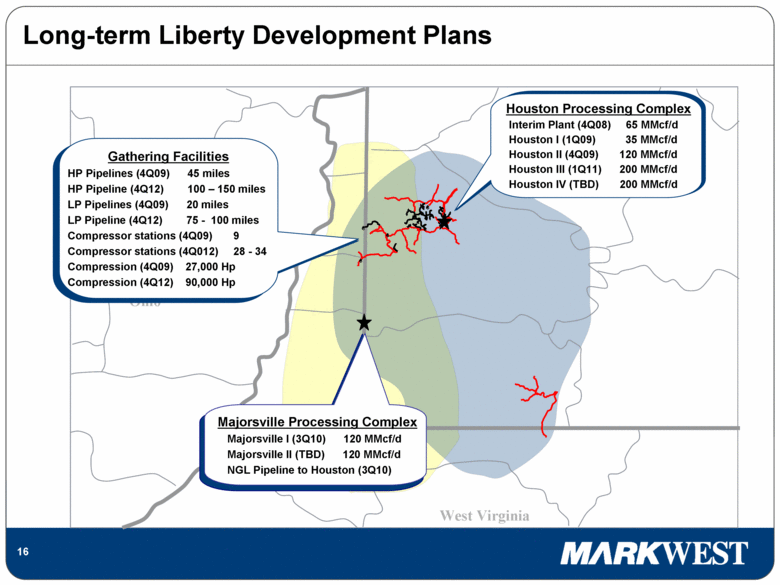
16 Long-term Liberty Development Plans Ohio West Virginia Houston Processing Complex Interim Plant (4Q08) 65 MMcf/d Houston I (1Q09) 35 MMcf/d Houston II (4Q09) 120 MMcf/d Houston III (1Q11) 200 MMcf/d Houston IV (TBD) 200 MMcf/d Gathering Facilities HP Pipelines (4Q09) 45 miles HP Pipeline (4Q12) 100 – 150 miles LP Pipelines (4Q09) 20 miles LP Pipeline (4Q12) 75 - 100 miles Compressor stations (4Q09) 9 Compressor stations (4Q012) 28 - 34 Compression (4Q09) 27,000 Hp Compression (4Q12) 90,000 Hp Majorsville Processing Complex Majorsville I (3Q10) 120 MMcf/d Majorsville II (TBD) 120 MMcf/d NGL Pipeline to Houston (3Q10) |
|
|
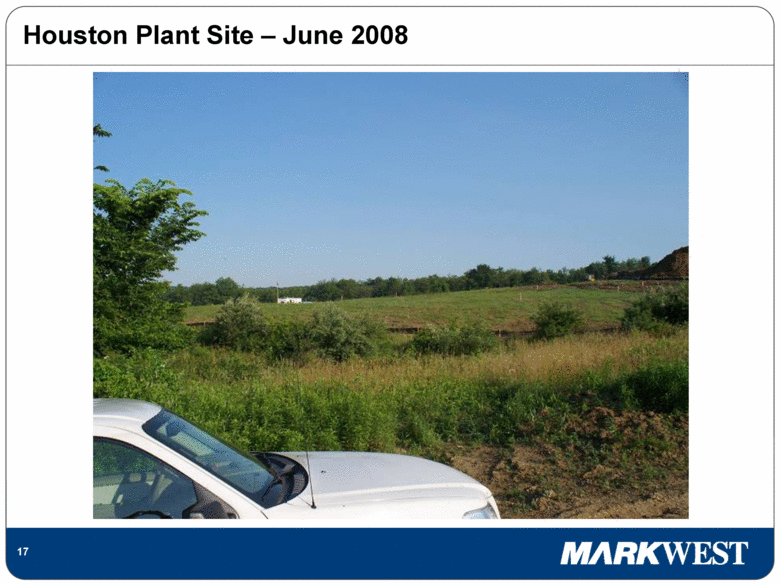
17 Houston Plant Site – June 2008 |
|
|
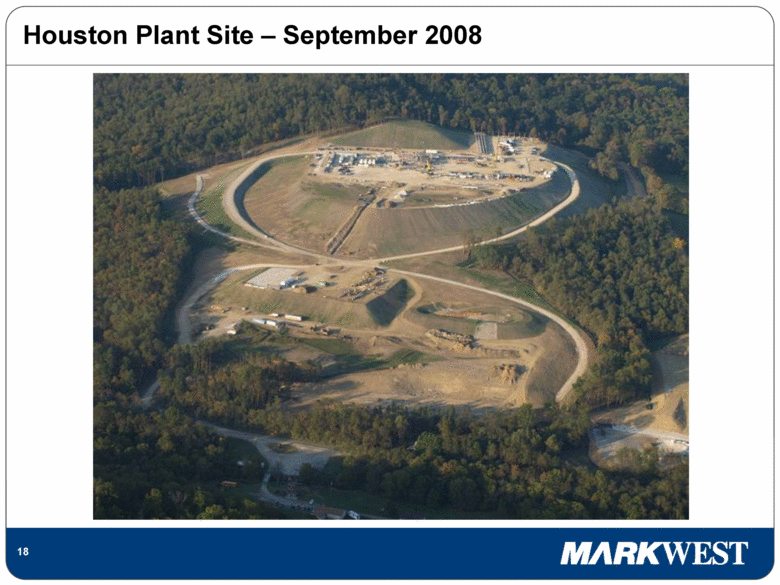
18 Houston Plant Site – September 2008 |
|
|
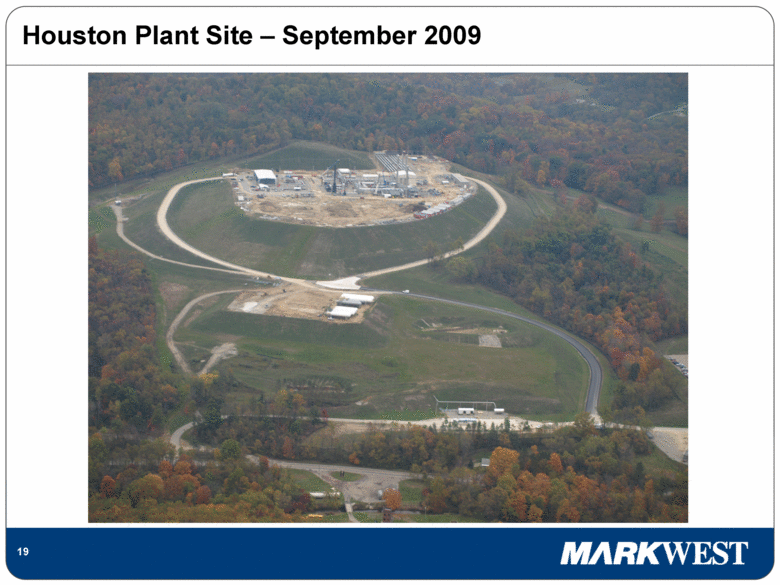
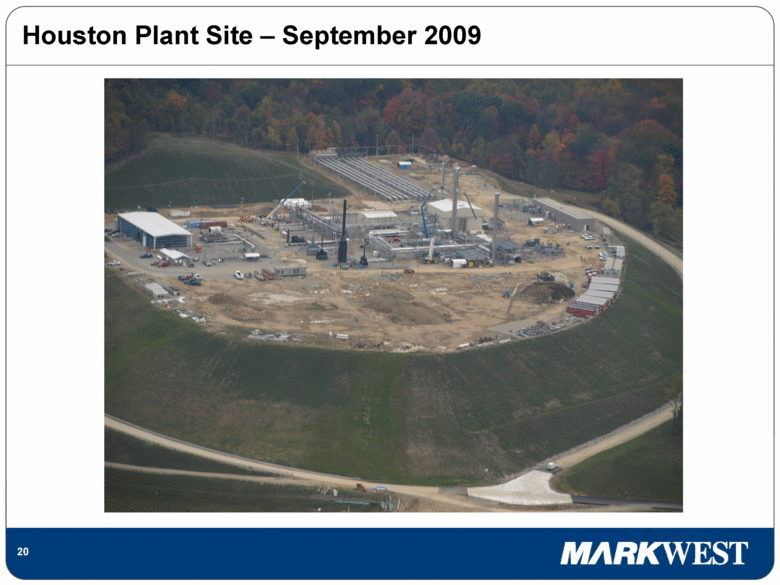
19 Houston Plant Site – September 2009 |
|
|
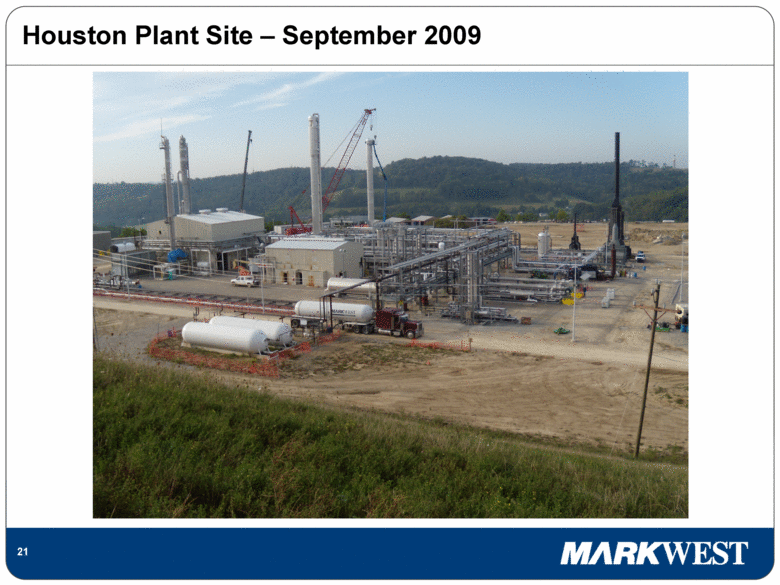
20 Houston Plant Site – September 2009 |
|
|
21 Houston Plant Site – September 2009 |
|
|
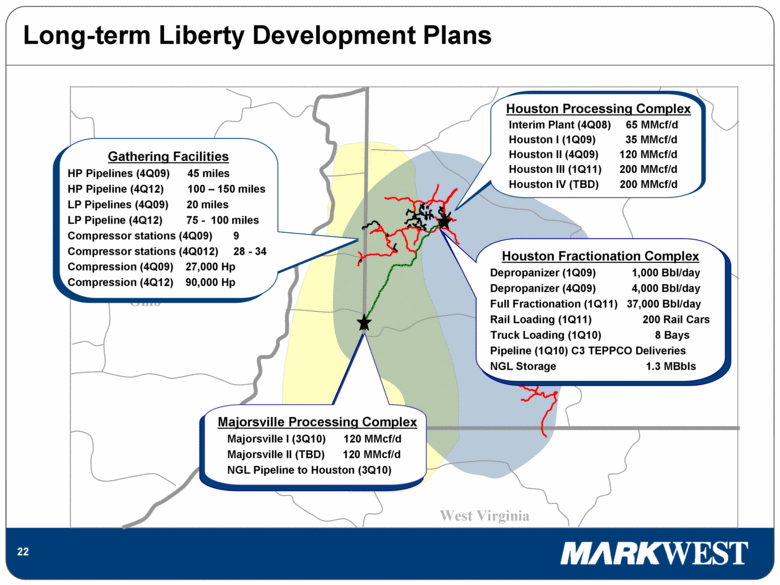
22 Long-term Liberty Development Plans Ohio West Virginia Majorsville Processing Complex Majorsville I (3Q10) 120 MMcf/d Majorsville II (TBD) 120 MMcf/d NGL Pipeline to Houston (3Q10) Houston Processing Complex Interim Plant (4Q08) 65 MMcf/d Houston I (1Q09) 35 MMcf/d Houston II (4Q09) 120 MMcf/d Houston III (1Q11) 200 MMcf/d Houston IV (TBD) 200 MMcf/d Gathering Facilities HP Pipelines (4Q09) 45 miles HP Pipeline (4Q12) 100 – 150 miles LP Pipelines (4Q09) 20 miles LP Pipeline (4Q12) 75 - 100 miles Compressor stations (4Q09) 9 Compressor stations (4Q012) 28 - 34 Compression (4Q09) 27,000 Hp Compression (4Q12) 90,000 Hp Houston Fractionation Complex Depropanizer (1Q09) 1,000 Bbl/day Depropanizer (4Q09) 4,000 Bbl/day Full Fractionation (1Q11) 37,000 Bbl/day Rail Loading (1Q11) 200 Rail Cars Truck Loading (1Q10) 8 Bays Pipeline (1Q10) C3 TEPPCO Deliveries NGL Storage 1.3 MBbls |
|
|
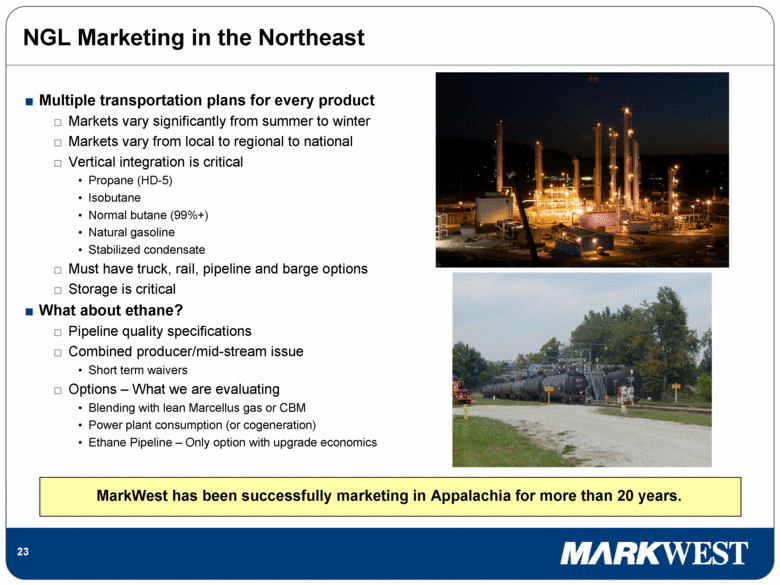
23 NGL Marketing in the Northeast Multiple transportation plans for every product Markets vary significantly from summer to winter Markets vary from local to regional to national Vertical integration is critical Propane (HD-5) Isobutane Normal butane (99%+) Natural gasoline Stabilized condensate Must have truck, rail, pipeline and barge options Storage is critical What about ethane? Pipeline quality specifications Combined producer/mid-stream issue Short term waivers Options – What we are evaluating Blending with lean Marcellus gas or CBM Power plant consumption (or cogeneration) Ethane Pipeline – Only option with upgrade economics MarkWest has been successfully marketing in Appalachia for more than 20 years. |
|
|
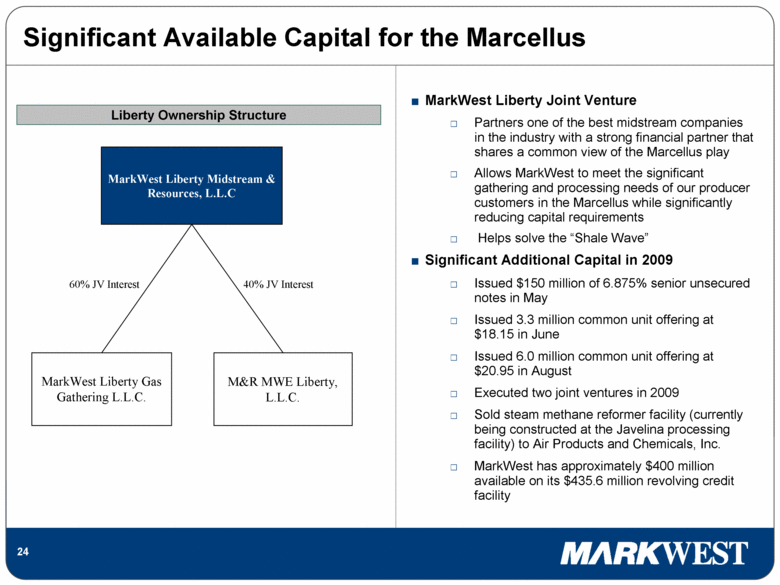
24 Significant Available Capital for the Marcellus MarkWest Liberty Midstream & Resources, L.L.C MarkWest Liberty Gas Gathering L.L.C. 60% JV Interest M&R MWE Liberty, L.L.C. 40% JV Interest MarkWest Liberty Joint Venture Partners one of the best midstream companies in the industry with a strong financial partner that shares a common view of the Marcellus play Allows MarkWest to meet the significant gathering and processing needs of our producer customers in the Marcellus while significantly reducing capital requirements Helps solve the “Shale Wave” Significant Additional Capital in 2009 Issued $150 million of 6.875% senior unsecured notes in May Issued 3.3 million common unit offering at $18.15 in June Issued 6.0 million common unit offering at $20.95 in August Executed two joint ventures in 2009 Sold steam methane reformer facility (currently being constructed at the Javelina processing facility) to Air Products and Chemicals, Inc. MarkWest has approximately $400 million available on its $435.6 million revolving credit facility Liberty Ownership Structure |
|
|
25 Keys to Midstream Success in Marcellus Maintain Capital Flexibility Organizational Development Joint Planning with Producer Customers Environmental and Regulatory Compliance Development of Downstream Solutions EXECUTE, EXECUTE, EXECUTE |
|
|
26 1515 Arapahoe Street Tower 2, Suite 700 Denver, CO 80202 Phone: 303-925-9200 Investor Relations: 866-858-0482 Email: investorrelations@markwest.com Website: www.markwest.com |