Attached files
| file | filename |
|---|---|
| 8-K - FORM 8-K - Polaris Inc. | c54191e8vk.htm |
| Polaris Industries Inc. Investor Presentation October 2009 |
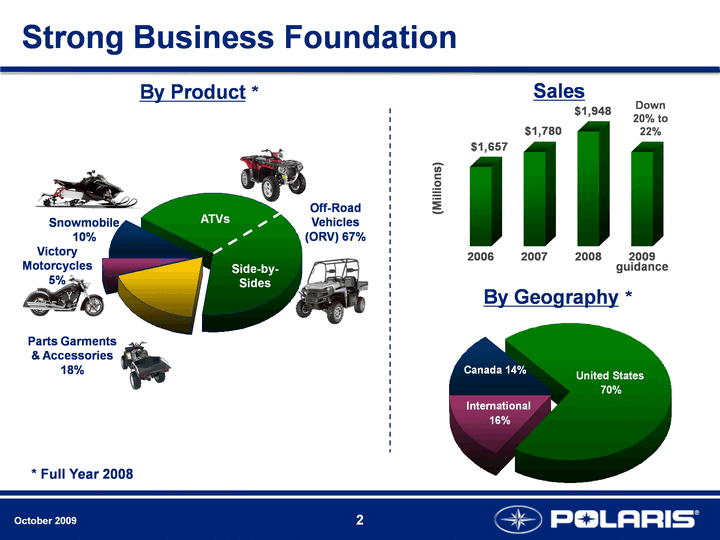
| October 2009 2 United States International Canada 1371.1 304.2 273 2006 2007 2008 2009 2006 1657 1780 1948 1780 Strong Business Foundation By Product * By Geography * Off-Road Vehicles (ORV) 67% Victory Motorcycles 5% Snowmobile 10% Parts Garments & Accessories 18% Snowmobiles ORVs Parts Garmants & Accessories Victory 10 67 18 5 ATVs Side-by- Sides Sales (Millions) Down 20% to 22% guidance * Full Year 2008 |

| 3 October 2009 2009 Full Year Guidance 2009 Full Year Guidance EPS Guidance Raised and Narrowed for Full Year 2009 |
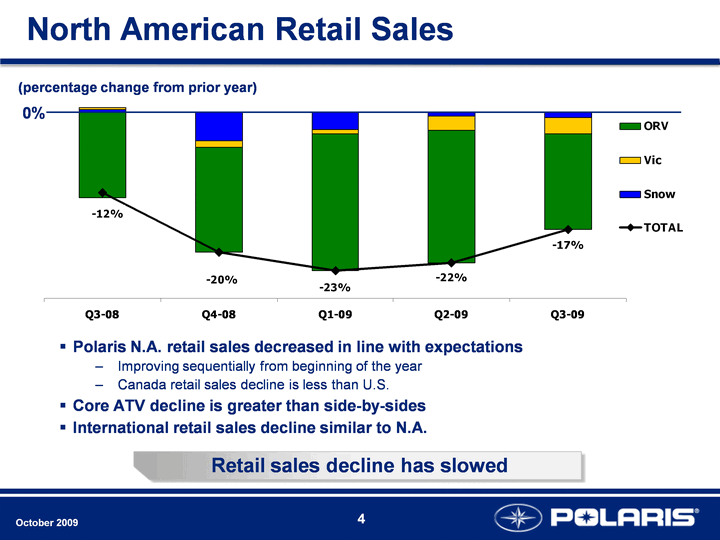
| 4 October 2009 North American Retail Sales 0% Polaris N.A. retail sales decreased in line with expectations Improving sequentially from beginning of the year Canada retail sales decline is less than U.S. Core ATV decline is greater than side-by-sides International retail sales decline similar to N.A. (percentage change from prior year) Retail sales decline has slowed |
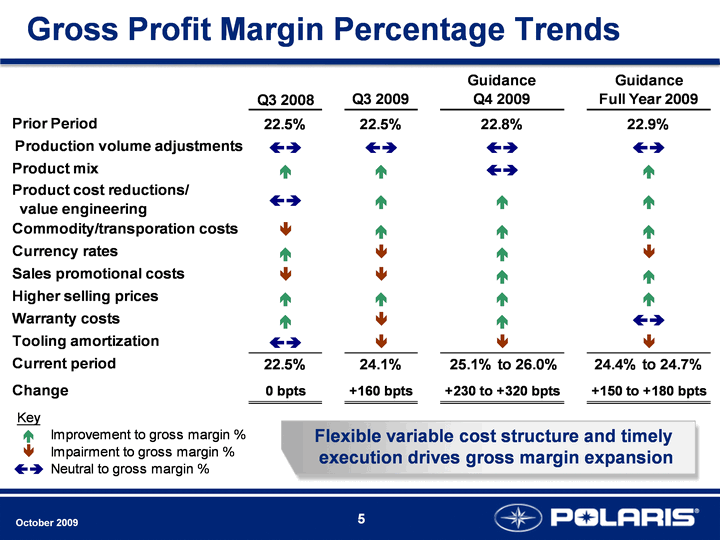
| 5 October 2009 Gross Profit Margin Percentage Trends Flexible variable cost structure and timely execution drives gross margin expansion |
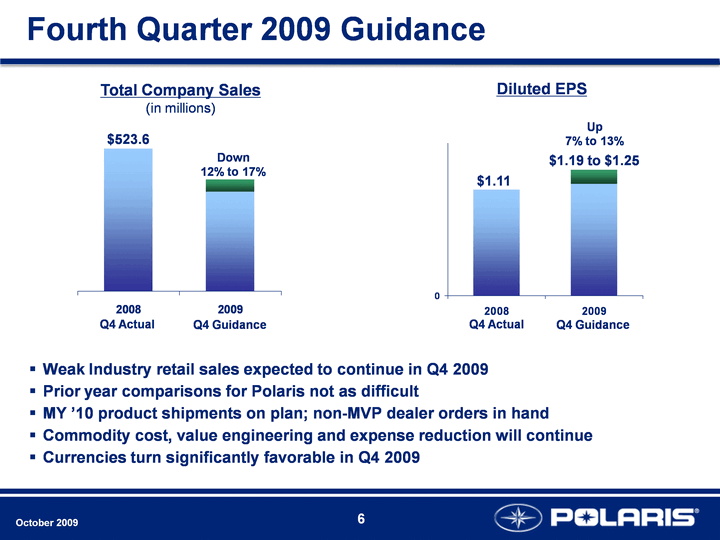
| 6 October 2009 Fourth Quarter 2009 Guidance Weak Industry retail sales expected to continue in Q4 2009 Prior year comparisons for Polaris not as difficult MY '10 product shipments on plan; non-MVP dealer orders in hand Commodity cost, value engineering and expense reduction will continue Currencies turn significantly favorable in Q4 2009 Total Company Sales (in millions) Diluted EPS 2008 2009 Sales 580.3 404.7 50 $523.6 Down 12% to 17% Q4 Actual Q4 Guidance 2008 2009 Sales 1.11 1.17 0.15 $1.11 $1.19 to $1.25 Up 7% to 13% Q4 Actual Q4 Guidance |
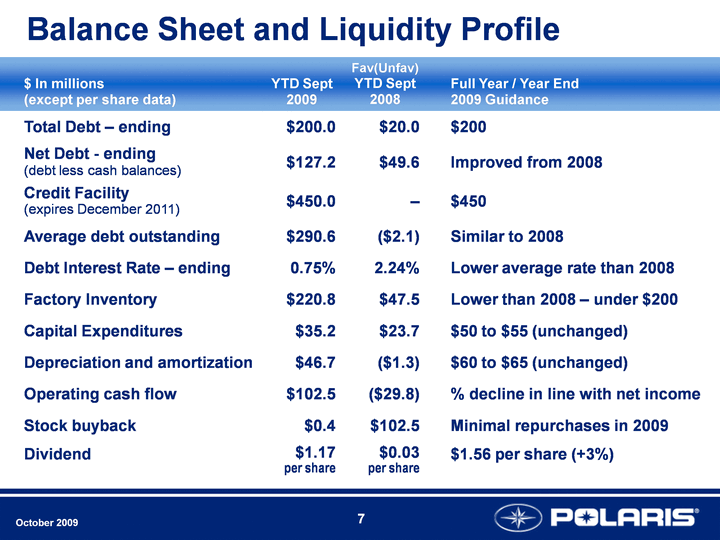
| 7 October 2009 Balance Sheet and Liquidity Profile Balance Sheet and Liquidity Profile |
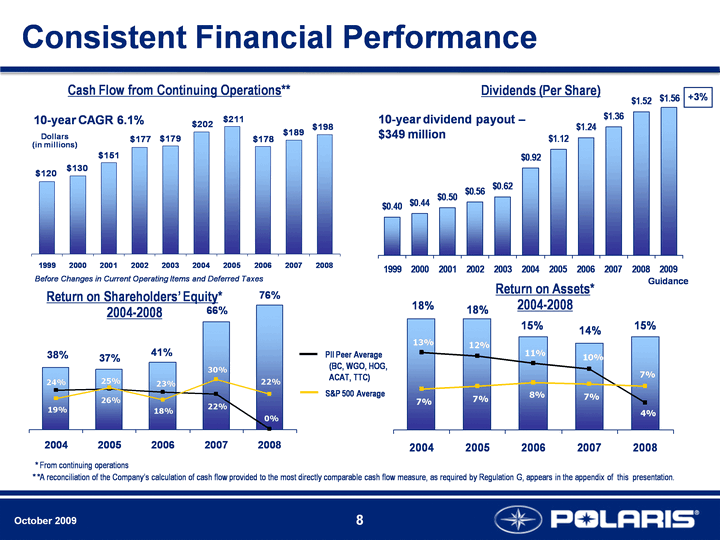
| October 2009 8 Consistent Financial Performance * *A reconciliation of the Company's calculation of cash flow provided to the most directly comparable cash flow measure, as required by Regulation G, appears in the appendix of this presentation. Before Changes in Current Operating Items and Deferred Taxes 1999 2000 2001 2002 2003 2004 2005 2006 2007 2008 2009 0.4 0.44 0.5 0.56 0.62 0.92 1.12 1.24 1.36 1.52 1.56 West North 1993 1999 2000 2001 2002 2003 2004 2005 2006 2007 2008 59 120 130 151 177 179 202 211 178 189 198 Cash Flow from Continuing Operations** Dollars (in millions) Dividends (Per Share) +3% Guidance 10-year CAGR 6.1% 10-year dividend payout - $349 million 2004 2005 2006 2007 2008 0.18 0.18 0.15 0.14 0.15 Peers 0.1251118 0.1197862 0.1078636 0.098095 0.0437014 S&P 0.065443378 0.070686342 0.07608951 0.074584368 0.070991254 2004 2005 2006 2007 2008 0.38 0.37 0.41 0.66 0.76 Peers 0.2412936 0.2473326 0.2295802 0.2180638 0.0026454 S&P 0.188241356 0.25676207 0.183588901 0.304856911 0.215243527 Return on Shareholders' Equity* 2004-2008 * From continuing operations Return on Assets* 2004-2008 PII Peer Average (BC, WGO, HOG, ACAT, TTC) S&P 500 Average |
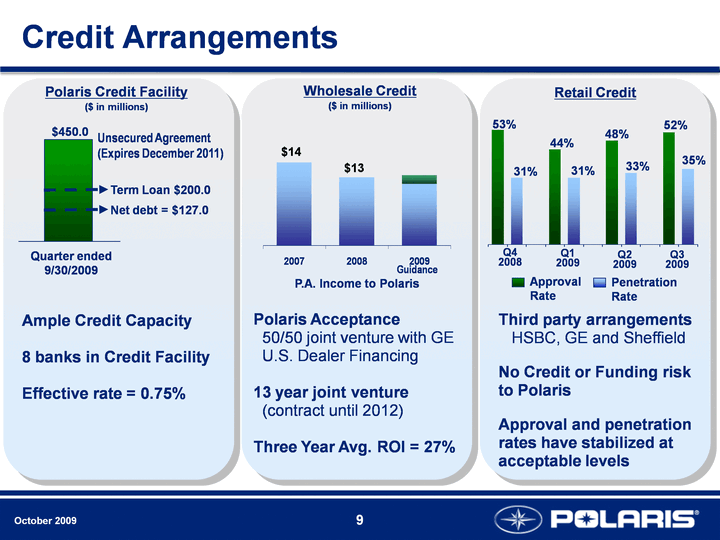
| October 2009 9 Quarter ended 9/30/2009 Polaris Credit Facility ($ in millions) Wholesale Credit ($ in millions) Retail Credit Credit Arrangements Ample Credit Capacity 8 banks in Credit Facility Effective rate = 0.75% Polaris Acceptance 50/50 joint venture with GE U.S. Dealer Financing 13 year joint venture (contract until 2012) Three Year Avg. ROI = 27% Third party arrangements HSBC, GE and Sheffield No Credit or Funding risk to Polaris Approval and penetration rates have stabilized at acceptable levels $450.0 Unsecured Agreement (Expires December 2011) Net debt = $127.0 P.A. Income to Polaris Q4 2008 Q4 2008 Q1 2009 Q1 2009 Q2 2009 Q2 2009 Q2 2009 Q2 2009 Sales 0.53 0 0.44 0 0.48 0 0.52 0.31 0.31 0.33 0.35 Penetration Rate Approval Rate 44% 31% 48% 33% 53% 31% 2007 2008 2009 East 13.9 13.2 12.9 West 0.4 North $14 $13 52% 35% Q4 2008 Q1 2009 Q2 2009 Q3 2009 Term Loan $200.0 Guidance |
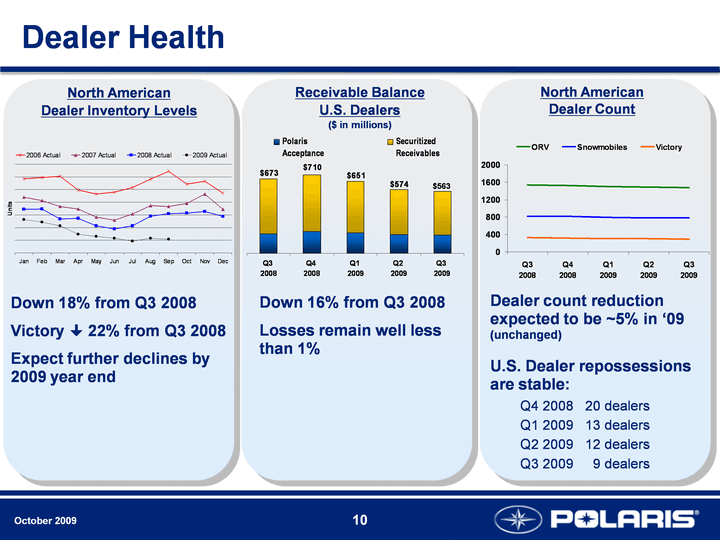
| October 2009 10 North American Dealer Inventory Levels Receivable Balance U.S. Dealers ($ in millions) North American Dealer Count Dealer Health Down 18% from Q3 2008 Victory ? 22% from Q3 2008 Expect further declines by 2009 year end Down 16% from Q3 2008 Losses remain well less than 1% Dealer count reduction expected to be ~5% in '09 (unchanged) U.S. Dealer repossessions are stable: Q4 2008 20 dealers Q1 2009 13 dealers Q2 2009 12 dealers Q3 2009 9 dealers $563 |
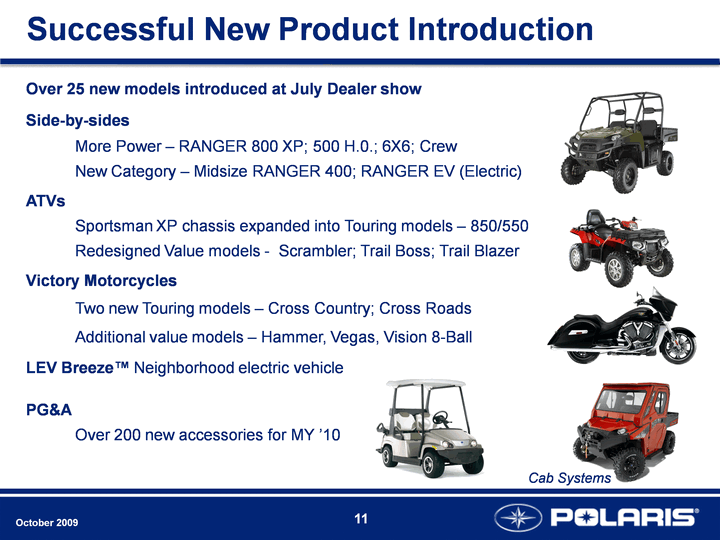
| 11 October 2009 Successful New Product Introduction Over 25 new models introduced at July Dealer show Side-by-sides More Power - RANGER 800 XP; 500 H.0.; 6X6; Crew New Category - Midsize RANGER 400; RANGER EV (Electric) ATVs Sportsman XP chassis expanded into Touring models - 850/550 Redesigned Value models - Scrambler; Trail Boss; Trail Blazer Victory Motorcycles Two new Touring models - Cross Country; Cross Roads Additional value models - Hammer, Vegas, Vision 8-Ball LEV Breeze(tm) Neighborhood electric vehicle PG&A Over 200 new accessories for MY '10 Cab Systems |
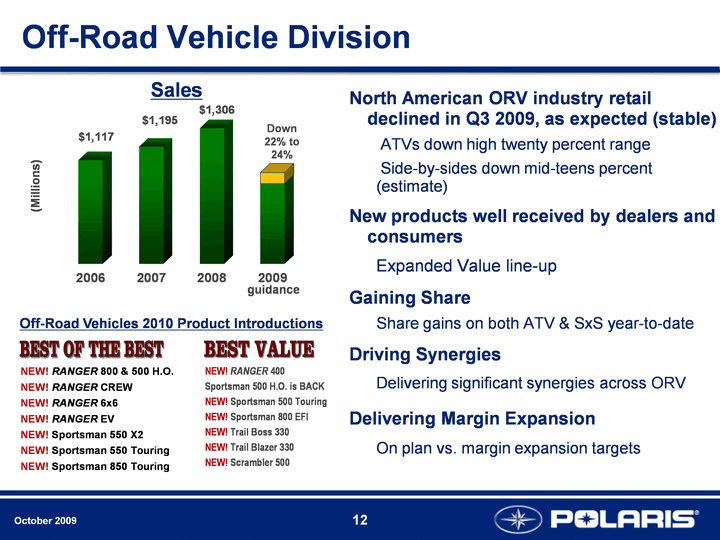
| October 2009 12 Off-Road Vehicle Division North American ORV industry retail declined in Q3 2009, as expected (stable) ATVs down high twenty percent range Side-by-sides down mid-teens percent (estimate) New products well received by dealers and consumers Expanded Value line-up Gaining Share Share gains on both ATV & SxS year-to-date Driving Synergies Delivering significant synergies across ORV Delivering Margin Expansion On plan vs. margin expansion targets Sales 2006 2007 2008 2009 2006 1117 1195 1306 980 65 (Millions) Down 22% to 24% guidance Off-Road Vehicles 2010 Product Introductions |
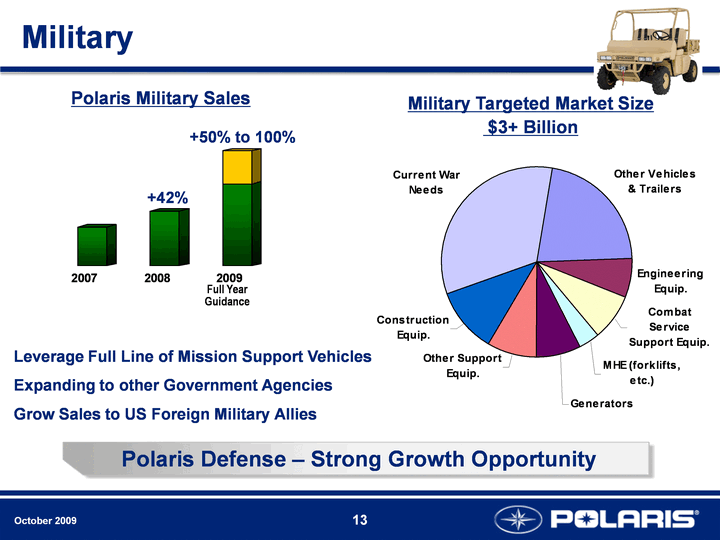
| October 2009 13 Military +42% +50% to 100% Full Year Guidance Polaris Military Sales Polaris Defense - Strong Growth Opportunity Military Targeted Market Size $3+ Billion Leverage Full Line of Mission Support Vehicles Expanding to other Government Agencies Grow Sales to US Foreign Military Allies |
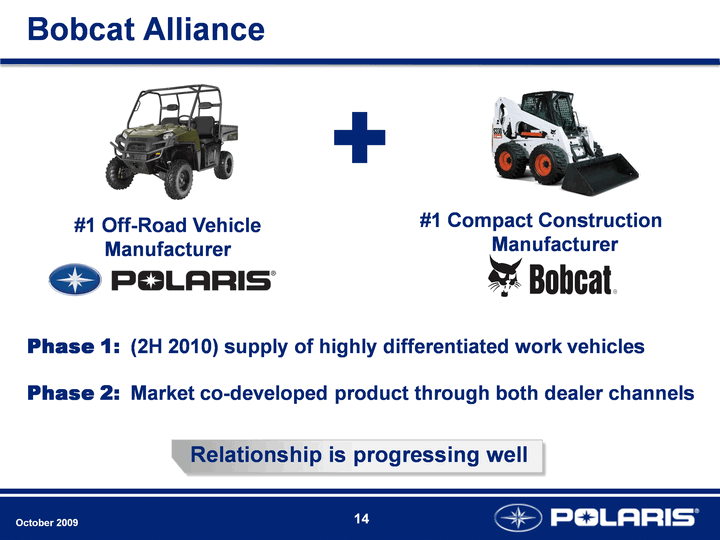
| 14 October 2009 Bobcat Alliance Phase 1: (2H 2010) supply of highly differentiated work vehicles Phase 2: Market co-developed product through both dealer channels #1 Off-Road Vehicle Manufacturer #1 Compact Construction Manufacturer + Relationship is progressing well |
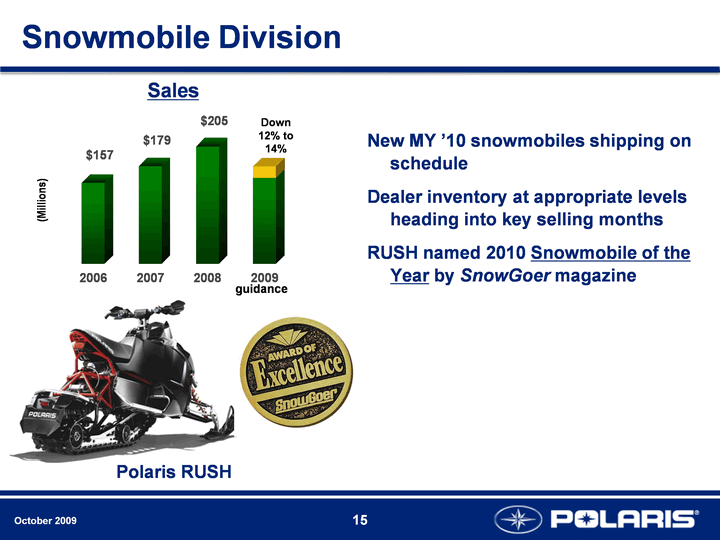
| October 2009 15 Snowmobile Division New MY '10 snowmobiles shipping on schedule Dealer inventory at appropriate levels heading into key selling months RUSH named 2010 Snowmobile of the Year by SnowGoer magazine (Millions) 2006 2007 2008 2009 2006 157 179 205 164 15 Sales guidance Down 12% to 14% Polaris RUSH |
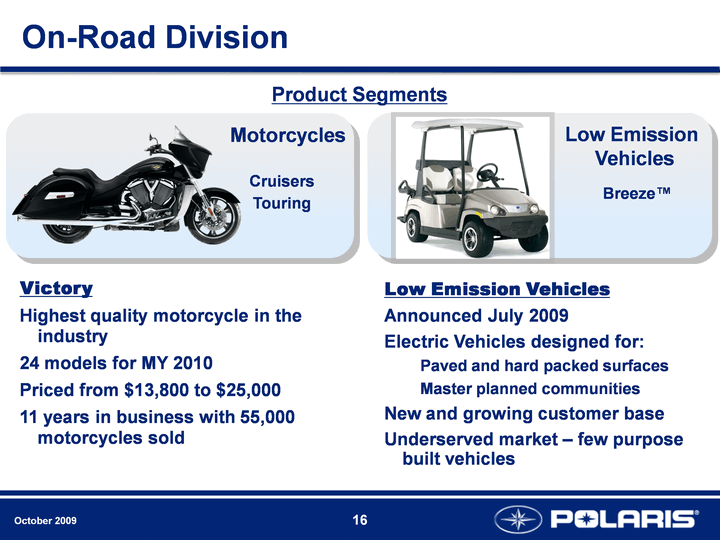
| October 2009 16 Low Emission Vehicles Motorcycles Cruisers Touring On-Road Division Product Segments Low Emission Vehicles Announced July 2009 Electric Vehicles designed for: Paved and hard packed surfaces Master planned communities New and growing customer base Underserved market - few purpose built vehicles Breeze(tm) Victory Highest quality motorcycle in the industry 24 models for MY 2010 Priced from $13,800 to $25,000 11 years in business with 55,000 motorcycles sold |

| October 2009 17 On-Road Division - Victory Motorcycles Victory retail sales weak in Q3 2009 Additional production cuts made Greater focus on accelerating retail New MY 2010 touring models well received Orders exceeded modest expectations Victory dealer inventory down 22% in Q3 2009 More progress needed with weak industry N.A. Motorcycle Industry 1400cc+ Retail sales decline slowed in Q3 through higher promotional activity. Q3 down high 20% percent range. 0% MY '10 Cross Country Touring 2006 2007 2008 2009 2006 113 113 94 45 10 Sales Down Mid-40% range guidance |
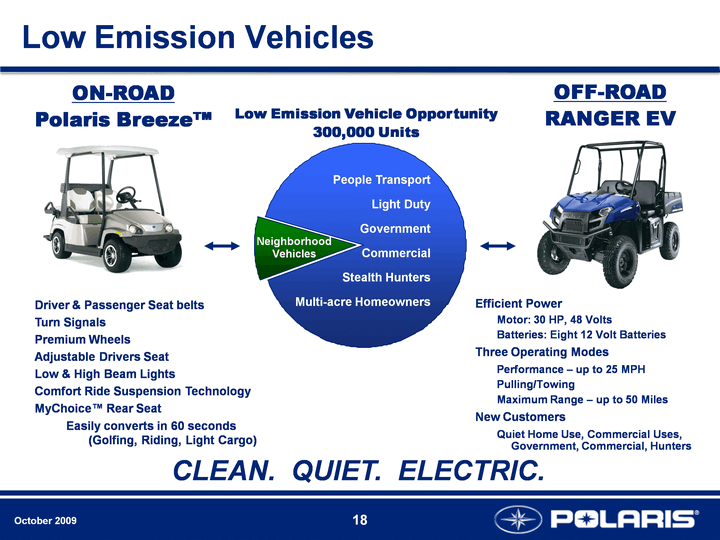
| October 2009 18 Low Emission Vehicles Neig other Q2 2009 0.1 0.9 Neighborhood Vehicles People Transport Light Duty Government Commercial Stealth Hunters Multi-acre Homeowners Driver & Passenger Seat belts Turn Signals Premium Wheels Adjustable Drivers Seat Low & High Beam Lights Comfort Ride Suspension Technology MyChoice(tm) Rear Seat Easily converts in 60 seconds (Golfing, Riding, Light Cargo) Low Emission Vehicle Opportunity 300,000 Units ON-ROAD Polaris Breeze(tm) OFF-ROAD RANGER EV Efficient Power Motor: 30 HP, 48 Volts Batteries: Eight 12 Volt Batteries Three Operating Modes Performance - up to 25 MPH Pulling/Towing Maximum Range - up to 50 Miles New Customers Quiet Home Use, Commercial Uses, Government, Commercial, Hunters CLEAN. QUIET. ELECTRIC. |
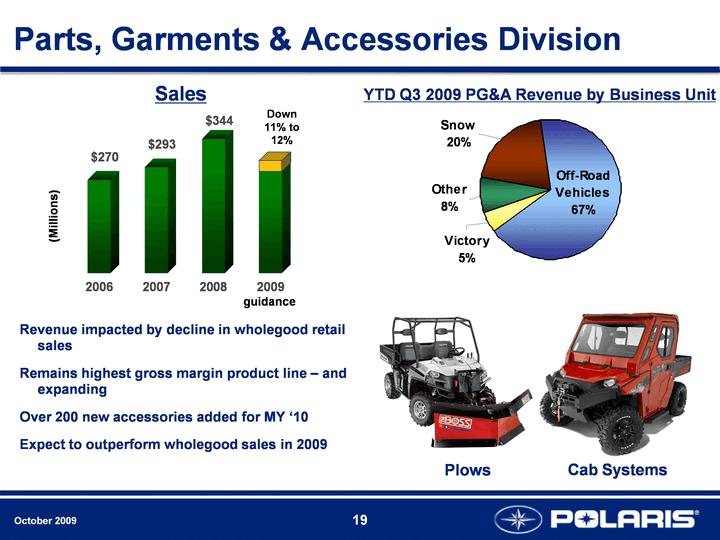
| October 2009 19 Parts, Garments & Accessories Division Revenue impacted by decline in wholegood retail sales Remains highest gross margin product line - and expanding Over 200 new accessories added for MY '10 Expect to outperform wholegood sales in 2009 (Millions) Sales 2006 2007 2008 2009 2006 270 293 344 285 20 guidance Down 11% to 12% YTD Q3 2009 PG&A Revenue by Business Unit Plows Cab Systems |
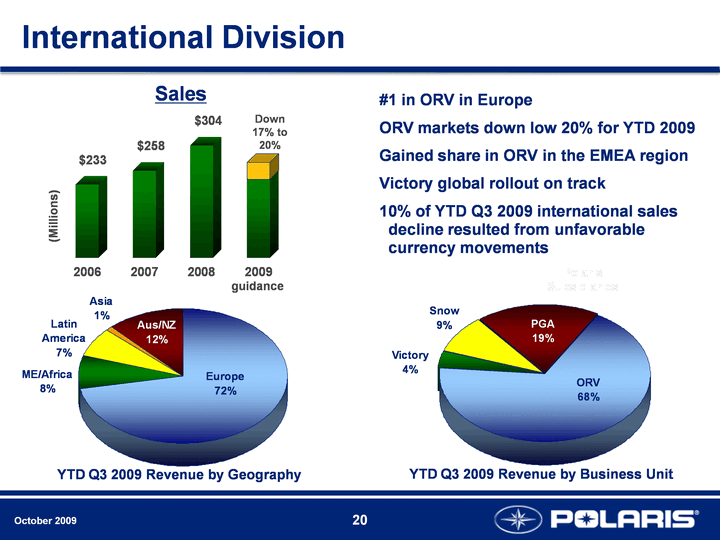
| October 2009 20 International Division Europe ME/Africa Latin America Asia Aus/NZ East 0.72 0.08 0.07 0.01 0.12 Polaris Subsidiaries Sales 2006 2007 2008 2009 2006 233 258 304 243 31 guidance Down 17% to 20% (Millions) YTD Q3 2009 Revenue by Geography YTD Q3 2009 Revenue by Business Unit #1 in ORV in Europe ORV markets down low 20% for YTD 2009 Gained share in ORV in the EMEA region Victory global rollout on track 10% of YTD Q3 2009 international sales decline resulted from unfavorable currency movements ORV Victory Snow PGA East 0.68 0.04 0.09 0.19 |
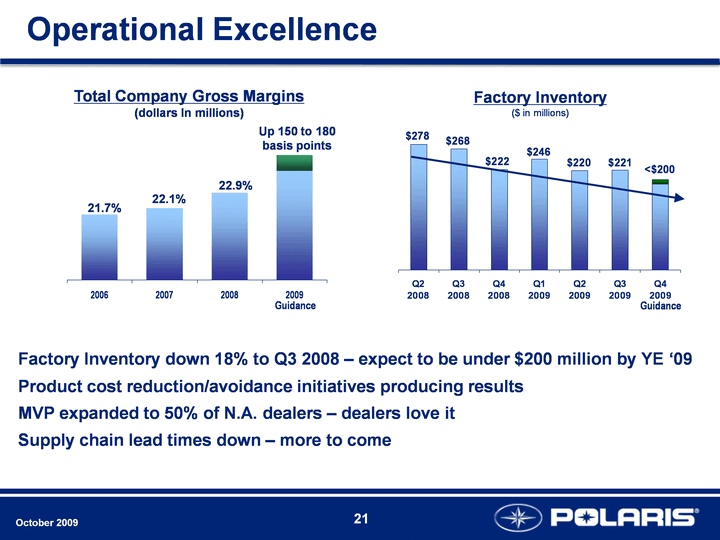
| 21 October 2009 Operational Excellence Factory Inventory down 18% to Q3 2008 - expect to be under $200 million by YE '09 Product cost reduction/avoidance initiatives producing results MVP expanded to 50% of N.A. dealers - dealers love it Supply chain lead times down - more to come Q2 2008 Q3 2008 Q4 2008 Q1 2009 Q2 2009 Q3 2009 Q4 2009 Factory Inventory 278.4 268.3 222 245.6 220 221 190 10 Factory Inventory ($ in millions) 2006 2007 2008 2009 East 21 23 28 35 West 5 North Total Company Gross Margins (dollars In millions) 21.7% 22.1% 22.9% Guidance Up 150 to 180 basis points Guidance <$200 |
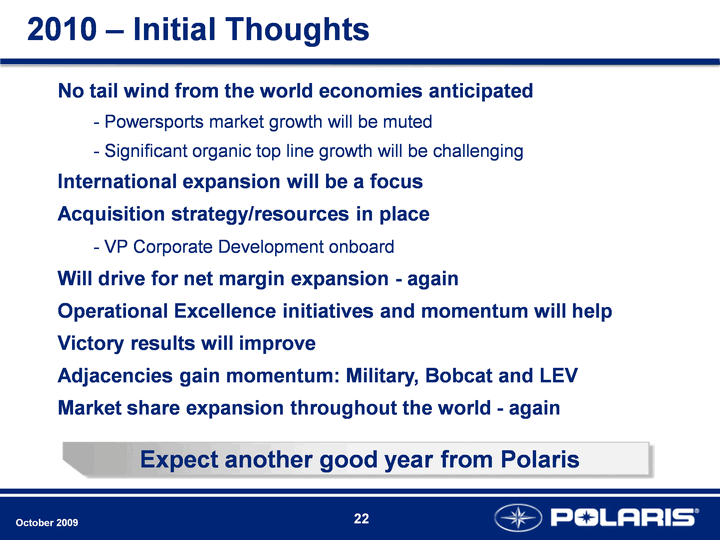
| 22 October 2009 2010 - Initial Thoughts No tail wind from the world economies anticipated Powersports market growth will be muted Significant organic top line growth will be challenging International expansion will be a focus Acquisition strategy/resources in place - VP Corporate Development onboard Will drive for net margin expansion - again Operational Excellence initiatives and momentum will help Victory results will improve Adjacencies gain momentum: Military, Bobcat and LEV Market share expansion throughout the world - again Expect another good year from Polaris |

| 23 October 2009 Polaris Industries Inc. Thank you. Q & A |
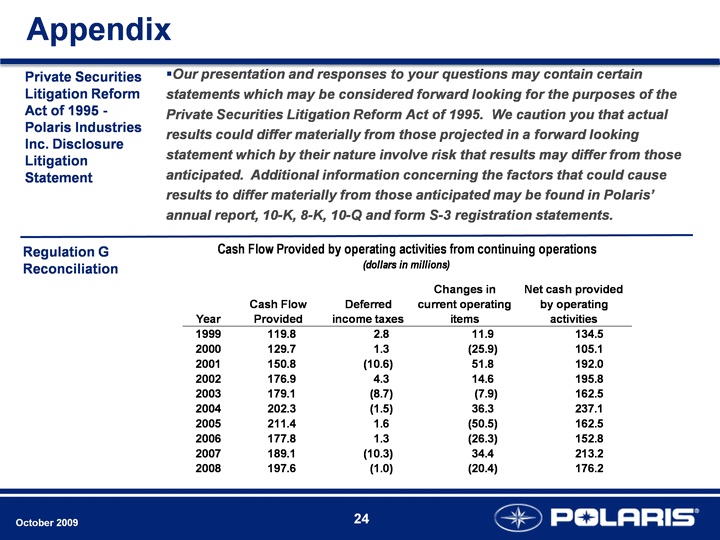
| 24 October 2009 Appendix Our presentation and responses to your questions may contain certain statements which may be considered forward looking for the purposes of the Private Securities Litigation Reform Act of 1995. We caution you that actual results could differ materially from those projected in a forward looking statement which by their nature involve risk that results may differ from those anticipated. Additional information concerning the factors that could cause results to differ materially from those anticipated may be found in Polaris' annual report, 10-K, 8-K, 10-Q and form S-3 registration statements. Regulation G Reconciliation Private Securities Litigation Reform Act of 1995 - Polaris Industries Inc. Disclosure Litigation Statement |
