Attached files
| file | filename |
|---|---|
| 8-K - POLARIS INDUSTRIES INC. 8-K - Polaris Inc. | a6073523.htm |
| EX-99.1 - EXHIBIT 99.1 - Polaris Inc. | a6073523ex99_1.htm |
Exhibit 99.2
1 Polaris Industries Inc. Third Quarter 2009 Earnings Results October 15, 2009
2 October 15, 2009 Safe Harbor Today’s presentation includes statements which should be considered forward-looking for the purposes of the private securities reform act of 1995. Additional information concerning these factors that may influence results can be found in our 2008 annual report and 2008 Form 10-K, which are on file with the SEC. The data source for retail sales figures included in this presentation is registration information provided by Polaris dealers in North America and compiled by the Company. The Company must rely on information that its dealers supply concerning retail sales, and this information is subject to revision.
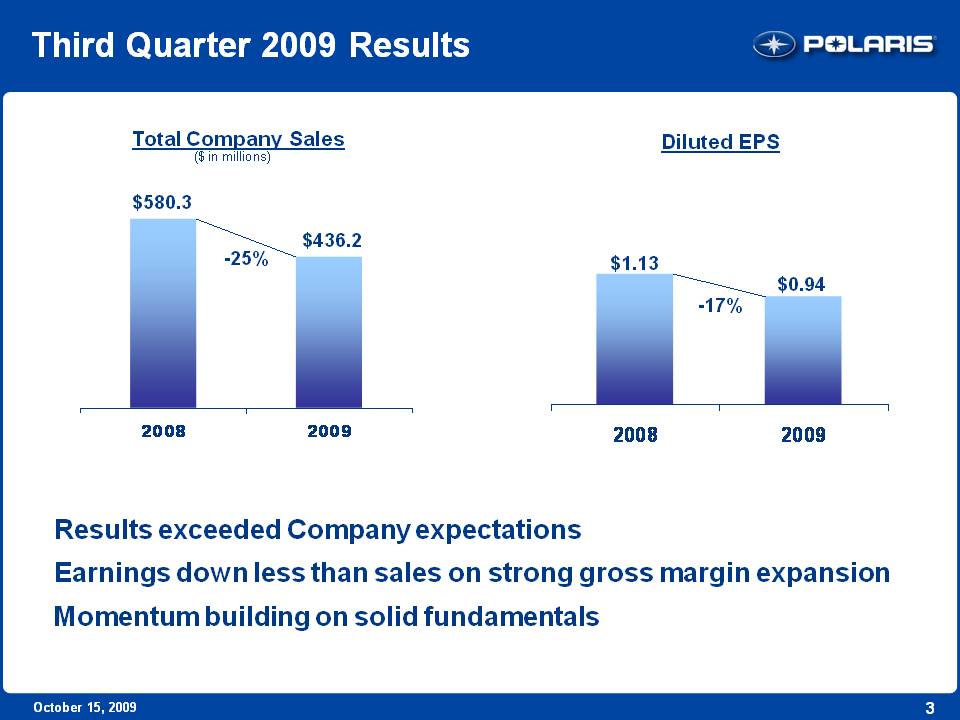
3 October 15, 2009 Third Quarter 2009 Results Results exceeded Company expectations Earnings down less than sales on strong gross margin expansion Momentum building on solid fundamentals Diluted EPS $1.13 $0.94 -17% 2008 2009 Total Company Sales ($ in millions) $580.3 $436.2 -25% 2008 2009
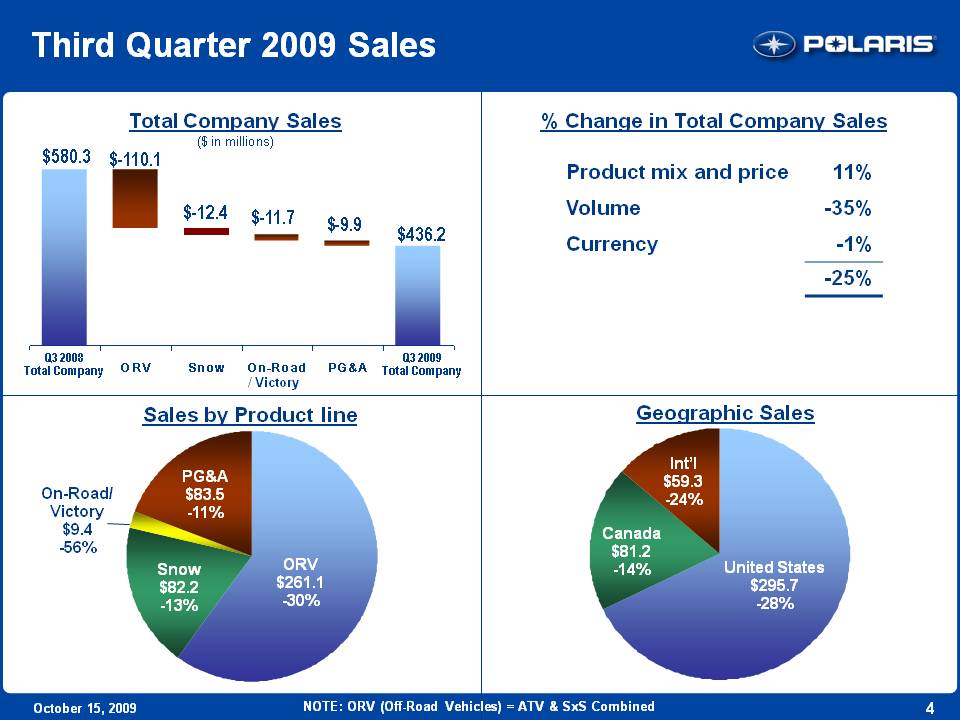
4 October 15, 2009 Third Quarter 2009 Sales Total Company Sales ($ in millions) $580.3 $-110.1 $-12.4 $-11.7 $-9.9 $436.2 Q3 2008 Total Company Q3 2009 Total Company ORV Snow On-Road/Victory PG&A % Change in Total Company Sales Product mix and price 11% Volume -35% Currency -1% -25% Geographic Sales Canada $81.2 -14% United States $295.7 -28% Int’l $59.3 -24% Sales by Product line ORV $261.1 -30% Snow $82.2 -13% PG&A $83.5 -11% On-Road/Victory $9.4 -56% NOTE: ORV (Off-Road Vehicles) = ATV & SxS Combined
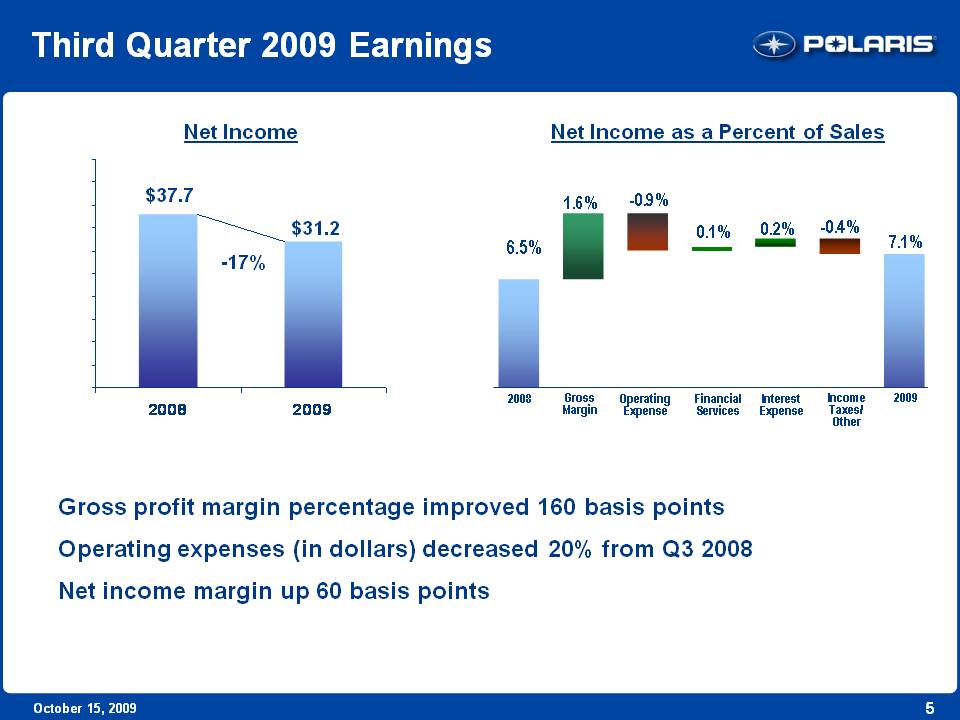
5 October 15, 2009 Third Quarter 2009 Earnings Gross profit margin percentage improved 160 basis points Operating expenses (in dollars) decreased 20% from Q3 2008 Net income margin up 60 basis points Net Income as a Percent of Sales Net Income $37.7 $31.2 -17% 2008 2009 Gross Margin Operating Expense Financial Services Interest Expense Income Taxes/Other 6.5% 1.6% -0.9% 0.1% 0.2% -0.4% 7.1% 2008 2009
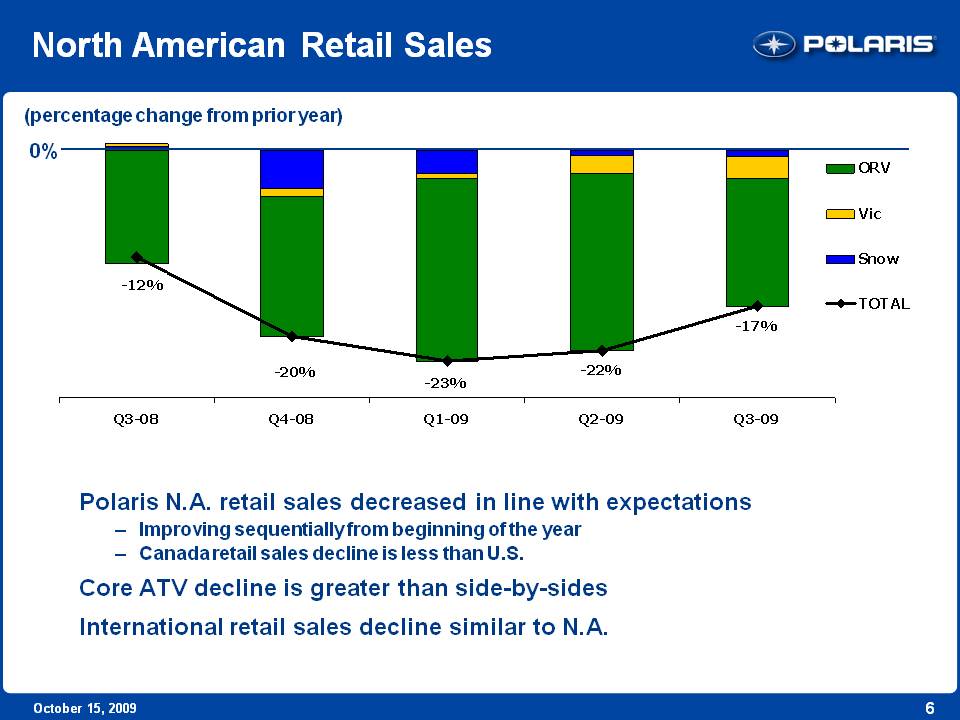
6 October 15, 2009 North American Retail Sales (percentage change from prior year) 0% -12% -20% -23% -22% -17% Q3-08 Q4-08 Q1-09 Q2-09 Q3-09 Polaris N.A. retail sales decreased in line with expectations Improving sequentially from beginning of the year Canada retail sales decline is less than U.S. Core ATV decline is greater than side-by-sides International retail sales decline similar to N.A.
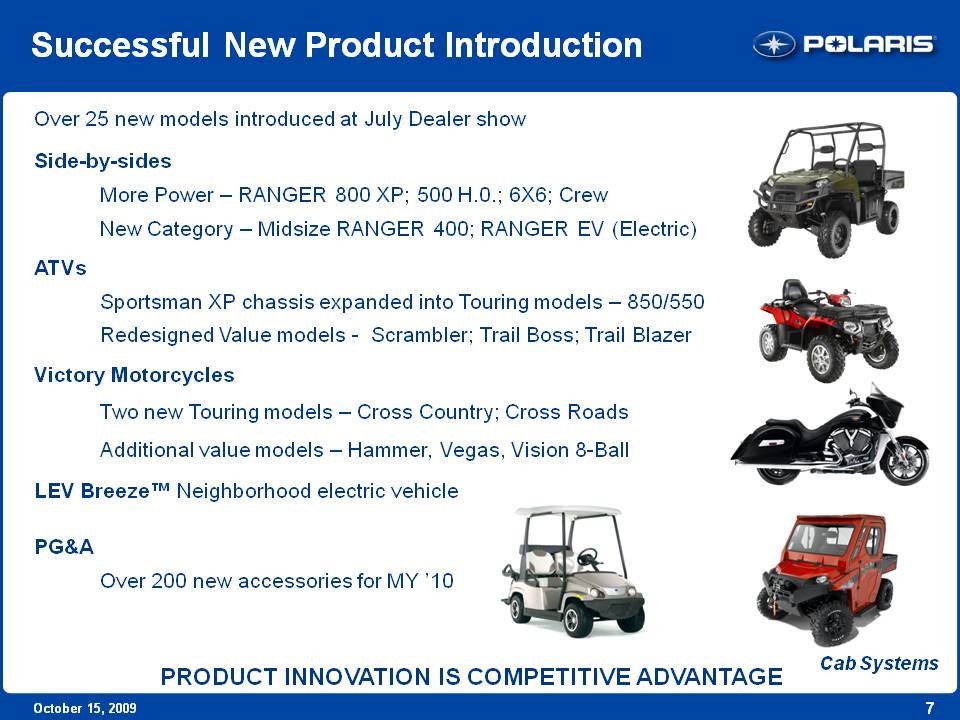
7 October 15, 2009 Successful New Product Introduction Over 25 new models introduced at July Dealer show Side-by-sides More Power – RANGER 800 XP; 500 H.0.; 6X6; Crew New Category – Midsize RANGER 400; RANGER EV (Electric) ATVs Sportsman XP chassis expanded into Touring models – 850/550 Redesigned Value models - Scrambler; Trail Boss; Trail Blazer Victory Motorcycles Two new Touring models – Cross Country; Cross Roads Additional value models – Hammer, Vegas, Vision 8-Ball LEV Breeze Neighborhood electric vehicle PG&A Over 200 new accessories for MY ’10 PRODUCT INNOVATION IS COMPETITIVE ADVANTAGE Cab Systems
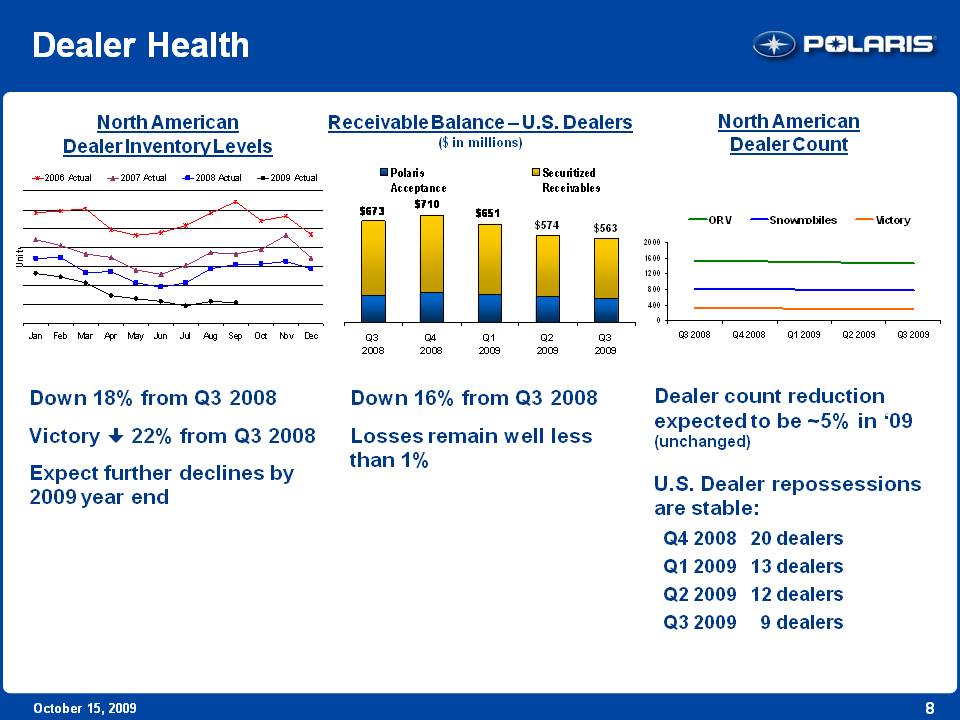
8 October 15, 2009 Dealer Health North American Dealer Inventory Levels Receivable Balance – U.S. Dealers ($ in millions) Polaris Acceptance Securitized Receivables North American Dealer Count Down 18% from Q3 2008 Victory down 22% from Q3 2008 Expect further declines by 2009 year end Down 16% from Q3 2008 Losses remain well less than 1% Dealer count reduction expected to be 5% in ‘09 (unchanged) U.S. Dealer repossessions are stable: Q4 2008 20 dealers Q1 2009 13 dealers Q2 2009 12 dealers Q3 2009 9 dealers $673 $710 $651 $574 $563 Q3 2008 Q4 2008 Q1 2009 Q2 2009 Q3 2009
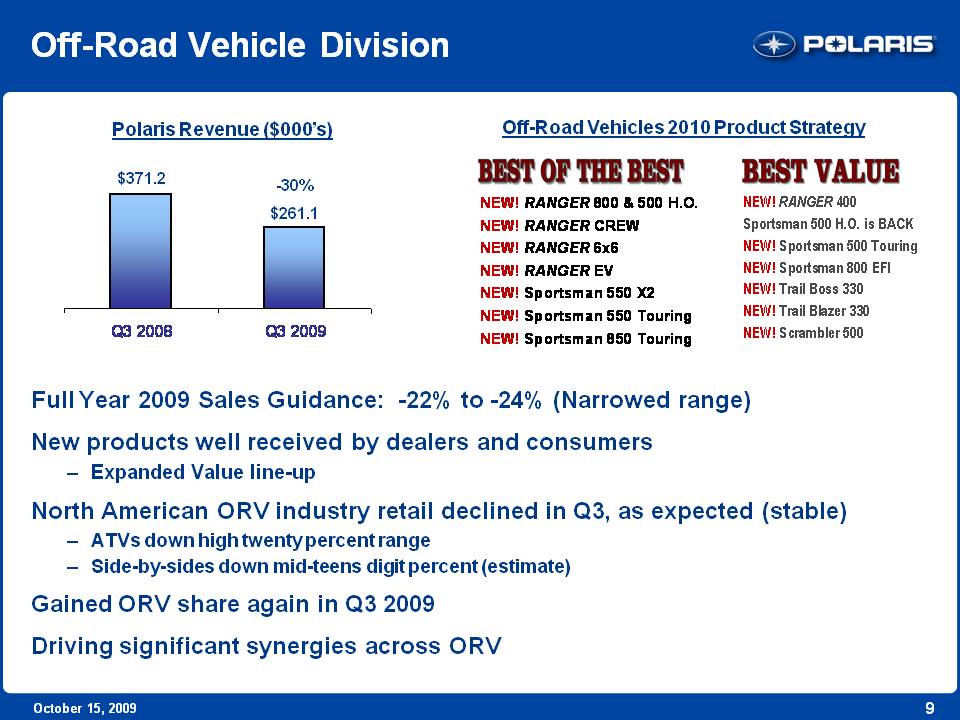
9 October 15, 2009 Off-Road Vehicle Division Polaris Revenue ($000’s) Full Year 2009 Sales Guidance: -22% to -24% (Narrowed range) New products well received by dealers and consumers Expanded Value line-up North American ORV industry retail declined in Q3, as expected (stable) ATVs down high twenty percent range Side-by-sides down mid-teens digit percent (estimate) Gained ORV share again in Q3 2009 Driving significant synergies across ORV $371.2 -30% $261.1 Q3 2008 Q3 2009 Off-Road Vehicles 2010 Product Strategy Best of the Best Best Value
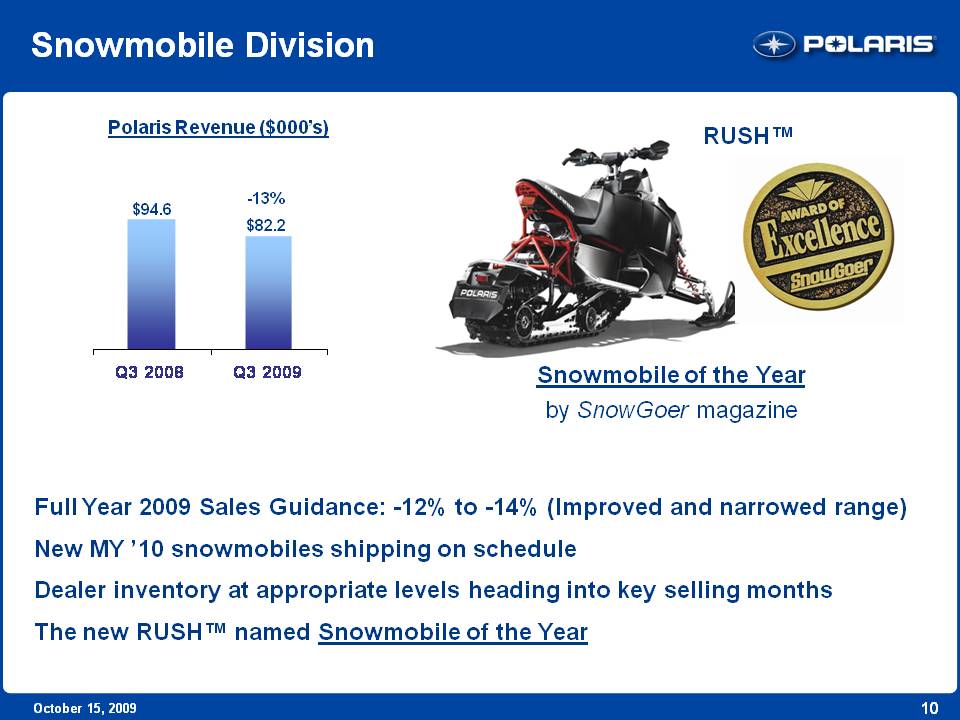
10 October 15, 2009 Snowmobile Division Polaris Revenue ($000’s) $94.6 -13% $82.2 Q3 2008 Q3 2009 Full Year 2009 Sales Guidance: -12% to -14% (Improved and narrowed range) New MY ’10 snowmobiles shipping on schedule Dealer inventory at appropriate levels heading into key selling months The new RUSH named Snowmobile of the Year Snowmobile of the Year by SnowGoer magazine RUSH
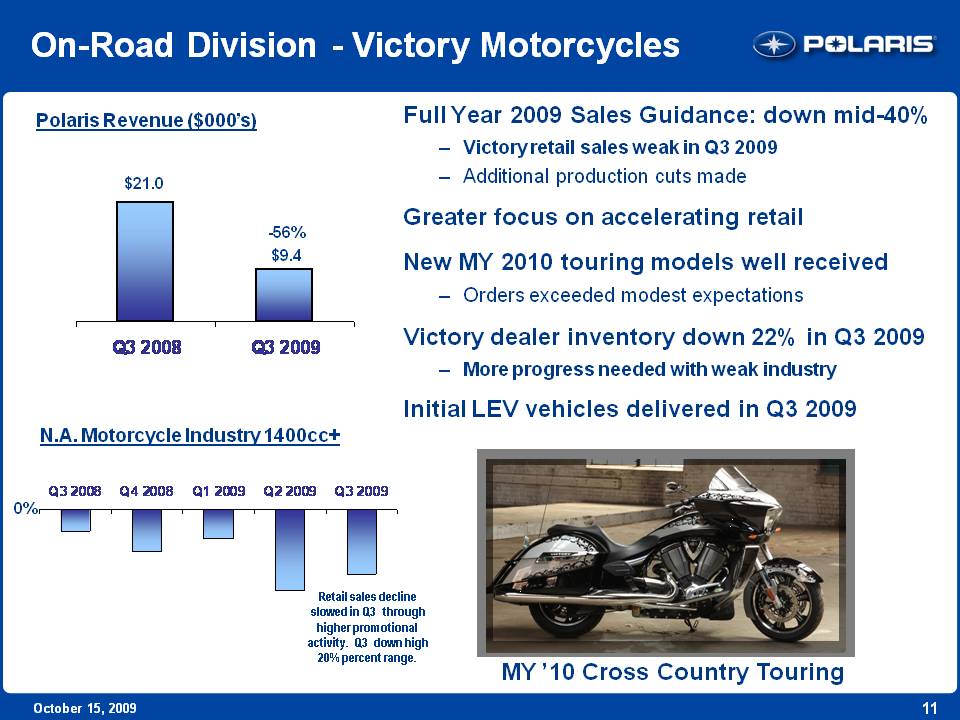
11 October 15, 2009 On-Road Division - Victory Motorcycles Polaris Revenue ($000’s) $21.0 -56% $9.4 Q3 2008 Q3 2009 Full Year 2009 Sales Guidance: down mid-40% Victory retail sales weak in Q3 2009 Additional production cuts made Greater focus on accelerating retail New MY 2010 touring models well received Orders exceeded modest expectations Victory dealer inventory down 22% in Q3 2009 More progress needed with weak industry Initial LEV vehicles delivered in Q3 2009 N.A. Motorcycle Industry 1400cc+ Retail sales decline slowed in Q3 through higher promotional activity. Q3 down high 20% percent range. Q3 2008 Q4 2008 Q1 2009 Q2 2009 Q3 2009 0% MY ’10 Cross Country Touring
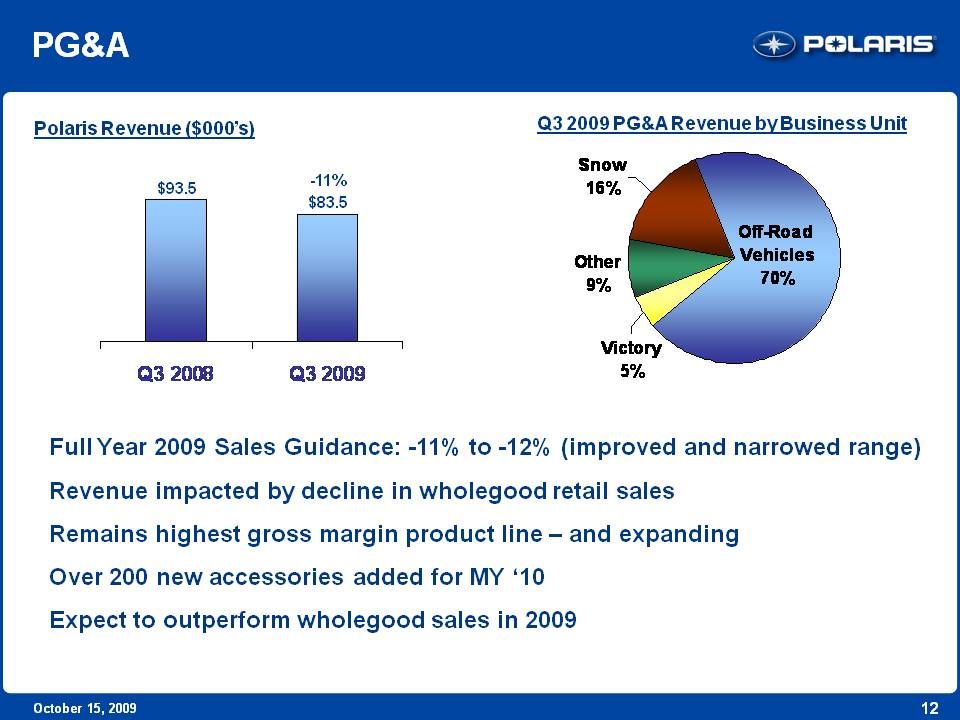
12 October 15, 2009 PG&A Polaris Revenue ($000’s) $93.5 -11% $83.5 Q3 2008 Q3 2009 Full Year 2009 Sales Guidance: -11% to -12% (improved and narrowed range) Revenue impacted by decline in wholegood retail sales Remains highest gross margin product line – and expanding Over 200 new accessories added for MY ’10 Expect to outperform wholegood sales in 2009 Q3 2009 PG&A Revenue by Business Unit Snow 16% Other 9% Victory 5% Off-Road Vehicles 70%
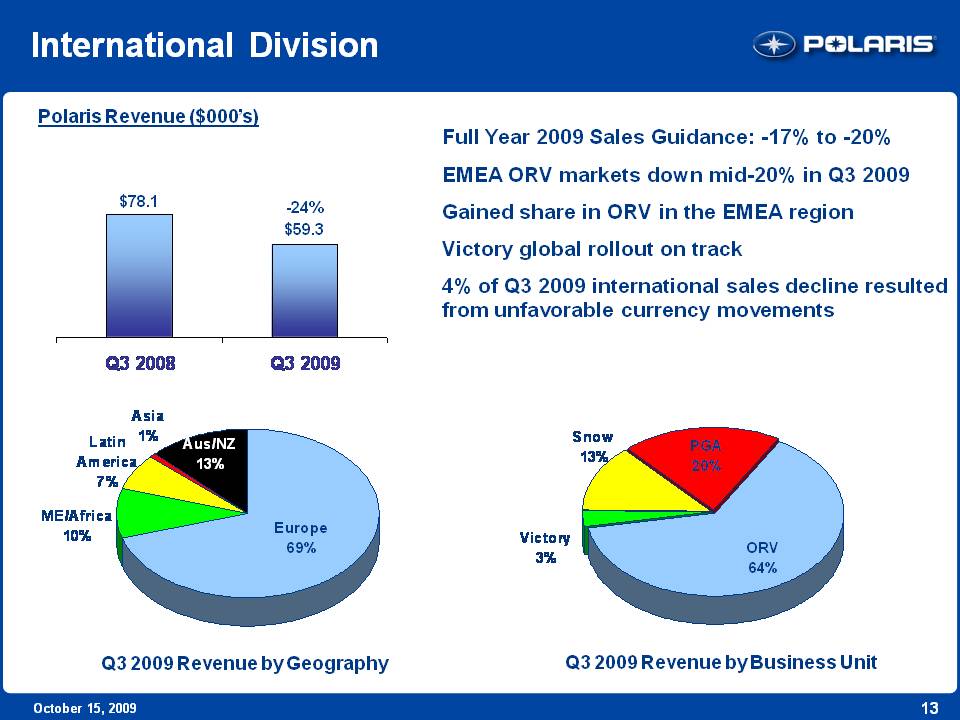
13 October 15, 2009 International Division Polaris Revenue ($000’s) $78.1 -24% $59.3 Q3 2008 Q3 2009 Q3 2009 Revenue by Geography Asia 1% Latin America 7% ME/Africa 10% Aus/NZ 13% Europe 69% Q3 2009 Revenue by Business Unit Snow 13% Victory 3% ORV 64% PGA 20% Full Year 2009 Sales Guidance: -17% to -20% EMEA ORV markets down mid-20% in Q3 2009 Gained share in ORV in the EMEA region Victory global rollout on track 4% of Q3 2009 international sales decline resulted from unfavorable currency movements
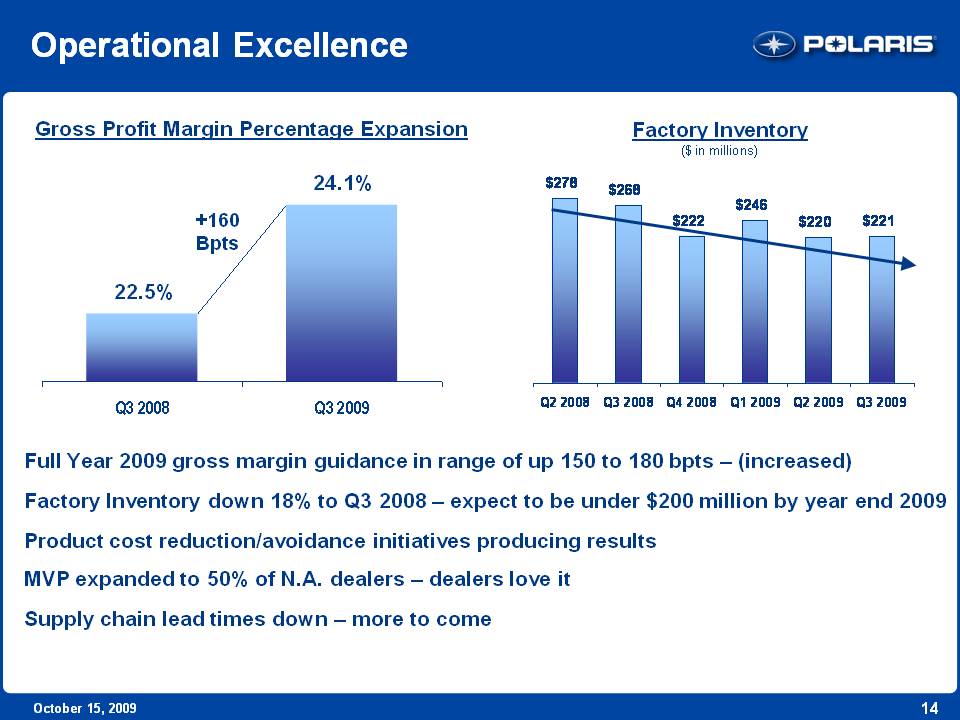
14 October 15, 2009 Operational Excellence Full Year 2009 gross margin guidance in range of up 150 to 180 bpts – (increased) Factory Inventory down 18% to Q3 2008 – expect to be under $200 million by year end 2009 Product cost reduction/avoidance initiatives producing results MVP expanded to 50% of N.A. dealers – dealers love it Supply chain lead times down – more to come Gross Profit Margin Percentage Expansion 22.5% +160 Bpts 24.1% Q3 2008 Q3 2009 Factory Inventory($ in millions) Q2 2008 Q3 2008 Q4 2008 Q1 2009 Q2 2009 Q3 2009 $278 $268 $222 $246 $220 $221
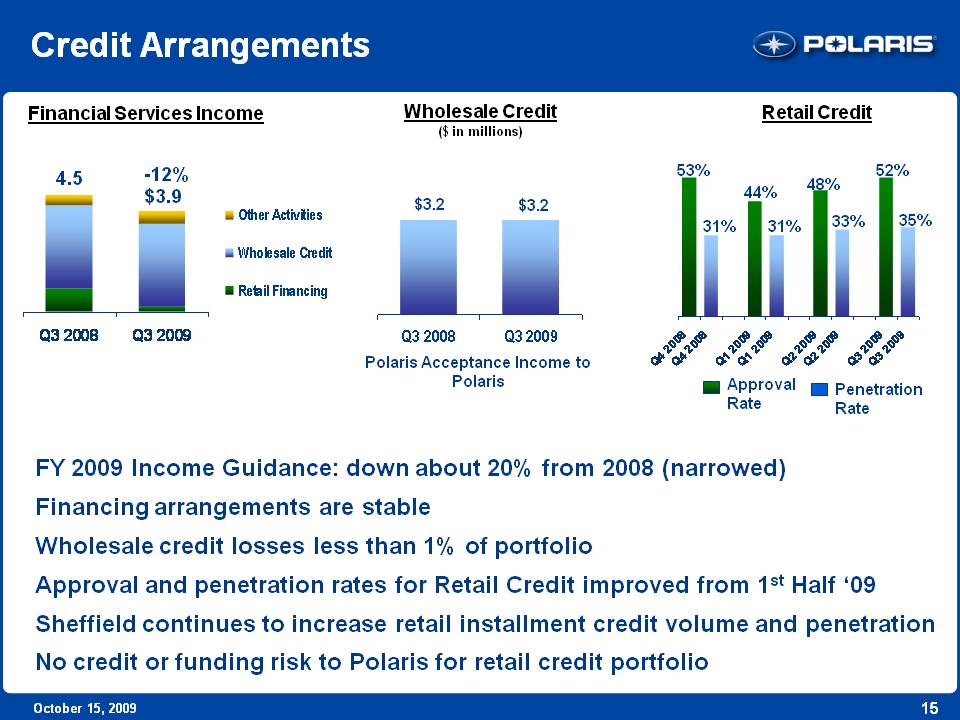
15 October 15, 2009 Credit Arrangements Financial Services Income 4.5 -12% $3.9 Q3 2008 Q3 2009 Other Activities Wholesale Credit Retail Financing Wholesale Credit ($ in millions) $3.2 $3.2 Q3 2008 Q3 2009 Polaris Acceptance Income to Polaris Retail Credit 53% 31% 44% 31% 48% 33% 52% 35% Q4 2008 Q4 2008 Q1 2009 Q1 2009 Q2 2009 Q2 2009 Q3 2009 Q3 2009 Approval Rate Penetration Rate FY 2009 Income Guidance: down about 20% from 2008 (narrowed) Financing arrangements are stable Wholesale credit losses less than 1% of portfolio Approval and penetration rates for Retail Credit improved from 1st Half ‘09 Sheffield continues to increase retail installment credit volume and penetration No credit or funding risk to Polaris for retail credit portfolio
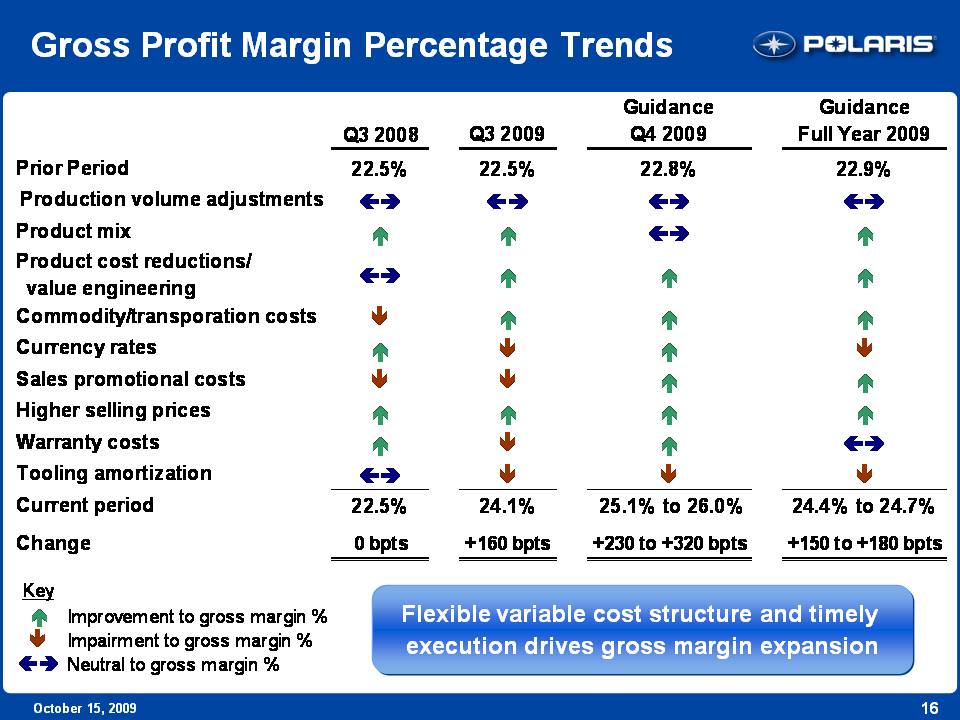
16 October 15, 2009 Gross Profit Margin Percentage Trends Prior Period Production volume adjustments Product mix Product cost reductions/value engineering Commodity/transportation costs Currency rates Sales promotional costs Higher selling prices Warranty costs Tooling amortization Current period Change Q3 2008 Q3 2009 Guidance Q4 2009 Guidance Full Year 2009 22.5% 22.5% 22.8% 22.9% 22.5% O bpts 24.1% +160 bpts 25.1% to 26.0% +230 to +320 bpts 24.4% to 24.7% +150 to +180 bpts Key Improvement to gross margin Impairment to gross margin Neutral to gross margin Flexible variable cost structure and timely execution drives gross margin expansion
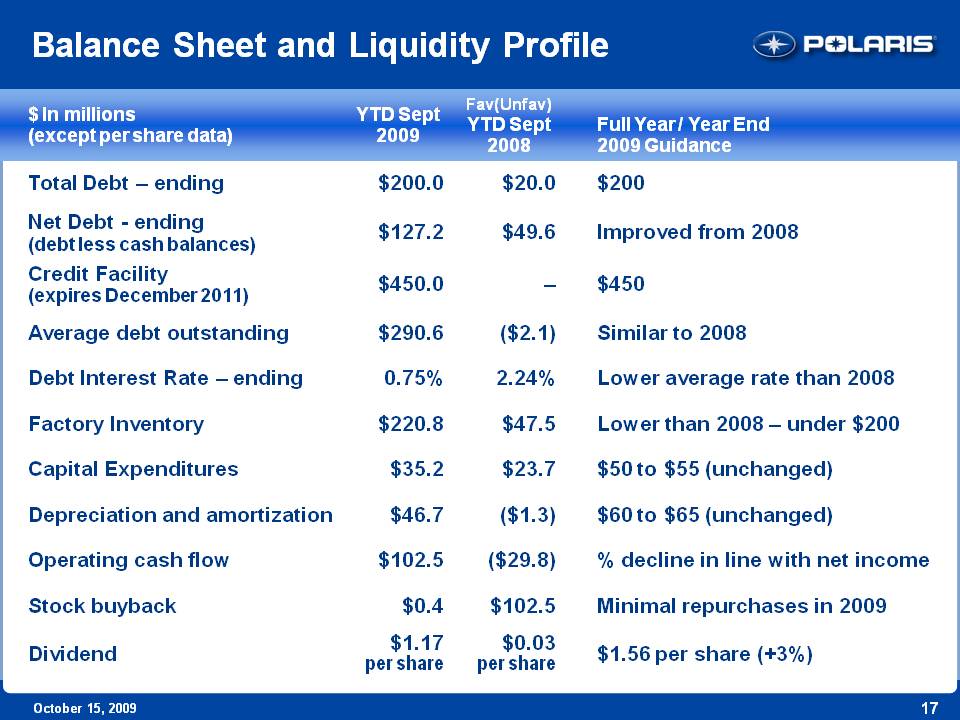
17 October 15, 2009 Balance Sheet and Liquidity Profile $ in millions (except per share data) YTD Sept 2009 Fav(Unfav) YTD Sept 2008 Full Year / Year End 2009 GuidanceTotal Debt - ending $200.0 $20.0 $200 Net Debt – ending (debt less cash balances) $127.2 $49.6 Improved from 2008 Credit Facility (expires December 2011) $450.0 - $450 Average debt outstanding $290.6 ($2.1) Similar to 2008 Debt Interest Rate – ending 0.75% 2.24% Lower average rate than 2008 Factory Inventory $220.8 $47.5 Lower than 2008 - under $200 Capital Expenditures $35.2 $23.7 $50 to $55 (unchanged) Depreciation and amortization $46.7 ($1.3) $60 to $65 (unchanged) Operating cash flow $102.5 ($29.8) % decline in line with net income Stock buyback $0.4 $102.5 Minimal repurchases in 2009 Dividend $1.17 $0.03 $1.56 per share (+3%) per share per share
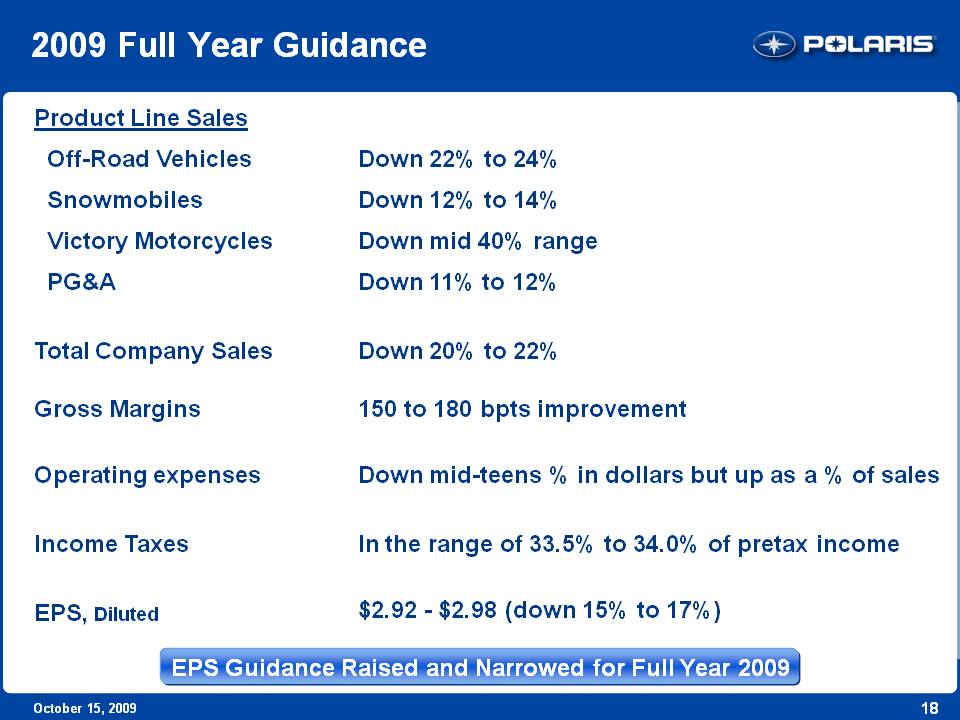
18 October 15, 2009 2009 Full Year Guidance Product Line Sales Off-Road Vehicles Down 22% to 24% Snowmobiles Down 12% to 14% Victory Motorcycles Down mid 40% range PG&A Down 11% to 12% Total Company Sales Down 20% to 22% Gross Margins 150 to 180 bpts improvement Operating expenses Down mid-teens % in dollars but up as a % of sales Income Taxes In the range of 33.5% to 34.0% of pretax income EPS, Diluted $2.92 - $2.98 (down 15% to 17%) EPS Guidance Raised and Narrowed for Full Year 2009
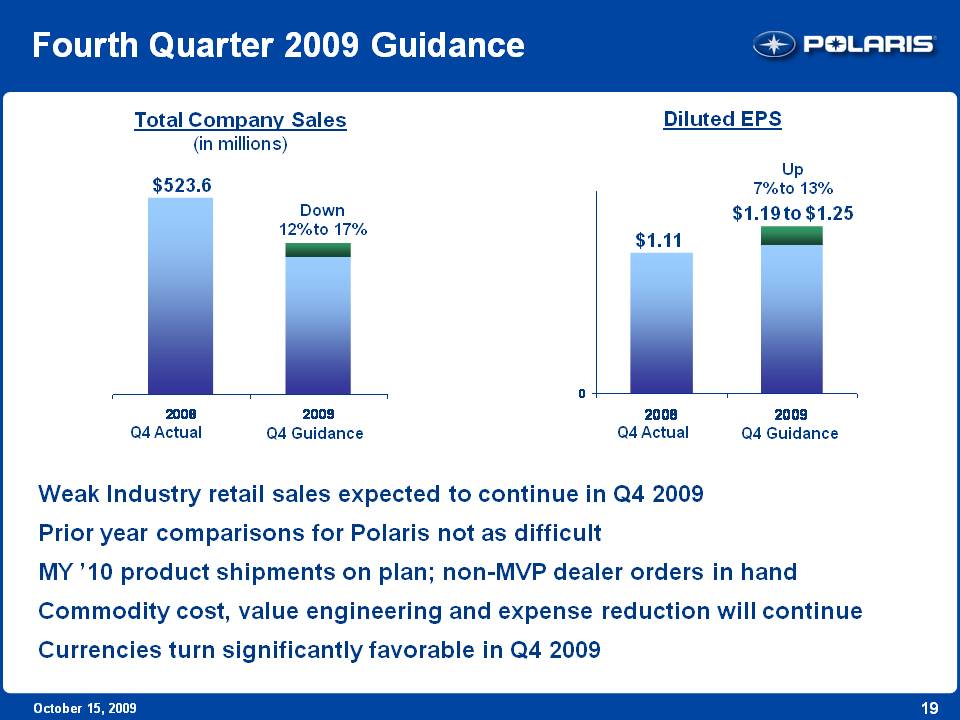
19 October 15, 2009 Fourth Quarter 2009 Guidance Total Company Sales(in millions) $523.6 Down 12% to 17% Q4 Actual 2008 Q4 Guidance 2009 Diluted EPS $1.11 $1.19 to $1.25 Up 7% to 13% Q4 Actual 2008 Q4 Guidance 2009 Weak Industry retail sales expected to continue in Q4 2009 Prior year comparisons for Polaris not as difficult MY ’10 product shipments on plan; non-MVP dealer orders in hand Commodity cost, value engineering and expense reduction will continue Currencies turn significantly favorable in Q4 2009
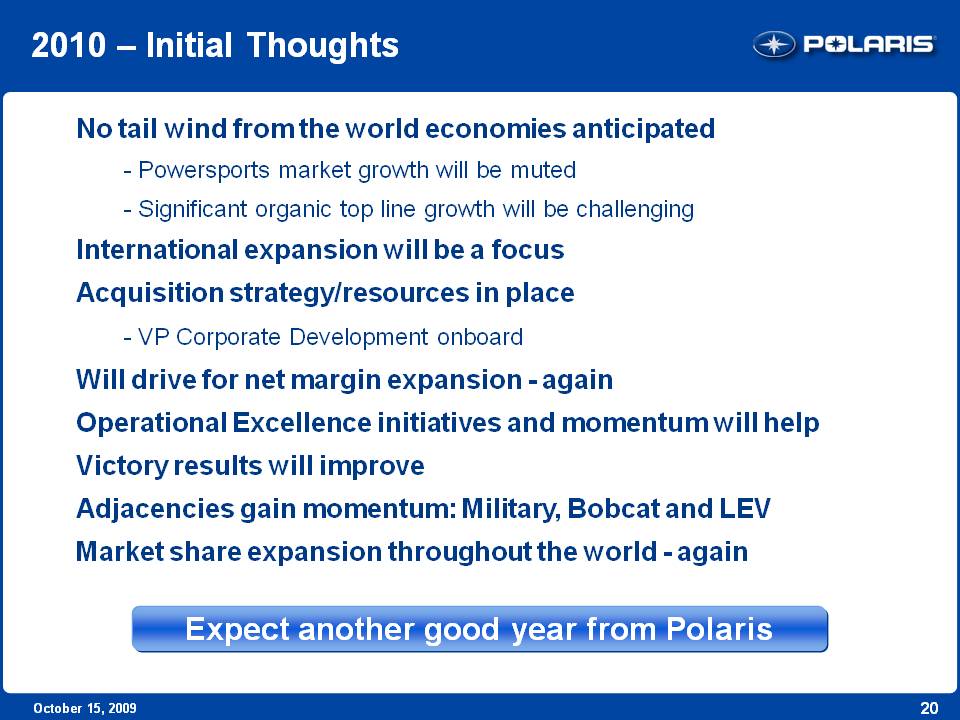
20 October 15, 2009 2010 – Initial Thoughts No tail wind from the world economies anticipated Powersports market growth will be muted Significant organic top line growth will be challenging International expansion will be a focus Acquisition strategy/resources in place - VP Corporate Development onboard Will drive for net margin expansion - again Operational Excellence initiatives and momentum will help Victory results will improve Adjacencies gain momentum: Military, Bobcat and LEV Market share expansion throughout the world - again Expect another good year from Polaris
21 October 15, 2009 Polaris Industries Inc. Thank you. Q & A