Attached files
| file | filename |
|---|---|
| 8-K/A - 8-K/A - Atlantic Capital Bancshares, Inc. | acbi-20210121x8ka.htm |
Exhibit 99.1
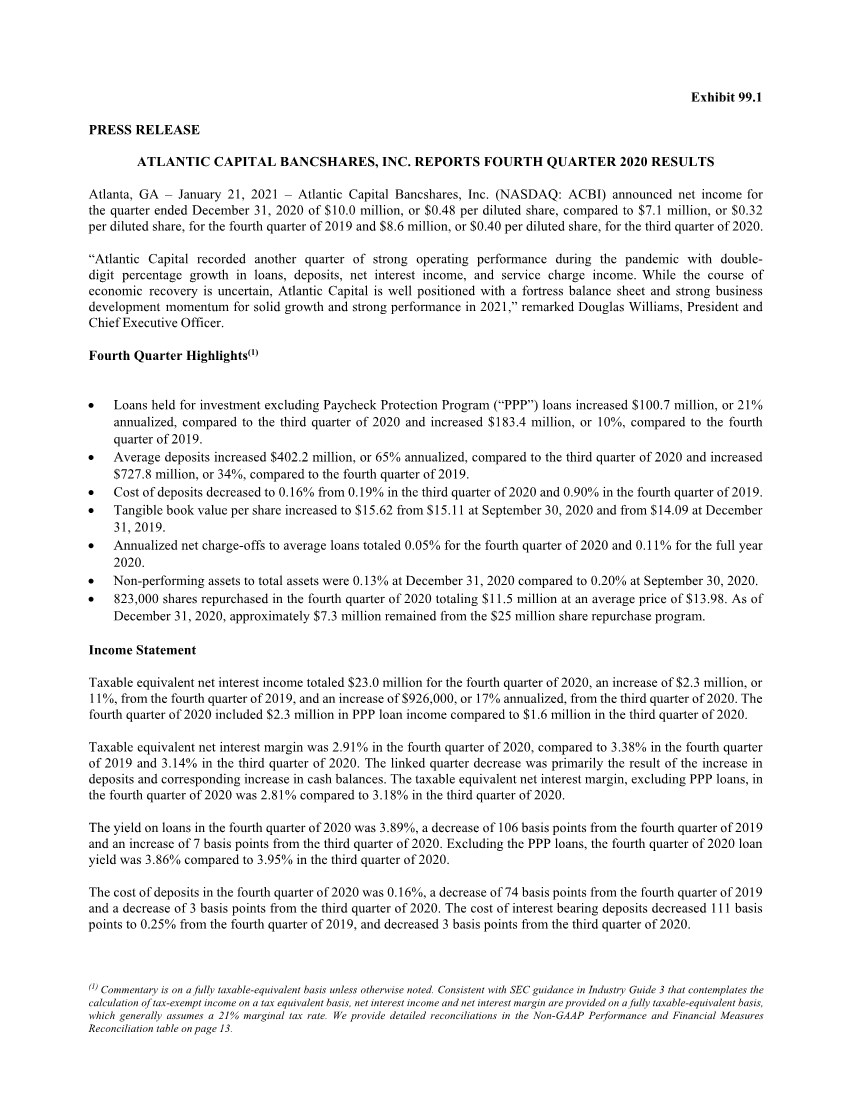
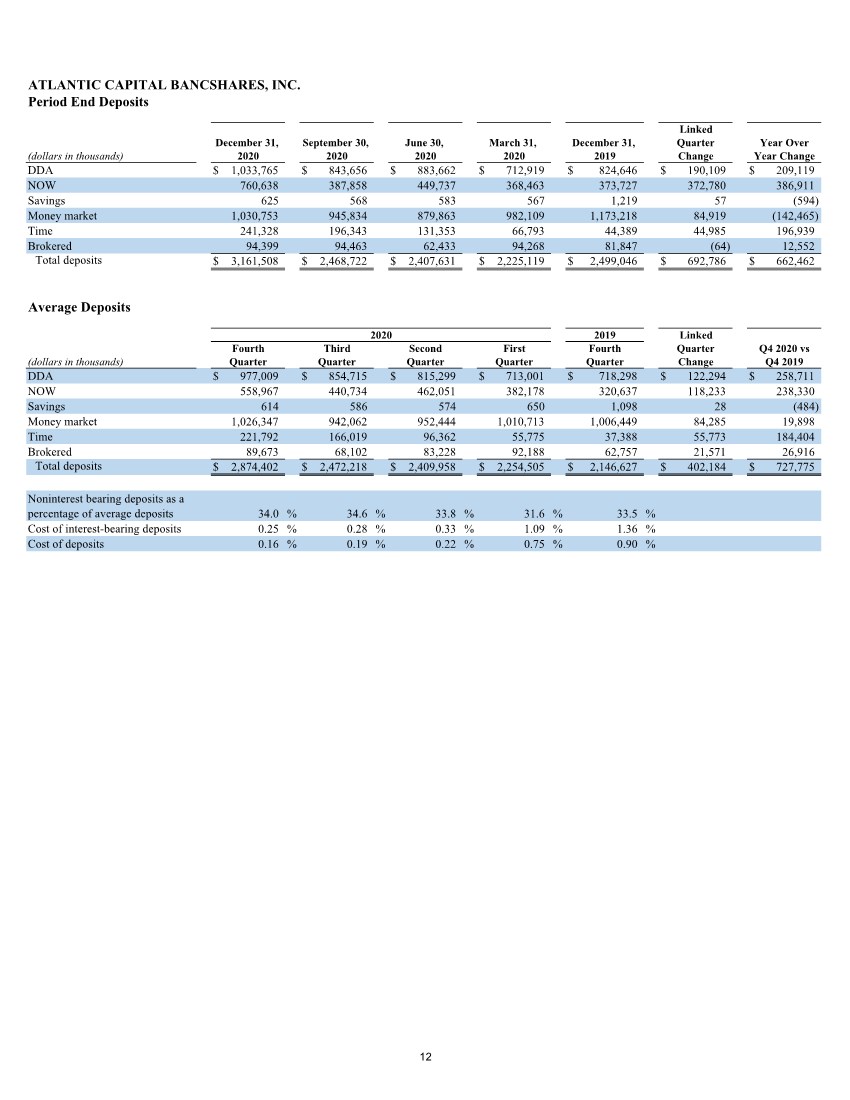
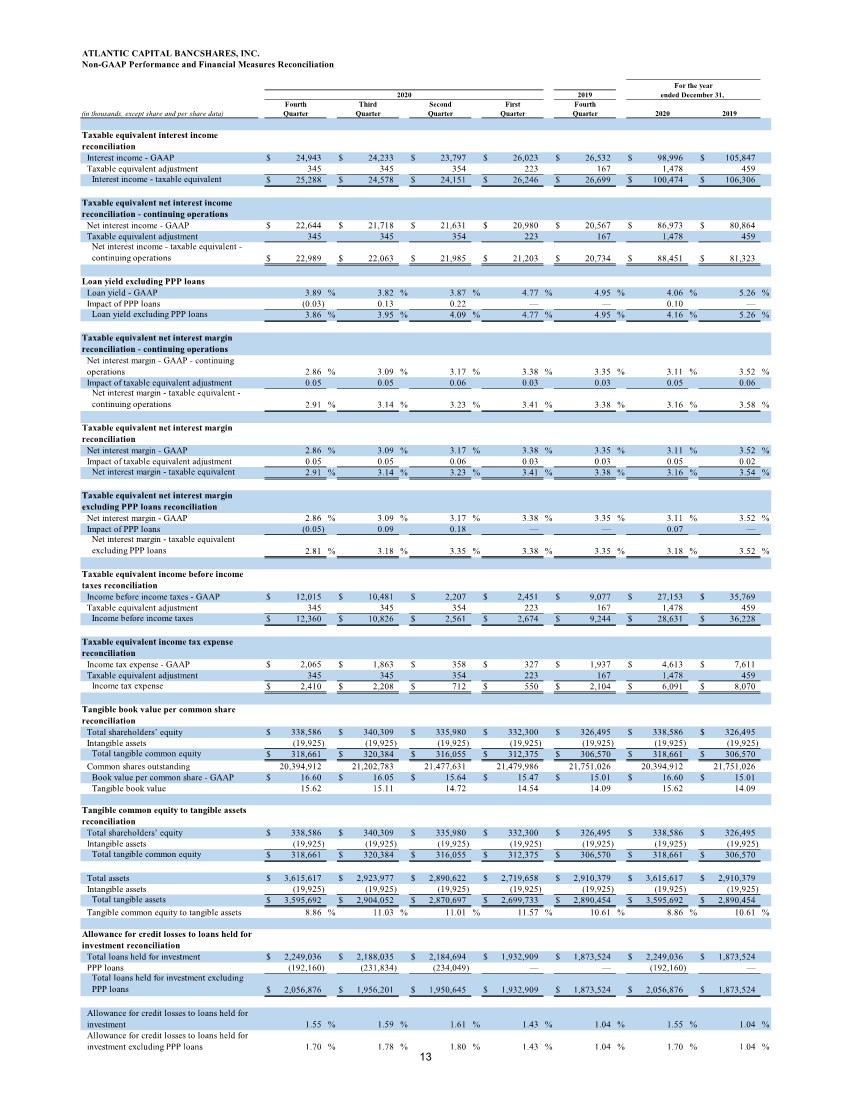
| (1) Commentary is on a fully taxable-equivalent basis unless otherwise noted. Consistent with SEC guidance in Industry Guide 3 that contemplates the calculation of tax-exempt income on a tax equivalent basis, net interest income and net interest margin are provided on a fully taxable-equivalent basis, which generally assumes a 21% marginal tax rate. We provide detailed reconciliations in the Non-GAAP Performance and Financial Measures Reconciliation table on page 13. Exhibit 99.1 PRESS RELEASE ATLANTIC CAPITAL BANCSHARES, INC. REPORTS FOURTH QUARTER 2020 RESULTS Atlanta, GA – January 21, 2021 – Atlantic Capital Bancshares, Inc. (NASDAQ: ACBI) announced net income for the quarter ended December 31, 2020 of $10.0 million, or $0.48 per diluted share, compared to $7.1 million, or $0.32 per diluted share, for the fourth quarter of 2019 and $8.6 million, or $0.40 per diluted share, for the third quarter of 2020. “Atlantic Capital recorded another quarter of strong operating performance during the pandemic with double- digit percentage growth in loans, deposits, net interest income, and service charge income. While the course of economic recovery is uncertain, Atlantic Capital is well positioned with a fortress balance sheet and strong business development momentum for solid growth and strong performance in 2021,” remarked Douglas Williams, President and Chief Executive Officer. Fourth Quarter Highlights(1) Loans held for investment excluding Paycheck Protection Program (“PPP”) loans increased $100.7 million, or 21% annualized, compared to the third quarter of 2020 and increased $183.4 million, or 10%, compared to the fourth quarter of 2019. Average deposits increased $402.2 million, or 65% annualized, compared to the third quarter of 2020 and increased $727.8 million, or 34%, compared to the fourth quarter of 2019. Cost of deposits decreased to 0.16% from 0.19% in the third quarter of 2020 and 0.90% in the fourth quarter of 2019. Tangible book value per share increased to $15.62 from $15.11 at September 30, 2020 and from $14.09 at December 31, 2019. Annualized net charge-offs to average loans totaled 0.05% for the fourth quarter of 2020 and 0.11% for the full year 2020. Non-performing assets to total assets were 0.13% at December 31, 2020 compared to 0.20% at September 30, 2020. 823,000 shares repurchased in the fourth quarter of 2020 totaling $11.5 million at an average price of $13.98. As of December 31, 2020, approximately $7.3 million remained from the $25 million share repurchase program. Income Statement Taxable equivalent net interest income totaled $23.0 million for the fourth quarter of 2020, an increase of $2.3 million, or 11%, from the fourth quarter of 2019, and an increase of $926,000, or 17% annualized, from the third quarter of 2020. The fourth quarter of 2020 included $2.3 million in PPP loan income compared to $1.6 million in the third quarter of 2020. Taxable equivalent net interest margin was 2.91% in the fourth quarter of 2020, compared to 3.38% in the fourth quarter of 2019 and 3.14% in the third quarter of 2020. The linked quarter decrease was primarily the result of the increase in deposits and corresponding increase in cash balances. The taxable equivalent net interest margin, excluding PPP loans, in the fourth quarter of 2020 was 2.81% compared to 3.18% in the third quarter of 2020. The yield on loans in the fourth quarter of 2020 was 3.89%, a decrease of 106 basis points from the fourth quarter of 2019 and an increase of 7 basis points from the third quarter of 2020. Excluding the PPP loans, the fourth quarter of 2020 loan yield was 3.86% compared to 3.95% in the third quarter of 2020. The cost of deposits in the fourth quarter of 2020 was 0.16%, a decrease of 74 basis points from the fourth quarter of 2019 and a decrease of 3 basis points from the third quarter of 2020. The cost of interest bearing deposits decreased 111 basis points to 0.25% from the fourth quarter of 2019, and decreased 3 basis points from the third quarter of 2020. |
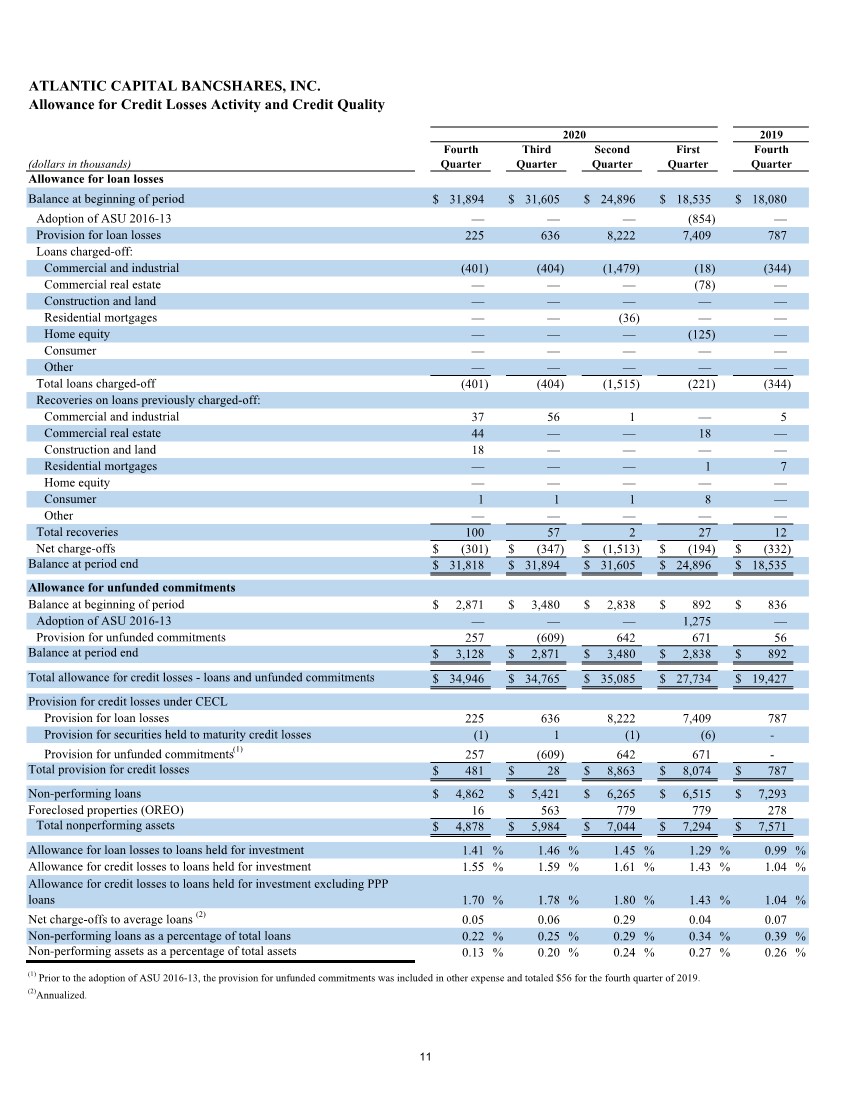
| The provision for credit losses was $481,000 in the fourth quarter of 2020 compared to $787,000 in the fourth quarter of 2019 and $28,000 in the third quarter of 2020. The fourth quarter of 2020 provision for credit losses included a $225,000 provision for loan losses and a $257,000 provision for unfunded commitments. The higher provision for unfunded commitments in the fourth quarter of 2020 was driven by an increase in the level of unfunded commitments. Noninterest income totaled $3.0 million in the fourth quarter of 2020 compared to $2.7 million in the fourth quarter of 2019 and $2.5 million in the third quarter of 2020. Service charge income in the fourth quarter of 2020 totaled $1.3 million, an increase of $343,000 compared to the fourth quarter of 2019, and an increase of $124,000 from the third quarter of 2020. The increase in service charge income was primarily due to growth in our payments and fintech businesses along with solid growth in our core treasury management business. SBA income totaled $1.0 million, an increase from $893,000 in the third quarter of 2020, primarily from higher SBA origination volume. Noninterest expense totaled $13.2 million in the fourth quarter of 2020, compared to $13.4 million in the fourth quarter of 2019 and $13.7 million in the third quarter of 2020. The $413,000 linked quarter decrease in salaries and benefits was primarily driven by an increase in loan production salary cost deferrals due to higher loan originations during the fourth quarter and a decrease in incentive compensation. In addition, other noninterest expense decreased in the fourth quarter of 2020 primarily from the recovery of $290,000 of the $470,000 in losses on customer accounts incurred during the third quarter of 2020. The 2020 effective tax rate from continuing operations was 17.0% compared to 21.3% for the full year of 2019, and was impacted by lower pretax earnings as well as increased non-taxable securities income from municipal bonds. Balance Sheet Total loans held for investment were $2.25 billion at December 31, 2020, an increase of $375.5 million, or 20.0%, from December 31, 2019 and an increase of $61.0 million, or 11% annualized, from September 30, 2020. PPP loans totaled $192.2 million at December 31, 2020, a decrease of $40.0 million compared to September 30, 2020, due to the forgiveness of PPP loans during the fourth quarter. In addition to the strong funded loan growth across most of our lines of business, total unfunded commitments increased $50.0 million, on a linked quarter basis, primarily due to strong growth in our commercial real estate business. The allowance for credit losses was 1.55% of total loans held for investment at December 31, 2020, compared to 1.59% at September 30, 2020. Excluding the impact of PPP loans, the allowance for credit losses at December 31, 2020 was 1.70% compared to 1.78% at September 30, 2020. Annualized net charge-offs were 0.05% for the fourth quarter of 2020 and 0.11% for the full year 2020. Non-performing assets totaled $4.9 million, or 0.13% of total assets, as of December 31, 2020, compared to $6.0 million, or 0.20% of total assets, as of September 30, 2020. Total average deposits were $2.87 billion for the fourth quarter of 2020, an increase of $727.8 million, or 33.9%, from the fourth quarter of 2019 and an increase of $402.2 million, or 65.1% annualized, from the third quarter of 2020. In addition to typical seasonal increases in fourth quarter deposits, we continued to see strong growth in core deposits across most of our lines of business. Noninterest bearing deposits were 34.0% of total average deposits in the fourth quarter of 2020, compared to 33.5% in the fourth quarter of 2019 and 34.6% in the third quarter of 2020. Tangible common equity to tangible assets decreased to 8.9% at December 31, 2020, compared to 11.0% September 30, 2020, due to the impact from the fourth quarter growth in deposits and its corresponding increase on the size of the year- end balance. Cash and cash equivalents were $653.4 million and total assets were $3.62 billion at December 31, 2020 compared to cash and cash equivalents of $114.0 million and total assets of $2.92 billion at September 30, 2020. Earnings Conference Call Atlantic Capital will host a conference call at 1:00 p.m. EST on Friday, January 22, 2021, to discuss the financial results for the quarter ended December 31, 2020. Individuals wishing to participate in the conference call may do so by dialing 833-685-0902 from the United States. The call will also be available live via webcast on the Investor Relations page of our website, www.atlanticcapitalbank.com. A presentation will be used during the earnings conference call and is available at https://atlanticcapitalbank.q4ir.com/news-market-data/presentations/default.aspx. 2 |

| Non-GAAP Financial Measures Statements included in this press release include non-GAAP financial measures and should be read along with the accompanying tables, which provide a reconciliation of non-GAAP financial measures to GAAP financial measures. Atlantic Capital management uses non-GAAP financial measures, including: (i) taxable equivalent interest income; (ii) taxable equivalent net interest income; (iii) loan yield excluding PPP loans; (iv) taxable equivalent net interest margin; (v) taxable equivalent net interest margin excluding PPP loans; (vi) taxable equivalent income before income taxes; (vii) taxable equivalent income tax expense; (viii) tangible assets; (ix) tangible common equity; (x) tangible book value per common share, and (xi) allowance for credit losses to loans held for investment excluding PPP loans, in our analysis of the Company's performance. Tangible common equity excludes goodwill from shareholders' equity. Management believes that non-GAAP financial measures provide a greater understanding of ongoing performance and operations, and enhance comparability with prior periods. Non-GAAP financial measures should not be considered as an alternative to any measure of performance or financial condition as determined in accordance with GAAP, and investors should consider Atlantic Capital’s performance and financial condition as reported under GAAP and all other relevant information when assessing the performance or financial condition of the Company. Non-GAAP financial measures have limitations as analytical tools, and investors should not consider them in isolation or as a substitute for analysis of the results or financial condition as reported under GAAP. Non-GAAP financial measures may not be comparable to non- GAAP financial measures presented by other companies. Forward-Looking Statements This press release contains “forward-looking statements” within the meaning of Section 27A of the Securities Act of 1933, as amended and Section 21E of the Securities Exchange Act of 1934, as amended. These forward-looking statements represent plans, estimates, objectives, goals, guidelines, expectations, intentions, projections and statements of our beliefs concerning future events, business plans, objectives, expected operating results and the assumptions upon which those statements are based. Forward-looking statements include without limitation, any statement that may predict, forecast, indicate or imply future results, performance or achievements, and are typically identified with words such as “may,” “could,” “should,” “will,” “would,” “believe,” “anticipate,” “estimate,” “project,” “expect,” “intend,” “plan,” “strive,” or words or phases of similar meaning. Forward-looking statements may include, among other things, statements about Atlantic Capital’s confidence in its strategies and its expectations about financial performance, the impact of COVID-19 on operations, market growth, market and regulatory trends and developments, acquisitions and divestitures, new technologies, services and opportunities and earnings. The forward-looking statements are based largely on Atlantic Capital’s expectations and are subject to a number of known and unknown risks and uncertainties that are subject to change based on factors which are, in many instances, beyond Atlantic Capital’s control. Atlantic Capital undertakes no obligation to publicly update any forward-looking statement to reflect developments occurring after the statement is made, except as otherwise required by law. Actual results, performance or achievements could differ materially from those contemplated, expressed, or implied by the forward-looking statements as a result of, among other factors, the risks and uncertainties described in “Risk Factors” and “Management’s Discussion and Analysis of Financial Condition and Results of Operations” in Atlantic Capital’s Annual Report on Form 10-K, as supplemented by our Current Report on Form 8-K filed on April 23, 2020, and Quarterly Reports on Form 10-Q. Please refer to the SEC’s website at www.sec.gov where you can review those documents. About Atlantic Capital Bancshares Atlantic Capital Bancshares, Inc. is a $3.6 billion publicly traded bank holding company headquartered in Atlanta, Georgia. Atlantic Capital offers commercial and not-for-profit banking services, specialty corporate financial services, private banking services and commercial real estate finance solutions to privately held companies and individuals in the Atlanta area, as well as payments and other specialized financial services for select clients nationally. 3 |
| Media Contact: Ashley Carson Email: ashley.carson@atlcapbank.com Phone: 404-995-6050 (ACB-ER) Financial Contact: Patrick Oakes Email: patrick.oakes@atlcapbank.com Phone: 404-995-6050 4 |

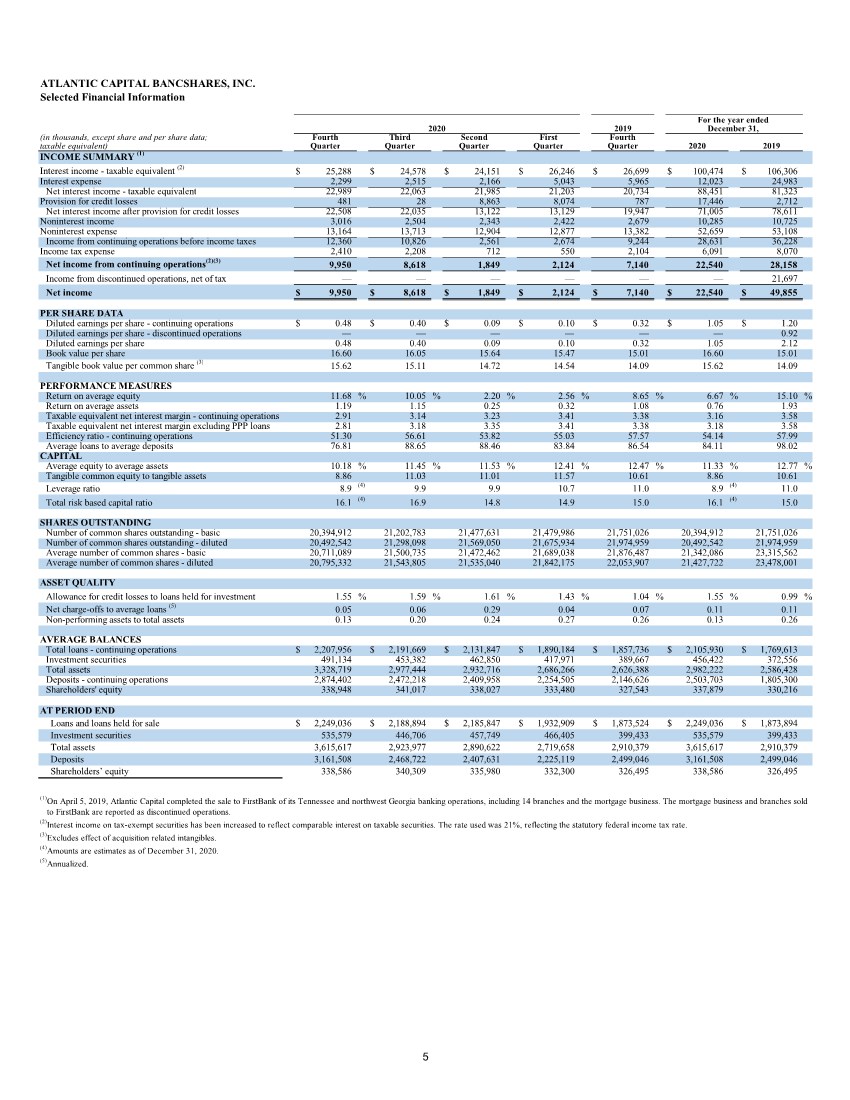
| ATLANTIC CAPITAL BANCSHARES, INC. Selected Financial Information (in thousands, except share and per share data; taxable equivalent) INCOME SUMMARY (1) Interest income - taxable equivalent (2) $ 25,288 $ 24,578 $ 24,151 $ 26,246 $ 26,699 $ 100,474 $ 106,306 Interest expense 2,299 2,515 2,166 5,043 5,965 12,023 24,983 Net interest income - taxable equivalent 22,989 22,063 21,985 21,203 20,734 88,451 81,323 Provision for credit losses 481 28 8,863 8,074 787 17,446 2,712 Net interest income after provision for credit losses 22,508 22,035 13,122 13,129 19,947 71,005 78,611 Noninterest income 3,016 2,504 2,343 2,422 2,679 10,285 10,725 Noninterest expense 13,164 13,713 12,904 12,877 13,382 52,659 53,108 Income from continuing operations before income taxes 12,360 10,826 2,561 2,674 9,244 28,631 36,228 Income tax expense 2,410 2,208 712 550 2,104 6,091 8,070 Net income from continuing operations(2)(3) 9,950 8,618 1,849 2,124 7,140 22,540 28,158 Income from discontinued operations, net of tax — — — — — — 21,697 Net income $ 9,950 $ 8,618 $ 1,849 $ 2,124 $ 7,140 $ 22,540 $ 49,855 PER SHARE DATA Diluted earnings per share - continuing operations $ 0.48 $ 0.40 $ 0.09 $ 0.10 $ 0.32 $ 1.05 $ 1.20 Diluted earnings per share - discontinued operations — — — — — — 0.92 Diluted earnings per share 0.48 0.40 0.09 0.10 0.32 1.05 2.12 Book value per share 16.60 16.05 15.64 15.47 15.01 16.60 15.01 Tangible book value per common share (3) 15.62 15.11 14.72 14.54 14.09 15.62 14.09 PERFORMANCE MEASURES Return on average equity 11.68 % 10.05 % 2.20 % 2.56 % 8.65 % 6.67 % 15.10 % Return on average assets 1.19 1.15 0.25 0.32 1.08 0.76 1.93 Taxable equivalent net interest margin - continuing operations 2.91 3.14 3.23 3.41 3.38 3.16 3.58 Taxable equivalent net interest margin excluding PPP loans 2.81 3.18 3.35 3.41 3.38 3.18 3.58 Efficiency ratio - continuing operations 51.30 56.61 53.82 55.03 57.57 54.14 57.99 Average loans to average deposits 76.81 88.65 88.46 83.84 86.54 84.11 98.02 CAPITAL Average equity to average assets 10.18 % 11.45 % 11.53 % 12.41 % 12.47 % 11.33 % 12.77 % Tangible common equity to tangible assets 8.86 11.03 11.01 11.57 10.61 8.86 10.61 Leverage ratio 8.9 (4) 9.9 9.9 10.7 11.0 8.9 (4) 11.0 Total risk based capital ratio 16.1 (4) 16.9 14.8 14.9 15.0 16.1 (4) 15.0 SHARES OUTSTANDING Number of common shares outstanding - basic 20,394,912 21,202,783 21,477,631 21,479,986 21,751,026 20,394,912 21,751,026 Number of common shares outstanding - diluted 20,492,542 21,298,098 21,569,050 21,675,934 21,974,959 20,492,542 21,974,959 Average number of common shares - basic 20,711,089 21,500,735 21,472,462 21,689,038 21,876,487 21,342,086 23,315,562 Average number of common shares - diluted 20,795,332 21,543,805 21,535,040 21,842,175 22,053,907 21,427,722 23,478,001 ASSET QUALITY Allowance for credit losses to loans held for investment 1.55 % 1.59 % 1.61 % 1.43 % 1.04 % 1.55 % 0.99 % Net charge-offs to average loans (5) 0.05 0.06 0.29 0.04 0.07 0.11 0.11 Non-performing assets to total assets 0.13 0.20 0.24 0.27 0.26 0.13 0.26 AVERAGE BALANCES Total loans - continuing operations $ 2,207,956 $ 2,191,669 $ 2,131,847 $ 1,890,184 $ 1,857,736 $ 2,105,930 $ 1,769,613 Investment securities 491,134 453,382 462,850 417,971 389,667 456,422 372,556 Total assets 3,328,719 2,977,444 2,932,716 2,686,266 2,626,388 2,982,222 2,586,428 Deposits - continuing operations 2,874,402 2,472,218 2,409,958 2,254,505 2,146,626 2,503,703 1,805,300 Shareholders' equity 338,948 341,017 338,027 333,480 327,543 337,879 330,216 AT PERIOD END Loans and loans held for sale $ 2,249,036 $ 2,188,894 $ 2,185,847 $ 1,932,909 $ 1,873,524 $ 2,249,036 $ 1,873,894 Investment securities 535,579 446,706 457,749 466,405 399,433 535,579 399,433 Total assets 3,615,617 2,923,977 2,890,622 2,719,658 2,910,379 3,615,617 2,910,379 Deposits 3,161,508 2,468,722 2,407,631 2,225,119 2,499,046 3,161,508 2,499,046 Shareholders’ equity 338,586 340,309 335,980 332,300 326,495 338,586 326,495 (1)On April 5, 2019, Atlantic Capital completed the sale to FirstBank of its Tennessee and northwest Georgia banking operations, including 14 branches and the mortgage business. The mortgage business and branches sold to FirstBank are reported as discontinued operations. (2)Interest income on tax-exempt securities has been increased to reflect comparable interest on taxable securities. The rate used was 21%, reflecting the statutory federal income tax rate. (3)Excludes effect of acquisition related intangibles. (4)Amounts are estimates as of December 31, 2020. (5)Annualized. December 31, Fourth Third First For the year ended 2019 2020 2020 2019 Quarter Quarter Quarter Quarter Second Quarter Fourth 5 |
| ATLANTIC CAPITAL BANCSHARES, INC. Consolidated Balance Sheets (unaudited) (in thousands, except share data) ASSETS Cash and due from banks $ 16,865 $ 22,715 $ 45,249 Interest-bearing deposits in banks 636,537 91,243 421,079 Cash and cash equivalents 653,402 113,958 466,328 Investment securities available for sale 335,423 260,884 282,461 Investment securities held to maturity, net of allowance for credit losses of $14 and $15 at December 31, 2020 and September 30, 2020, respectively 200,156 185,822 116,972 Other investments 25,892 26,315 27,556 Loans held for sale — 859 370 Loans held for investment 2,249,036 2,188,035 1,873,524 Less: allowance for loan losses (31,818) (31,894) (18,535) Loans held for investment, net 2,217,218 2,156,141 1,854,989 Premises and equipment, net 21,589 22,558 22,536 Bank owned life insurance 72,856 67,489 66,421 Goodwill 19,925 19,925 19,925 Other intangibles, net 2,731 2,685 3,027 Other real estate owned 16 563 278 Other assets 66,409 66,778 49,516 Total assets $ 3,615,617 $ 2,923,977 $ 2,910,379 LIABILITIES AND SHAREHOLDERS’ EQUITY Deposits: Noninterest-bearing demand $ 1,033,765 $ 843,656 $ 824,646 Interest-bearing checking 760,638 387,858 373,727 Savings 625 568 1,219 Money market 1,030,753 945,834 1,173,218 Time 241,328 196,343 44,389 Brokered deposits 94,399 94,463 81,847 Total deposits 3,161,508 2,468,722 2,499,046 Long-term debt 73,807 73,814 49,873 Other liabilities 41,716 41,132 34,965 Total liabilities 3,277,031 2,583,668 2,583,884 SHAREHOLDERS’ EQUITY Preferred stock, no par value; 10,000,000 shares authorized; no shares issued and outstanding as of December 31, 2020, September 30, 2020 and December 31, 2019 — — — Common stock, no par value; 100,000,000 shares authorized; 20,394,912, 21,202,783, and 21,751,026 shares issued and outstanding as of December 31, 2020, September 30, 2020 and December 31, 2019, respectively 209,942 220,643 230,265 Retained earnings 114,137 104,188 91,669 Accumulated other comprehensive income 14,507 15,478 4,561 Total shareholders’ equity 338,586 340,309 326,495 TOTAL LIABILITIES AND SHAREHOLDERS’ EQUITY $ 3,615,617 $ 2,923,977 $ 2,910,379 December 31, 2020 December 31, 2019 September 30, 2020 6 |

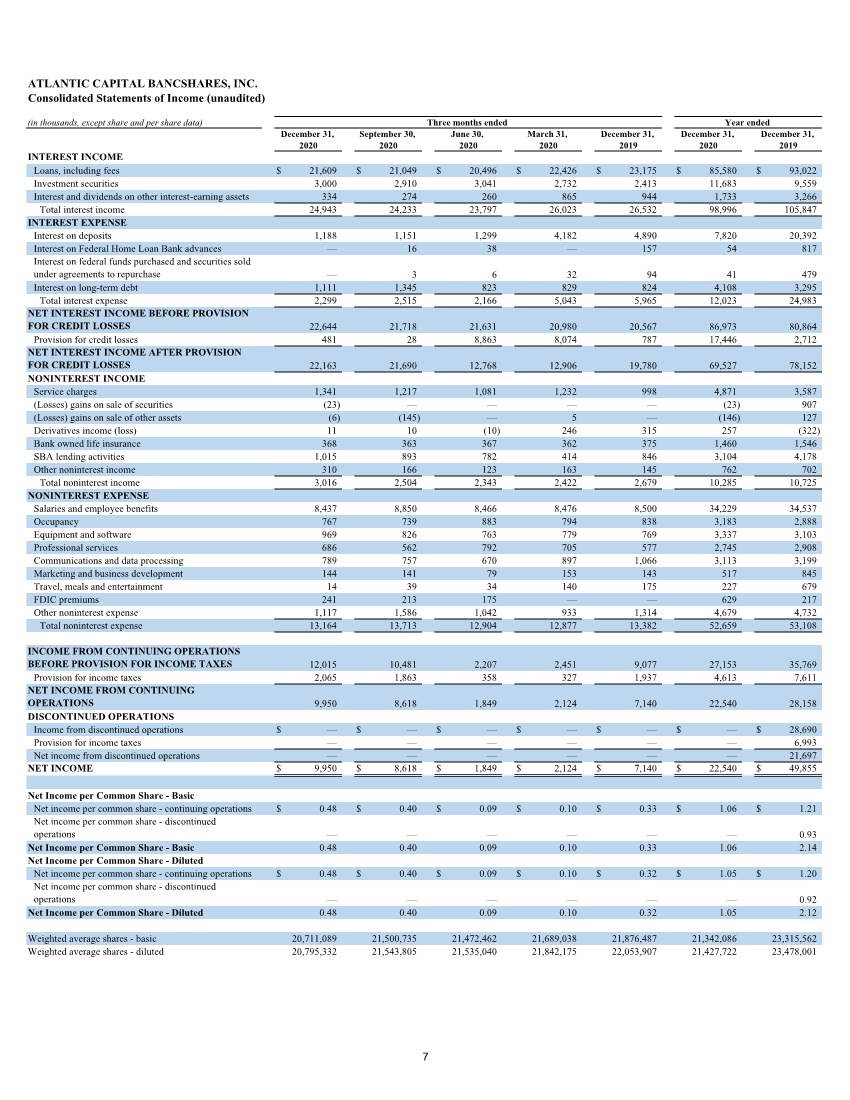
| ATLANTIC CAPITAL BANCSHARES, INC. Consolidated Statements of Income (unaudited) (in thousands, except share and per share data) INTEREST INCOME Loans, including fees $ 21,609 $ 21,049 $ 20,496 $ 22,426 $ 23,175 $ 85,580 $ 93,022 Investment securities 3,000 2,910 3,041 2,732 2,413 11,683 9,559 Interest and dividends on other interest‑earning assets 334 274 260 865 944 1,733 3,266 Total interest income 24,943 24,233 23,797 26,023 26,532 98,996 105,847 INTEREST EXPENSE Interest on deposits 1,188 1,151 1,299 4,182 4,890 7,820 20,392 Interest on Federal Home Loan Bank advances — 16 38 — 157 54 817 Interest on federal funds purchased and securities sold under agreements to repurchase — 3 6 32 94 41 479 Interest on long-term debt 1,111 1,345 823 829 824 4,108 3,295 Total interest expense 2,299 2,515 2,166 5,043 5,965 12,023 24,983 NET INTEREST INCOME BEFORE PROVISION FOR CREDIT LOSSES 22,644 21,718 21,631 20,980 20,567 86,973 80,864 Provision for credit losses 481 28 8,863 8,074 787 17,446 2,712 NET INTEREST INCOME AFTER PROVISION FOR CREDIT LOSSES 22,163 21,690 12,768 12,906 19,780 69,527 78,152 NONINTEREST INCOME Service charges 1,341 1,217 1,081 1,232 998 4,871 3,587 (Losses) gains on sale of securities (23) — — — — (23) 907 (Losses) gains on sale of other assets (6) (145) — 5 — (146) 127 Derivatives income (loss) 11 10 (10) 246 315 257 (322) Bank owned life insurance 368 363 367 362 375 1,460 1,546 SBA lending activities 1,015 893 782 414 846 3,104 4,178 Other noninterest income 310 166 123 163 145 762 702 Total noninterest income 3,016 2,504 2,343 2,422 2,679 10,285 10,725 NONINTEREST EXPENSE Salaries and employee benefits 8,437 8,850 8,466 8,476 8,500 34,229 34,537 Occupancy 767 739 883 794 838 3,183 2,888 Equipment and software 969 826 763 779 769 3,337 3,103 Professional services 686 562 792 705 577 2,745 2,908 Communications and data processing 789 757 670 897 1,066 3,113 3,199 Marketing and business development 144 141 79 153 143 517 845 Travel, meals and entertainment 14 39 34 140 175 227 679 FDIC premiums 241 213 175 — — 629 217 Other noninterest expense 1,117 1,586 1,042 933 1,314 4,679 4,732 Total noninterest expense 13,164 13,713 12,904 12,877 13,382 52,659 53,108 INCOME FROM CONTINUING OPERATIONS BEFORE PROVISION FOR INCOME TAXES 12,015 10,481 2,207 2,451 9,077 27,153 35,769 Provision for income taxes 2,065 1,863 358 327 1,937 4,613 7,611 NET INCOME FROM CONTINUING OPERATIONS 9,950 8,618 1,849 2,124 7,140 22,540 28,158 DISCONTINUED OPERATIONS Income from discontinued operations $ — $ — $ — $ — $ — $ — $ 28,690 Provision for income taxes — — — — — — 6,993 Net income from discontinued operations — — — — — — 21,697 NET INCOME $ 9,950 $ 8,618 $ 1,849 $ 2,124 $ 7,140 $ 22,540 $ 49,855 Net Income per Common Share - Basic Net income per common share - continuing operations $ 0.48 $ 0.40 $ 0.09 $ 0.10 $ 0.33 $ 1.06 $ 1.21 Net income per common share - discontinued operations — — — — — — 0.93 Net Income per Common Share - Basic 0.48 0.40 0.09 0.10 0.33 1.06 2.14 Net Income per Common Share - Diluted Net income per common share - continuing operations $ 0.48 $ 0.40 $ 0.09 $ 0.10 $ 0.32 $ 1.05 $ 1.20 Net income per common share - discontinued operations — — — — — — 0.92 Net Income per Common Share - Diluted 0.48 0.40 0.09 0.10 0.32 1.05 2.12 Weighted average shares - basic 20,711,089 21,500,735 21,472,462 21,689,038 21,876,487 21,342,086 23,315,562 Weighted average shares - diluted 20,795,332 21,543,805 21,535,040 21,842,175 22,053,907 21,427,722 23,478,001 Year ended Three months ended 2019 December 31, 2020 December 31, 2020 June 30, 2020 December 31, 2020 March 31, September 30, 2020 December 31, 2019 7 |
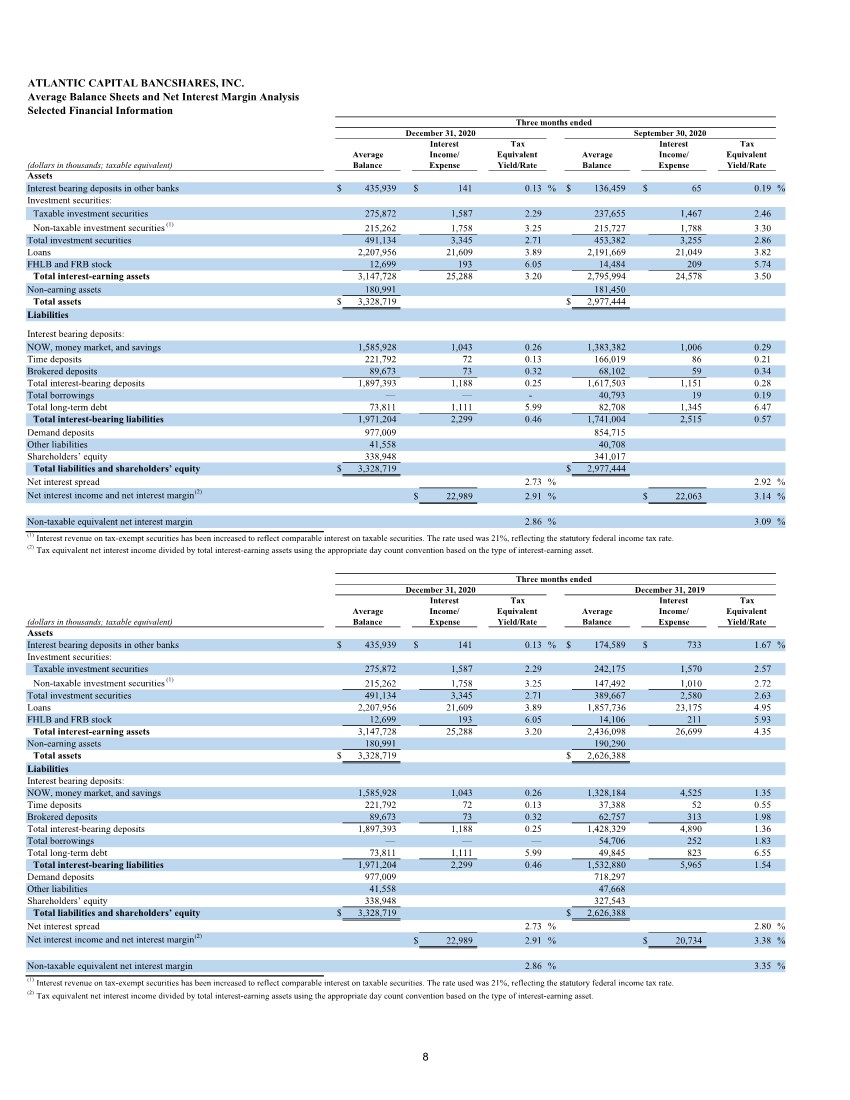
| ATLANTIC CAPITAL BANCSHARES, INC. Average Balance Sheets and Net Interest Margin Analysis Selected Financial Information Tax Tax Equivalent Equivalent (dollars in thousands; taxable equivalent) Yield/Rate Yield/Rate Assets Interest bearing deposits in other banks $ 435,939 $ 141 0.13 % $ 136,459 $ 65 0.19 % Investment securities: Taxable investment securities 275,872 1,587 2.29 237,655 1,467 2.46 Non-taxable investment securities (1) 215,262 1,758 3.25 215,727 1,788 3.30 Total investment securities 491,134 3,345 2.71 453,382 3,255 2.86 Loans 2,207,956 21,609 3.89 2,191,669 21,049 3.82 FHLB and FRB stock 12,699 193 6.05 14,484 209 5.74 Total interest-earning assets 3,147,728 25,288 3.20 2,795,994 24,578 3.50 Non-earning assets 180,991 181,450 Total assets $ 3,328,719 $ 2,977,444 Liabilities Interest bearing deposits: NOW, money market, and savings 1,585,928 1,043 0.26 1,383,382 1,006 0.29 Time deposits 221,792 72 0.13 166,019 86 0.21 Brokered deposits 89,673 73 0.32 68,102 59 0.34 Total interest-bearing deposits 1,897,393 1,188 0.25 1,617,503 1,151 0.28 Total borrowings — — - 40,793 19 0.19 Total long-term debt 73,811 1,111 5.99 82,708 1,345 6.47 Total interest-bearing liabilities 1,971,204 2,299 0.46 1,741,004 2,515 0.57 Demand deposits 977,009 854,715 Other liabilities 41,558 40,708 Shareholders’ equity 338,948 341,017 Total liabilities and shareholders’ equity $ 3,328,719 $ 2,977,444 Net interest spread 2.73 % 2.92 % Net interest income and net interest margin (2) $22,989 2.91 % $ 22,063 3.14 % Non-taxable equivalent net interest margin 2.86 % 3.09 % Tax Tax Equivalent Equivalent (dollars in thousands; taxable equivalent) Yield/Rate Yield/Rate Assets Interest bearing deposits in other banks $ 435,939 $ 141 0.13 % $ 174,589 $ 733 1.67 % Investment securities: Taxable investment securities 275,872 1,587 2.29 242,175 1,570 2.57 Non-taxable investment securities (1) 215,262 1,758 3.25 147,492 1,010 2.72 Total investment securities 491,134 3,345 2.71 389,667 2,580 2.63 Loans 2,207,956 21,609 3.89 1,857,736 23,175 4.95 FHLB and FRB stock 12,699 193 6.05 14,106 211 5.93 Total interest-earning assets 3,147,728 25,288 3.20 2,436,098 26,699 4.35 Non-earning assets 180,991 190,290 Total assets $ 3,328,719 $ 2,626,388 Liabilities Interest bearing deposits: NOW, money market, and savings 1,585,928 1,043 0.26 1,328,184 4,525 1.35 Time deposits 221,792 72 0.13 37,388 52 0.55 Brokered deposits 89,673 73 0.32 62,757 313 1.98 Total interest-bearing deposits 1,897,393 1,188 0.25 1,428,329 4,890 1.36 Total borrowings — — — 54,706 252 1.83 Total long-term debt 73,811 1,111 5.99 49,845 823 6.55 Total interest-bearing liabilities 1,971,204 2,299 0.46 1,532,880 5,965 1.54 Demand deposits 977,009 718,297 Other liabilities 41,558 47,668 Shareholders’ equity 338,948 327,543 Total liabilities and shareholders’ equity $ 3,328,719 $ 2,626,388 Net interest spread 2.73 % 2.80 % Net interest income and net interest margin (2) $22,989 2.91 % $ 20,734 3.38 % Non-taxable equivalent net interest margin 2.86 % 3.35 % (1) Interest revenue on tax-exempt securities has been increased to reflect comparable interest on taxable securities. The rate used was 21%, reflecting the statutory federal income tax rate. (2) Tax equivalent net interest income divided by total interest-earning assets using the appropriate day count convention based on the type of interest-earning asset. (1) Interest revenue on tax-exempt securities has been increased to reflect comparable interest on taxable securities. The rate used was 21%, reflecting the statutory federal income tax rate. (2) Tax equivalent net interest income divided by total interest-earning assets using the appropriate day count convention based on the type of interest-earning asset. Balance Three months ended September 30, 2020 Interest Income/ Expense Interest Income/ Expense December 31, 2020 Average Balance Average Balance Interest Income/ Expense Three months ended December 31, 2020 December 31, 2019 Interest Income/ Expense Average Balance Average 8 |
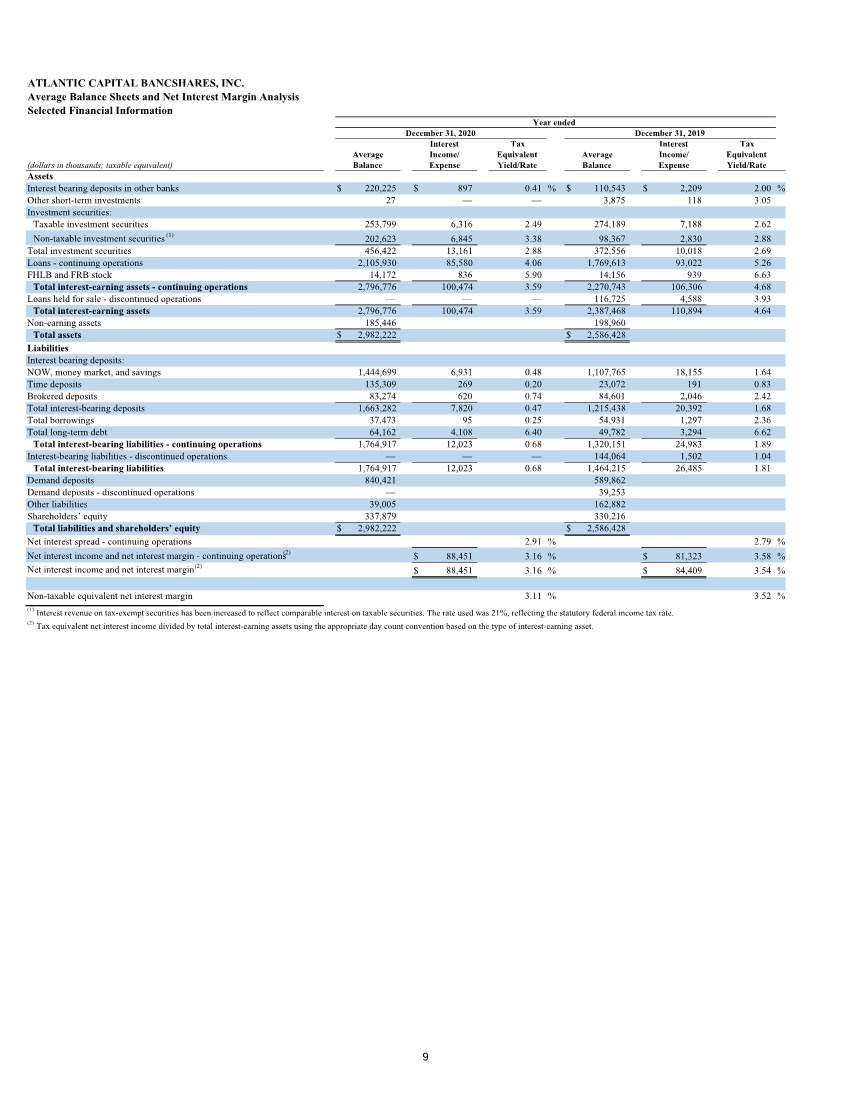
| ATLANTIC CAPITAL BANCSHARES, INC. Average Balance Sheets and Net Interest Margin Analysis Selected Financial Information Tax Tax Equivalent Equivalent (dollars in thousands; taxable equivalent) Yield/Rate Yield/Rate Assets Interest bearing deposits in other banks $ 220,225 $ 897 0.41 % $ 110,543 $ 2,209 2.00 % Other short-term investments 27 — — 3,875 118 3.05 Investment securities: Taxable investment securities 253,799 6,316 2.49 274,189 7,188 2.62 Non-taxable investment securities (1) 202,623 6,845 3.38 98,367 2,830 2.88 Total investment securities 456,422 13,161 2.88 372,556 10,018 2.69 Loans - continuing operations 2,105,930 85,580 4.06 1,769,613 93,022 5.26 FHLB and FRB stock 14,172 836 5.90 14,156 939 6.63 Total interest-earning assets - continuing operations 2,796,776 100,474 3.59 2,270,743 106,306 4.68 Loans held for sale - discontinued operations — — — 116,725 4,588 3.93 Total interest-earning assets 2,796,776 100,474 3.59 2,387,468 110,894 4.64 Non-earning assets 185,446 198,960 Total assets $ 2,982,222 $ 2,586,428 Liabilities Interest bearing deposits: NOW, money market, and savings 1,444,699 6,931 0.48 1,107,765 18,155 1.64 Time deposits 135,309 269 0.20 23,072 191 0.83 Brokered deposits 83,274 620 0.74 84,601 2,046 2.42 Total interest-bearing deposits 1,663,282 7,820 0.47 1,215,438 20,392 1.68 Total borrowings 37,473 95 0.25 54,931 1,297 2.36 Total long-term debt 64,162 4,108 6.40 49,782 3,294 6.62 Total interest-bearing liabilities - continuing operations 1,764,917 12,023 0.68 1,320,151 24,983 1.89 Interest-bearing liabilities - discontinued operations — — — 144,064 1,502 1.04 Total interest-bearing liabilities 1,764,917 12,023 0.68 1,464,215 26,485 1.81 Demand deposits 840,421 589,862 Demand deposits - discontinued operations — 39,253 Other liabilities 39,005 162,882 Shareholders’ equity 337,879 330,216 Total liabilities and shareholders’ equity $ 2,982,222 $ 2,586,428 Net interest spread - continuing operations 2.91 % 2.79 % Net interest income and net interest margin - continuing operations (2) $88,451 3.16 % $ 81,323 3.58 % Net interest income and net interest margin (2) $88,451 3.16 % $ 84,409 3.54 % Non-taxable equivalent net interest margin 3.11 % 3.52 % (1) Interest revenue on tax-exempt securities has been increased to reflect comparable interest on taxable securities. The rate used was 21%, reflecting the statutory federal income tax rate. Year ended December 31, 2019 Interest Income/ Expense December 31, 2020 Average Balance Average Balance Income/ (2) Tax equivalent net interest income divided by total interest-earning assets using the appropriate day count convention based on the type of interest-earning asset. Expense Interest 9 |
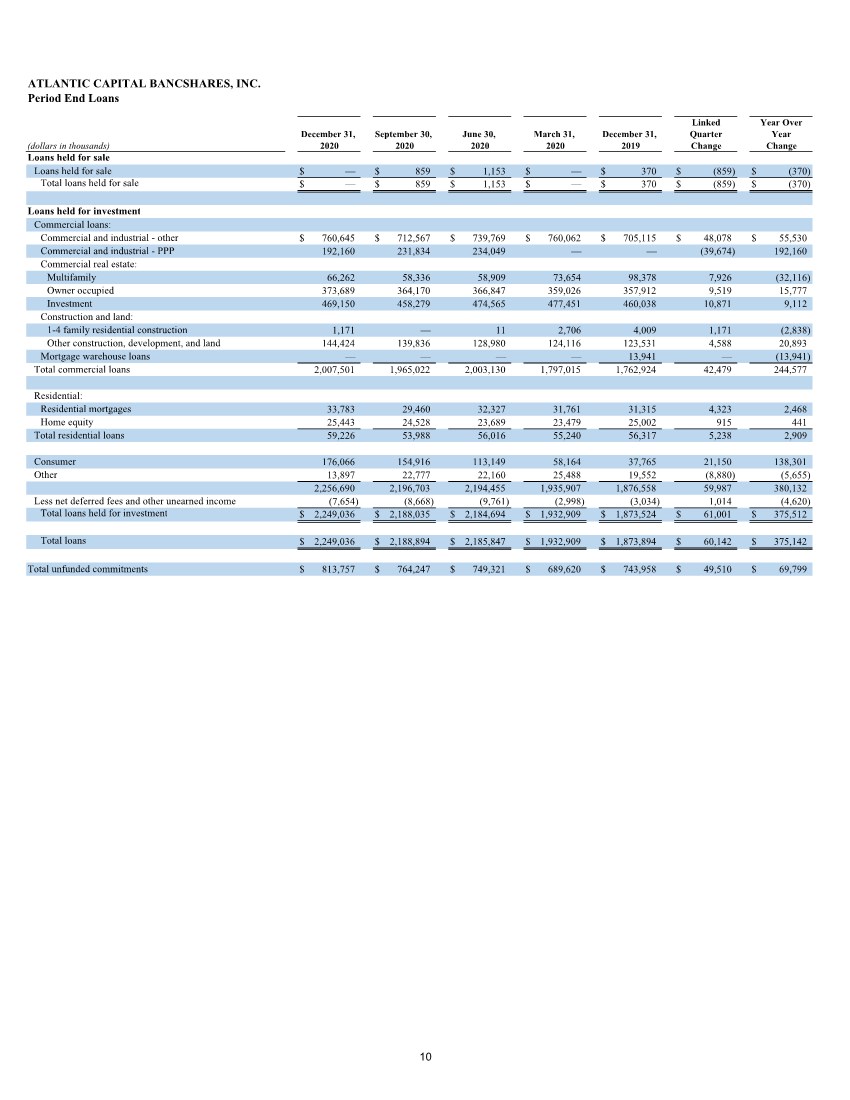
| ATLANTIC CAPITAL BANCSHARES, INC. Period End Loans (dollars in thousands) Loans held for sale Loans held for sale $— $ 859 $ 1,153 $ — $ 370 $ (859) $ (370) Total loans held for sale $— $ 859 $ 1,153 $ — $ 370 $ (859) $ (370) Loans held for investment Commercial loans: Commercial and industrial - other $ 760,645 $ 712,567 $ 739,769 $ 760,062 $ 705,115 $ 48,078 $ 55,530 Commercial and industrial - PPP 192,160 231,834 234,049 — — (39,674) 192,160 Commercial real estate: Multifamily 66,262 58,336 58,909 73,654 98,378 7,926 (32,116) Owner occupied 373,689 364,170 366,847 359,026 357,912 9,519 15,777 Investment 469,150 458,279 474,565 477,451 460,038 10,871 9,112 Construction and land: 1‑4 family residential construction 1,171 — 11 2,706 4,009 1,171 (2,838) Other construction, development, and land 144,424 139,836 128,980 124,116 123,531 4,588 20,893 Mortgage warehouse loans — — — — 13,941 — (13,941) Total commercial loans 2,007,501 1,965,022 2,003,130 1,797,015 1,762,924 42,479 244,577 Residential: Residential mortgages 33,783 29,460 32,327 31,761 31,315 4,323 2,468 Home equity 25,443 24,528 23,689 23,479 25,002 915 441 Total residential loans 59,226 53,988 56,016 55,240 56,317 5,238 2,909 Consumer 176,066 154,916 113,149 58,164 37,765 21,150 138,301 Other 13,897 22,777 22,160 25,488 19,552 (8,880) (5,655) 2,256,690 2,196,703 2,194,455 1,935,907 1,876,558 59,987 380,132 Less net deferred fees and other unearned income (7,654) (8,668) (9,761) (2,998) (3,034) 1,014 (4,620) Total loans held for investment $ 2,249,036 $ 2,188,035 $ 2,184,694 $ 1,932,909 $ 1,873,524 $ 61,001 $ 375,512 Total loans $ 2,249,036 $ 2,188,894 $ 2,185,847 $ 1,932,909 $ 1,873,894 $ 60,142 $ 375,142 Total unfunded commitments $ 813,757 $ 764,247 $ 749,321 $ 689,620 $ 743,958 $ 49,510 $ 69,799 December 31, 2020 June 30, 2020 March 31, 2020 September 30, 2020 Year Over Year Change 2019 Linked Quarter Change December 31, 10 |
| ATLANTIC CAPITAL BANCSHARES, INC. Allowance for Credit Losses Activity and Credit Quality (dollars in thousands) Allowance for loan losses Balance at beginning of period $ 31,894 $ 31,605 $ 24,896 $ 18,535 $ 18,080 Adoption of ASU 2016-13 — — — (854) — Provision for loan losses 225 636 8,222 7,409 787 Loans charged-off: Commercial and industrial (401) (404) (1,479) (18) (344) Commercial real estate — — — (78) — Construction and land — — — — — Residential mortgages — — (36) — — Home equity — — — (125) — Consumer — — — — — Other — — — — — Total loans charged-off (401) (404) (1,515) (221) (344) Recoveries on loans previously charged-off: Commercial and industrial 37 56 1 — 5 Commercial real estate 44 — — 18 — Construction and land 18 — — — — Residential mortgages — — — 1 7 Home equity — — — — — Consumer 1 1 1 8 — Other — — — — — Total recoveries 100 57 2 27 12 Net charge-offs $ (301) $ (347) $ (1,513) $ (194) $ (332) Balance at period end $ 31,818 $ 31,894 $ 31,605 $ 24,896 $ 18,535 Allowance for unfunded commitments Balance at beginning of period $ 2,871 $ 3,480 $ 2,838 $ 892 $ 836 Adoption of ASU 2016-13 — — — 1,275 — Provision for unfunded commitments 257 (609) 642 671 56 Balance at period end $ 3,128 $ 2,871 $ 3,480 $ 2,838 $ 892 Total allowance for credit losses - loans and unfunded commitments $ 34,946 $ 34,765 $ 35,085 $ 27,734 $ 19,427 Provision for credit losses under CECL Provision for loan losses 225 636 8,222 7,409 787 Provision for securities held to maturity credit losses (1) 1 (1) (6) - Provision for unfunded commitments(1) 257 (609) 642 671 - Total provision for credit losses $ 481 $ 28 $ 8,863 $ 8,074 $ 787 Non-performing loans $ 4,862 $ 5,421 $ 6,265 $ 6,515 $ 7,293 Foreclosed properties (OREO) 16 563 779 779 278 Total nonperforming assets $ 4,878 $ 5,984 $ 7,044 $ 7,294 $ 7,571 Allowance for loan losses to loans held for investment 1.41 % 1.46 % 1.45 % 1.29 % 0.99 % Allowance for credit losses to loans held for investment 1.55 % 1.59 % 1.61 % 1.43 % 1.04 % Allowance for credit losses to loans held for investment excluding PPP loans 1.70 % 1.78 % 1.80 % 1.43 % 1.04 % Net charge-offs to average loans (2) 0.05 0.06 0.29 0.04 0.07 Non-performing loans as a percentage of total loans 0.22 % 0.25 % 0.29 % 0.34 % 0.39 % Non-performing assets as a percentage of total assets 0.13 % 0.20 % 0.24 % 0.27 % 0.26 % (1) Prior to the adoption of ASU 2016-13, the provision for unfunded commitments was included in other expense and totaled $56 for the fourth quarter of 2019. (2)Annualized. Fourth 2020 2019 Quarter Third Quarter Second Quarter First Quarter Quarter Fourth 11 |
| ATLANTIC CAPITAL BANCSHARES, INC. Period End Deposits (dollars in thousands) DDA $ 1,033,765 $ 843,656 $ 883,662 $ 712,919 $ 824,646 $ 190,109 $ 209,119 NOW 760,638 387,858 449,737 368,463 373,727 372,780 386,911 Savings 625 568 583 567 1,219 57 (594) Money market 1,030,753 945,834 879,863 982,109 1,173,218 84,919 (142,465) Time 241,328 196,343 131,353 66,793 44,389 44,985 196,939 Brokered 94,399 94,463 62,433 94,268 81,847 (64) 12,552 Total deposits $ 3,161,508 $ 2,468,722 $ 2,407,631 $ 2,225,119 $ 2,499,046 $ 692,786 $ 662,462 Average Deposits (dollars in thousands) DDA $ 977,009 $ 854,715 $ 815,299 $ 713,001 $ 718,298 $ 122,294 $ 258,711 NOW 558,967 440,734 462,051 382,178 320,637 118,233 238,330 Savings 614 586 574 650 1,098 28 (484) Money market 1,026,347 942,062 952,444 1,010,713 1,006,449 84,285 19,898 Time 221,792 166,019 96,362 55,775 37,388 55,773 184,404 Brokered 89,673 68,102 83,228 92,188 62,757 21,571 26,916 Total deposits $ 2,874,402 $ 2,472,218 $ 2,409,958 $ 2,254,505 $ 2,146,627 $ 402,184 $ 727,775 Noninterest bearing deposits as a percentage of average deposits 34.0 % 34.6 % 33.8 % 31.6 % 33.5 % Cost of interest-bearing deposits 0.25 % 0.28 % 0.33 % 1.09 % 1.36 % Cost of deposits 0.16 % 0.19 % 0.22 % 0.75 % 0.90 % Linked Quarter Change December 31, 2020 Year Over Year Change 2020 September 30, March 31, 2020 2019 December 31, June 30, 2020 Linked 2020 2019 Quarter Q4 2020 vs Fourth Third Second First Fourth Change Q4 2019 Quarter Quarter Quarter Quarter Quarter 12 |
| ATLANTIC CAPITAL BANCSHARES, INC. Non-GAAP Performance and Financial Measures Reconciliation (in thousands, except share and per share data) Taxable equivalent interest income reconciliation Interest income - GAAP $ 24,943 $ 24,233 $ 23,797 $ 26,023 $ 26,532 $ 98,996 $ 105,847 Taxable equivalent adjustment 345 345 354 223 167 1,478 459 Interest income - taxable equivalent $ 25,288 $ 24,578 $ 24,151 $ 26,246 $ 26,699 $ 100,474 $ 106,306 Taxable equivalent net interest income reconciliation - continuing operations Net interest income - GAAP $ 22,644 $ 21,718 $ 21,631 $ 20,980 $ 20,567 $ 86,973 $ 80,864 Taxable equivalent adjustment 345 345 354 223 167 1,478 459 Net interest income - taxable equivalent - continuing operations $ 22,989 $ 22,063 $ 21,985 $ 21,203 $ 20,734 $ 88,451 $ 81,323 Loan yield excluding PPP loans Loan yield - GAAP 3.89 % 3.82 % 3.87 % 4.77 % 4.95 % 4.06 % 5.26 % Impact of PPP loans (0.03) 0.13 0.22 — — 0.10 — Loan yield excluding PPP loans 3.86 % 3.95 % 4.09 % 4.77 % 4.95 % 4.16 % 5.26 % Taxable equivalent net interest margin reconciliation - continuing operations Net interest margin - GAAP - continuing operations 2.86 % 3.09 % 3.17 % 3.38 % 3.35 % 3.11 % 3.52 % Impact of taxable equivalent adjustment 0.05 0.05 0.06 0.03 0.03 0.05 0.06 Net interest margin - taxable equivalent - continuing operations 2.91 % 3.14 % 3.23 % 3.41 % 3.38 % 3.16 % 3.58 % Taxable equivalent net interest margin reconciliation Net interest margin - GAAP 2.86 % 3.09 % 3.17 % 3.38 % 3.35 % 3.11 % 3.52 % Impact of taxable equivalent adjustment 0.05 0.05 0.06 0.03 0.03 0.05 0.02 Net interest margin - taxable equivalent 2.91 % 3.14 % 3.23 % 3.41 % 3.38 % 3.16 % 3.54 % Taxable equivalent net interest margin excluding PPP loans reconciliation Net interest margin - GAAP 2.86 % 3.09 % 3.17 % 3.38 % 3.35 % 3.11 % 3.52 % Impact of PPP loans (0.05) 0.09 0.18 — — 0.07 — Net interest margin - taxable equivalent excluding PPP loans 2.81 % 3.18 % 3.35 % 3.38 % 3.35 % 3.18 % 3.52 % Taxable equivalent income before income taxes reconciliation Income before income taxes - GAAP $ 12,015 $ 10,481 $ 2,207 $ 2,451 $ 9,077 $ 27,153 $ 35,769 Taxable equivalent adjustment 345 345 354 223 167 1,478 459 Income before income taxes $ 12,360 $ 10,826 $ 2,561 $ 2,674 $ 9,244 $ 28,631 $ 36,228 Taxable equivalent income tax expense reconciliation Income tax expense - GAAP $ 2,065 $ 1,863 $ 358 $ 327 $ 1,937 $ 4,613 $ 7,611 Taxable equivalent adjustment 345 345 354 223 167 1,478 459 Income tax expense $ 2,410 $ 2,208 $ 712 $ 550 $ 2,104 $ 6,091 $ 8,070 Tangible book value per common share reconciliation Total shareholders’ equity $ 338,586 $ 340,309 $ 335,980 $ 332,300 $ 326,495 $ 338,586 $ 326,495 Intangible assets (19,925) (19,925) (19,925) (19,925) (19,925) (19,925) (19,925) Total tangible common equity $ 318,661 $ 320,384 $ 316,055 $ 312,375 $ 306,570 $ 318,661 $ 306,570 Common shares outstanding 20,394,912 21,202,783 21,477,631 21,479,986 21,751,026 20,394,912 21,751,026 Book value per common share - GAAP $ 16.60 $ 16.05 $ 15.64 $ 15.47 $ 15.01 $ 16.60 $ 15.01 Tangible book value 15.62 15.11 14.72 14.54 14.09 15.62 14.09 Tangible common equity to tangible assets reconciliation Total shareholders’ equity $ 338,586 $ 340,309 $ 335,980 $ 332,300 $ 326,495 $ 338,586 $ 326,495 Intangible assets (19,925) (19,925) (19,925) (19,925) (19,925) (19,925) (19,925) Total tangible common equity $ 318,661 $ 320,384 $ 316,055 $ 312,375 $ 306,570 $ 318,661 $ 306,570 Total assets $ 3,615,617 $ 2,923,977 $ 2,890,622 $ 2,719,658 $ 2,910,379 $ 3,615,617 $ 2,910,379 Intangible assets (19,925) (19,925) (19,925) (19,925) (19,925) (19,925) (19,925) Total tangible assets $ 3,595,692 $ 2,904,052 $ 2,870,697 $ 2,699,733 $ 2,890,454 $ 3,595,692 $ 2,890,454 Tangible common equity to tangible assets 8.86 % 11.03 % 11.01 % 11.57 % 10.61 % 8.86 % 10.61 % Allowance for credit losses to loans held for investment reconciliation Total loans held for investment $ 2,249,036 $ 2,188,035 $ 2,184,694 $ 1,932,909 $ 1,873,524 $ 2,249,036 $ 1,873,524 PPP loans (192,160) (231,834) (234,049) — — (192,160) — Total loans held for investment excluding PPP loans $ 2,056,876 $ 1,956,201 $ 1,950,645 $ 1,932,909 $ 1,873,524 $ 2,056,876 $ 1,873,524 Allowance for credit losses to loans held for investment 1.55 % 1.59 % 1.61 % 1.43 % 1.04 % 1.55 % 1.04 % Allowance for credit losses to loans held for investment excluding PPP loans 1.70 % 1.78 % 1.80 % 1.43 % 1.04 % 1.70 % 1.04 % For the year ended December 31, 2020 2019 Third Quarter 2020 Fourth Quarter Second Quarter 2019 First Quarter Fourth Quarter 13 |
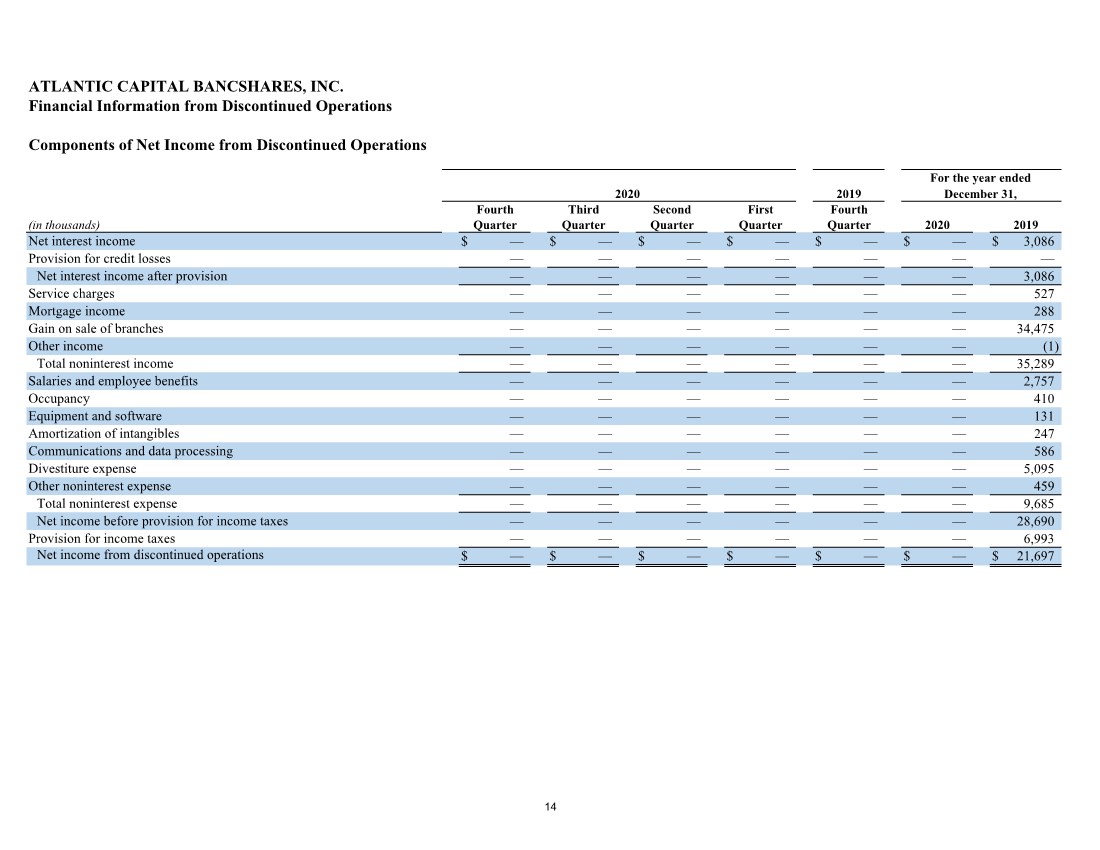
| ATLANTIC CAPITAL BANCSHARES, INC. Financial Information from Discontinued Operations Components of Net Income from Discontinued Operations (in thousands) Net interest income $— $ $ — $ — $ — $ — $ — 3,086 Provision for credit losses — — — — — — — Net interest income after provision — — — — — — 3,086 Service charges — — — — — — 527 Mortgage income — — — — — — 288 Gain on sale of branches — — — — — — 34,475 Other income — — — — — — (1) Total noninterest income — — — — — — 35,289 Salaries and employee benefits — — — — — — 2,757 Occupancy — — — — — — 410 Equipment and software — — — — — — 131 Amortization of intangibles — — — — — — 247 Communications and data processing — — — — — — 586 Divestiture expense — — — — — — 5,095 Other noninterest expense — — — — — — 459 Total noninterest expense — — — — — — 9,685 Net income before provision for income taxes — — — — — — 28,690 Provision for income taxes — — — — — — 6,993 Net income from discontinued operations $— $ $ — $ — $ — $ — $ — 21,697 For the year ended December 31, Second Quarter Third Quarter First Quarter 2019 2020 Fourth Quarter 2019 2020 Fourth Quarter 14 |