Attached files
| file | filename |
|---|---|
| EX-10.1 - EX-10.1 - CITRIX SYSTEMS INC | d915471dex101.htm |
| EX-99.2 - EX-99.2 - CITRIX SYSTEMS INC | d915471dex992.htm |
| EX-2.1 - EX-2.1 - CITRIX SYSTEMS INC | d915471dex21.htm |
| 8-K - 8-K - CITRIX SYSTEMS INC | d915471d8k.htm |
Exhibit 99.1
citrix 2020 Q4 Financials January 19, 2021 To Our Stakeholders Our fourth quarter results reflect continued execution against our strategy - including strong on-going demand for the Citrix Workspace and an acceleration of our customers adopting Citrix Cloud to manage their workspace environments. The pandemic that we have all experienced has accelerated the trends driving distributed teams and hybrid-work, emphasizing the importance of an organization’s ability to securely deliver all of the work resources employees need in one unified experience. Today’s announcement of our entry into a definitive agreement to acquire Wrike, a market-leading born-in- the-cloud Collaborative Work Management platform, is expected to accelerate our strategy and supports our common mission of removing the complexity of today’s distributed work environments so employees, teams and organizations can perform at their best. This acquisition will allow us to move forward faster in our strategy to build on and expand beyond the growing virtualization market. Highlights include: Fourth quarter subscription ARR1 was $1.20 billion, up 62% year-over-year, and SaaS ARR was $725 million, up 39% year-over-year Reported revenue was $810 million in the fourth quarter and $3.24 billion for the full year. For the fourth quarter, GAAP diluted EPS was $0.89, and non-GAAP diluted EPS2 was $1.46. For the full year, GAAP diluted EPS was $4.00 and non-GAAP diluted EPS2 was $6.10 Fourth quarter subscription bookings as a percentage of total product bookings was 85%, up from 69% in the fourth quarter of 2019. For the full year, subscription bookings as a percentage of total product bookings were 75%, up from 62% in 2019 Board of Directors increased the quarterly dividend from $0.35 to $0.37 per share to be paid on March 26, 2021 to shareholders of record on March 12, 2021 as a result of the company’s strong performance and confidence in free cash flow generation Signed definitive agreement to acquire Wrike for $2.25 billion in cash which is expected to close in the first half of 2021. Wrike ended 2020 with more than $140 million in unaudited SaaS ARR, reflecting over a 30% CAGR in SaaS ARR over the prior two years. The company is expected to have approximately 30% standalone growth to between $180 million and $190 million in SaaS ARR3 in 2021, with the opportunity to accelerate growth over time under Citrix’s ownership. The transaction is expected to be neutral to our FY2022 non-GAAP earnings per share and free cash flow and accretive thereafter. ‘Annualized Recurring Revenue, or ARR, is an operating metric that represents the contracted recurring value of all termed subscriptions normalized to a one-year period. It is calculated at the end of a reporting period by taking each contract’s recurring total contract value and dividing by the length of the contract. ARR includes only active contractually committed, fixed subscription fees. Our definition of ARR includes contracts expected to recur and therefore excludes contracts with durations of 12 months or less where licenses were issued to address extraordinary business continuity events for our customers. All contracts are annualized, including 30 day offerings where we take monthly recurring revenue multiplied by 12 to annualize. ARR should be viewed independently of U.S. GAAP revenue, deferred revenue and unbilled revenue and is not intended to be combined with or to replace those items. ARR is not a forecast of future revenue. This definition of ARR does not apply to business combinations not yet consummated by the Company. 2A reconciliation of GAAP to non-GAAP measures has been provided in the financial statement tables included in this letter. An explanation of these measures is also included below under the heading “Reconciliation of Non-GAAP Financial Measures to Comparable U.S. GAAP Measures.” -;ARR does not reflect adjustments to revenue or future committed revenue that may arise in accounting for a business combination, and is not intended to be a forecast of future revenue Ci Iri X . 2020 I Q4 and Full Year Financials 1 annualized recurring , or ARR is an operating metric that represents the contracted recurring value of all termed subscriptions normalized to a one-year period It is calculated at the end of a reporting period by taking each contract’s recurring total contract value dividing by the length of contract. ARR includes only active contractually committed fixed subscriptions fees. Our definition of ARR includes contracts expected to recur and therefore excludes contracts with durations of 12 months or less where licenses were issued to address extraordinary business continuity events for our customers. All contracts are annualized, including 30 day offerings where we take monthly recurring revenue multiplied by 12 to annualize. ARR should be viewed independently of U.S. GAAP revenue deferred revenue and unbilled revenue and is not intended to be combined with or to replace those items. ARR is not a forecast of future revenues. This definition of ARR does not apply to business combination not yet consummated by the company.2 A Reconciliation of GAAP to non-GAAP measures has been provided in the financial statement tables included in this letter an explanation of these measures is also included below under the heading “Reconciliation of non-GAAP Financial Measures to Comparable U.S. GAAP measures ” 3 ARR does not reflect adjustments to revenue or future committed revenue that may arise in accounting for a business combination and is intened forecast of future revenue
Looking to 2021 and beyond, we are optimistic. With vaccine distribution underway, we are hopeful that we can all begin to live in a
post-pandemic new-normal in the Latter half of the year. Even as we look forward to more flexibility in travel and meetings, we understand the way people work has durably changed. The pandemic has demonstrated to employers across every industry
around the world the effectiveness of flexible work and distributed teams. Securely delivering work resources and providing a great employee experience supports optimal outcomes - and Citrix Workspace is a critical enabler.
Wrike Fast Facts
What: A leading provider of SaaS- based collaborative work management
solutions, providing a core productivity platform to structure, track, report, and collaborate across a range of work scenarios
Where: Headquartered in San Jose,
California with offices around the world
Who: 1,000+ employees
Mission: To
help every person, team and organization achieve their best by reducing chaos and complexity through visibility, contextual collaboration and automation
Why:
Together, Citrix and Wrike deliver a cloud-native digital workspace experience empowering all employees to securely access, collaborate, and execute work in the most effective way across any work channel, device or location
As we enter the new year with the transition of our Workspace product bookings to a subscription model largely behind us and an acceleration in the transition of our installed base
to the cloud, we are keenly focused on propelling our SaaS business forward. Strategically, operationally and financially, we believe Wrike is an exceptional fit. As a leading provider of SaaS-based Collaborative Work Management solutions, providing
a core day-to-day productivity platform that delivers the tools to structure, track, report, and collaborate across a range of work scenarios, Wrike will complement Citrix’s accelerating SaaS business and expands Citrix Workspace. Together,
Citrix and Wrike will provide a cloud-delivered digital workspace experience that empowers all employees and teams to securely access, collaborate, and execute work efficiently and effectively across any work channel, device, or location.
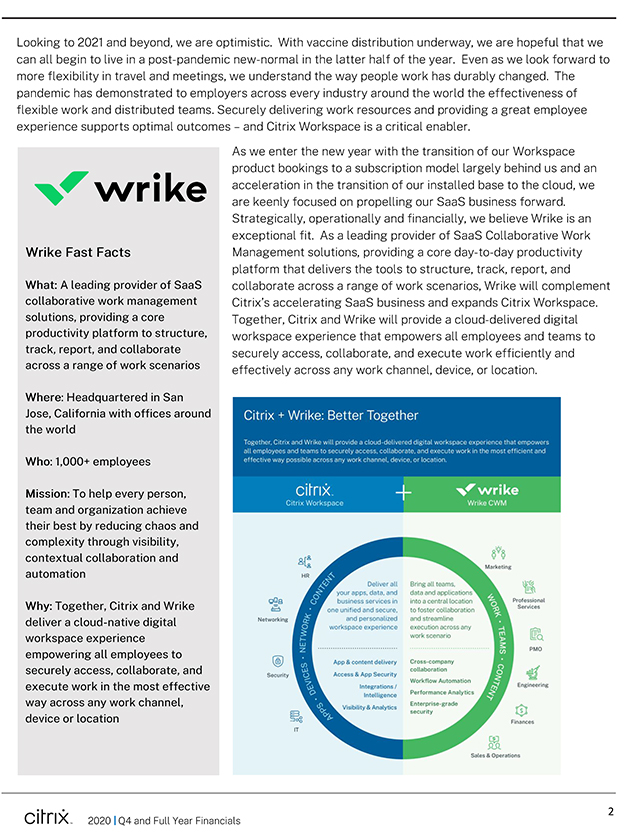
Citrix + Wrike: Better Together
Together, Citrix and Wrike will provide a
cloud-delivered digital workspace experience that empowers all employees and teams to securely access, collaborate, and execute work in the most efficient and effective way possible across any work channel, device, or location.
Deliver all your apps, data, and business services in one unified and secure, and personalized workspace experience
Bring all teams, data and applications into a central location to foster collaboration and streamline execution across any work scenario
App & content delivery Access & App Security integrations / Intelligence Visibility & Analytics
Cross-company collaboration Workflow Automation Performance Analytics Enterprise-grade security
HR Networking security IT Marketing Professional Services PMO Engineering Finances Sales & Operations APPS DEVICES NETWORK CONTENT 2020 Q4 and Full Year
Financials 2 WORKS TEAMS CONTENT
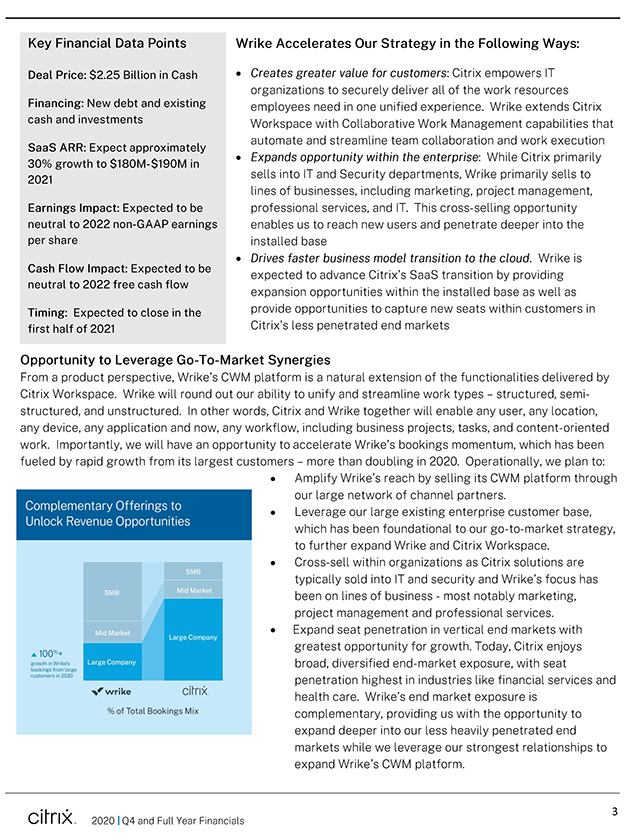
Key Financial Data Points Wrike Accelerates Our Strategy in the Following Ways: Deal Price: $2.25 Billion in Cash Creates greater value for customers: Citrix empowers IT organizations to securely deliver all of the work resources Financing: New debt and existing employees need in one unified experience. Wrike extends Citrix cash and investments Workspace with Collaborative Work Management capabilities that automate and streamline team collaboration and work execution SaaS ARR: Expected 30%+ growth Expands opportunity within the enterprise: While Citrix primarily to $180M-$190M in 2021 sells jnt0 anc| Security departments, Wrike primarily sells to lines of businesses, including marketing, project management, Earnings Impact: Expected to be professional services, and IT. This cross-selling opportunity neutral to 2022 non-GAAP earnings enables us to reach new users and penetrate deeper into the pershare installed base Drives faster business model transition to the cloud. Wrike is Cash Flow Impact: Expected to be expected to advance Citrix s SaaS transition by providing neutral to 2022 free cash flow. expansion opportunities within the installed base as well provide opportunities to capture new seats within customers in Timing: Expected to close in the first half of 2021 Citrix’s less penetrated end markets Opportunity to Leverage Go-To-Market Synergies From a product perspective, Wrike’s CWM platform is a natural extension of the functionalities delivered by Citrix Workspace. Wrike will round out our ability to unify and streamline work types - structured, semistructured, and unstructured. In other words, Citrix and Wrike together will enable any user, any location, any device, any application and now, any workflow, including business projects, tasks, and content-oriented work. Importantly, we will have an opportunity to accelerate Wrike’s bookings momentum, which has been fueled by rapid growth from its largest customers - more than doubling in 2020. Operationally, we plan to: Amplify Wrike’s reach by selling its CWM platform through our large network of channel partners. Leverage our large existing enterprise customer base, which has been foundational to our go-to-market strategy, to further expand Wrike and Citrix Workspace. Cross-sell within organizations as Citrix solutions are typically sold into IT and security and Wrike’s focus has been on lines of business - most notably marketing, project management and professional services. Expand seat penetration in vertical end markets with BM greatest opportunity for growth. Today, Citrix enjoys broad, diversified end-market exposure, with seat bookings from large customers in 2020 penetration highest in industries like financial services and health care. Wrike’s end market exposure is % of Total Bookings Mix complementary, providing us with the opportunity to expand deeper into our less heavily penetrated end markets while we leverage our strongest relationships to expand Wrike’s CWM platform. CilriX. 2020 I Q4 and Full Year Financials
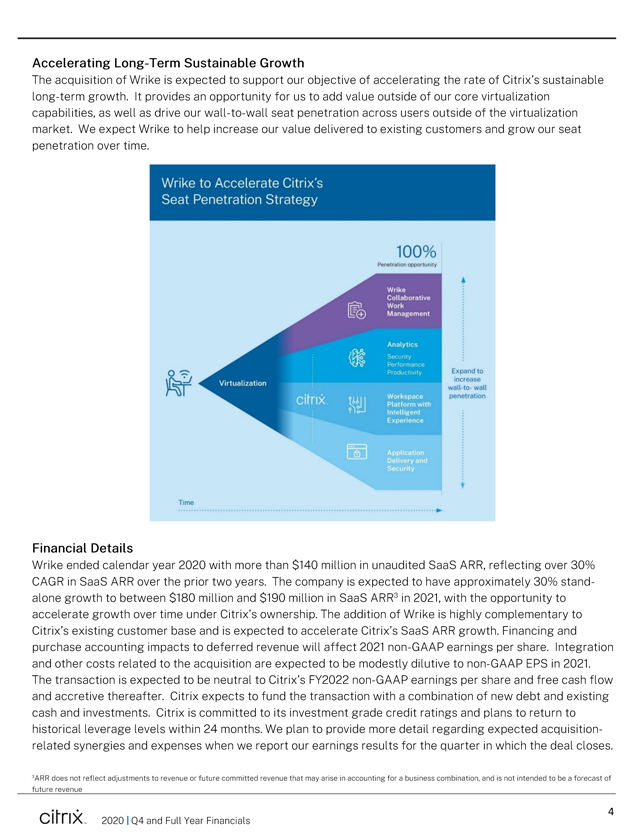
Accelerating Long-Term Sustainable Growth The acquisition of Wrike is expected to support our objective of accelerating the rate of Citrix’s sustainable long-term growth. It provides an opportunity for us to add value outside of our core virtualization capabilities, as well as drive our wall-to-wall seat penetration across users outside of the virtualization market. We expect Wrike to help increase our value delivered to existing customers and grow our seat penetration over time. IWrike to Accelerate Citrix’s Seat Penetration Strategy Collaborative Work Management Analytics Performance Productivity. Virtualization: citrix fill I Workspace Platform with Intelligent: Experience Application Delivery and Security ‘ Financial Details Wrike ended calendar year 2020 with more than $140 million in unaudited SaaS ARR, reflecting over 30% CAGR in SaaS ARR over the prior two years. The company is expected to have approximately 30% standalone growth to between $180 million and $190 million in SaaS ARR3 in 2021, with the opportunity to accelerate growth over time under Citrix’s ownership. The addition of Wrike is highly complementary to Citrix’s existing customer base and is expected to accelerate Citrix’s SaaS ARR growth. Financing and purchase accounting impacts to deferred revenue will affect 2021 non-GAAP earnings per share. Integration and other costs related to the acquisition are expected to be modestly dilutive to non-GAAP EPS in 2021. The transaction is expected to be neutral to Citrix’s FY2022 non-GAAP earnings per share and free cash flow and accretive thereafter. Citrix expects to fund the transaction with a combination of new debt and existing cash and investments. Citrix is committed to its investment grade credit ratings and plans to return to historical leverage levels within 24 months. We plan to provide more detail regarding expected acquisition- related synergies and expenses when we report our earnings results for the quarter in which the deal closes. 3ARR does not reflect adjustments to revenue or future committed revenue that may arise in accounting for a business combination, and is not intended to be a forecast of future revenue CitriX- 2020 I Q4 and Full Year Financials
Context for Fourth Quarter and Full Year Results and synopsys 2°2 outo k Our fourth quarter results are highlighted by the increased traction in Customer Highlight: Protecting transitioning our installed base to the cloud. As forecasted, the smart chip IP with Citrix Secure modest uptick we saw in the third quarter in transitioning our Solutions installed base gained momentum as we progressed through the Synopsys is a leading provider of fourth quarter, increasing our confidence that the lull we electronic design automation experienced in transitioning our customers to the cloud in the first technology and IP solutions. With half of 2020 was primarily a short-term, transitory consequence of the abrupt move to remote work our customers’ priorities in light of the early phases of the pandemic, and cloud computing due to The acceleration of our year-over-year SaaS ARR growth rate COVID-19, Synopsys implemented reflects the improvement we are seeing in customers migrating to a zero-trust architecture with the cloud. Citrix Secure Workspace Access to support the various access The fourth quarter of 2020 marked the end of broad availability of points and devices their perpetual Citrix Workspace licenses. Now, customers have the employees use to work and option of acquiring Citrix Workspace seats in the form of on-premises collaborate remotely, using Citrix subscription or SaaS offerings. As a result, subscription bookings as Analytics for Security for full a percentage of Workspace product bookings increased to 95% in visibility across their entire IT fourth quarter of 2020, up from 73% in the year ago period. The environment. impact of the shift towards subscription in our model is also evident in the sharp year-over-year decline in Product and License revenue as well as the steady decline in Support and Services reported revenue lines, more than offset by strength in Subscription revenue. Taking a step back and looking at our full year 2020 results, we are pleased to have delivered revenue that exceeded the mid-point of our original guidance provided one year ago by more than $120 Customer Highlight: Migrating to million and GAAP EPS $0.60 above the mid-point of our original the Cloud for Performance, guidance. We accomplished this while transitioning our business to a Agility and Cost Savings subscription model with full year subscription bookings as a Severn Trent is one of the UK s percentage of total product bookings mix of 75%, at the high-end of largest water companies serving our expectation over eight million customers with water treatment, sewage and It goes without saying that the global impact of the pandemic has recycling services. A long-time been profound—lasting longer and taking a greater human and Citrix on-premises customer, economic toll than most of us could have imagined. It also has Severn Trent decided to move its changed the way companies and employees think about the benefits existing environment to Citrix of hybrid and flexible work. It has demonstrated that work is an Workspace on Microsoft Azure activity, not a place, that requires a flexible infrastructure to support, Cloud, utilizing Citrix Cloud secure and empower teams. services to manage their deployments seamlessly. CilTIX. 2020 I Q4 and Full Year Financials
A recent survey of 12,000+ employees across the United States, Germany and India conducted by BCG found that employers moved approximately 40% of employees to remote work as a result of the pandemic.4 The study found that nearly 75% of employees indicated that they have been able to maintain or improve productivity on their individual tasks. Just over half indicated that they’ve been able to maintain or improve productivity on collaborative tasks. Moving into our next phase of business transformation, we continue to evaluate the metrics and key performance indicators (KPIs) we are measuring our business by internally and those that we provide as external disclosures. As we move into the new year, we want to bring to your attention a few changes we intend to make going forward: Bookings mix assumptions and disclosures. Given that a large majority of our business has already transitioned to the subscription model, rather than providing the mix of total subscription bookings as a percentage of total product bookings underlying our guidance assumptions, we will provide our SaaS as a percentage of subscription bookings mix assumptions Strategic Service Provider (SSP) revenue contribution. Now that two of our three SSP customers have transitioned to a subscription model of consuming Application Delivery & Security (formerly Networking) capacity, and the contribution to our reported revenue has become less impactful to our results (2% of total revenue in the fourth quarter and 3% for the full year 2020), we will retire the Revenue by Customer Type table in our first quarter 2021 earnings letter We are hopeful and enthusiastic as we look ahead. We are thrilled to welcome the Wrike team to the Citrix family and are confident that together we will enable our customers to redefine the ways in which their organizations work, and this can drive considerable value for all of our stakeholders—employees, partners, customer and shareholders. The transition of our installed base is gaining traction, and the opportunity for Citrix in the years ahead is substantial as secular shifts toward distributed hybrid and flexible work, security and employee productivity should serve as key demand drivers well into the future. David Henshall President & CEO 4Source: BCG COVID-19 Employee Sentiment Survey, May 21 to June 13, 2020 Ci Iri X . 2020 I Q4 and Full Year Financials
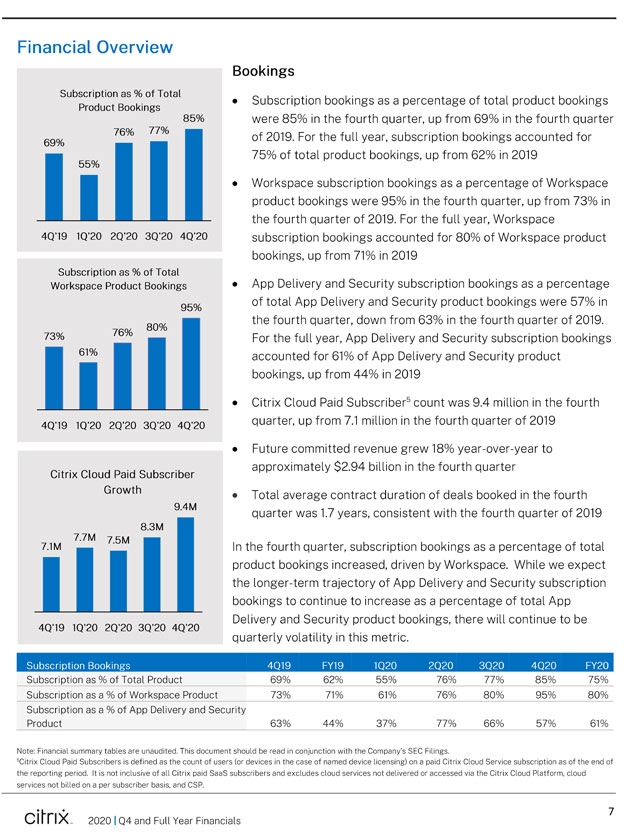
Financial Overview Bookings Product Bookings * Subscription bookings as a percentage of total product bookings 85% were 85% in the fourth quarter, up from 69% in the fourth quarter 6go/o 76% 77/o M of 2019. For the full year, subscription bookings accounted for J. H H H 75% of total product bookings, up from 62% in 2019 Workspace subscription bookings as a percentage of Workspace product bookings were 95% in the fourth quarter, up from 73% in the fourth quarter of 2019. For the full year, Workspace 4Q’19 1Q’2O 2Q’2O 3Q’2O 4Q’2O subscription bookings accounted for 80% of Workspace product bookings, up from 71% in 2019 Subscription as % of Total Workspace Product Bookings App Delivery and Security subscription bookings as a percentage 95% APP Delivery and Security product bookings were 57% in J the fourth quarter, down from 63% in the fourth quarter of 2019. “7C0/ OU /O 73% 0 For the full year, App Delivery and Security subscription bookings 61% M M M accounted for 61% of App Delivery and Security product bookings, up from 44% in 2019 Citrix Cloud Paid Subscriber5 count was 9.4 million in the fourth 4Q’19 1Q’2O 2Q’2O 3Q’2O 4Q’2O quarter, up from 7.1 million in the fourth quarter of 2019 Future committed revenue grew 18% year-over-year to , approximately $2.94 billion in the fourth quarter Citrix Cloud Paid Subscriber Growth Total average contract duration of deals booked in the fourth 9‘4M quarter was 1.7 years, consistent with the fourth quarter of 2019 8.3M 7.7M 7 5M 7.1M — M M In the fourth quarter, subscription bookings as a percentage of total J product bookings increased, driven by Workspace. While we expect the longer-term trajectory of App Delivery and Security subscription bookings to continue to increase as a percentage of total App Delivery and Security product bookings, there will continue to be 4QT9 1Q’2O 2Q’2O 3Q’2O 4Q’2O quarterly volatility in this metric. Subscription as % of Total Product 69% 62% 55% 76% 77% 85% 75% Subscription as a % of Workspace Product 73% 71% 61% 76% 80% 95% 80% Subscription as a % of App Delivery and Security Product 63% 44% 37% 77% 66% 57% 61% Note: Financial summary tables are unaudited. This document should be read in conjunction with the Company’s SEC Filings. 5Citrix Cloud Paid Subscribers is defined as the count of users (or devices in the case of named device licensing) on a paid Citrix Cloud Service subscription as of the end of the reporting period. It is not inclusive of all Citrix paid SaaS subscribers and excludes cloud services not delivered or accessed via the Citrix Cloud Platform, cloud services not billed on a per subscriber basis, and CSP. CilTIX . 2020 I Q4 and Full Year Financials
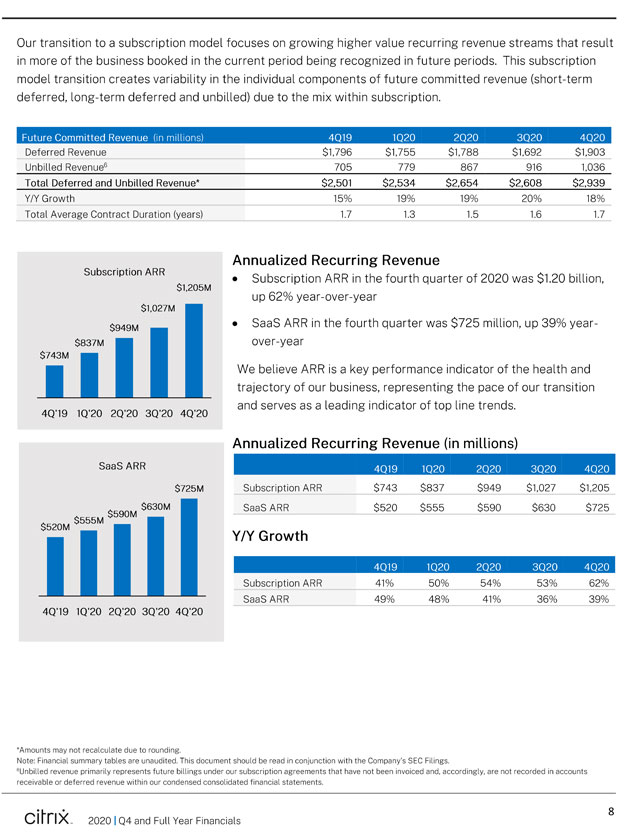
Our transition to a subscription model focuses on growing higher value recurring revenue streams that result in more of the business booked in the current period being recognized in future periods. This subscription model transition creates variability in the individual components of future committed revenue (short-term deferred, long-term deferred and unbilled) due to the mix within subscription. Deferred Revenue $1,796 $1,755 $1,788 $1,692 $1,903_ Unbilled Revenue6 705 779 867 916 1,036 Total Deferred and Unbilled Revenue* $2,501 $2,534 $2,654 $2,608 $2,939 Y/Y Growth 15% 19% 19% 20% 18% Total Average Contract Duration (years) 1.7 1.3 1.5 1.6 1.7 Annualized Recurring Revenue Subscription arr * Subscription ARR in the fourth quarter of 2020 was $1.20 billion, $1,205M up 62% year-over-year $1,027M $949M B SaaS ARR in the fourth quarter was $725 million, up 39% year- $837M M H H over-year $743M M J We believe ARR is a key performance indicator of the health and trajectory of our business, representing the pace of our transition and serves as a leading indicator of top line trends. 4Q’19 1Q’2O 2Q’2O 3Q’2O 4Q’2O Annualized Recurring Revenue (in millions) SaaS ARR $725M Subscription ARR $743 $837 $949 $1,027 $1,205 $630M SaaS ARR $520 $555 $590 $630 $725 $555M 3590M I I I I I Subscription ARR 41% 50% 54% 53% 62% SaaS ARR 49% 48% 41% 36% 39% 4Q’19 1Q’2O 2Q’2O 3Q’2O 4Q’2O *Amounts may not recalculate due to rounding. Note: Financial summary tables are unaudited. This document should be read in conjunction with the Company’s SEC Filings. 6Unbilled revenue primarily represents future billings under our subscription agreements that have not been invoiced and, accordingly, are not recorded in accounts receivable or deferred revenue within our condensed consolidated financial statements. CilTIX , 2020 I Q4 and Full Year Financials
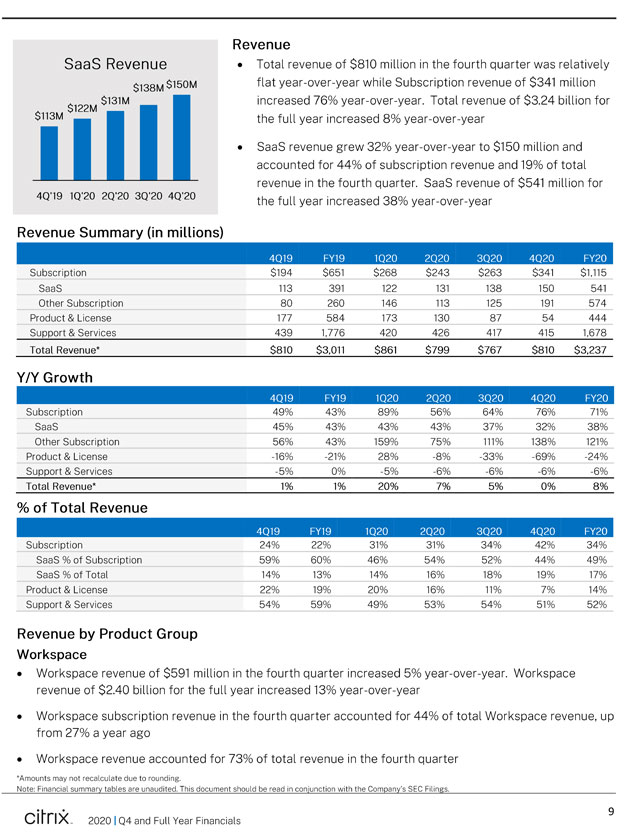
Revenue SaaS Revenue Total revenue of $810 million in the fourth quarter was relatively $138M flat year-over-year while Subscription revenue of $341 million M increased 76% year-over-year. Total revenue of $3.24 billion for S113M BB B the full year increased 8% year-over-year SaaS revenue grew 32% year-over-year to $150 million and accounted for 44% of subscription revenue and 19% of total revenue in the fourth quarter. SaaS revenue of $541 million for 4Q’19 1Q-20 2Q’2O 3Q’2O 4Q’2O the full year increased 38% year-over-year Revenue Summary (in millions) Subscription $194 $651 $268 $243 $263 $341 $1,115 SaaS 113 391 122 131 138 150 541 Other Subscription 80 260 146 113 125 191 574 Product & License 177 584 173 130 87 54 444_ Support & Services 439 1,776 420 426 417 415 1,678 Total Revenue* $810 $3,011 $861 $799 $767 $810 $3,237 Y/Y Growth Subscription 49% 43% 89% 56% 64% 76% 71% SaaS 45% 43% 43% 43% 37% 32% 38% Other Subscription 56% 43% 159% 75% 111% 138% 121% Product & License -16% -21% 28% -8% -33% -69% -24% Support & Services -5% 0% -5% -6% -6% -6% -6% Total Revenue* 1% 1% 20% 7% 5% 0% 8%_ % of Total Revenue Subscription 24% 22% 31% 31% 34% 42% 34%_ SaaS % of Subscription 59% 60% 46% 54% 52% 44% 49%_ SaaS % of Total 14% 13% 14% 16% 18% 19% 17%_ Product & License 22% 19% 20% 16% 11% 7% 14% Support & Services 54% 59% 49% 53% 54% 51% 52% Revenue by Product Group Workspace Workspace revenue of $591 million in the fourth quarter increased 5% year-over-year. Workspace revenue of $2.40 billion for the full year increased 13% year-over-year Workspace subscription revenue in the fourth quarter accounted for 44% of total Workspace revenue, up from 27% a year ago Workspace revenue accounted for 73% of total revenue in the fourth quarter *Amounts may not recalculate due to rounding. Note: Financial summary tables are unaudited. This document should be read in conjunction with the Company’s SEC Filings. CilTIX . 2020 I Q4 and Full Year Financials
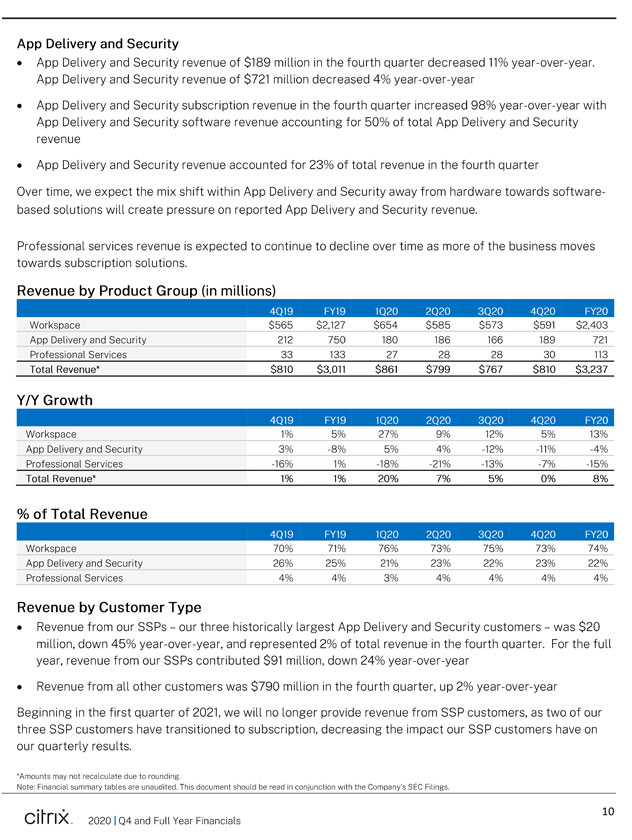
App Delivery and Security App Delivery and Security revenue of $189 million in the fourth quarter decreased 11% year-over-year. App Delivery and Security revenue of $721 million decreased 4% year-over-year App Delivery and Security subscription revenue in the fourth quarter increased 98% year-over-year with App Delivery and Security software revenue accounting for 50% of total App Delivery and Security revenue App Delivery and Security revenue accounted for 23% of total revenue in the fourth quarter Over time, we expect the mix shift within App Delivery and Security away from hardware towards softwarebased solutions will create pressure on reported App Delivery and Security revenue. Professional services revenue is expected to continue to decline over time as more of the business moves towards subscription solutions. Revenue by Product Group (in millions) Workspace $565 $2,127 $654 $585 $573 $591 $2,403 _ App Delivery and Security 212 750 180 186 166 189 721 Professional Services 33 133 27 28 28 30 113 Total Revenue* $810 $3,011 $861 $799 $767 $810 $3,237 Y/Y Growth Workspace 1% 5% 27% 9% 12% 5% \3% _ App Delivery and Security 3% -8% 5% 4% -12% -Tl% -A% Professional Services -16% 1% -18% -21% -13% -7% -15% Total Revenue* 1% 1% 20% 7% 5% 0% 8% % of Total Revenue Workspace 70% 71% 76% 73% 75% 73% 74% App Delivery and Security 26% 25% 21% 23% 22% 23% 22% Professional Services 4% 4% 3% 4% 4% 4% 4% Revenue by Customer Type Revenue from our SSPs—our three historically largest App Delivery and Security customers—was $20 million, down 45% year-over-year, and represented 2% of total revenue in the fourth quarter. For the full year, revenue from our SSPs contributed $91 million, down 24% year-over-year Revenue from all other customers was $790 million in the fourth quarter, up 2% year-over-year Beginning in the first quarter of 2021, we will no longer provide revenue from SSP customers, as two of our three SSP customers have transitioned to subscription, decreasing the impact our SSP customers have on our quarterly results. *Amounts may not recalculate due to rounding. Note: Financial summary tables are unaudited. This document should be read in conjunction with the Company’s SEC Filings. Ci Iri X . 2020 I Q4 and Full Year Financials
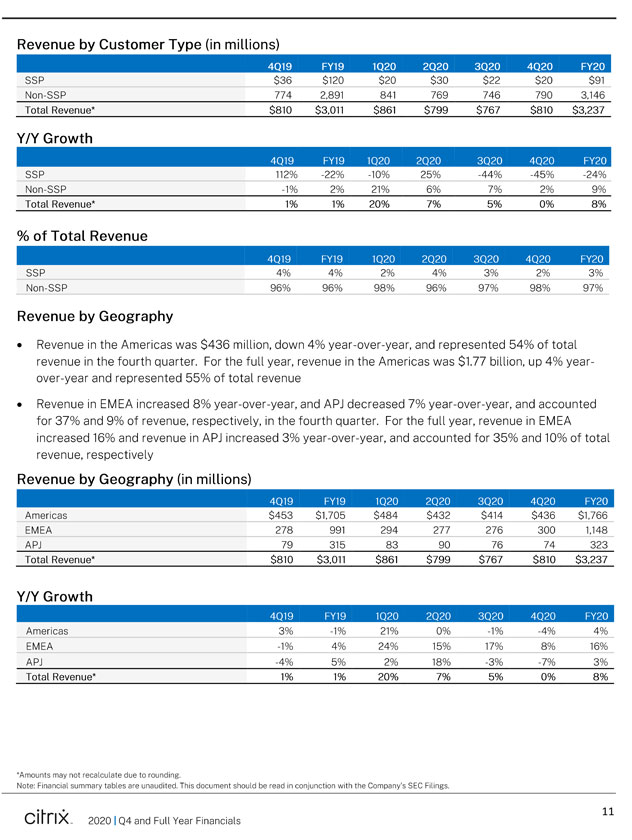
Revenue by Customer Type (in millions) SSP $36 $120 $20 $30 $22 $20 $91 Non-SSP 774 2,891 841 769 746 790 3,146 Total Revenue* $810 $3,011 $861 $799 $767 $810 $3,237 Y/Y Growth SSP 112% -22% -10% 25% -44% -45% -24% Non-SSP -1% 2% 21% 6% 7% 2% 9% Total Revenue* 1% 1% 20% 7% 5% 0% 8%_ % of Total Revenue SSP 4% 4% 2% 4% 3% 2% 3% Non-SSP 96% 96% 98% 96% 97% 98% 97% Revenue by Geography Revenue in the Americas was $436 million, down 4% year-over-year, and represented 54% of total revenue in the fourth quarter. For the full year, revenue in the Americas was $1.77 billion, up 4% year- over-year and represented 55% of total revenue Revenue in EMEA increased 8% year-over-year, and APJ decreased 7% year-over-year, and accounted for 37% and 9% of revenue, respectively, in the fourth quarter. For the full year, revenue in EMEA increased 16% and revenue in APJ increased 3% year-over-year, and accounted for 35% and 10% of total revenue, respectively Revenue by Geography (in millions) Americas $453 $1,705 $484 $432 $414 $436 $1,766 EMEA 278 991 294 277 276 300 1,148 APJ 79 315 83 90 76 74 323 Total Revenue* $810 $3,011 $861 $799 $767 $810 $3,237 Y/Y Growth Americas 3% -1% 21% 0% -1% -4% 4% EMEA -1% 4% 24% 15% 17% 8% 16% _ APJ -4% 5% 2% 18% -3% -7% 3% Total Revenue* 1% 1% 20% 7% 5% 0% 8% *Amounts may not recalculate due to rounding. Note: Financial summary tables are unaudited. This document should be read in conjunction with the Company’s SEC Filings. CilTIX» 2020 I Q4 and Full Year Financials
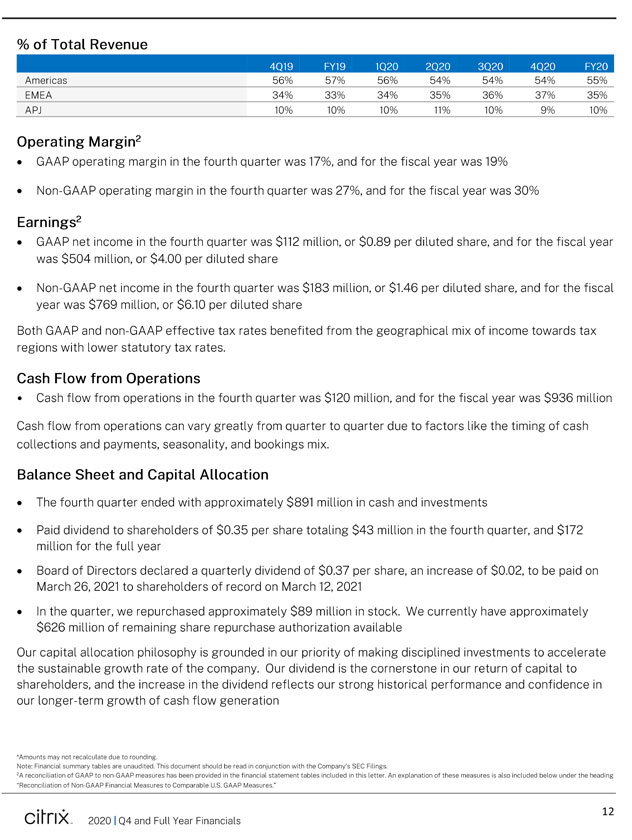
% of Total Revenue Americas 56% 57% 56% 54% 54% 54% 55% EMEA 34% 33% 34% 35% 36% 37% 35% APJ 10% 10% 10% 11% 10% 9% 10% Operating Margin2 GAAP operating margin in the fourth quarter was 17%, and for the fiscal year was 19% Non-GAAP operating margin in the fourth quarter was 27%, and for the fiscal year was 30% Earnings2 GAAP net income in the fourth quarter was $112 million, or $0.89 per diluted share, and for the fiscal year was $504 million, or $4.00 per diluted share Non-GAAP net income in the fourth quarter was $183 million, or $1.46 per diluted share, and for the fiscal year was $769 million, or $6.10 per diluted share Both GAAP and non-GAAP effective tax rates benefited from the geographical mix of income towards tax regions with lower statutory tax rates. Cash Flow from Operations Cash flow from operations in the fourth quarter was $120 million, and for the fiscal year was $936 million Cash flow from operations can vary greatly from quarter to quarter due to factors like the timing of cash collections and payments, seasonality, and bookings mix. Balance Sheet and Capital Allocation The fourth quarter ended with approximately $891 million in cash and investments Paid dividend to shareholders of $0.35 per share totaling $43 million in the fourth quarter, and $172 million for the full year Board of Directors declared a quarterly dividend of $0.37 per share, an increase of $0.02, to be paid on March 26, 2021 to shareholders of record on March 12, 2021 In the quarter, we repurchased approximately $89 million in stock. We currently have approximately $626 million of remaining share repurchase authorization available Our capital allocation philosophy is grounded in our priority of making disciplined investments to accelerate the sustainable growth rate of the company. Our dividend is the cornerstone in our return of capital to shareholders, and the increase in the dividend reflects our strong historical performance and confidence in our longer-term growth of cash flow generation ^Amounts may not recalculate due to rounding. Note: Financial summary tables are unaudited. This document should be read in conjunction with the Company’s SEC Filings. 2A reconciliation of GAAP to non-GAAP measures has been provided in the financial statement tables included in this letter. An explanation of these measures is also included below under the heading “Reconciliation of Non-GAAP Financial Measures to Comparable U.S. GAAP Measures.” Ci Iri X . 2020 I Q4 and Full Year Financials
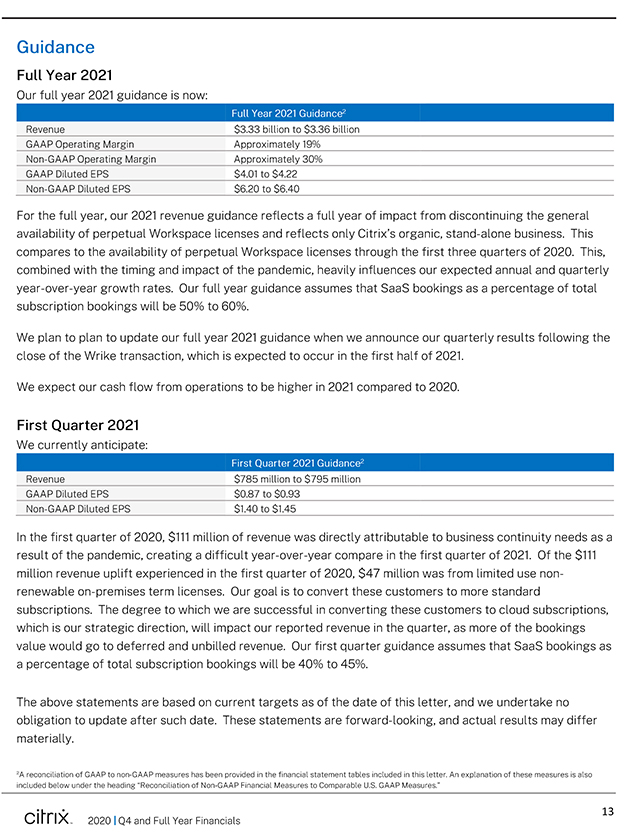
Guidance Full Year 2021 Our full year 2021 guidance is now: Full Year 2021 Guidance2 Revenue $3.33 billion to $3.36 billion GAA P Operating Margin Approximately 19% Non-GAA P Operating Margin Approximately 30% GAAP Diluted EPS $4.01 to $4.22 Non-GAAP Diluted EPS $6.20 to $6.40 For the full year, our 2021 revenue guidance reflects a full year of impact from discontinuing the general availability of perpetual Workspace licenses and reflects only Citrix’s organic, stand-alone business. This compares to the availability of perpetual Workspace licenses through the first three quarters of 2020. This, combined with the timing and impact of the pandemic, heavily influences our expected annual and quarterly year-over-year growth rates. Our full year guidance assumes that SaaS bookings as a percentage of total subscription bookings will be 50% to 60%. We plan to plan to update our full year 2021 guidance when we announce our quarterly results following the close of the Wrike transaction, which is expected to occur in the first half of 2021. We expect our cash flow from operations to be higher in 2021 compared to 2020. First Quarter 2021 We currently anticipate: First Quarter 2021 Guidance2 Revenue $785 million to $795 million GAAP Diluted EPS $0.87 to $0.93 Non-GAAP Diluted EPS $1.40 to $1.45 In the first quarter of 2020, $111 million of revenue was directly attributable to business continuity needs as a result of the pandemic, creating a difficult year-over-year compare in the first quarter of 2021. Of the $111 million revenue uplift experienced in the first quarter of 2020, $47 million was from limited use non-renewable on-premises term licenses. Our goal is to convert these customers to more standard subscriptions. The degree to which we are successful in converting these customers to cloud subscriptions, The degree to which we are successful in converting these customers to cloud subscriptions, which is our strategic direction, will impact our reported revenue in the quarter, as more of the bookings value would go to deferred and unbilled revenue. Our first quarter guidance assumes that SaaS bookings as a percentage of total subscription bookings will be 40% to 45%. The above statements are based on current targets as of the date of this letter, and we undertake no obligation to update after such date. These statements are forward-looking, and actual results may differ materially. 2 A reconciliation of GAAP to non-GAAP measures has been provided in the financial statement tables included in this letter. An explanation of these measures is also included below under the heading “Reconciliation of Non-GAAP Financial Measures to Comparable U.S. GAA P Measures.” citrixTM 2020 Q4 and Full Year Financials 13
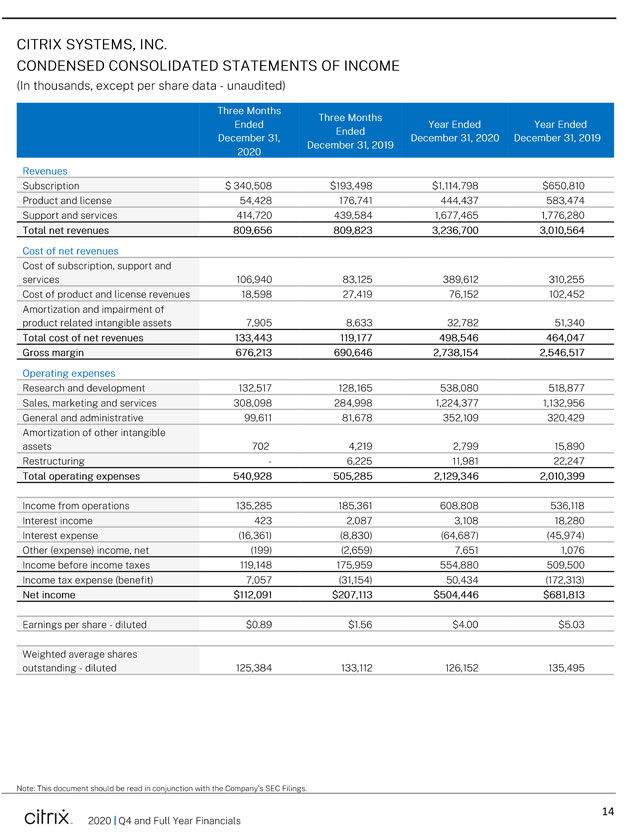
CITRIX SYSTEMS, INC. CONDENSED CONSOLIDATED STATEMENTS OF INCOME (In thousands, except per share data—unaudited) Revenues Subscription $340,508 $193,498 $1,114,798 $650,810 Product and license 54,428 176,741 444,437 583,474 Support and services 414,720 439,584 1,677,465 1,776,280 Total net revenues 809,656 809,823 3,236,700 3,010,564 Cost of net revenues Cost of subscription, support and services 106,940 83,125 389,612 310,255 Cost of product and license revenues 18,598 27,419 76,152 102,452 Amortization and impairment of product related intangible assets 7,905 8,633 32,782 51,340 Total cost of net revenues 133,443 119,177 498,546 464,047 Gross margin 676,213 690,646 2,738,154 2,546,517 Operating expenses Research and development 132,517 128,165 538,080 518,877 Sales, marketing and services 308,098 284,998 1,224,377 1,132,956 General and administrative 99,611 81,678 352,109 320,429 Amortization of other intangible assets 702 4,219 2,799 15,890 Restructuring—6,225 11,981 22,247 Total operating expenses 540,928 505,285 2,129,346 2,010,399 Income from operations 135,285 185,361 608,808 536,118 Interest income 423 2,087 3,108 18,280 Interest expense (16,361) (8,830) (64,687) (45,974) Other (expense) income, net (199) (2,659) 7,651 1,076 Income before income taxes 119,148 175,959 554,880 509,500 Income tax expense (benefit) 7,057 (31,154) 50,434 (172,313) Net income $112,091 $207,113 $504,446 $681,813 Earnings per share—diluted $0.89 $1.56 $4.00 $5.03 Weighted average shares outstanding-diluted 125,384 133,112 126,152 135,495 Note: This document should be read in conjunction with the Company’s SEC Filings. CilTIX . 2020 I Q4 and Full Year Financials
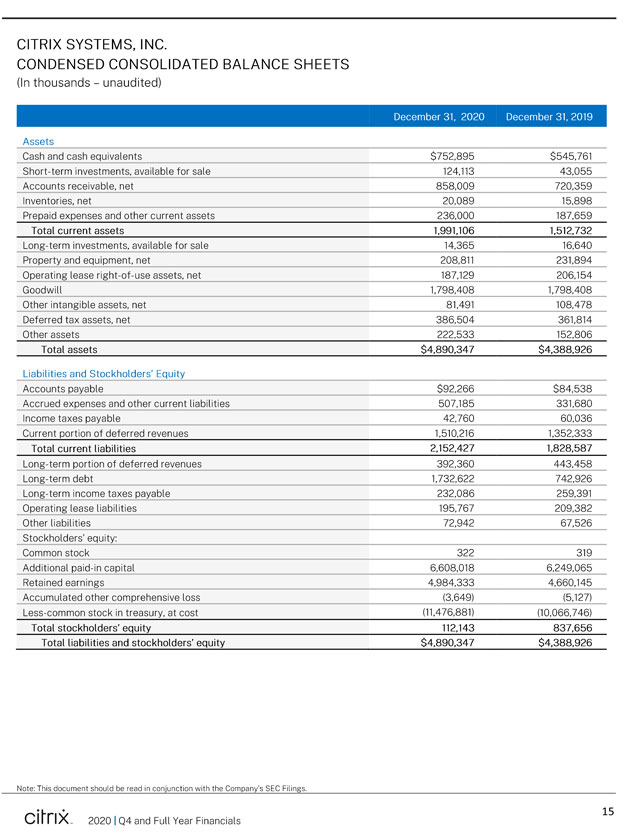
CITRIX SYSTEMS, INC. CONDENSED CONSOLIDATED BALANCE SHEETS (In thousands—unaudited) Assets Cash and cash equivalents $752,895 $545,761 Short-term investments, available for sale 124,113 43,055 Accounts receivable, net 858,009 720,359 Inventories, net 20,089 15,898 Prepaid expenses and other current assets 236,000 187,659 Total current assets 1,991,106 1,512,732 Long-term investments, available for sale 14,365 16,640 Property and equipment, net 208,811 231,894 Operating lease right-of-use assets, net 187,129 206,154 Goodwill 1,798,408 1,798,408 Other intangible assets, net 81,491 108,478 Deferred tax assets, net 386,504 361,814 Other assets 222,533 152,806 Total assets $4,890,347 $4,388,926 Liabilities and Stockholders’ Equity Accounts payable $92,266 $84,538 Accrued expenses and other current liabilities 507,185 331,680 Income taxes payable 42,760 60,036 Current portion of deferred revenues 1,510,216 1,352,333 Total current liabilities 2,152,427 1,828,587 Long-term portion of deferred revenues 392,360 443,458 Long-term debt 1,732,622 742,926 Long-term income taxes payable 232,086 259,391 Operating lease liabilities 195,767 209,382 Other liabilities 72,942 67,526 Stockholders’ equity: Common stock 322 319 Additional paid-in capital 6,608,018 6,249,065 Retained earnings 4,984,333 4,660,145 Accumulated other comprehensive loss (3,649) (5,127) Less-common stock in treasury, at cost (11,476,881) (10,066,746) Total stockholders’ equity 112,143 837,656 Total liabilities and stockholders’ equity $4,890,347 $4,388,926 Note: This document should be read in conjunction with the Company’s SEC Filings. CllTIX. 2020 I Q4 and Full Year Financials
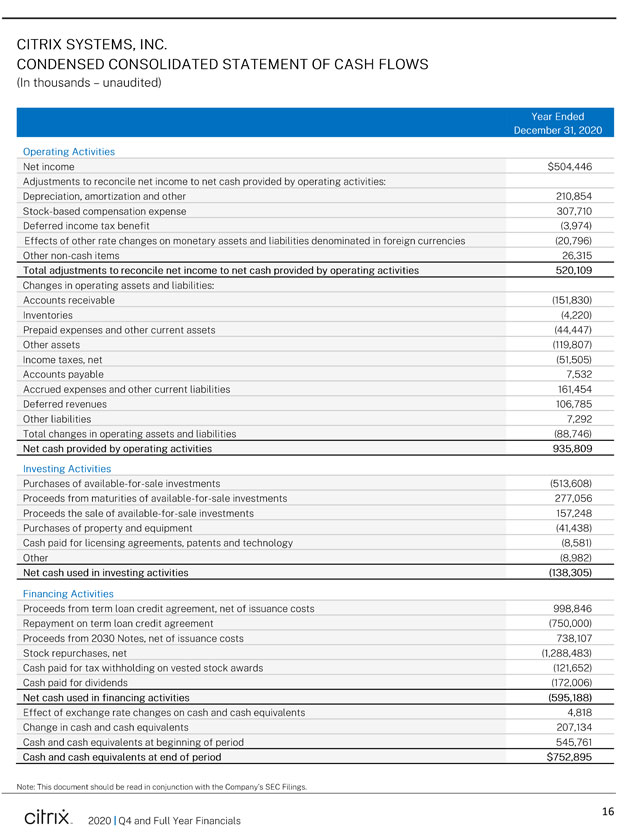
CITRIX SYSTEMS, INC. CONDENSED CONSOLIDATED STATEMENT OF CASH FLOWS (In thousands—unaudited) Operating Activities Net income $504,446 Adjustments to reconcile net income to net cash provided by operating activities: Depreciation, amortization and other 210,854 Stock-based compensation expense 307,710 Deferred income tax benefit (3,974) Effects of other rate changes on monetary assets and liabilities denominated in foreign currencies (20,796) Other non-cash items 26,315 Total adjustments to reconcile net income to net cash provided by operating activities 520,109 Changes in operating assets and liabilities: Accounts receivable (151,830) Inventories (4,220) Prepaid expenses and other current assets (44,447) Other assets (119,807) Income taxes, net (51,505) Accounts payable 7,532 Accrued expenses and other current liabilities 161,454 Deferred revenues 106,785 Other liabilities 7,292 Total changes in operating assets and liabilities (88,746) Net cash provided by operating activities 935,809 Investing Activities Purchases of available-for-sale investments (513,608) Proceeds from maturities of available-for-sale investments 277,056 Proceeds the sale of available-for-sale investments 157,248 Purchases of property and equipment (41,438) Cash paid for licensing agreements, patents and technology (8,581) Other (8,982) Net cash used in investing activities (138,305) Financing Activities Proceeds from term loan credit agreement, net of issuance costs 998,846 Repayment on term loan credit agreement (750,000) Proceeds from 2030 Notes, net of issuance costs 738,107 Stock repurchases, net (1,288,483) Cash paid for tax withholding on vested stock awards (121,652) Cash paid for dividends (172,006) Net cash used in financing activities (595,188) Effect of exchange rate changes on cash and cash equivalents 4,818 Change in cash and cash equivalents 207,134 Cash and cash equivalents at beginning of period 545,761 Cash and cash equivalents at end of period $752,895 Note: This document should be read in conjunction with the Company’s SEC Filings. CilTIX . 2020 I Q4 and Full Year Financials
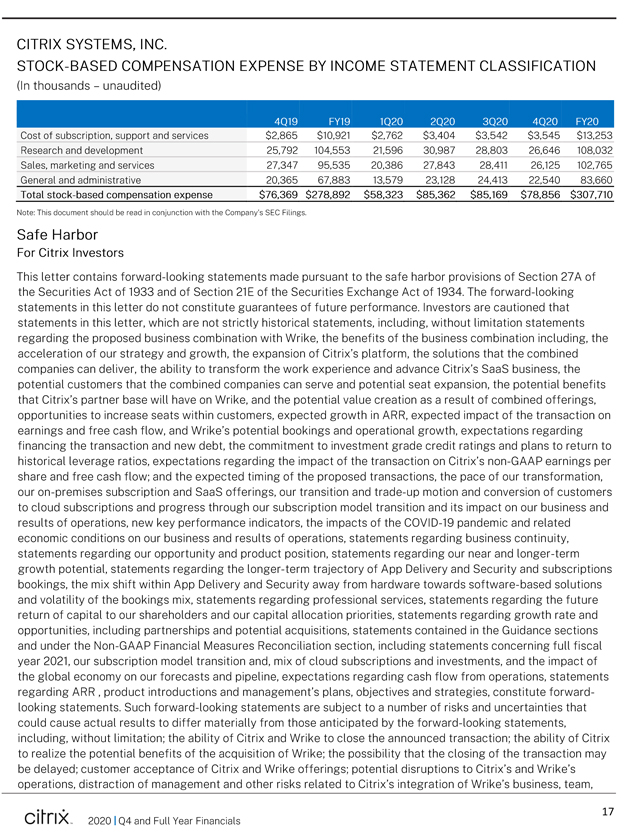
CITRIX SYSTEMS, INC. STOCK-BASED COMPENSATION EXPENSE BY INCOME STATEMENT CLASSIFICATIO (In thousands- unaudited) 4Q19 FY19 1Q20 2Q20 3Q20 4Q20 FY20 Cost of subscription, support and services $2,865 $10,921 $2,762 $3,404 $3,542 $3,545 $13,253 Research and development 25,792 104,553 21,596 30,987 28,803 26,646 108,032 Sales, marketing and services 27,347 95,535 20,386 27,843 28,411 26,125 102,765 General and adminrstratrve 20,365 67,883 13,579 23,128 24,413 22,540 83,660 Total stock-based compensation expense $76,369 $278,892 $58,323 $85,362 $85,169 $78,856 $307,710 Note: This document should be read in conjunction wtth the Company’s SEC Filings Safe Harbor For Citrix Investors This letter contains forward-looking statements made pursuant to the safe harbor provisions of Section 27A of the Securities Act of 1933 and of Section 21E of the Securities Exchange Act of 1934. The forward-looking statements in this letter do not constitute guarantees of future performance. Investors are cautioned that statements in this letter, which are not strictly historical statements, including, without limitation statements regarding the proposed business combination with Wrike, the benefits of the business combination including, the acceleration of our strategy and growth, the expansion of Citrix’s platform, the solutions that the combined companies can deliver, the ability to transform the work experience and advance Citrix’s SaaS business, the potentialcustomers that the combined companies can serve and potentialseat expansion, the potential benefits that Citrix’s partner base will have on Wrike, and the potentialvalue creation as a result of combined offerings, opportunities to increase seats within customers, expected growth in ARR, expected impact of the transaction on earnings and free cash flow, and Wrike’s potential bookings and operational growth, expectations regarding financing the transaction and new debt, the commitment to investment grade credit ratings and plans to return to historical leverage ratios, expectations regarding the impact of the transaction on Citrix’s non-GAAP earnings per share and free cash flow; and the expected timing of the proposed transactions, the pace of our transformation, our on-premises subscription and SaaS offerings, our transition and trade-up motion and conversion of customers to cloud subscr’rptions and progress through our subscription model transition and its impact on our business and results of operations, new key performance indicators, the impacts of the COVID-19 pandemic and related economic conditions on our business and results of operations, statements regarding business continuity, statements regarding our opportunity and product position, statements regarding our near and longer-term growth potential. statements regarding the longer-term trajectory of App Delivery and Security and subscriptions bookings, the mix shift within App Delivery and Security away from hardware towards software-based solutions and volatility of the bookings mix, statements regarding professional services, statements regarding the future return of capital to our shareholders and our capitalallocation priorities, statements regarding growth rate and opportunities, including partnerships and potential acquisitions, statements contained in the Guidance sections and under the Non-GAAP Financial Measures Reconciliation section, including statements concerning full fiscal year 2021, our subscription model transition and, mix of cloud subscriptions and investments, and the impact of the globaleconomy on our forecasts and pipeline, expectations regarding cash flow from operations, statements regarding ARR, product introductions and management’s plans, objectives and strategies, constitute forward looking statements. Such forward-looking statements are subject to a number of risks and uncertainties that could cause actual results to differ materially from those anticipated by the forward-looking statements, including, without limitation; the ability of Citrix and Wrike to close the announced transaction; the ability of Citrix to realize the potential benefits of the acquisition of Wrike; the possibility that the closing of the transaction may be delayed; customer acceptance of Citrix and Wrike offerings; potentialdisruptions to Citrix’s and Wrike’s operations, distraction of management and other risks related to Citrix’s integration of Wrike’s business, team, Citrix. 2020 IQ4 and Full Year Financials 17
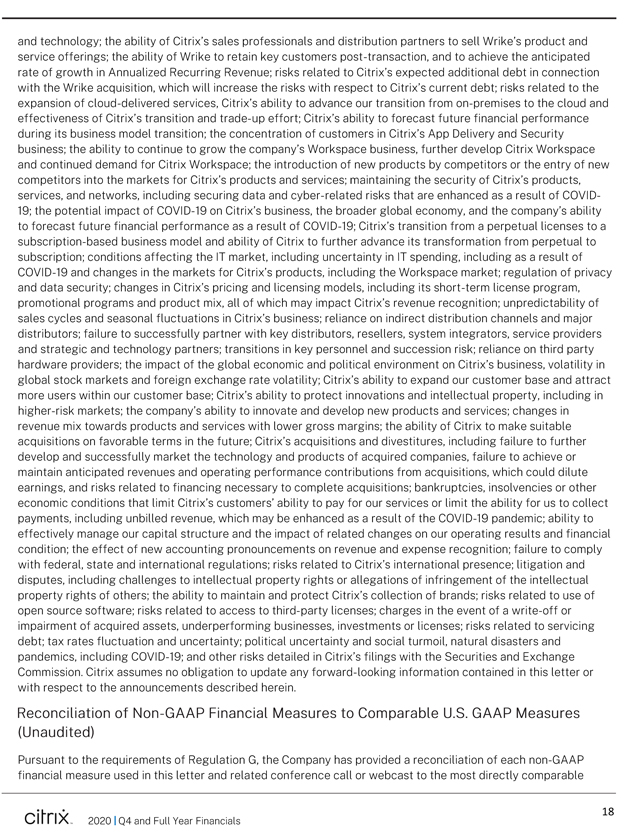
and technology; the ability of Citrix’s sales professionals and distribution partners to sell Wrike’s product and service offerings; the ability of Wrike to retain key customers post-transaction, and to achieve the anticipated rate of growth in Annualized Recurring Revenue; risks related to Citrix’s expected additional debt in connection with the Write acquisition, which will increase the risks with respect to Citrix’s current debt; risks related to the expansion of cloud-delivered services, Citrix’s ability to advance our transition from on-premises to the cloud and effectiveness of Citrix’s transition and trade-up effort; Citrix’s ability to forecast future financial performance during its business model transition; the concentration of customers in Citrix’s App Delivery and Security business; the ability to continue to grow the company’s Workspace business, further develop Citrix Workspace and continued demand for Citrix Workspace; the introduction of new products by competitors or the entry of new competitors into the markets for Citrix’s products and services; maintaining the security of Citrix’s products, services, and networks, including securing data and cyber-related risks that are enhanced as a result of COVID-19; the potential impact of COVID-19 on Citrix’s business, the broader global economy, and the company’s ability to forecast future financial performance as a result of COVI D-19; Citrix’s transition from a perpetual licenses to a subscription-based business model and ability of Citrix to further advance its transformation from perpetual to subscription; conditions affecting the IT market, including uncertainty in IT spending, including as a result of COVID-19 and changes in the markets for Citrix’s products, including the Workspace market; regulation of privacy and data security; changes in Citrix ‘s pricing and licensing models, including its short-term license program, promotional programs and product mix, all of which may impact Citrix’s revenue recognition; unpredictability of sales cycles and seasonal fluctuations in Citrix’s business; reliance on indirect distribution channels and major distributors; failure to successfully partner with key distributors, resellers, system integrators, service providers and strategic and technology partners; transitions in key personnel and succession risk; reliance on third party hardware providers; the impact of the global economic and political environment on Citrix’s business, volatility in global stock markets and foreign exchange rate volatility; Citrix’s ability to expand our customer base and attract more users within our customer base; Citrix’s ability to protect innovations and intellectual property, including in higher-risk markets; the company’s ability to innovate and develop new products and services; changes in revenue mix towards products and services with lower gross margins; the ability of Citrix to make suitable acquisitions on favorable terms in the future; Citrix’s acquisitions and divestitures, including failure to further develop and successfully market the technology and products of acquired companies, failure to achieve or maintain anticipated revenues and operating performance contributions from acquisitions, which could dilute earnings, and risks related to financing necessary to complete acquisitions; bankruptcies, insolvencies or other economic conditions that limit Citrix’s customers’ ability to pay for our services or limit the ability for us to collect payments, including unbilled revenue, which may be enhanced as a result of the COVID-19 pandemic; ability to effectively manage our capital structure and the impact of related changes on our operating results and financial condition; the effect of new accounting pronouncements on revenue and expense recognition; failure to comply with federal, state and international regulations; risks related to Citrix’s international presence; litigation and disputes, including challenges to intellectual property rights or allegations of infringement of the intellectual property rights of others; the ability to maintain and protect Citrix’s collection of brands; risks related to use of open source software; risks related to access to third-party licenses; charges in the event of a write-off or impairment of acquired assets, underperforming businesses, investments or licenses; risks related to servicing debt; tax rates fluctuation and uncertainty; political uncertainty and social turmoil, natural disasters and pandemics, including COVID-19; and other risks detailed in Citrix’s filings with the Securities and Exchange Commission. Citrix assumes no obligation to update any forward-looking information contained in this letter or with respect to the announcements described herein. Reconciliation of Non-GAAP Financial Measures to Comparable U.S. GAAP Measures (Unaudited) Pursuant to the requirements of Regulation G, the Company has provided a reconciliation of each non-GAAP financial measure used in this letter and related conference callor webcast to the most directly comparable
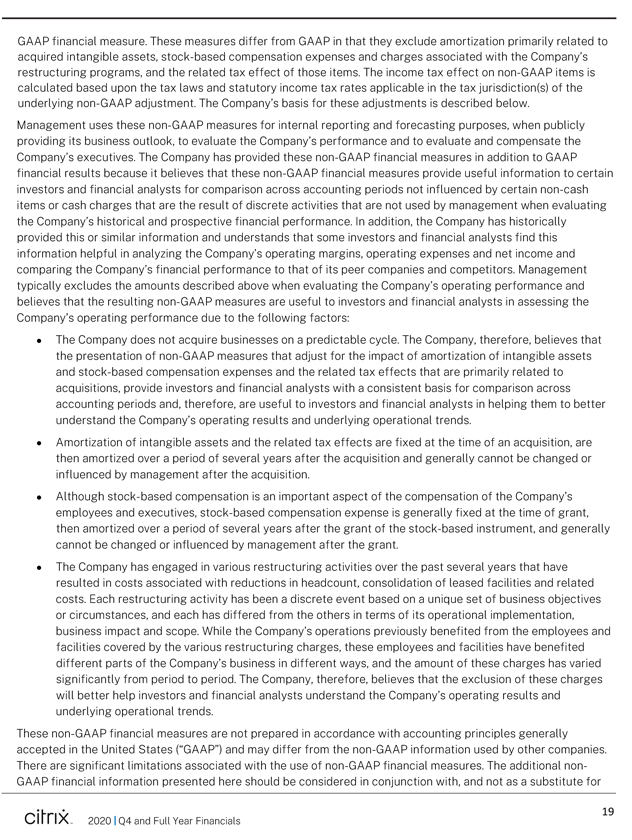
GAAP financial measure. These measures differ from GAAP in that they exclude amortization primarily related to acquired intangible assets, stock-based compensation expenses and charges associated with the Company’s restructuring programs, and the related tax effect of those items. The income tax effect on non-GAAP items is calculated based upon the tax laws and statutory income tax rates applicable in the tax jurisdiction(s) of the underlying non-GAAP adjustment. The Company’s basis for these adjustments is described below. Management uses these non-GAAP measures for internal reporting and forecasting purposes, when publicly providing its business outlook, to evaluate the Company’s performance and to evaluate and compensate the Company’s executives. The Company has provided these non-GAAP financial measures in addition to GAAP financial results because it believes that these non-GAAP financial measures provide useful information to certain investors and financial analysts for comparison across accounting periods not influenced by certain non-cash items or cash charges that are the result of discrete activities that are not used by management when evaluating the Company’s historical and prospective financial performance. In addition, the Company has historically provided this or similar information and understands that some investors and financial analysts find this information helpful in analyzing the Company’s operating margins, operating expenses and net income and comparing the Company’s financial performance to that of its peer companies and competitors. Management typically excludes the amounts described above when evaluating the Company’s operating performance and believes that the resulting non-GAAP measures are useful to investors and financial analysts in assessing the Company’s operating performance due to the following factors: The Company does not acquire businesses on a predictable cycle. The Company, therefore, believes that the presentation of non-GAAP measures that adjust for the impact of amortization of intangible assets and stock-based compensation expenses and the related tax effects that are primarily related to acquisitions, provide investors and financial analysts with a consistent basis for comparison across accounting periods and, therefore, are useful to investors and financial analysts in helping them to better understand the Company’s operating results and underlying operational trends. Amortization of intangible assets and the related tax effects are fixed at the time of an acquisition, are then amortized over a period of several years after the acquisition and generally cannot be changed or influenced by management after the acquisition. Although stock-based compensation is an important aspect of the compensation of the Company’s employees and executives, stock-based compensation expense is generally fixed at the time of grant, then amortized over a period of several years after the grant of the stock-based instrument, and generally cannot be changed or influenced by management after the grant. The Company has engaged in various restructuring activities over the past several years that have resulted in costs associated with reductions in headcount, consolidation of leased facilities and related costs. Each restructuring activity has been a discrete event based on a unique set of business objectives or circumstances, and each has differed from the others in terms of its operational implementation, business impact and scope. While the Company’s operations previously benefited from the employees and facilities covered by the various restructuring charges, these employees and facilities have benefited different parts of the Company’s business in different ways, and the amount of these charges has varied significantly from period to period. The Company, therefore, believes that the exclusion of these charges will better help investors and financial analysts understand the Company’s operating results and underlying operational trends. These non-GAAP financial measures are not prepared in accordance with accounting principles generally accepted in the United States (“GAAP”) and may differ from the non-GAAP information used by other companies. There are significant limitations associated with the use of non-GAAP financial measures. The additional non GAAP financial information presented here should be considered in conjunction with, and not as a substitute for 2020 I04 and Full Year Financials 19
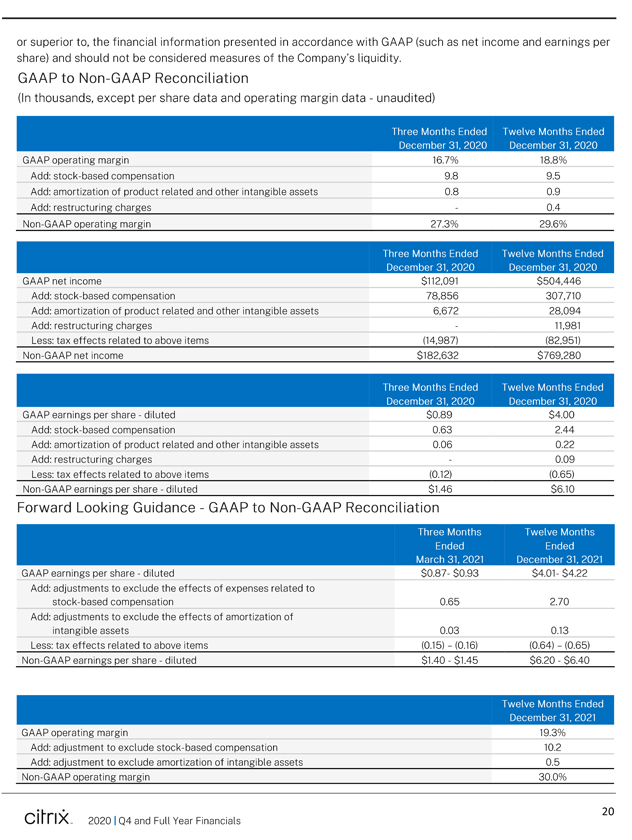
or superior to, the financial information presented in accordance with GAAP (such as net income and earnings per share) and should not be considered measures of the Company’s liquidity. GAAP to Non-GAAP Reconciliation (In thousands, except per share data and operating margin data - unaudited) GAAP operating margin 16.7% 18.8% Add: stock-based compensation 9.8 9.5 Add: amortization of product related and other intangible assets 0.8 0.9 Add: restructuring charges - 0.4 Non-GAAP operating margin 27.3% 29.6% GAAP net income $112,091 $504,446 Add: stock-based compensation 78,856 307,710 Add: amortization of product related and other intangible assets 6,672 28,094 Add: restructuring charges - 11,981 Less: tax effects related to above items (14,987) (82,951) Non-GAAP net income $182,632 $769,280 GAAP earnings per share - diluted $0.89 $4.00 Add: stock-based compensation 0.63 2.44 Add: amortization of product related and other intangible assets 0.06 0.22 Add: restructuring charges - 0.09 Less: tax effects related to above items (0.12) (0.65) Non-GAAP earnings per share - diluted $1.46 $6.10 Forward Looking Guidance - GAAP to Non-GAAP Reconciliation GAAP earnings per share - diluted $0.87-$0.93 $4.01-$4.22 Add: adjustments to exclude the effects of expenses related to stock-based compensation 0.65 2.70 Add: adjustments to exclude the effects of amortization of intangible assets 0.03 0.13 Less: tax effects related to above items (0.15) - (0.16) (0.64) - (0.65) Non-GAAP earnings per share - diluted $1.40 - $1.45 $6.20 - $6.40 GAAP operating margin 19.3% Add: adjustment to exclude stock-based compensation 10.2 Add: adjustment to exclude amortization of intangible assets 0.5 Non-GAAP operating margin 30.0% CilTIX . 2020 I Q4 and Full Year Financials

Disclaimer This letter references industry and market data and estimates from independent industry publications and surveys or other publicly available information. Such information may vary considerably from other information sources. This information involves a number of assumptions and limitations, and the Company has not independently verified the accuracy or completeness of the information. CllTIX . 2020 IQ4 and Full Year Financials