Attached files
| file | filename |
|---|---|
| EX-99.1 - EXHIBIT 99.1 - VARIAN MEDICAL SYSTEMS INC | tm2026337d2_ex99-1.htm |
| 8-K - FORM 8-K - VARIAN MEDICAL SYSTEMS INC | tm2026337-2_8k.htm |
Exhibit 99.2
 |
Third Quarter Fiscal Year 2020 August 2, 2020 Investor Relations |
 |
This presentation is intended exclusively for investors. It is not intended for use in Sales or Marketing. Forward-Looking Statements Except for historical information, this presentation contains forward-looking statements within the meaning of the Private Securities Litigation Reform Act of 1995. Statements concerning the company’s long-term growth and value creation strategies, future orders, backlog, liquidity, capital allocation priorities and the anticipated impact of the COVID-19 pandemic on our business; and any statements using the terms “could,” “believe,” “expect,” “promising,” “outlook,” “should,” “well-positioned,” “will” or similar statements are forward-looking statements that involve risks and uncertainties that could cause the company’s actual results to differ materially from those anticipated. Such risks and uncertainties include the future impact of the COVID-19 pandemic on our business, including but not limited to, the impact on our workforce, operations, supply chain, demand for our products and services, and our financial results and condition; our ability to successfully manage the challenges associated with the COVID-19 pandemic; our ability to achieve expected synergies from acquisitions; risks associated with integrating recent acquisitions; global economic conditions and changes to trends for cancer treatment regionally; currency exchange rates and tax rates; the impact of the Tax Cuts and Jobs Act; the impact of the Affordable Health Care for America Act (including excise taxes on medical devices) and any further healthcare reforms (including changes to Medicare and Medicaid), and/or changes in third-party reimbursement levels; recent and potential future tariffs or a global trade war; demand for and delays in delivery of the company’s products; the company’s ability to develop, commercialize and deploy new products; the company’s ability to meet Food and Drug Administration (FDA) and other regulatory requirements, regulations or procedures; changes in regulatory environments; risks associated with the company providing financing for the construction and start-up operations of particle therapy centers, challenges associated with commercializing the company’s proton solutions business; challenges to public tender awards and the loss of such awards or other orders; the effect of adverse publicity; the company’s reliance on sole or limited-source suppliers; the company’s ability to maintain or increase margins; the impact of competitive products and pricing; the potential loss of key distributors or key personnel; challenges related to entering into new business lines; and the other risks listed from time to time in the company’s filings with the Securities and Exchange Commission, which by this reference are incorporated herein. For additional information concerning factors that could cause actual results and events to differ materially from those projected herein, please refer to our Form 10-K for the year ended September 27, 2019 and subsequent Forms 8-K and 10-Q filed with the Securities and Exchange Commission. The company assumes no obligation to update or revise the forward-looking statements in this release because of new information, future events, or otherwise. Reconciliations to GAAP financials can be found in our earnings press release at www.varian.com/investors and the appendix to this presentation. Varian has not filed its Form 10-Q for the quarter ended July 3, 2020. As a result, all financial results described here should be considered preliminary, and are subject to change to reflect any necessary adjustments, completion of purchase accounting, or changes in accounting estimates, that are identified prior to the time the company files the Form 10-Q. Medical Advice Disclaimer Varian as a medical device manufacturer cannot and does not recommend specific treatment approaches. Individual treatment results may vary. 2 |
 |
Agenda Q3 FY 2020 earnings 1. Third Quarter Overview 2. Total Company Performance 3. Segment Performance 4. Appendix VARIAN CONFIDENTIAL/ PROPRIETARY: DISCLOSED SOLELY FOR IMMEDIATE RECIPIENT ONLY |
 |
ThirdQuarter Overview |
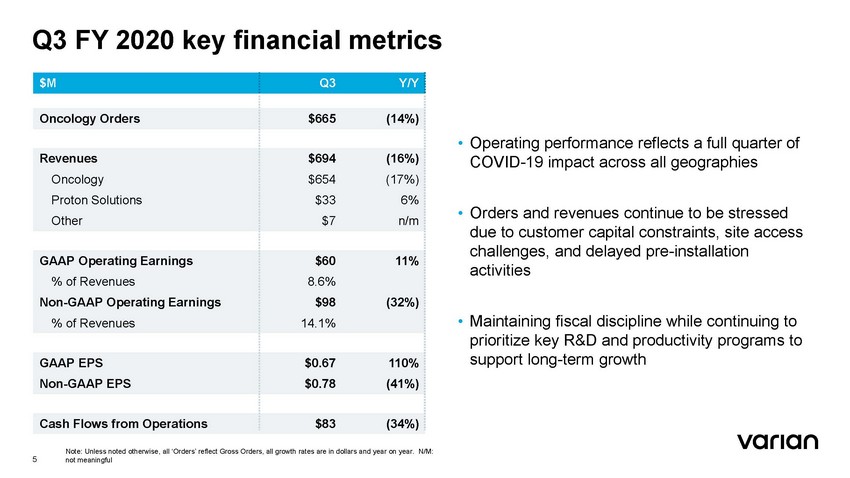 |
Q3 FY 2020 key financial metrics • Operating performance reflects a full quarter of COVID-19 impact across all geographies • Orders and revenues continue to be stressed due to customer capital constraints, site access challenges, and delayed pre-installation activities • Maintaining fiscal discipline while continuing to prioritize key R&D and productivity programs to support long-term growth Note: Unless noted otherwise, all ‘Orders’ reflect Gross Orders, all growth rates are in dollars and year on year. N/M: not meaningful 5 $M Q3Y/Y Oncology Orders $665(14%) Revenues Oncology Proton Solutions Other $694(16%) $654(17%) $336% $7n/m GAAP Operating Earnings % of Revenues Non-GAAP Operating Earnings % of Revenues $6011% 8.6% $98(32%) 14.1% GAAP EPS Non-GAAP EPS $0.67110% $0.78(41%) Cash Flows from Operations $83(34%) |
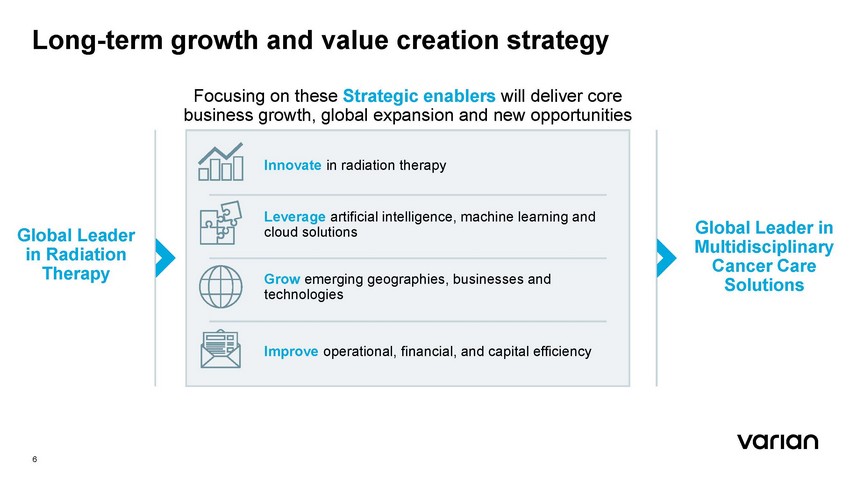 |
Long-term growth and value creation strategy Focusing on these Strategic enablers will deliver core opportunities business growth, global expansion and new Global Leader in Multidisciplinary Cancer Care Solutions Global Leader in Radiation Therapy 6 Innovate in radiation therapy Leverage artificial intelligence, machine learning and cloud solutions Grow emerging geographies, businesses and technologies Improve operational, financial, and capital efficiency |
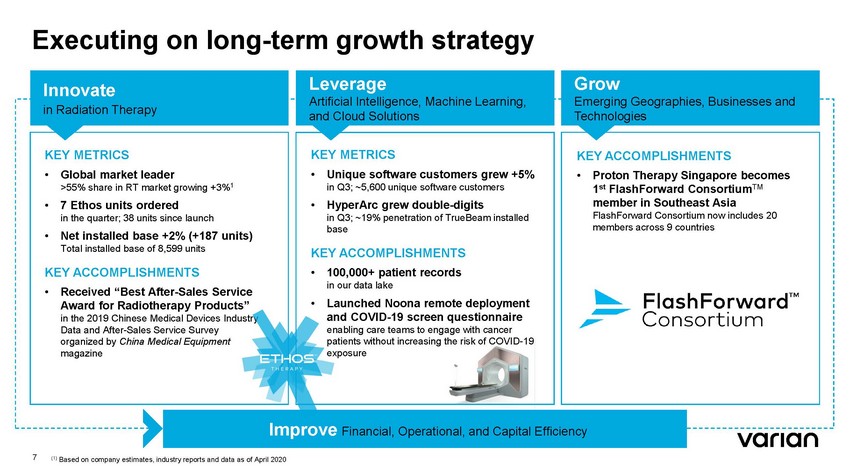 |
Executing on long-term growth strategy Technologies Improve Financial, Operational, and Capital Efficiency 7 (1) Based on company estimates, industry reports and data as of April 2020 Innovate Leverage Grow in Radiation Therapy Artificial Intelligence, Machine Learning, and Cloud Solutions Emerging Geographies, Businesses and in Q3; ~19% penetration of TrueBeam installed and COVID-19 screen questionnaire KEY METRICS •Unique software customers grew +5% in Q3; ~5,600 unique software customers •HyperArc grew double-digits base KEY ACCOMPLISHMENTS •100,000+ patient records in our data lake •Launched Noona remote deployment enabling care teams to engage with cancer patients without increasing the risk of COVID-19 exposure KEY METRICS •Global market leader >55% share in RT market growing +3%1 •7 Ethos units ordered in the quarter; 38 units since launch •Net installed base +2% (+187 units) Total installed base of 8,599 units KEY ACCOMPLISHMENTS •Received “Best After-Sales Service Award for Radiotherapy Products” in the 2019 Chinese Medical Devices Industry Data and After-Sales Service Survey organized by China Medical Equipment magazine KEY ACCOMPLISHMENTS •Proton Therapy Singapore becomes 1st FlashForward ConsortiumTM member in Southeast Asia FlashForward Consortium now includes 20 members across 9 countries |
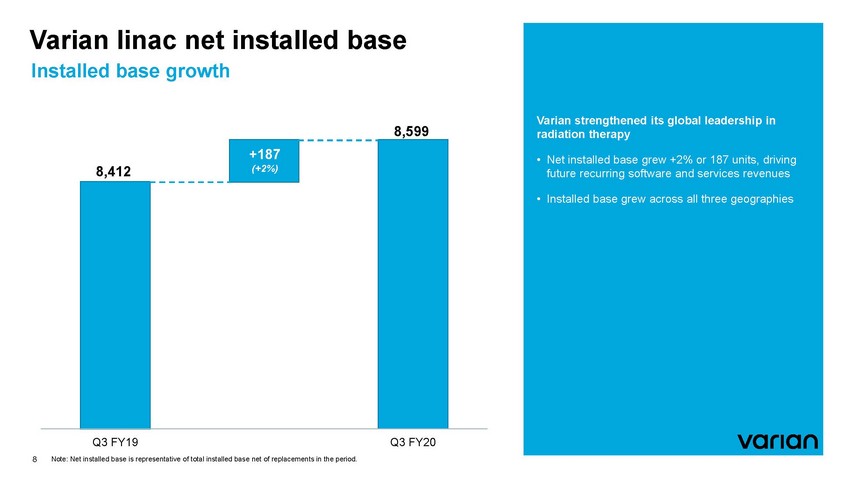 |
Varian Installed linac net installed base base growth 8,599 (+2%) Q3 FY19 Note: Net installed base is representative of total installed base net of replacements in the period. Q3 FY20 8 8,412 +187 Varian strengthened its global leadership in radiation therapy • Net installed base grew +2% or 187 units, driving future recurring software and services revenues • Installed base grew across all three geographies |
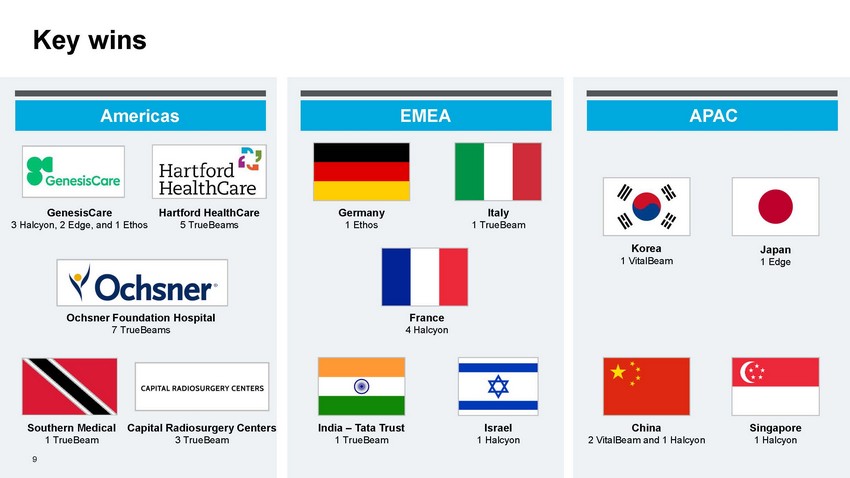 |
Key wins GenesisCare 3 Halcyon, 2 Edge, and 1 Ethos Hartford HealthCare 5 TrueBeams Germany 1 Ethos Italy 1 TrueBeam Korea 1 VitalBeam Japan 1 Edge Ochsner Foundation Hospital 7 TrueBeams France 4 Halcyon Southern Medical Capital Radiosurgery Centers India – Tata Trust 1 TrueBeam Israel 1 Halcyon China 2 VitalBeam and 1 Halcyon Singapore 1 Halcyon 1 Tr VARIAN CONFIDENTIAL – INTERNAL USE ONLY ueBeam 3 TrueBeam 9 APAC EMEA Americas |
 |
TotalCompany Performance |
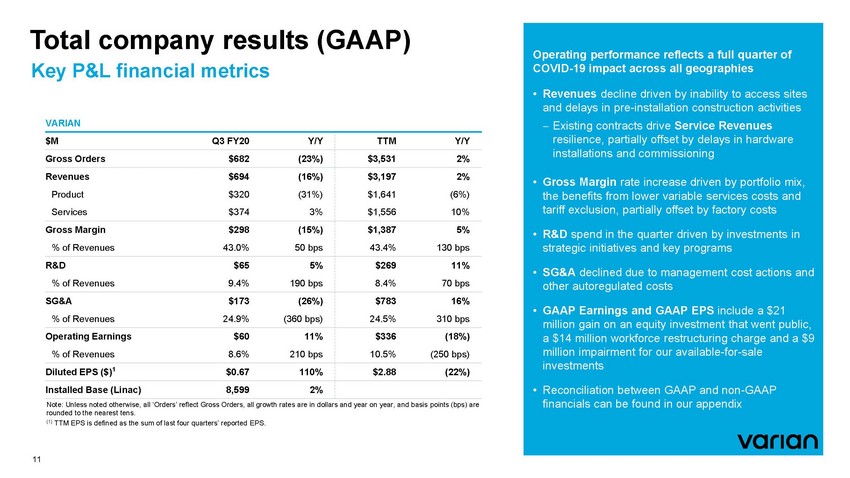 |
Total company results (GAAP) Key P&L financial metrics VARIAN Note: Unless noted otherwise, all ‘Orders’ reflect Gross Orders, all growth rates are in dollars and year on year, and basis points (bps) are rounded to the nearest tens. (1) TTM EPS is defined as the sum of last four quarters’ reported EPS. 11 $MQ3 FY20Y/Y TTMY/Y Gross Orders$682(23%) $3,5312% Revenues$694(16%) Product$320(31%) Services$3743% $3,1972% $1,641(6%) $1,55610% Gross Margin$298(15%) % of Revenues43.0%50 bps $1,3875% 43.4%130 bps R&D$655% % of Revenues9.4%190 bps $26911% 8.4%70 bps SG&A$173(26%) % of Revenues24.9%(360 bps) $78316% 24.5%310 bps Operating Earnings$6011% % of Revenues8.6%210 bps $336(18%) 10.5%(250 bps) Diluted EPS ($)1$0.67110% $2.88(22%) Installed Base (Linac)8,5992% Operating performance reflects a full quarter of COVID-19 impact across all geographies • Revenues decline driven by inability to access sites and delays in pre-installation construction activities − Existing contracts drive Service Revenues resilience, partially offset by delays in hardware installations and commissioning • Gross Margin rate increase driven by portfolio mix, the benefits from lower variable services costs and tariff exclusion, partially offset by factory costs • R&D spend in the quarter driven by investments in strategic initiatives and key programs • SG&A declined due to management cost actions and other autoregulated costs • GAAP Earnings and GAAP EPS include a $21 million gain on an equity investment that went public, a $14 million workforce restructuring charge and a $9 million impairment for our available-for-sale investments • Reconciliation between GAAP and non-GAAP financials can be found in our appendix |
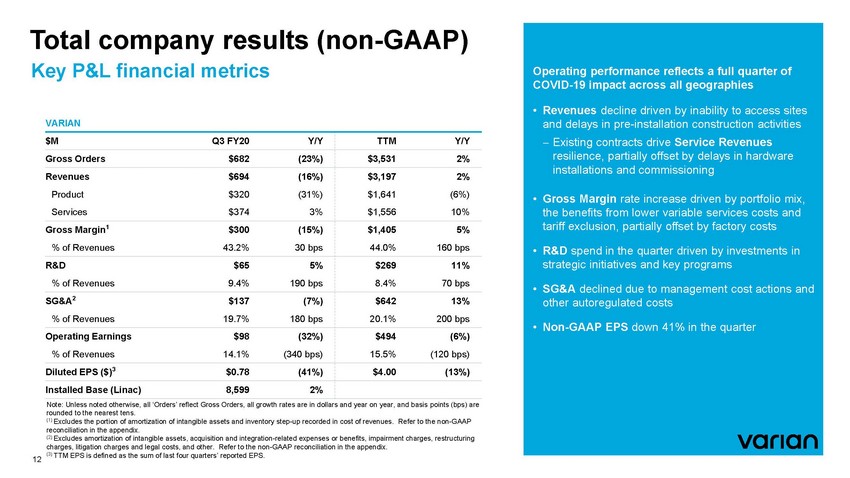 |
Total company results (non-GAAP) Key P&L financial metrics VARIAN Note: Unless noted otherwise, all ‘Orders’ reflect Gross Orders, all growth rates are in dollars and year on year, and basis points (bps) are rounded to the nearest tens. (1) Excludes the portion of amortization of intangible assets and inventory step-up recorded in cost of revenues. Refer to the non-GAAP reconciliation in the appendix. (2) Excludes amortization of intangible assets, acquisition and integration-related expenses or benefits, impairment charges, restructuring charges, litigation charges and legal costs, and other. Refer to the non-GAAP reconciliation in the appendix. (3) TTM EPS is defined as the sum of last four quarters’ reported EPS. 12 $MQ3 FY20Y/Y TTMY/Y Gross Orders$682(23%) $3,5312% Revenues$694(16%) Product$320(31%) Services$3743% $3,1972% $1,641(6%) $1,55610% Gross Margin1$300(15%) % of Revenues43.2%30 bps $1,4055% 44.0%160 bps R&D$655% % of Revenues9.4%190 bps $26911% 8.4%70 bps SG&A2$137(7%) % of Revenues19.7%180 bps $64213% 20.1%200 bps Operating Earnings$98(32%) % of Revenues14.1%(340 bps) $494(6%) 15.5%(120 bps) Diluted EPS ($)3$0.78(41%) $4.00(13%) Installed Base (Linac)8,5992% Operating performance reflects a full quarter of COVID-19 impact across all geographies • Revenues decline driven by inability to access sites and delays in pre-installation construction activities − Existing contracts drive Service Revenues resilience, partially offset by delays in hardware installations and commissioning • Gross Margin rate increase driven by portfolio mix, the benefits from lower variable services costs and tariff exclusion, partially offset by factory costs • R&D spend in the quarter driven by investments in strategic initiatives and key programs • SG&A declined due to management cost actions and other autoregulated costs • Non-GAAP EPS down 41% in the quarter |
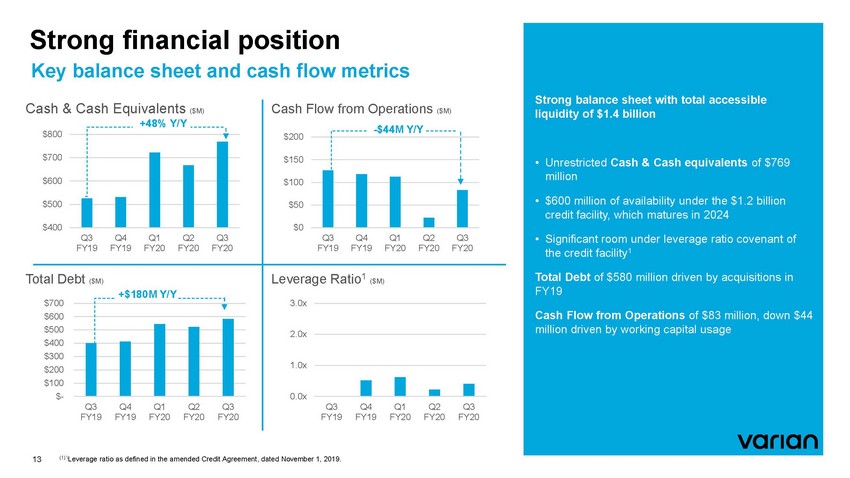 |
Strong financial position Key balance sheet and cash flow metrics Cash & Cash Equivalents ($M) FY19 FY19 FY20 FY20 FY20 T +$180M Y/Y 13 (1) \Leverage ratio as defined in the amended Credit Agreement, dated November 1, 2019. +48% Y/Y $800 $700 $600 $500 $400 Q3Q4Q1Q2Q3 FY19FY19FY20FY20FY20 Cash Flow from Operations ($M) $200-$44M Y/Y $150 $100 $50 $0 Q3Q4Q1Q2Q3 otal Debt ($M) $700 $600 $500 $400 $300 $200 $100 $-Q3Q4Q1Q2Q3 FY19FY19FY20FY20FY20 Leverage Ratio1 ($M) 3.0x 2.0x 1.0x 0.0x Q3Q4Q1Q2Q3 FY19FY19FY20FY20FY20 Strong balance sheet with total accessible liquidity of $1.4 billion • Unrestricted Cash & Cash equivalents of $769 million • $600 million of availability under the $1.2 billion credit facility, which matures in 2024 • Significant room under leverage ratio covenant of the credit facility1 Total Debt of $580 million driven by acquisitions in FY19 Cash Flow from Operations of $83 million, down $44 million driven by working capital usage |
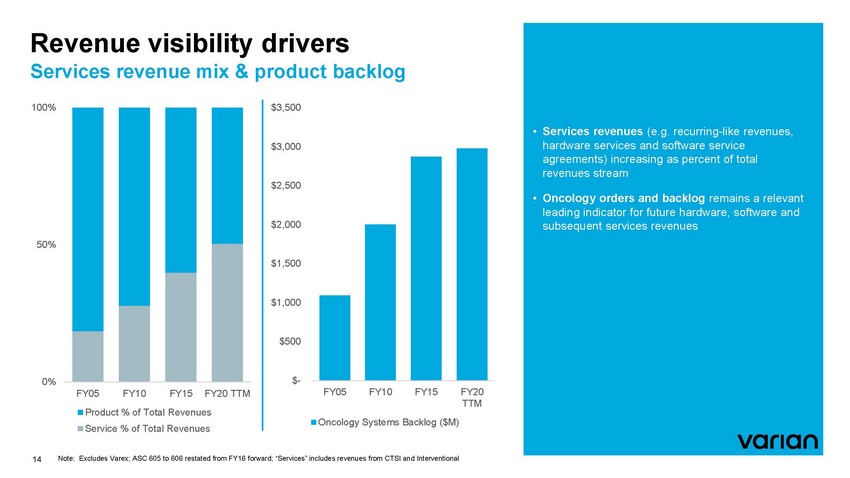 |
Revenue visibility drivers Services revenue mix & product backlog 100% $3,500 $3,000 $2,500 $2,000 50% $1,500 $1,000 $500 $-0% FY05 FY10 FY15 FY20 TTM FY05 FY10 FY15 FY20 TTM Product % of Total Revenues Service % of Total Revenues Oncology Systems Backlog ($M) Note: Excludes Varex; ASC 605 to 606 restated from FY16 forward; “Services” includes revenues from CTSI and Interventional 14 • Services revenues (e.g. recurring-like revenues, hardware services and software service agreements) increasing as percent of total revenues stream • Oncology orders and backlog remains a relevant leading indicator for future hardware, software and subsequent services revenues |
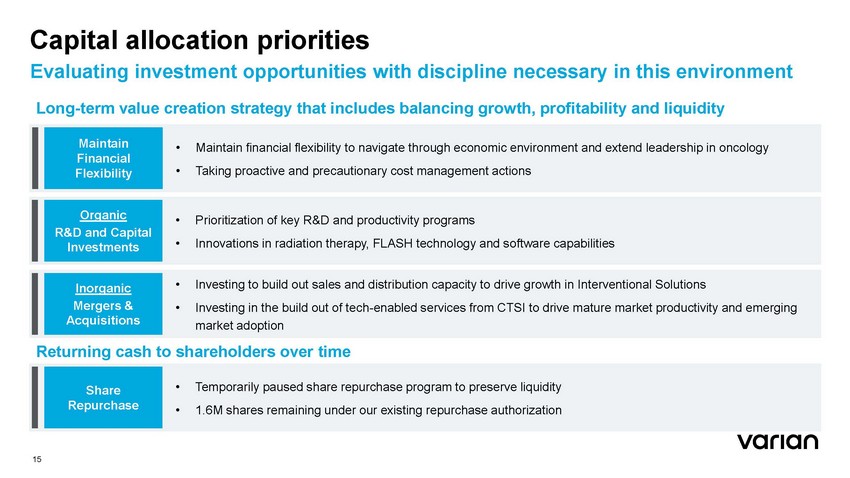 |
Capital allocation priorities Evaluating investment opportunities with discipline necessary in this environment Long-term value creation strategy that includes balancing growth, profitability and liquidity Returning cash to shareholders over time 15 •Temporarily paused share repurchase program to preserve liquidity •1.6M shares remaining under our existing repurchase authorization Share Repurchase •Investing to build out sales and distribution capacity to drive growth in Interventional Solutions •Investing in the build out of tech-enabled services from CTSI to drive mature market productivity and emerging market adoption Inorganic Mergers & Acquisitions •Prioritization of key R&D and productivity programs •Innovations in radiation therapy, FLASH technology and software capabilities Organic R&D and Capital Investments Q2 upMdaianttaein•Maintain financial flexibility to navigate through economic environment and extend leadership in oncology •Taking proactive and precautionary cost management actions Financial Flexibility |
 |
Segment Performance |
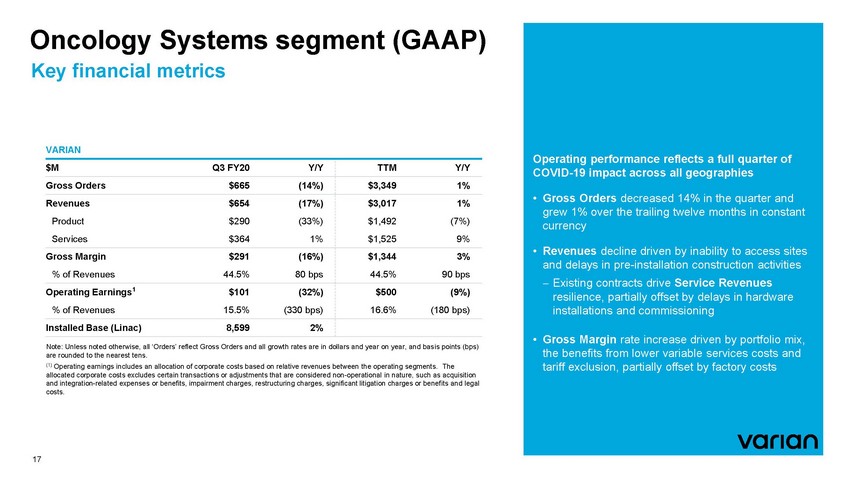 |
Oncology Key financial Systems metrics segment (GAAP) VARIAN Operating Earnings $101 (32%) Note: Unless noted otherwise, all ‘Orders’ reflect Gross Orders and all growth rates are in dollars and year on year, and basis points (bps) are rounded to the nearest tens. (1) Operating earnings includes an allocation of corporate costs based on relative revenues between the operating segments. The allocated corporate costs excludes certain transactions or adjustments that are considered non-operational in nature, such as acquisition and integration-related expenses or benefits, impairment charges, restructuring charges, significant litigation charges or benefits and legal costs. 17 $MQ3 FY20Y/Y TTMY/Y Gross Orders$665(14%) $3,3491% Revenues$654(17%) Product$290(33%) Services$3641% $3,0171% $1,492(7%) $1,5259% Gross Margin$291(16%) % of Revenues44.5%80 bps $1,3443% 44.5%90 bps 1 % of Revenues15.5%(330 bps) $500(9%) 16.6%(180 bps) Installed Base (Linac)8,5992% Operating performance reflects a full quarter of COVID-19 impact across all geographies • Gross Orders decreased 14% in the quarter and grew 1% over the trailing twelve months in constant currency • Revenues decline driven by inability to access sites and delays in pre-installation construction activities − Existing contracts drive Service Revenues resilience, partially offset by delays in hardware installations and commissioning • Gross Margin rate increase driven by portfolio mix, the benefits from lower variable services costs and tariff exclusion, partially offset by factory costs |
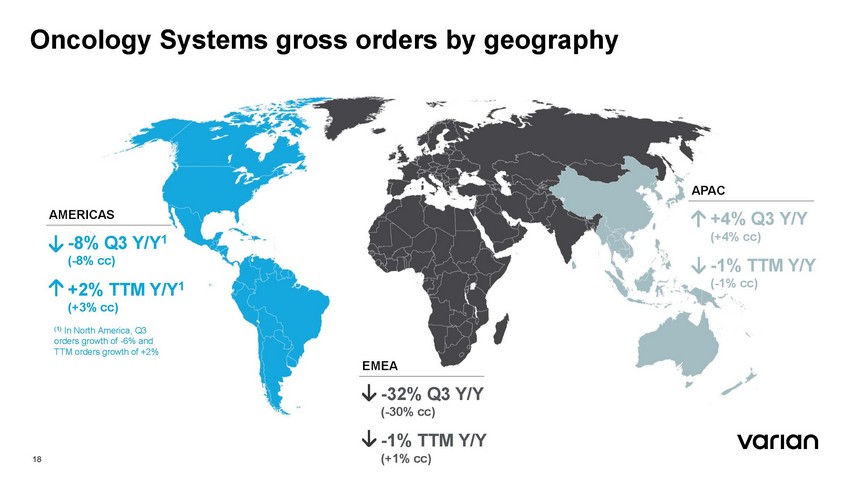 |
Oncology Systems gross orders by geography APAC AMERICAS +4% Q3 Y/Y (+4% cc) -8% Q3 Y/Y1 (-8% cc) -1% TTM (-1% cc) Y/Y +2% TTM Y/Y1 (+3% cc) (1) In North America, Q3 orders growth of -6% and TTM orders growth of +2% EMEA -32% Q3 Y/Y (-30% cc) -1% TTM Y/Y (+1% cc) 18 |
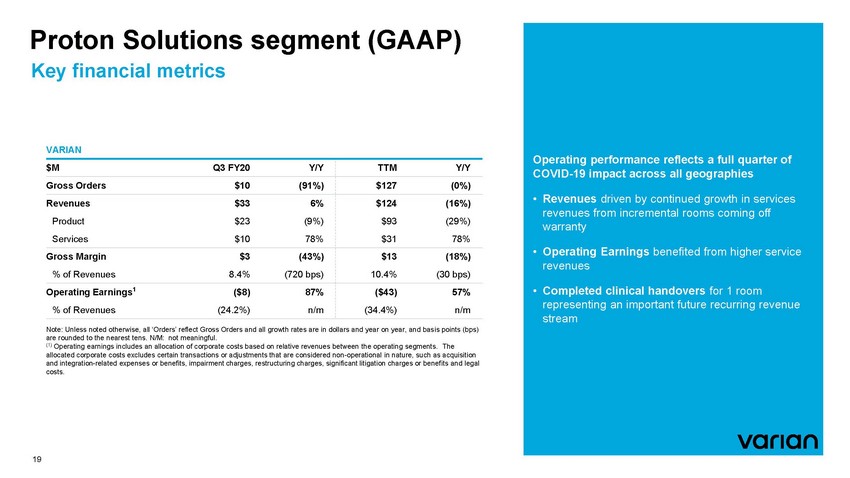 |
Proton Solutions segment (GAAP) Key financial metrics VARIAN Note: Unless noted otherwise, all ‘Orders’ reflect Gross Orders and all growth rates are in dollars and year on year, and basis points (bps) are rounded to the nearest tens. N/M: not meaningful. (1) Operating earnings includes an allocation of corporate costs based on relative revenues between the operating segments. The allocated corporate costs excludes certain transactions or adjustments that are considered non-operational in nature, such as acquisition and integration-related expenses or benefits, impairment charges, restructuring charges, significant litigation charges or benefits and legal costs. 19 $MQ3 FY20Y/Y TTMY/Y Gross Orders$10(91%) $127(0%) Revenues$336% Product$23(9%) Services$10 78% $124(16%) $93(29%) $3178% Gross Margin$3(43%) % of Revenues8.4%(720 bps) $13(18%) 10.4%(30 bps) Operating Earnings1($8)87% % of Revenues(24.2%)n/m ($43)57% (34.4%)n/m Operating performance reflects a full quarter of COVID-19 impact across all geographies • Revenues driven by continued growth in services revenues from incremental rooms coming off warranty • Operating Earnings benefited from higher service revenues • Completed clinical handovers for 1 room representing an important future recurring revenue stream |
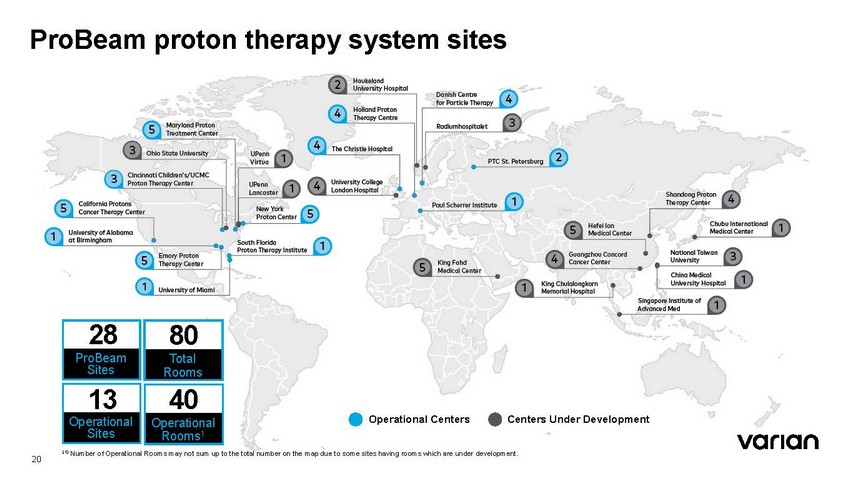 |
ProBeam proton therapy system sites Sites Operational Centers Centers Under Development Rooms1 (1) Number of Operational Rooms may not sum up to the total number on the map due to some sites having rooms which are under development. 20 28 80 Total Rooms ProBeam 40 Operational 13 Operational Sites |
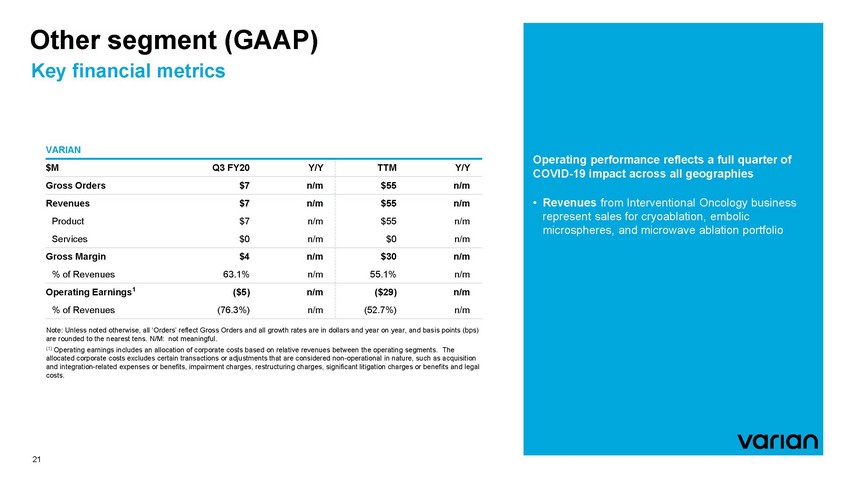 |
Other segment (GAAP) Key financial metrics VARIAN Note: Unless noted otherwise, all ‘Orders’ reflect Gross Orders and all growth rates are in dollars and year on year, and basis points (bps) are rounded to the nearest tens. N/M: not meaningful. (1) Operating earnings includes an allocation of corporate costs based on relative revenues between the operating segments. The allocated corporate costs excludes certain transactions or adjustments that are considered non-operational in nature, such as acquisition and integration-related expenses or benefits, impairment charges, restructuring charges, significant litigation charges or benefits and legal costs. 21 $MQ3 FY20Y/Y TTMY/Y Gross Orders$7n/m $55n/m Revenues$7n/m Product$7n/m Services$0n/m $55n/m $55n/m $0n/m Gross Margin$4n/m % of Revenues63.1%n/m $30n/m 55.1%n/m Operating Earnings1($5)n/m % of Revenues(76.3%)n/m ($29)n/m (52.7%)n/m Operating performance reflects a full quarter of COVID-19 impact across all geographies • Revenues from Interventional Oncology business represent sales for cryoablation, embolic microspheres, and microwave ablation portfolio |
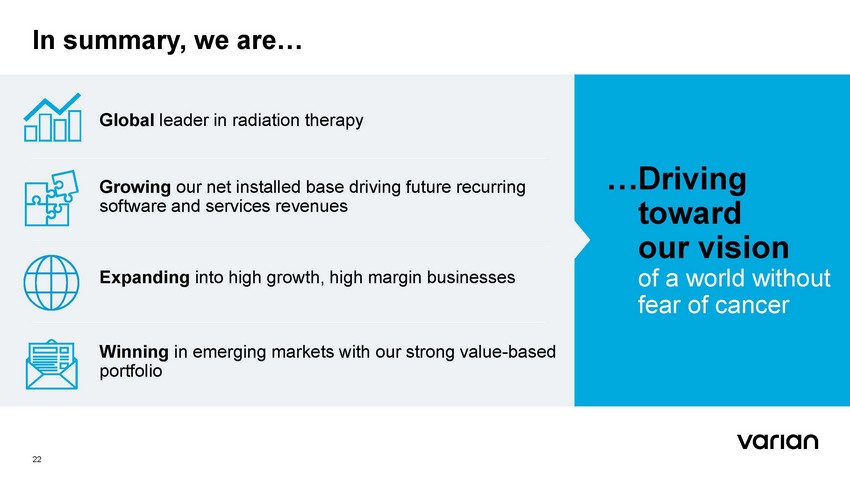 |
In summary, we are… Global leader in radiation therapy …Driving toward ourvision Growing our net installed base driving future recurring software and services revenues of a fear world without Expanding into high growth, high margin businesses of cancer Winning in emerging markets with our strong value-based portfolio FOR INVESTOR USE ONLY 22 |
 |
Appendix |
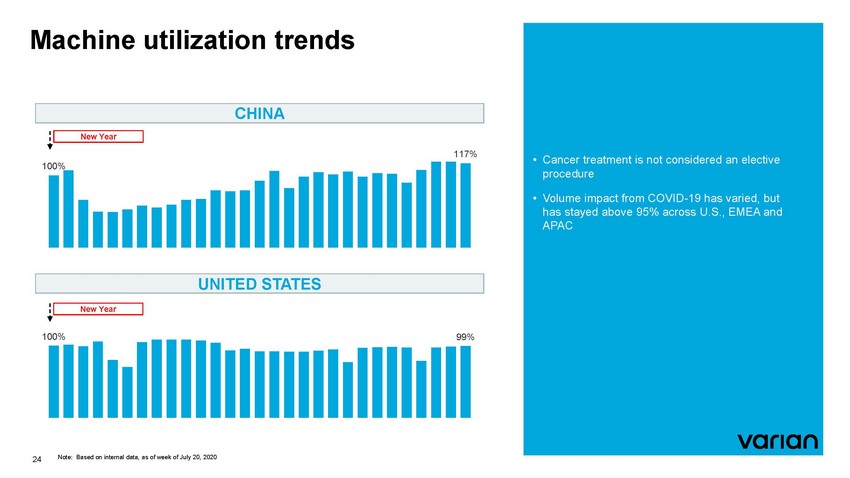 |
Machine utilization trends 117% 100% 100% 99% Note: Based on internal data, as of week of July 20, 2020 24 New Year UNITED STATES New Year CHINA • Cancer treatment is not considered an elective procedure • Volume impact from COVID-19 has varied, but has stayed above 95% across U.S., EMEA and APAC |
 |
Non-GAAP disclosure Discussion of Non-GAAP Financial Measures This presentation includes the following non-GAAP financial measures derived from our Condensed Consolidated Statements of Earnings: organic revenue growth, non-GAAP operating earnings, non-GAAP net earnings and non-GAAP net earnings per diluted share. We define organic revenue growth as revenue growth less the impact of revenue growt h from our CTSI and Interventional Solutions business and adjusted for the impact of foreign exchange. We define non-GAAP operating earnings as operating earnings excluding amortization of intangible assets, amortization of invento ry step-up, acquisition and integration-related expenses or benefits and in-process research and development, restructuring charges, impairment charges, significant litigation charges or benefits a nd legal costs. These measures are not presented in accordance with, nor are they a substitute for U.S. generally accepted accounting principles, or GAAP. In addition, these measures may be different from non -GAAP measures used by other companies, limiting their usefulness for comparison purposes. The non-GAAP financial measures should not be considered in isolation from measures of financial performance prepared in accorda nce with GAAP. Investors are cautioned that there are material limitations associated with the use of non-GAAP financial measures as an analytical tool. We have provided a reconciliation of each non-GAAP financial measure used in this earnings release to the most directly comparable GAAP financial measure. We have not provided a reconciliation of non-GAAP guidance measures to the corresponding GAAP measures on a forward-looking basis due to the potential significant variability and limited visibility of the excluded items discussed below. We utilize a number of different financial measures, both GAAP and non-GAAP, in analyzing and assessing the overall performance of our business, in making operating decisions, forecasting and planning for future periods, and determining payments under compensation programs. We consider the use of the non-GAAP measures to be helpful in assessing the performance of the ongoing operations of our business. We believe that disclosing non-GAAP financial measures provides useful supplemental data that, while not a substitute for financial measures pre pared in accordance with GAAP, allows for greater transparency in the review of our financial and operational performance. We also believe that disclosing non-GAAP financial measures provides useful information to investors and others in understanding and evaluating our operating results and future prospects in the same manner as management and in comparing financial results across accounting periods and to those of peer companies. Non-GAAP operating earnings and non-GAAP net earnings exclude the following items, except for gain and losses on equity investments, and significant non-recurring tax expense or benefit, which are only excluded from non-GAAP net earnings: Amortization of intangible assets and amortization of inventory step-up: We do not acquire businesses and assets on a predictable cycle. The amount of purchase price allocated to intangible assets, the step-up of inventory values, and the term of amortization can vary significantly and are unique to each acquisition or purchase. We beli eve that excluding amortization of intangible assets and amortization of inventory step-up allows the users of our financial statements to better review and understand the historic and current results of our operatio ns, and also facilitates comparisons to peer companies. Acquisition and integration-related expenses and in-process research and development: We incur expenses or benefits with respect to certain items associated with our acquisitions, such as transaction costs, hedging gains and losses, changes in the fair value of contingent consideration liabilities, gains or expenses on settlement of pre-existing relationships, integration costs, breakup fees, write-off of in-process research and development, etc. We exclude such expenses or benefits as they are related to acquisitions and have no direct correlation to the operations of our on-going business. Impairment and restructuring charges: We incur impairment and restructuring charges that result from events, which arise from unforeseen circumstances and/or often occur outside of the ordinary course of our on-going business. Although these events are reflected in our GAAP financials, these unique transactions may limit the comparabi lity of our on-going operations with prior and future periods. Significant litigation charges or benefits and legal costs: We may incur charges or benefits as well as legal costs from time to time related to litigation and other contingencies. We e xclude these charges or benefits, when significant, as well as legal costs associated with significant legal matters, because we do not believe they are reflec tive of on-going business and operating results. Gains and losses on equity investments: We may incur gains and losses from the sale of our equity investments in public and privately-held companies. We do not trade equity investments, and we do not plan on these investments for the funding of ongoing operations. We exclude such gains and losses because we do not believe they are reflective of our core business. Significant non-recurring tax expense or benefit: We may incur a significant tax expense or benefit as a result of tax legislation and/or a change in judgment about the need f or a valuation allowance that are generally unrelated to the level of business activity in the period in which these tax effects are reported. We exclude such expenses o r benefits from our non-GAAP net earnings because we believe they do not accurately reflect the underlying performance of our continuing business operations. We apply our GAAP consolidated effective tax rate to our non-GAAP financial measures, other than when the underlying item has a materially different tax treatment 25 |
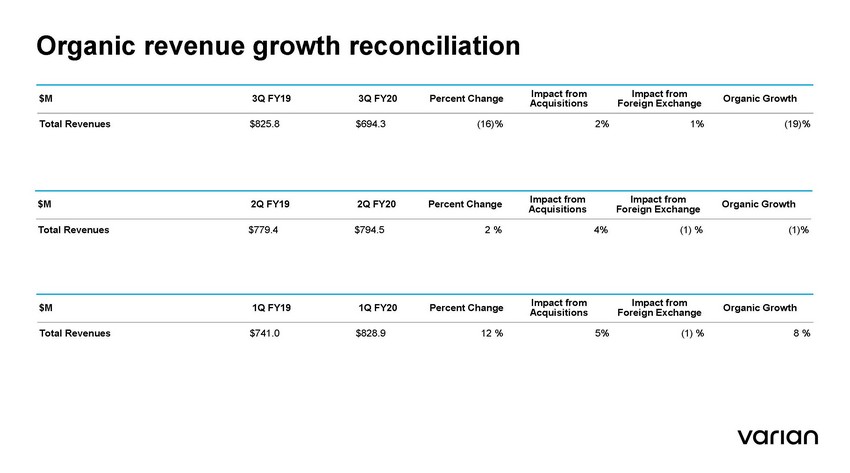 |
Organic revenue growth reconciliation Acquisitions Foreign Exchange Total Revenues $825.8 $694.3 (16)% 2% 1% (19)% Acquisitions Foreign Exchange Total Revenues $779.4 $794.5 2 % 4% (1) % (1)% Acquisitions Foreign Exchange Total Revenues $741.0 $828.9 12 % 5% (1) % 8 % $M1Q FY191Q FY20Percent ChangeImpact fromImpact fromOrganic Growth $M2Q FY192Q FY20Percent ChangeImpact fromImpact fromOrganic Growth $M3Q FY193Q FY20Percent ChangeImpact fromImpact fromOrganic Growth |
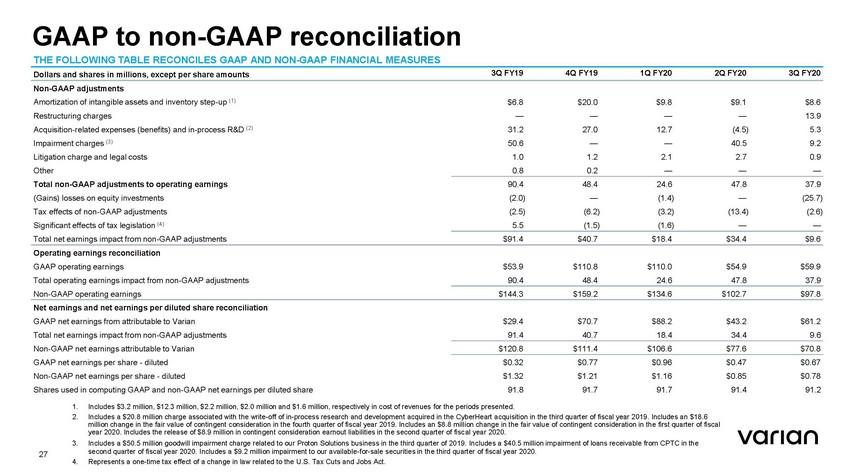 |
GAAP to non-GAAP reconciliation THE FOLLOWING TABLE RECONCILES GAAP AND NON-GAAP FINANCIAL MEASURES 3Q FY19 4Q FY19 1Q FY20 2Q FY20 3Q FY20 Dollars and shares in millions, except per share amounts Non-GAAP adjustments Amortization of intangible assets and inventory step-up (1) Restructuring charges Acquisition-related expenses (benefits) and in-process R&D (2) Impairment charges (3) Litigation charge and legal costs Other Total non-GAAP adjustments to operating earnings (Gains) losses on equity investments Tax effects of non-GAAP adjustments Significant effects of tax legislation (4) Total net earnings impact from non-GAAP adjustments $6.8 — 31.2 50.6 1.0 0.8 $20.0 — 27.0 — 1.2 0.2 $9.8 — 12.7 — 2.1 — $9.1 — (4.5) 40.5 2.7 — $8.6 13.9 5.3 9.2 0.9 — 90.4 (2.0) (2.5) 5.5 48.4 — (6.2) (1.5) 24.6 (1.4) (3.2) (1.6) 47.8 — (13.4) — 37.9 (25.7) (2.6) — $91.4 $40.7 $18.4 $34.4 $9.6 Operating earnings reconciliation GAAP operating earnings Total operating earnings impact from non-GAAP adjustments Non-GAAP operating earnings $53.9 90.4 $110.8 48.4 $110.0 24.6 $54.9 47.8 $59.9 37.9 $144.3 $159.2 $134.6 $102.7 $97.8 Net earnings and net earnings per diluted share reconciliation GAAP net earnings from attributable to Varian Total net earnings impact from non-GAAP adjustments Non-GAAP net earnings attributable to Varian GAAP net earnings per share - diluted Non-GAAP net earnings per share - diluted Shares used in computing GAAP and non-GAAP net earnings per diluted share $29.4 91.4 $70.7 40.7 $88.2 18.4 $43.2 34.4 $61.2 9.6 $120.8 $111.4 $106.6 $77.6 $70.8 $0.32 $1.32 91.8 $0.77 $1.21 91.7 $0.96 $1.16 91.7 $0.47 $0.85 91.4 $0.67 $0.78 91.2 1. 2. Includes $3.2 million, $12.3 million, $2.2 million, $2.0 million and $1.6 million, respectively in cost of revenues for the periods presented. Includes a $20.8 million charge associated with the write-off of in-process research and development acquired in the CyberHeart acquisition in the third quarter of fiscal year 2019. Includes an $18.6 million change in the fair value of contingent consideration in the fourth quarter of fiscal year 2019. Includes an $8.8 million change in the fair value of contingent consideration in the first quarter of fiscal year 2020. Includes the release of $8.9 million in contingent consideration earnout liabilities in the second quarter of fiscal year 2020. Includes a $50.5 million goodwill impairment charge related to our Proton Solutions business in the third quarter of 2019. Includes a $40.5 million impairment of loans receivable from CPTC in the second quarter of fiscal year 2020. Includes a $9.2 million impairment to our available-for-sale securities in the third quarter of fiscal year 2020. Represents a one-time tax effect of a change in law related to the U.S. Tax Cuts and Jobs Act. 3. 27 4. |
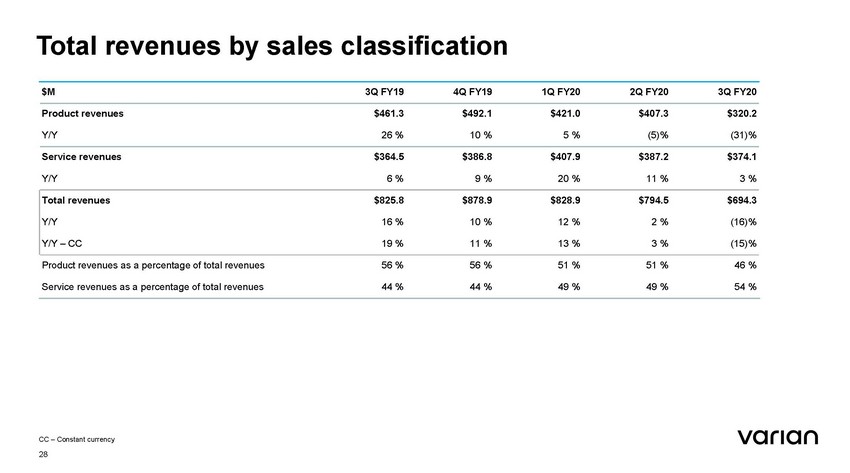 |
Total revenues by sales classification CC – Constant currency 28 $M3Q FY194Q FY191Q FY202Q FY203Q FY20 Product revenues$461.3$492.1$421.0$407.3$320.2 Y/Y26 %10 %5 %(5)%(31)% Service revenues$364.5$386.8$407.9$387.2$374.1 Y/Y6 %9 %20 %11 %3 % Total revenues$825.8$878.9$828.9$794.5$694.3 Y/Y16 %10 %12 %2 %(16)% Y/Y – CC19 %11 %13 %3 %(15)% Product revenues as a percentage of total revenues56 %56 %51 %51 %46 % Service revenues as a percentage of total revenues44 %44 %49 %49 %54 % |
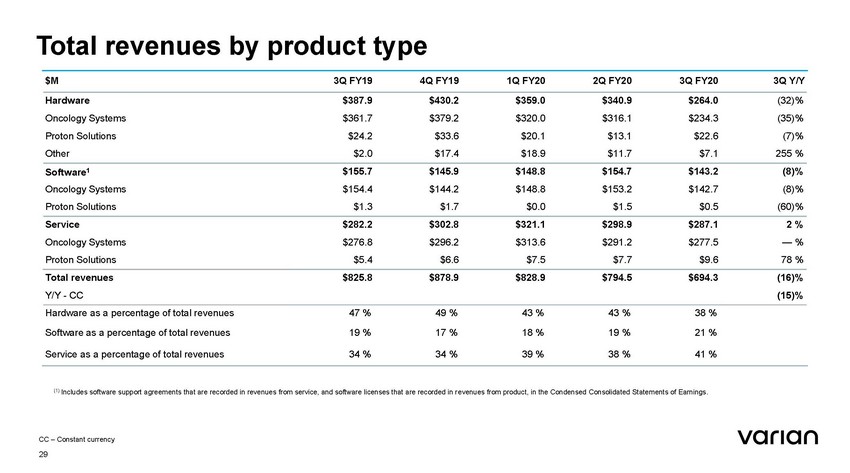 |
Total revenues by product type Total revenues Y/Y - CC $825.8 $878.9 $828.9 $794.5 $694.3 (16)% (15)% (1) Includes software support agreements that are recorded in revenues from service, and software licenses that are recorded in revenues from product, in the Condensed Consolidated Statements of Earnings. CC – Constant currency 29 Hardware as a percentage of total revenues47 %49 %43 %43 %38 % Software as a percentage of total revenues19 %17 %18 %19 %21 % Service as a percentage of total revenues34 %34 %39 %38 %41 % $M3Q FY194Q FY191Q FY202Q FY203Q FY203Q Y/Y Hardware $387.9 $430.2 $359.0 $340.9 $264.0 (32)% Oncology Systems $361.7 $379.2 $320.0 $316.1 $234.3 (35)% Proton Solutions $24.2 $33.6 $20.1 $13.1 $22.6 (7)% Other $2.0 $17.4 $18.9 $11.7 $7.1 255 % Software1 $155.7$145.9$148.8$154.7$143.2(8)% Oncology Systems$154.4$144.2$148.8$153.2$142.7(8)% Proton Solutions$1.3$1.7$0.0$1.5$0.5(60)% Service$282.2$302.8$321.1$298.9$287.12 % Oncology Systems$276.8$296.2$313.6$291.2$277.5— % Proton Solutions$5.4$6.6$7.5$7.7$9.678 % |
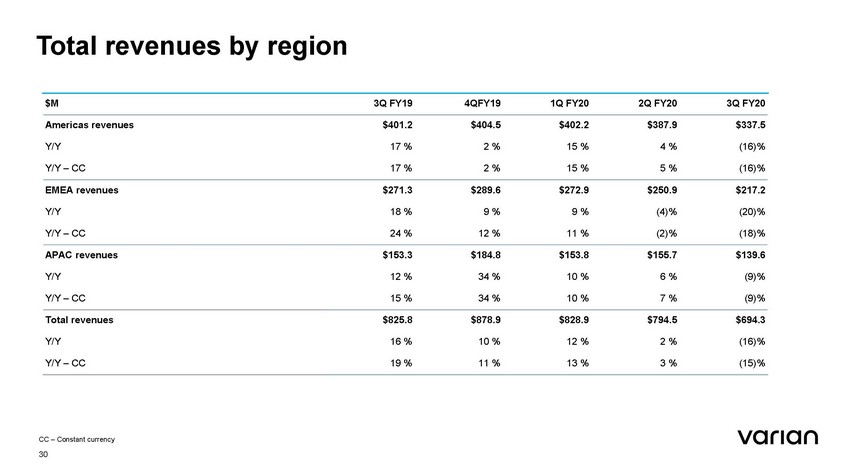 |
Total revenues by region Total revenues $825.8 $878.9 $828.9 $794.5 $694.3 Y/Y 16 % 10 % 12 % 2 % (16)% Y/Y – CC 19 % 11 % 13 % 3 % (15)% CC – Constant currency 30 $M3Q FY194QFY191Q FY202Q FY203Q FY20 Americas revenues$401.2$404.5$402.2$387.9$337.5 Y/Y17 %2 %15 %4 %(16)% Y/Y – CC17 %2 %15 %5 %(16)% EMEA revenues$271.3$289.6$272.9$250.9$217.2 Y/Y18 % 9 % 9 %(4)%(20)% Y/Y – CC24 %12 %11 %(2)%(18)% APAC revenues$153.3$184.8$153.8$155.7$139.6 Y/Y12 %34 %10 %6 %(9)% Y/Y – CC15 %34 %10 %7 %(9)% |
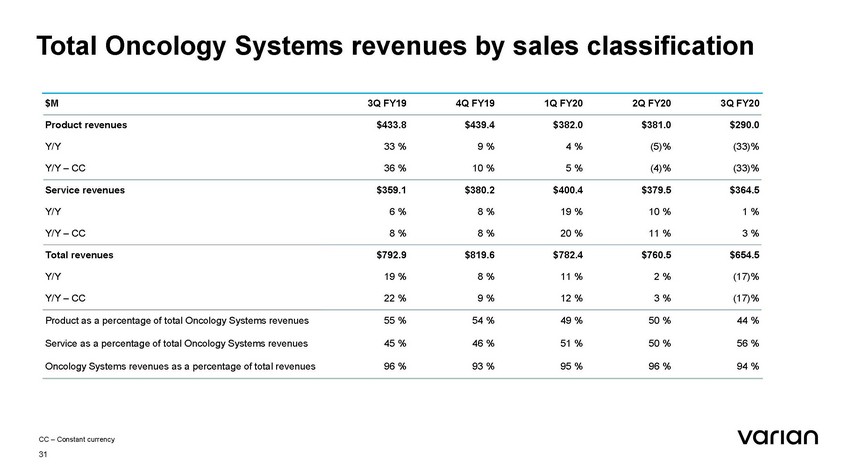 |
Total Oncology Systems revenues by sales classification Total revenues $792.9 $819.6 $782.4 $760.5 $654.5 Y/Y 19 % 8 % 11 % 2 % (17)% Y/Y – CC 22 % 9 % 12 % 3 % (17)% CC – Constant currency 31 Product as a percentage of total Oncology Systems revenues55 %54 %49 %50 %44 % Service as a percentage of total Oncology Systems revenues45 %46 %51 %50 %56 % Oncology Systems revenues as a percentage of total revenues96 %93 %95 %96 %94 % $M3Q FY194Q FY191Q FY202Q FY203Q FY20 Product revenues$433.8$439.4$382.0$381.0$290.0 Y/Y33 %9 %4 %(5)%(33)% Y/Y – CC36 %10 %5 %(4)%(33)% Service revenues$359.1$380.2$400.4$379.5$364.5 Y/Y6 %8 %19 %10 %1 % Y/Y – CC8 %8 %20 %11 %3 % |
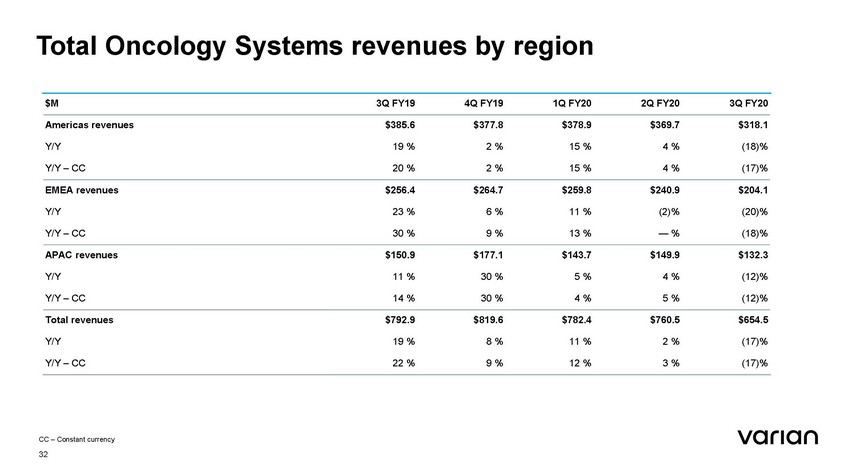 |
Total Oncology Systems revenues by region Total revenues $792.9 $819.6 $782.4 $760.5 $654.5 Y/Y 19 % 8 % 11 % 2 % (17)% Y/Y – CC 22 % 9 % 12 % 3 % (17)% CC – Constant currency 32 $M3Q FY194Q FY191Q FY202Q FY203Q FY20 Americas revenues$385.6$377.8$378.9$369.7$318.1 Y/Y19 %2 %15 %4 %(18)% Y/Y – CC20 %2 %15 %4 %(17)% EMEA revenues$256.4$264.7$259.8$240.9$204.1 Y/Y23 %6 %11 % (2)%(20)% Y/Y – CC30 %9 %13 %— %(18)% APAC revenues$150.9$177.1$143.7$149.9$132.3 Y/Y11 %30 %5 %4 %(12)% Y/Y – CC14 %30 %4 %5 %(12)% |
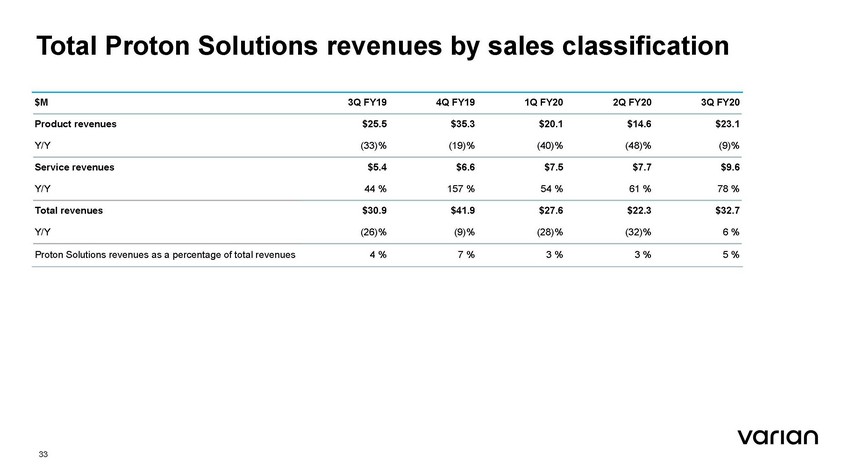 |
Total Proton Solutions revenues by sales classification Y/Y (26)% (9)% (28)% (32)% 6 % 33 Proton Solutions revenues as a percentage of total revenues4 %7 %3 %3 %5 % $M3Q FY194Q FY191Q FY202Q FY203Q FY20 Product revenues$25.5$35.3$20.1$14.6$23.1 Y/Y(33)%(19)%(40)%(48)%(9)% Service revenues$5.4$6.6$7.5$7.7$9.6 Y/Y44 %157 %54 %61 %78 % Total revenues$30.9$41.9$27.6$22.3$32.7 |
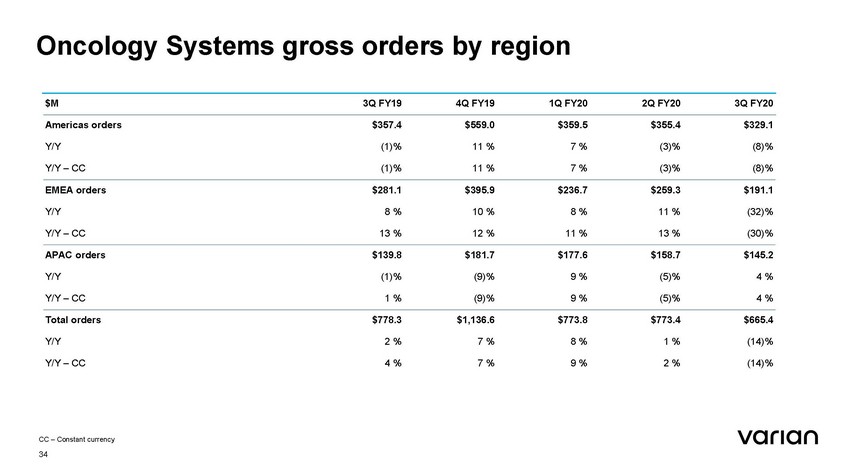 |
Oncology Systems gross orders by region CC – Constant currency 34 $M3Q FY194Q FY191Q FY202Q FY203Q FY20 Americas orders$357.4$559.0$359.5$355.4$329.1 Y/Y(1)%11 %7 %(3)%(8)% Y/Y – CC(1)%11 %7 %(3)%(8)% EMEA orders$281.1$395.9$236.7$259.3$191.1 Y/Y8 %10 %8 %11 %(32)% Y/Y – CC13 %12 %11 %13 %(30)% APAC orders$139.8$181.7$177.6$158.7$145.2 Y/Y(1)%(9)%9 %(5)%4 % Y/Y – CC1 %(9)%9 %(5)%4 % Total orders$778.3$1,136.6$773.8$773.4$665.4 Y/Y2 %7 %8 %1 %(14)% Y/Y – CC4 %7 %9 %2 %(14)% |
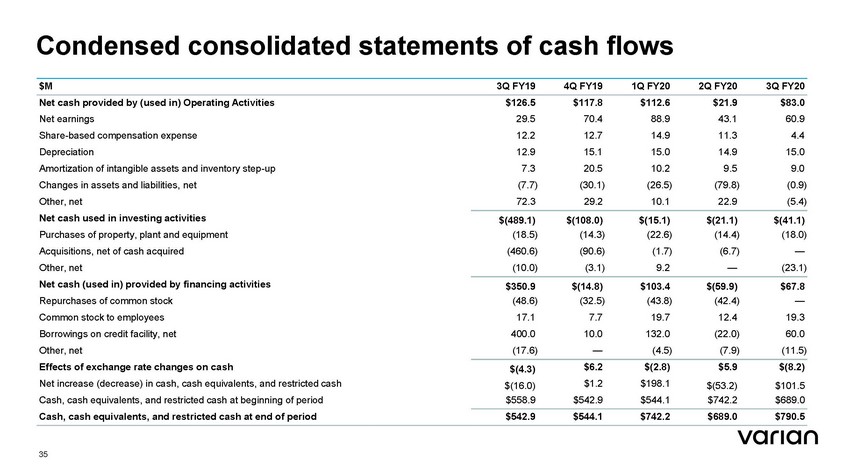 |
Condensed consolidated statements of cash flows $M 3Q FY19 4Q FY19 1Q FY20 2Q FY20 3Q FY20 Net cash provided by (used in) Operating Activities Net earnings Share-based compensation expense Depreciation Amortization of intangible assets and inventory step-up Changes in assets and liabilities, net Other, net Net cash used in investing activities Purchases of property, plant and equipment Acquisitions, net of cash acquired Other, net Net cash (used in) provided by financing activities Repurchases of common stock Common stock to employees Borrowings on credit facility, net Other, net Effects of exchange rate changes on cash Net increase (decrease) in cash, cash equivalents, and restricted cash Cash, cash equivalents, and restricted cash at beginning of period Cash, cash equivalents, and restricted cash at end of period $126.5 29.5 12.2 12.9 7.3 (7.7) 72.3 $117.8 70.4 12.7 15.1 20.5 (30.1) 29.2 $112.6 88.9 14.9 15.0 10.2 (26.5) 10.1 $21.9 43.1 11.3 14.9 9.5 (79.8) 22.9 $83.0 60.9 4.4 15.0 9.0 (0.9) (5.4) $(489.1) (18.5) (460.6) (10.0) $(108.0) (14.3) (90.6) (3.1) $(15.1) (22.6) (1.7) 9.2 $(21.1) (14.4) (6.7) — $(41.1) (18.0) — (23.1) $350.9 (48.6) 17.1 400.0 (17.6) $(14.8) (32.5) 7.7 10.0 — $103.4 (43.8) 19.7 132.0 (4.5) $(59.9) (42.4) 12.4 (22.0) (7.9) $67.8 — 19.3 60.0 (11.5) $6.2 $1.2 $542.9 $(2.8) $198.1 $544.1 $5.9 $(53.2) $742.2 $(8.2) $101.5 $689.0 $(4.3) $(16.0) $558.9 $542.9 $544.1 $742.2 $689.0 $790.5 35 |
 |
Our promise People powering victories Imagine a world without fear of cancer. We do, every day. We innovate new technologies for treating cancer and for connecting clinical teams to advance patient outcomes. Through ingenuity we inspire new victories and empower people in the fight against cancer. We are Varian. 36 |