Attached files
| file | filename |
|---|---|
| 8-K - 8-K - SOUTH PLAINS FINANCIAL, INC. | brhc10013857_8k.htm |
| EX-99.1 - EXHIBIT 99.1 - SOUTH PLAINS FINANCIAL, INC. | brhc10013857_ex99-1.htm |
Exhibit 99.2

South Plains Financial Earnings Presentation Second Quarter, 2020 *
Forward-Looking Statements and Disclosures FORWARD-LOOKING STATEMENTSThis presentation contains, and
future oral and written statements of South Plains Financial, Inc. (“South Plains” or the “Company”) and City Bank may contain, statements about future events that constitute forward-looking statements within the meaning of the Private
Securities Litigation Reform Act of 1995. These forward-looking statements reflect South Plains’ current views with respect to, among other things, future events and South Plains’ financial performance. Any statements about South Plains’
expectations, beliefs, plans, predictions, forecasts, objectives, assumptions or future events or performance are not historical facts and may be forward-looking. These statements are often, but not always, made through the use of words or
phrases such as “anticipate,” “believes,” “can,” “could,” “may,” “predicts,” “potential,” “should,” “will,” “estimate,” “plans,” “projects,” “continuing,” “ongoing,” “expects,” “intends” and similar words or phrases. Forward-looking
statements include, but are not limited to: (i) projections and estimates of revenues, expenses, income or loss, earnings or loss per share, and other financial items, including our estimated financial results for 2020, (ii) statements of
plans, objectives and expectations of South Plains or its management, (iii) statements of future economic performance, and (iv) statements of assumptions underlying such statements. Forward-looking statements should not be relied on because
they involve known and unknown risks, uncertainties and other factors, some of which are beyond the control of South Plains and City Bank. These risks, uncertainties and other factors may cause the actual results, performance, and
achievements of South Plains and City Bank to be materially different from the anticipated future results, performance or achievements expressed in, or implied by, the forward-looking statements. Factors that could cause such differences
include, but are not limited to, local, regional, national and international economic conditions, the extent of the impact of the COVID-19 pandemic, including the impact of actions taken by governmental and regulatory authorities in response
to such pandemic, such as the Coronavirus Aid, Relief, and Economic Security Act and subsequent related legislations, and the programs established thereunder, and City Bank’s participation in such programs, volatility of the financial
markets, changes in interest rates, regulatory considerations, competition and market expansion opportunities, changes in non-interest expenditures or in the anticipated benefits of such expenditures, the receipt of required regulatory
approvals, changes in non-performing assets and charge-offs, changes in tax laws, current or future litigation, regulatory examinations or other legal and/or regulatory actions, the impact of any tariffs, terrorist threats and attacks, acts
of war or threats thereof or other pandemics. Therefore, South Plains can give no assurance that the results contemplated in the forward-looking statements will be realized. For more information about these factors, please see South Plains’
reports filed with or furnished to the SEC, including South Plains’ most recent Annual Report on Form 10-K and Quarterly Report on Form 10-Q on file with the U.S. Securities and Exchange Commission (the “SEC”), including the sections entitled
"Risk Factors" and "Management's Discussion and Analysis of Financial Condition and Results of Operations." Further, any forward-looking statement speaks only as of the date on which it is made and South Plains undertakes no obligation to
update or revise any forward-looking statement to reflect events or circumstances after the date on which the statement is made or to reflect the occurrence of unanticipated events, except as required by law. All forward-looking statements
herein are qualified by these cautionary statement.NON-GAAP FINANCIAL MEASURESManagement believes that certain non-GAAP performance measures used in this presentation provide meaningful information about underlying trends in its business and
operations. Non-GAAP financial measures should be viewed in addition to, and not as an alternative for, SPFI’s reported results prepared in accordance with GAAP. Numbers in this presentation may not sum due to rounding. *
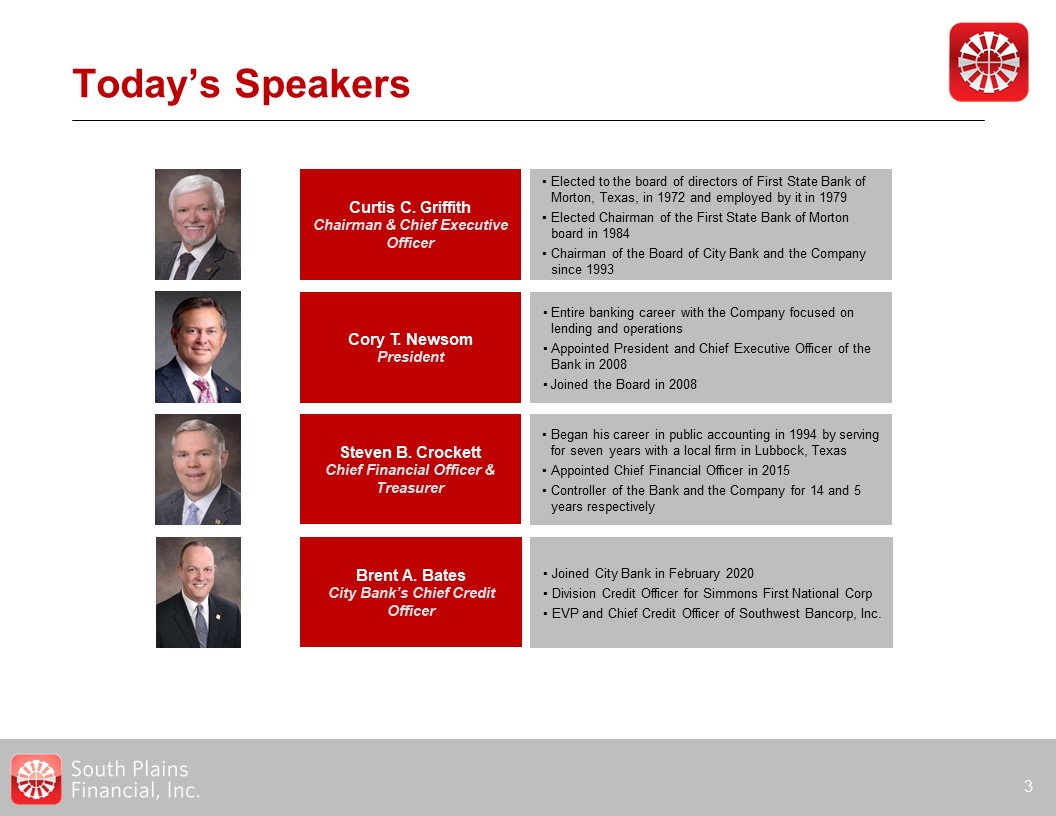
Today’s Speakers * Curtis C. Griffith Chairman & Chief Executive Officer Elected to the board
of directors of First State Bank of Morton, Texas, in 1972 and employed by it in 1979Elected Chairman of the First State Bank of Morton board in 1984Chairman of the Board of City Bank and the Company since 1993 Steven B. Crockett Chief
Financial Officer & Treasurer Began his career in public accounting in 1994 by serving for seven years with a local firm in Lubbock, TexasAppointed Chief Financial Officer in 2015Controller of the Bank and the Company for 14 and 5 years
respectively Cory T. Newsom President Entire banking career with the Company focused on lending and operationsAppointed President and Chief Executive Officer of the Bank in 2008Joined the Board in 2008 Brent A. Bates City Bank’s Chief
Credit Officer Joined City Bank in February 2020Division Credit Officer for Simmons First National CorpEVP and Chief Credit Officer of Southwest Bancorp, Inc.
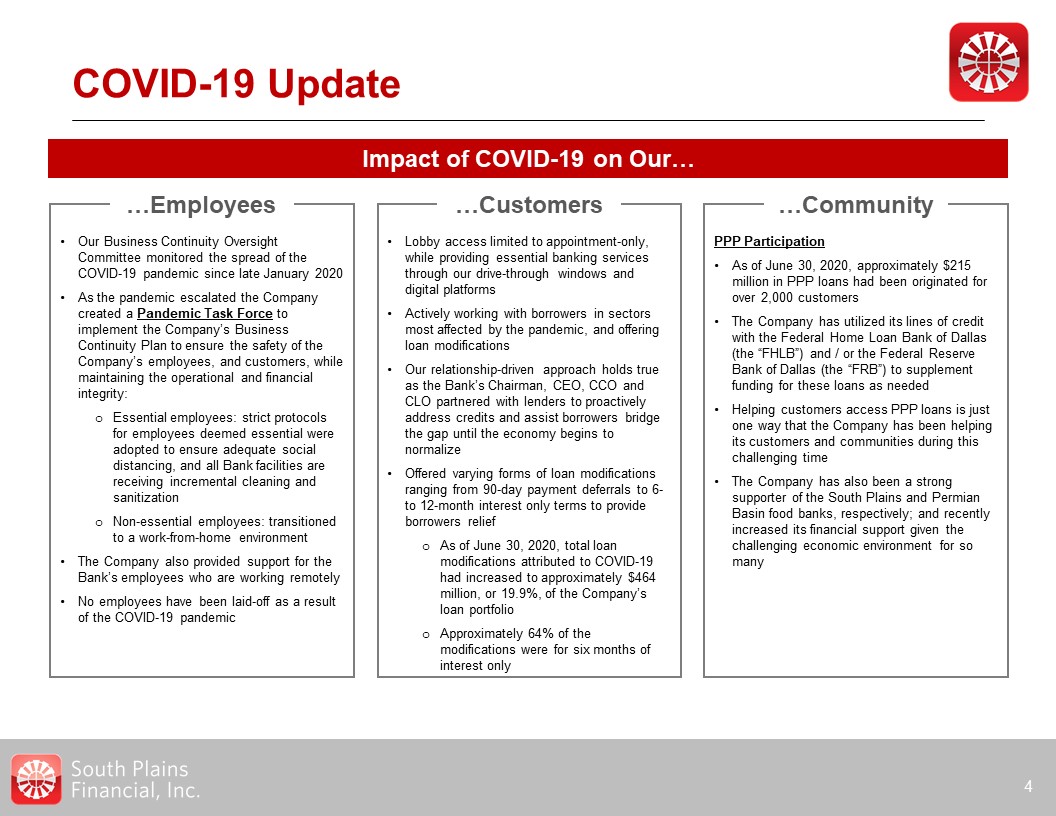
COVID-19 Update * Impact of COVID-19 on Our… Our Business Continuity Oversight Committee monitored
the spread of the COVID-19 pandemic since late January 2020As the pandemic escalated the Company created a Pandemic Task Force to implement the Company’s Business Continuity Plan to ensure the safety of the Company’s employees, and customers,
while maintaining the operational and financial integrity:Essential employees: strict protocols for employees deemed essential were adopted to ensure adequate social distancing, and all Bank facilities are receiving incremental cleaning and
sanitizationNon-essential employees: transitioned to a work-from-home environmentThe Company also provided support for the Bank’s employees who are working remotelyNo employees have been laid-off as a result of the COVID-19 pandemic Lobby
access limited to appointment-only, while providing essential banking services through our drive-through windows and digital platformsActively working with borrowers in sectors most affected by the pandemic, and offering loan modificationsOur
relationship-driven approach holds true as the Bank’s Chairman, CEO, CCO and CLO partnered with lenders to proactively address credits and assist borrowers bridge the gap until the economy begins to normalizeOffered varying forms of loan
modifications ranging from 90-day payment deferrals to 6- to 12-month interest only terms to provide borrowers reliefAs of June 30, 2020, total loan modifications attributed to COVID-19 had increased to approximately $464 million, or 19.9%,
of the Company’s loan portfolioApproximately 64% of the modifications were for six months of interest only PPP ParticipationAs of June 30, 2020, approximately $215 million in PPP loans had been originated for over 2,000 customersThe Company
has utilized its lines of credit with the Federal Home Loan Bank of Dallas (the “FHLB”) and / or the Federal Reserve Bank of Dallas (the “FRB”) to supplement funding for these loans as neededHelping customers access PPP loans is just one way
that the Company has been helping its customers and communities during this challenging timeThe Company has also been a strong supporter of the South Plains and Permian Basin food banks, respectively; and recently increased its financial
support given the challenging economic environment for so many …Employees …Customers …Community
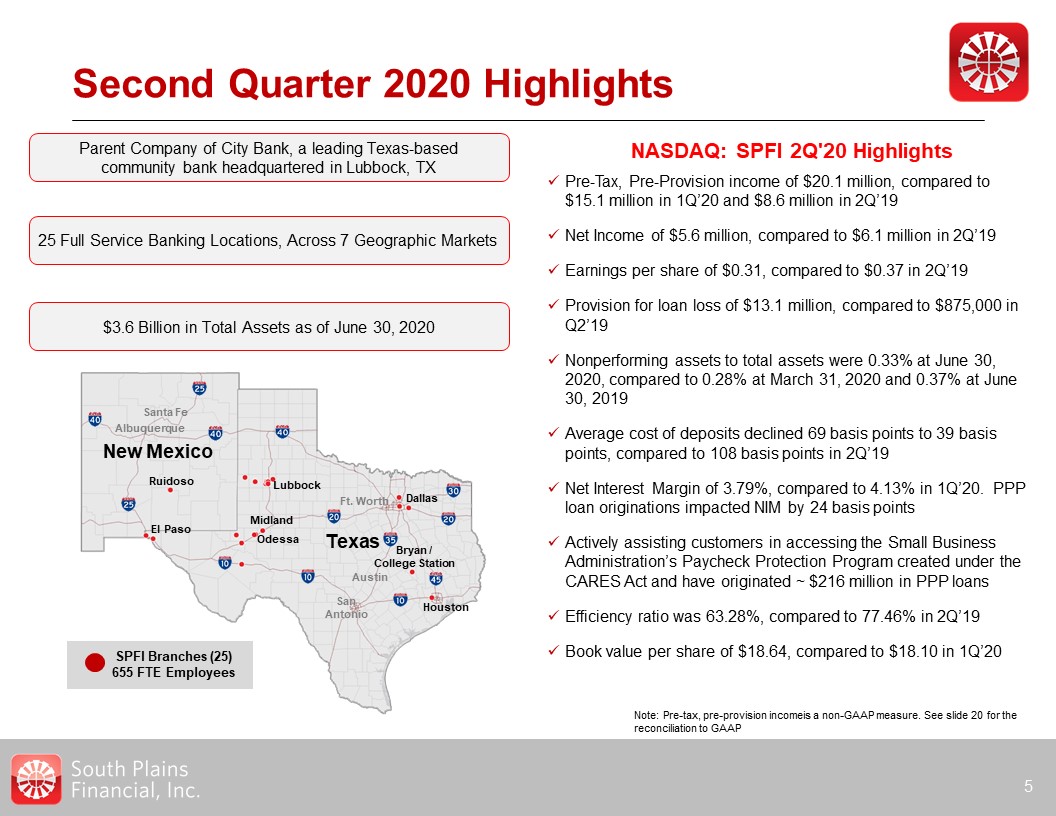
$3.6 Billion in Total Assets as of June 30, 2020 Parent Company of City Bank, a leading Texas-based
community bank headquartered in Lubbock, TX Second Quarter 2020 Highlights * Pre-Tax, Pre-Provision income of $20.1 million, compared to $15.1 million in 1Q’20 and $8.6 million in 2Q’19Net Income of $5.6 million, compared to $6.1 million
in 2Q’19Earnings per share of $0.31, compared to $0.37 in 2Q’19Provision for loan loss of $13.1 million, compared to $875,000 in Q2’19Nonperforming assets to total assets were 0.33% at June 30, 2020, compared to 0.28% at March 31, 2020 and
0.37% at June 30, 2019Average cost of deposits declined 69 basis points to 39 basis points, compared to 108 basis points in 2Q’19Net Interest Margin of 3.79%, compared to 4.13% in 1Q’20. PPP loan originations impacted NIM by 24 basis
pointsActively assisting customers in accessing the Small Business Administration’s Paycheck Protection Program created under the CARES Act and have originated ~ $216 million in PPP loansEfficiency ratio was 63.28%, compared to 77.46% in
2Q’19Book value per share of $18.64, compared to $18.10 in 1Q’20 NASDAQ: SPFI 2Q'20 Highlights 25 Full Service Banking Locations, Across 7 Geographic Markets New Mexico Texas Dallas Bryan /College Station Houston Midland Odessa El
Paso Lubbock Ruidoso SanAntonio Ft. Worth Austin Albuquerque Santa Fe SPFI Branches (25)655 FTE Employees Note: Pre-tax, pre-provision incomeis a non-GAAP measure. See slide 20 for the reconciliation to GAAP

Covid-19 Cumulative Loan Modifications * The Company has taken an aggressive and proactive
approach to managing credit in light of the economic uncertaintyMost at-risk loans over $1 million have been assigned to the Chairman, CEO, CLO, or CCO for additional oversightAdditionally, customers were offered a range of loan modifications
with interest only being the preferred option by the BankThrough June 30, 2020, 19.9% of the Bank’s portfolio has been modified with 64% being interest onlyInterest only remains the preferred loan modification as it better aligns the needs of
the customer and the Bank 2Q’20 Highlights Loan Modifications$ In Thousands
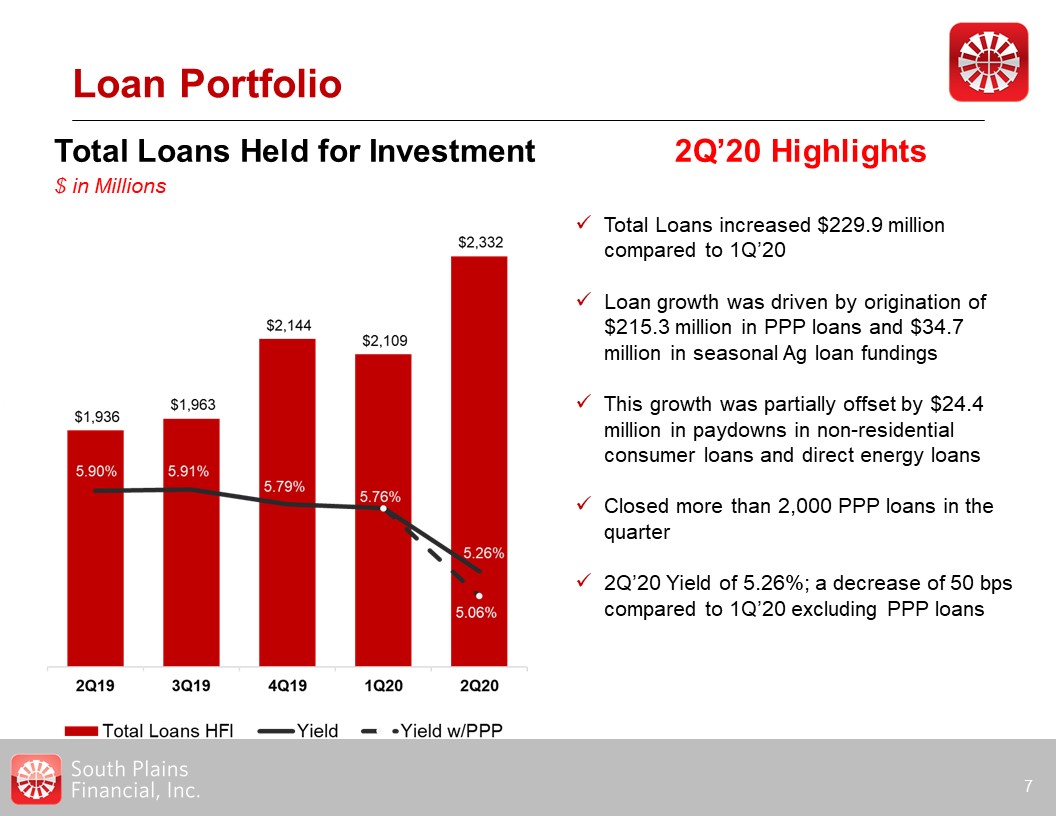
Loan Portfolio * Total Loans increased $229.9 million compared to 1Q’20Loan growth was driven by
origination of $215.3 million in PPP loans and $34.7 million in seasonal Ag loan fundings This growth was partially offset by $24.4 million in paydowns in non-residential consumer loans and direct energy loansClosed more than 2,000 PPP loans
in the quarter2Q’20 Yield of 5.26%; a decrease of 50 bps compared to 1Q’20 excluding PPP loans 2Q’20 Highlights Total Loans Held for Investment$ in Millions
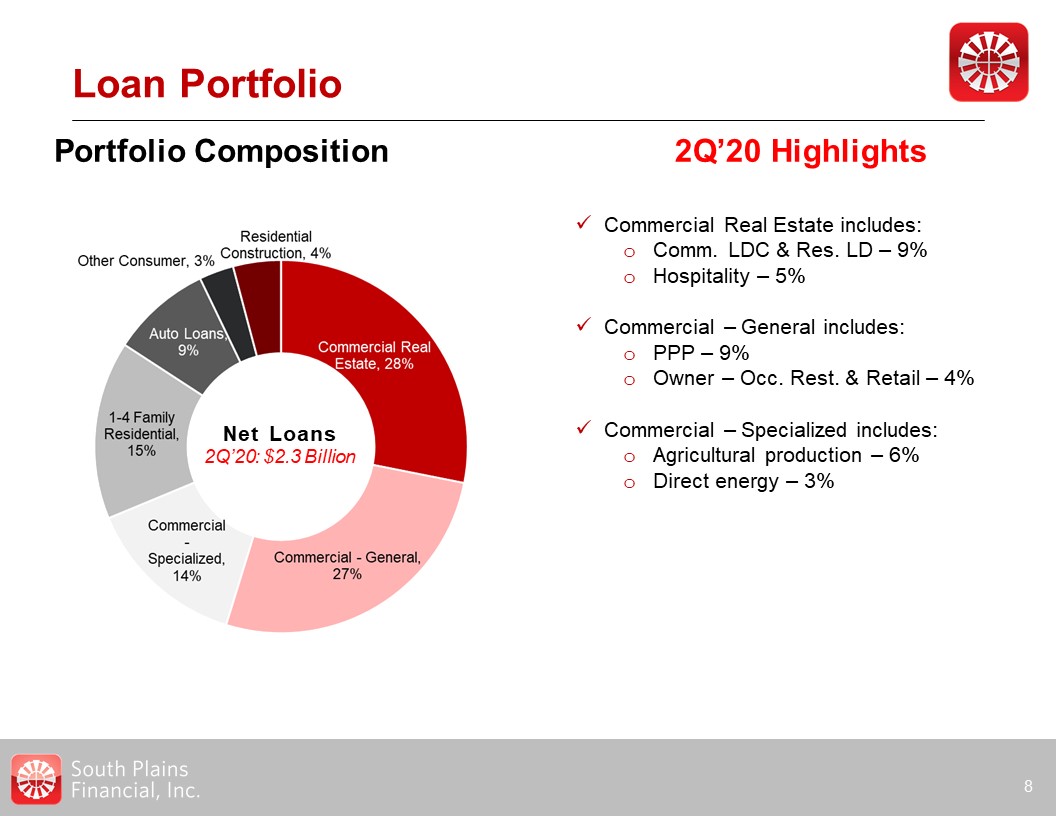
Loan Portfolio * Commercial Real Estate includes:Comm. LDC & Res. LD – 9%Hospitality –
5%Commercial – General includes:PPP – 9%Owner – Occ. Rest. & Retail – 4%Commercial – Specialized includes:Agricultural production – 6%Direct energy – 3% 2Q’20 Highlights Portfolio Composition Net Loans2Q’20: $2.3 Billion
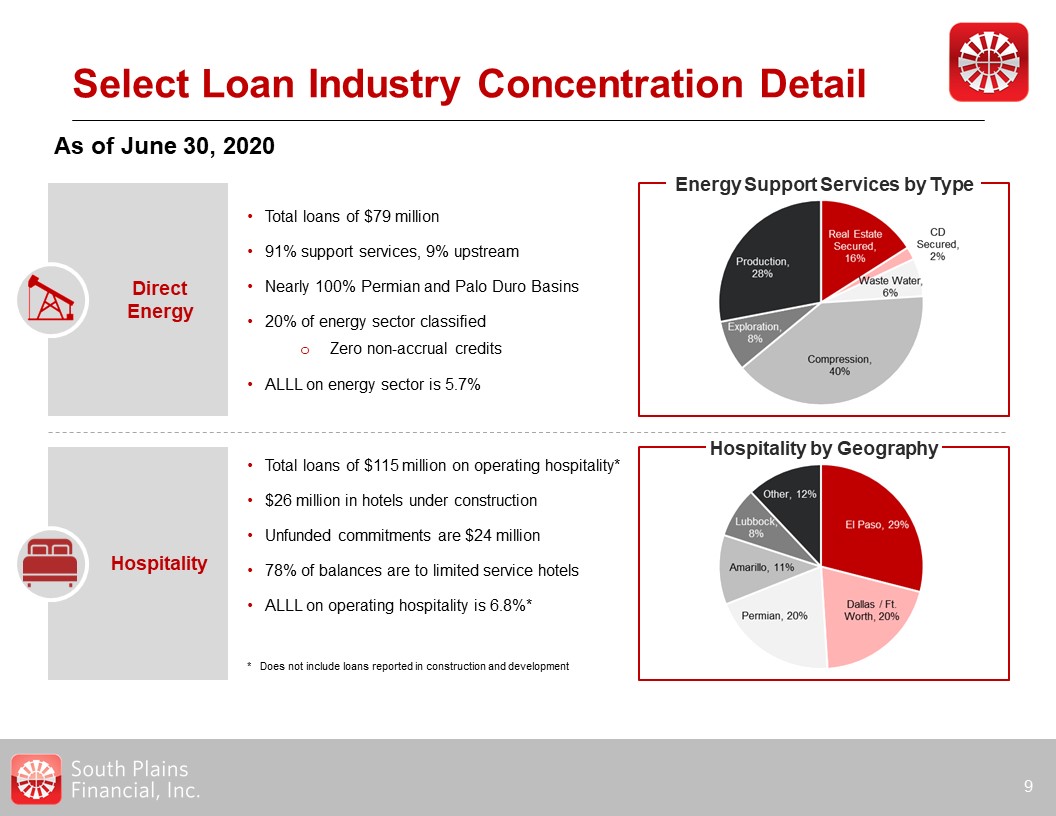
Hospitality Select Loan Industry Concentration Detail * As of June 30, 2020 DirectEnergy Total
loans of $79 million91% support services, 9% upstreamNearly 100% Permian and Palo Duro Basins20% of energy sector classifiedZero non-accrual creditsALLL on energy sector is 5.7% Total loans of $115 million on operating hospitality*$26
million in hotels under constructionUnfunded commitments are $24 million78% of balances are to limited service hotelsALLL on operating hospitality is 6.8%** Does not include loans reported in construction and development Energy Support
Services by Type Hospitality by Geography
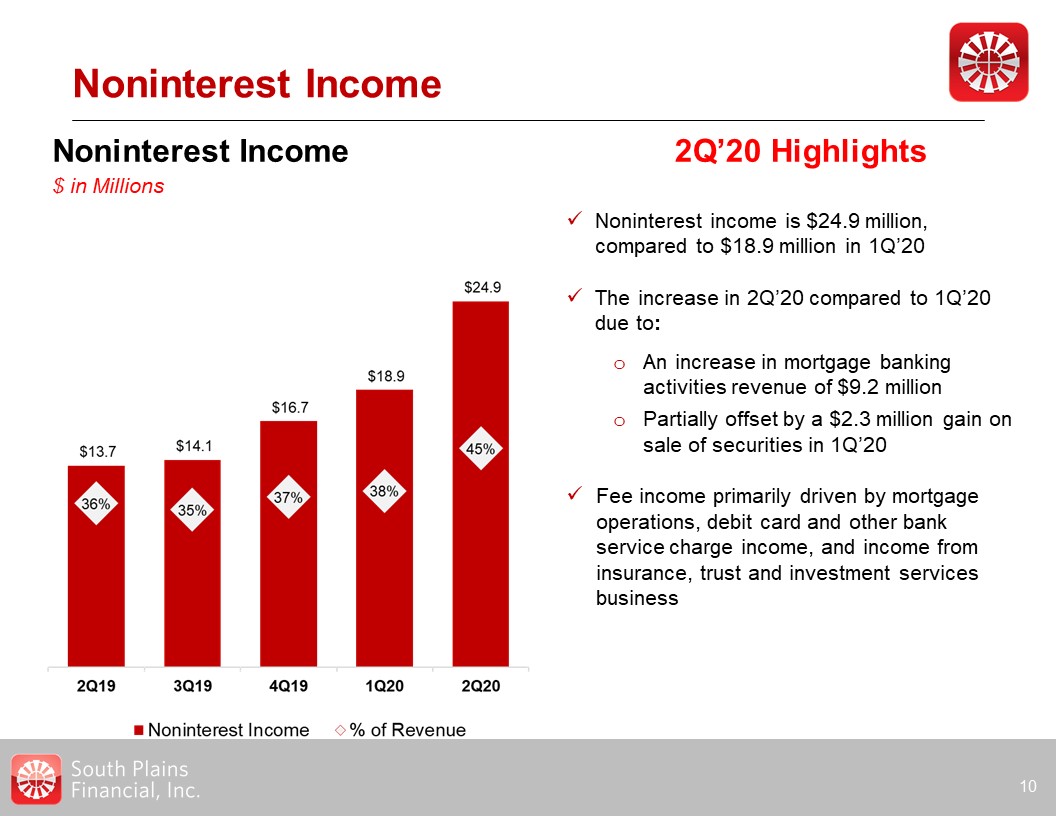
Noninterest Income * Noninterest Income$ in Millions 2Q’20 Highlights Noninterest income is $24.9
million, compared to $18.9 million in 1Q’20The increase in 2Q’20 compared to 1Q’20 due to:An increase in mortgage banking activities revenue of $9.2 millionPartially offset by a $2.3 million gain on sale of securities in 1Q’20Fee income
primarily driven by mortgage operations, debit card and other bank service charge income, and income from insurance, trust and investment services business

Diversified Revenue Stream Six Months Ended June 30, 2020 * Total Revenues$104.4
million Noninterest Income$43.8 million

Net Interest Income and Margin * Net Interest Income & Margin$ in Millions 2Q’20
Highlights Net interest income of $30.4 million, compared to $24.8 million in 2Q’19The increase as compared to 2Q’19 was a result of:A $429 million rise in average loans primarily from the WTSB acquisition and PPP loans This was partially
offset by a decrease in overall rates in 1Q’202Q’20 NIM of 3.79%; a decrease of 34bps and 9bps, compared to 1Q’20 and 2Q’19, respectivelyPPP loan origination reduced the 2Q’20 NIM by 11bps as compared to 1Q’20
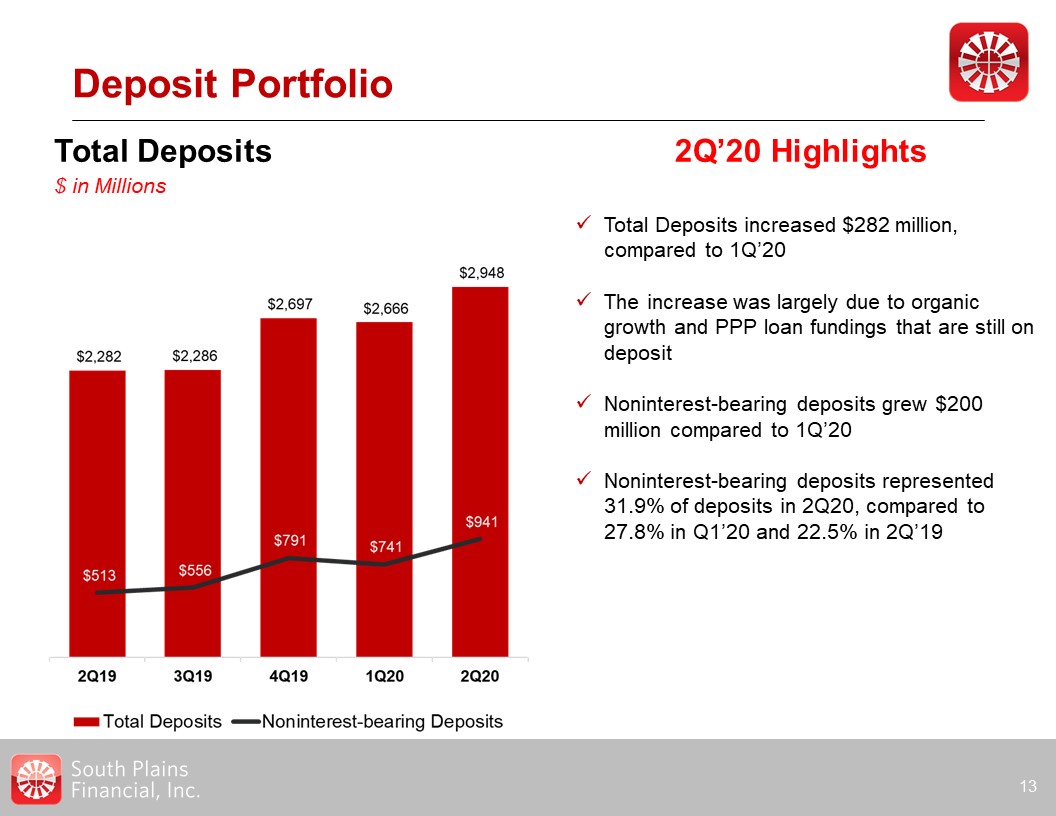
Deposit Portfolio * Total Deposits$ in Millions 2Q’20 Highlights Total Deposits increased $282
million, compared to 1Q’20The increase was largely due to organic growth and PPP loan fundings that are still on depositNoninterest-bearing deposits grew $200 million compared to 1Q’20 Noninterest-bearing deposits represented 31.9% of
deposits in 2Q20, compared to 27.8% in Q1’20 and 22.5% in 2Q’19
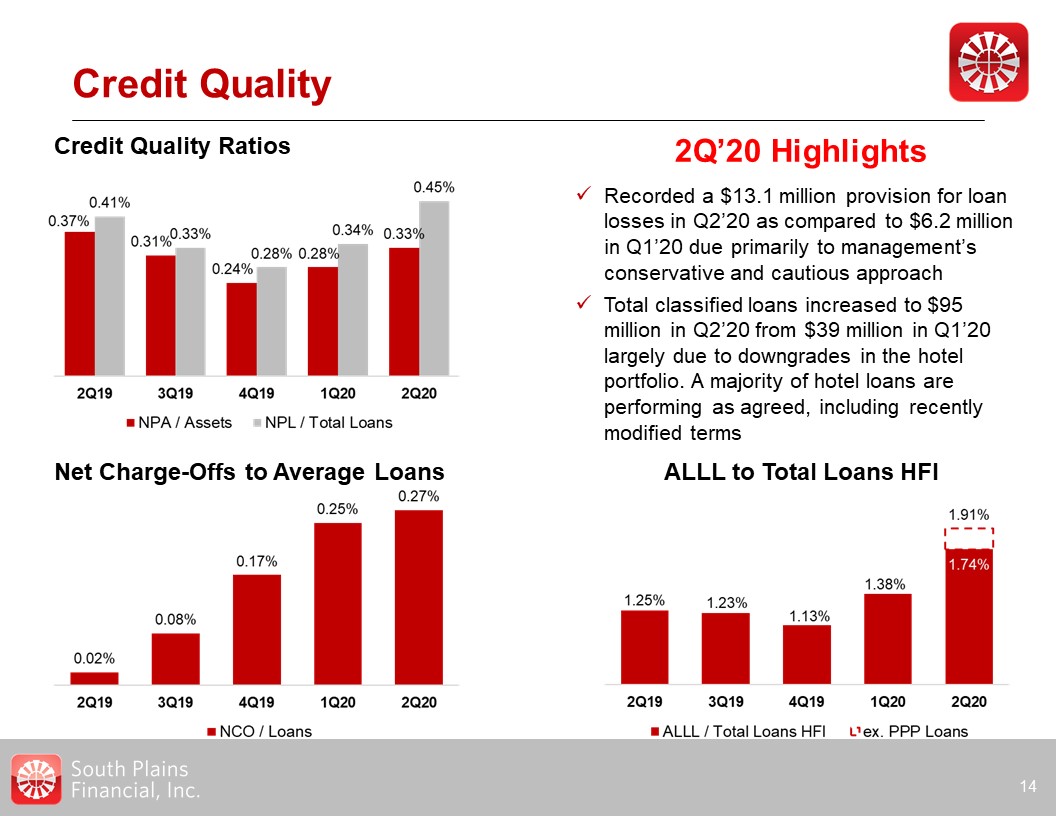
Credit Quality * 2Q’20 Highlights Credit Quality Ratios Recorded a $13.1 million provision for
loan losses in Q2’20 as compared to $6.2 million in Q1’20 due primarily to management’s conservative and cautious approach Total classified loans increased to $95 million in Q2’20 from $39 million in Q1’20 largely due to downgrades in the
hotel portfolio. A majority of hotel loans are performing as agreed, including recently modified terms Net Charge-Offs to Average Loans ALLL to Total Loans HFI
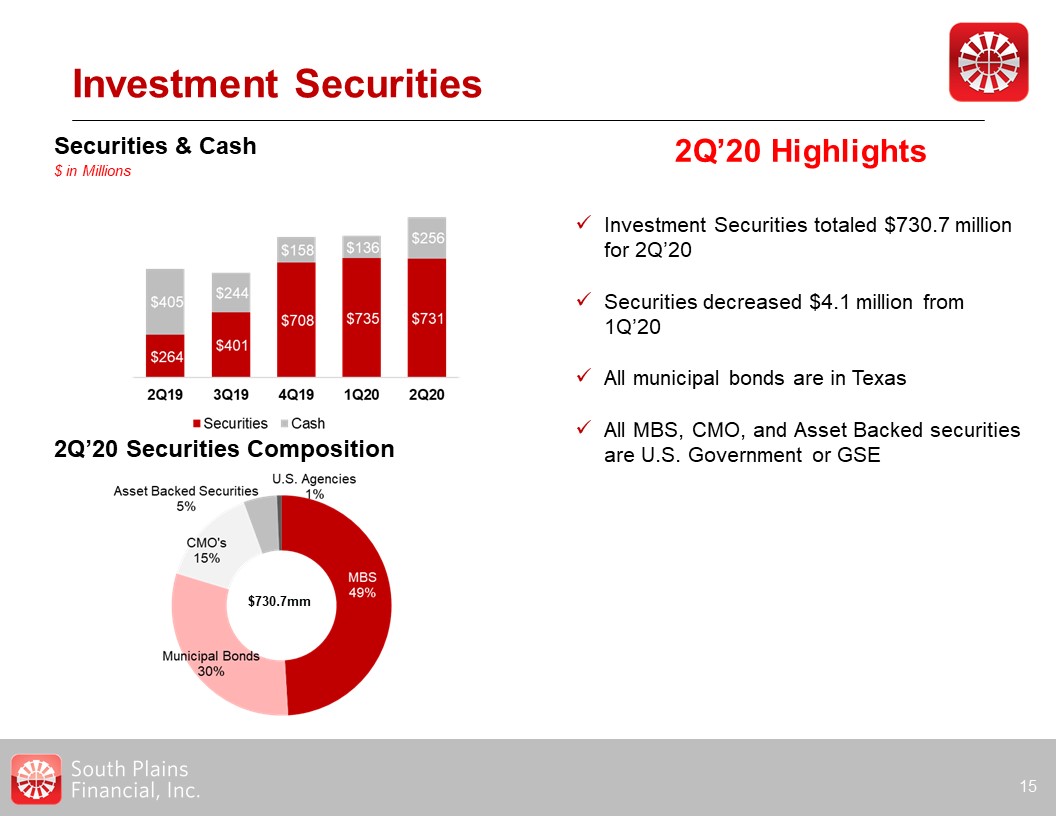
Investment Securities * 2Q’20 Highlights Investment Securities totaled $730.7 million for
2Q’20Securities decreased $4.1 million from 1Q’20All municipal bonds are in TexasAll MBS, CMO, and Asset Backed securities are U.S. Government or GSE 2Q’20 Securities Composition $730.7mm Securities & Cash$ in Millions
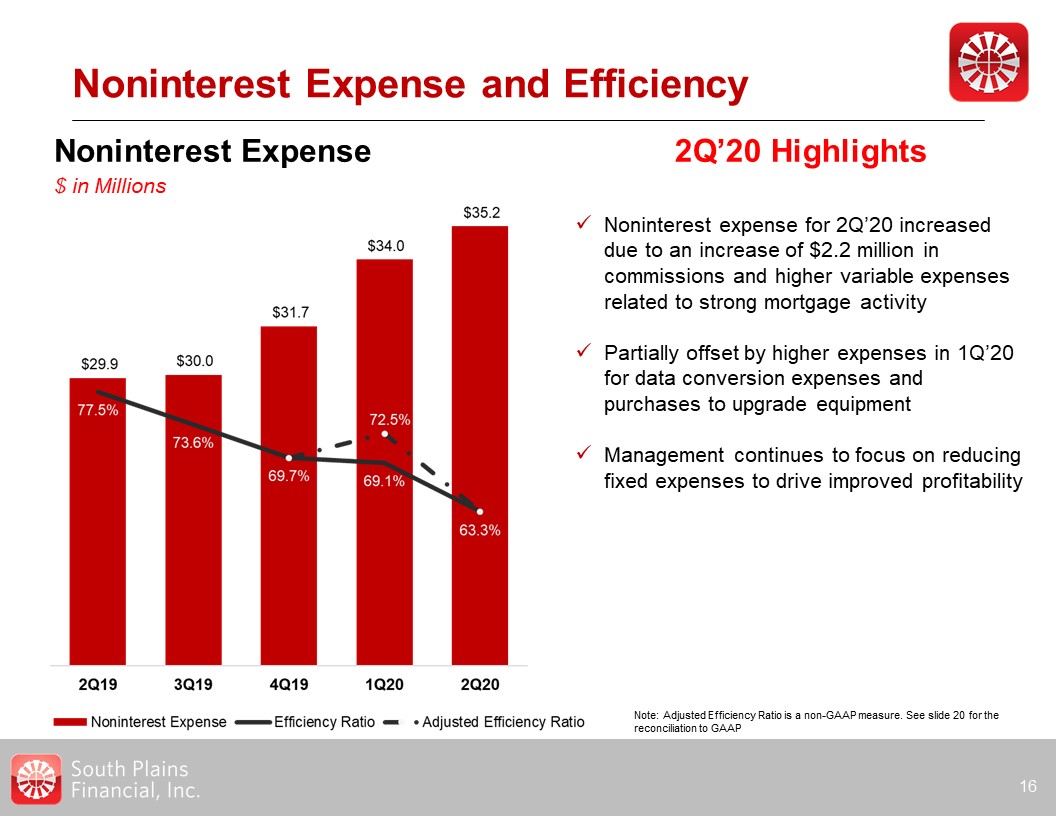
Noninterest Expense and Efficiency * Noninterest Expense$ in Millions 2Q’20 Highlights Noninterest
expense for 2Q’20 increased due to an increase of $2.2 million in commissions and higher variable expenses related to strong mortgage activityPartially offset by higher expenses in 1Q’20 for data conversion expenses and purchases to upgrade
equipment Management continues to focus on reducing fixed expenses to drive improved profitability Note: Adjusted Efficiency Ratio is a non-GAAP measure. See slide 20 for the reconciliation to GAAP

Balance Sheet Growth and Development * 2Q’20 Highlights Balance Sheet Highlights$ in
Millions Total Deposits were $2.9 billion as of 2Q’20, compared to $2.3 billion in 2Q’19:$343 million from the assumption of deposits in the WTSB acquisitionOrganic growth and PPP loan fundings still on depositTotal Loans HFI were $2.3
billion as of 2Q’20, compared to $1.9 billion in 2Q’19$215 million of the increase was the result of PPP originations and $180 million net increase from the WTSB acquisitionTangible Book Value Per Share of $17.06 for the period ended June 30,
2020 Tangible Book Value Per Share Note: Adjusted Efficiency Ratio is a non-GAAP measure. See slide 21 for the reconciliation to GAAP
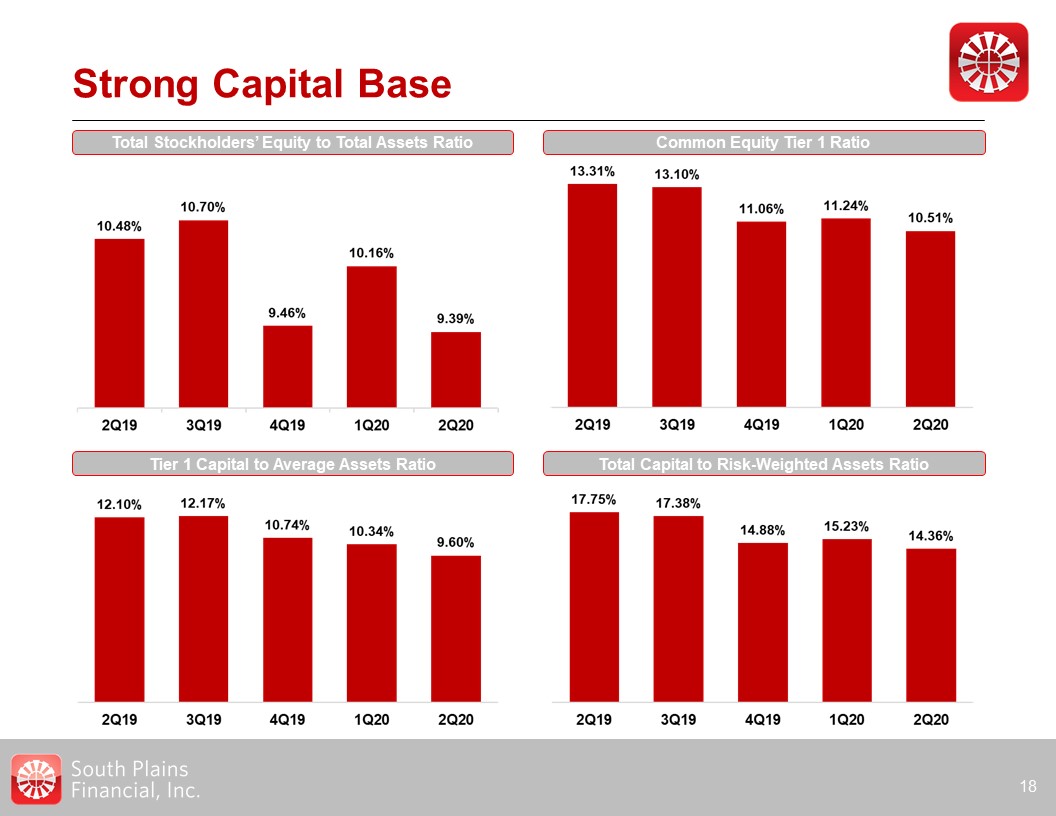
Strong Capital Base * Total Stockholders’ Equity to Total Assets Ratio Common Equity Tier 1
Ratio Tier 1 Capital to Average Assets Ratio Total Capital to Risk-Weighted Assets Ratio

Appendix *
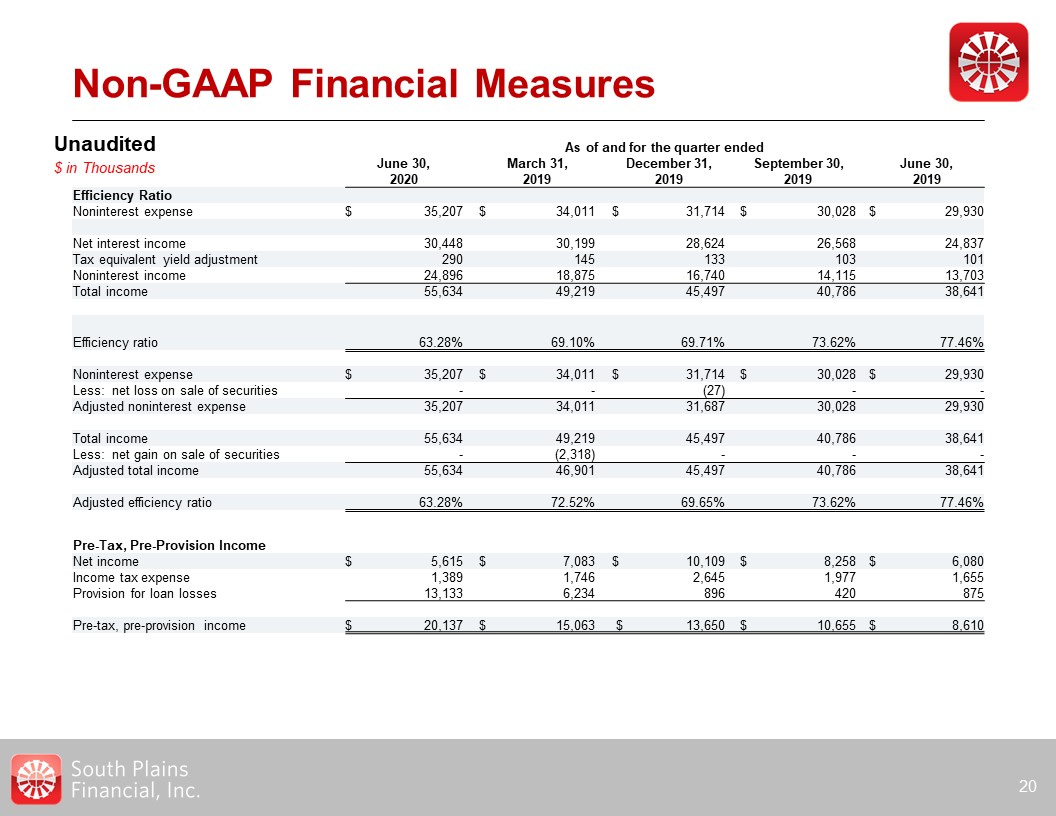
Non-GAAP Financial Measures * As of and for the quarter ended June
30,2020 March 31,2019 December 31,2019 September 30,2019 June 30,2019 Efficiency Ratio Noninterest expense $ 35,207 $ 34,011 $ 31,714 $ 30,028
$ 29,930 Net interest income 30,448 30,199 28,624 26,568 24,837 Tax equivalent yield adjustment 290 145 133 103 101 Noninterest
income 24,896 18,875 16,740 14,115 13,703 Total income 55,634 49,219 45,497 40,786 38,641 Efficiency ratio 63.28%
69.10% 69.71% 73.62% 77.46% Noninterest expense $ 35,207 $ 34,011 $ 31,714 $ 30,028 $ 29,930 Less: net loss on sale of securities - -
(27) - - Adjusted noninterest expense 35,207 34,011 31,687 30,028 29,930 Total income 55,634 49,219 45,497 40,786
38,641 Less: net gain on sale of securities - (2,318) - - - Adjusted total income 55,634 46,901 45,497 40,786 38,641 Adjusted
efficiency ratio 63.28% 72.52% 69.65% 73.62% 77.46% Unaudited$ in Thousands Pre-Tax, Pre-Provision Income Net income $ 5,615 $ 7,083 $ 10,109
$ 8,258 $ 6,080 Income tax expense 1,389 1,746 2,645 1,977 1,655 Provision for loan losses 13,133 6,234 896 420 875
Pre-tax, pre-provision income $ 20,137 $ 15,063 $ 13,650 $ 10,655 $ 8,610
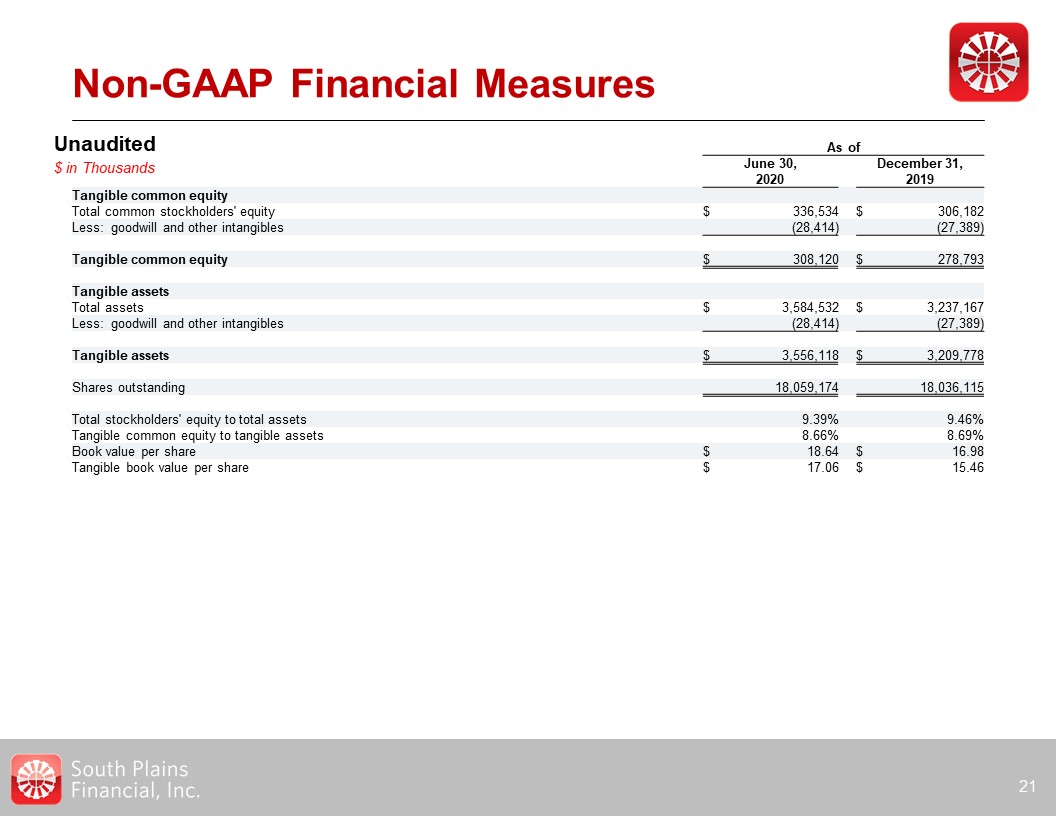
Non-GAAP Financial Measures * As of June 30,2020 December 31,2019 Tangible
common equity Total common stockholders' equity $ 336,534 $ 306,182 Less: goodwill and other intangibles (28,414) (27,389) Tangible common equity $ 308,120 $ 278,793
Tangible assets Total assets $ 3,584,532 $ 3,237,167 Less: goodwill and other intangibles (28,414) (27,389) Tangible assets $ 3,556,118 $ 3,209,778 Shares
outstanding 18,059,174 18,036,115 Total stockholders' equity to total assets 9.39% 9.46% Tangible common equity to tangible assets 8.66% 8.69% Book value per share $ 18.64
$ 16.98 Tangible book value per share $ 17.06 $ 15.46 Unaudited$ in Thousands