Attached files
| file | filename |
|---|---|
| 8-K - CURTISS-WRIGHT CORPORATION 8-K - CURTISS WRIGHT CORP | a52216003.htm |
| EX-99.1 - EXHIBIT 99.3 - CURTISS WRIGHT CORP | a52216003ex99_3.htm |
| EX-99.1 - EXHIBIT 99.1 - CURTISS WRIGHT CORP | a52216003ex99_1.htm |
Exhibit 99.2

1Q 2020 Earnings Conference CallMay 7, 2020 NYSE: CW
Safe Harbor Statement Please note that the information provided in this presentation is accurate as of
the date of the original presentation. The presentation will remain posted on this website from one to twelve months following the initial presentation, but content will not be updated to reflect new information that may become available after
the original presentation posting. The presentation contains forward-looking statements within the meaning of Section 27A of the Securities Act of 1933, as amended ("Securities Act"), Section 21E of the Securities Exchange Act of 1934, as
amended ("Exchange Act"), and the Private Securities Litigation Reform Act of 1995. Such forward-looking statements only speak as of the date of this report and Curtiss-Wright Corporation assumes no obligation to update the information included
in this report. Such forward-looking statements include, among other things, management's estimates of future performance, revenue and earnings, our management's growth objectives, our management’s ability to integrate our acquisition, and our
management's ability to produce consistent operating improvements. These forward-looking statements are based on expectations as of the time the statements were made only, and are subject to a number of risks and uncertainties which could cause
us to fail to achieve our then-current financial projections and other expectations, including the impact of a global pandemic or national epidemic. Any references to organic growth exclude the effects of foreign currency translation,
acquisitions and divestitures, unless otherwise noted. This presentation also includes certain non-GAAP financial measures with reconciliations to GAAP financial measures being made available in the earnings release that is posted to our
website and furnished with the SEC. We undertake no duty to update this information. More information about potential factors that could affect our business and financial results is included in our filings with the Securities and Exchange
Commission, including our Annual Reports on Form 10-K and Quarterly Reports on Form 10-Q, including, among other sections, under the captions, "Risk Factors" and "Management's Discussion and Analysis of Financial Condition and Results of
Operations," which is on file with the SEC and available at the SEC's website at www.sec.gov.
Agenda Operational Status and Response to COVID-19Highlights of Q1 2020 Performance CFO Transition2020
Financial Outlook and AssumptionsCapital Structure and Liquidity Management’s Actions Taken to Offset COVID-19 Impact

Curtiss-Wright’s Response to COVID-19 Primary focus: Employee health and safetyContinue to advise global
workforce to follow CDC guidelinesEnacted protocols across all sites regarding safety, cleaning and visitors Strong IT focus on enabling greater work from home/ remote capabilities; Enhanced security protocolsCurrent operating situation China
operations impacted mid-Q1 were 100% operational by end of MarchMajority of CW sites granted ‘Essential Business’ statusFY’20 sales impact due primarily to customer-driven delays and Government-mandated shutdowns Established Cross Functional
Response TeamRisk Identification & Mitigation (Customer/Internal/ Supplier)Developed daily tracking and reporting system across 155 sites world-wideImplementing cost containment plans to preserve Profitability and Free Cash FlowUtilizing
recession planning scenarios developed in H2’19Conducting stress testing of all segments to evaluate and plan for potential sales and profitability risksSuspending 2020 GuidanceAnticipate improved visibility into key markets, customers and
supply chain over the next few months OPERATIONAL STATUS MANAGEMENT ACTIONS

Solid First Quarter 2020 Performance Net Sales of $601 million, up 4% Strong growth in defense markets,
up 26%, led by aerospace and naval defense marketsPartially offset by lower power generation and general industrial revenuesAdjusted Operating Income up 10%; Adjusted Operating Margin of 13.3%, up 80 basis points Driven by solid profitability
in the Defense segment and the benefit of cost containment actionsAdjusted Diluted EPS of $1.34, up 3%Led by solid growth in net earnings and continued share repurchase, despite a higher effective tax rateAdjusted Free Cash Flow of ($53)
million, up 17% First Quarter 2020 Highlights Notes: Any references to organic growth exclude the effects of foreign currency translation, acquisitions and divestitures, unless otherwise noted. 2020 Adjusted results exclude restructuring
costs (impacting all three segments), one-time transition and IT security costs related to the relocation of the DRG business (Power Segment), and one-time backlog amortization and transaction costs associated with the acquisition of 901D
(Defense segment). 2020 Adjusted Free Cash Flow excludes a voluntary contribution to the Company’s corporate defined benefit pension plan, the cash impact from restructuring, and a capital investment related to construction of a new,
state-of-the-art naval facility for the DRG business (Power segment).

First Quarter 2020 End Market Sales Growth Notes: Percentages in chart relate to First Quarter 2020
sales compared with the prior year. Amounts may not add due to rounding.Any references to organic growth exclude the effects of foreign currency translation, acquisitions and divestitures, unless otherwise noted. 1Q’20Change % of Total
Sales Aero Defense 29% 17% Ground Defense 9% 4% Naval Defense 26% 27% Total Defense 26% 48% Commercial Aero (2%) 17% Power Generation (13%) 14% General Industrial (15%) 21% Total Commercial (11%) 52% Total
Curtiss-Wright 4% 100% Commercial Markets: Down 11% overall, down 11% organicCommercial Aerospace: Lower sales of flight test instrumentation equipment, partially offset by higher sales of actuation equipmentPower Generation: Lower
international aftermarket and CAP1000 program revenues (timing)General Industrial: Reduced demand for industrial vehicle products and surface treatment services Key DriversDefense Markets: Up 26% overall, up 20% organicAerospace Defense:
Higher COTS embedded computing revenues on UAV and helicopter programs; Higher actuation revenues on F-35Ground Defense: Higher COTS embedded computing revenues on Bradley platformNaval Defense: Higher revenues on CVN-80/81 aircraft carriers
and Virginia class submarine programs; contribution from 901D acquisition
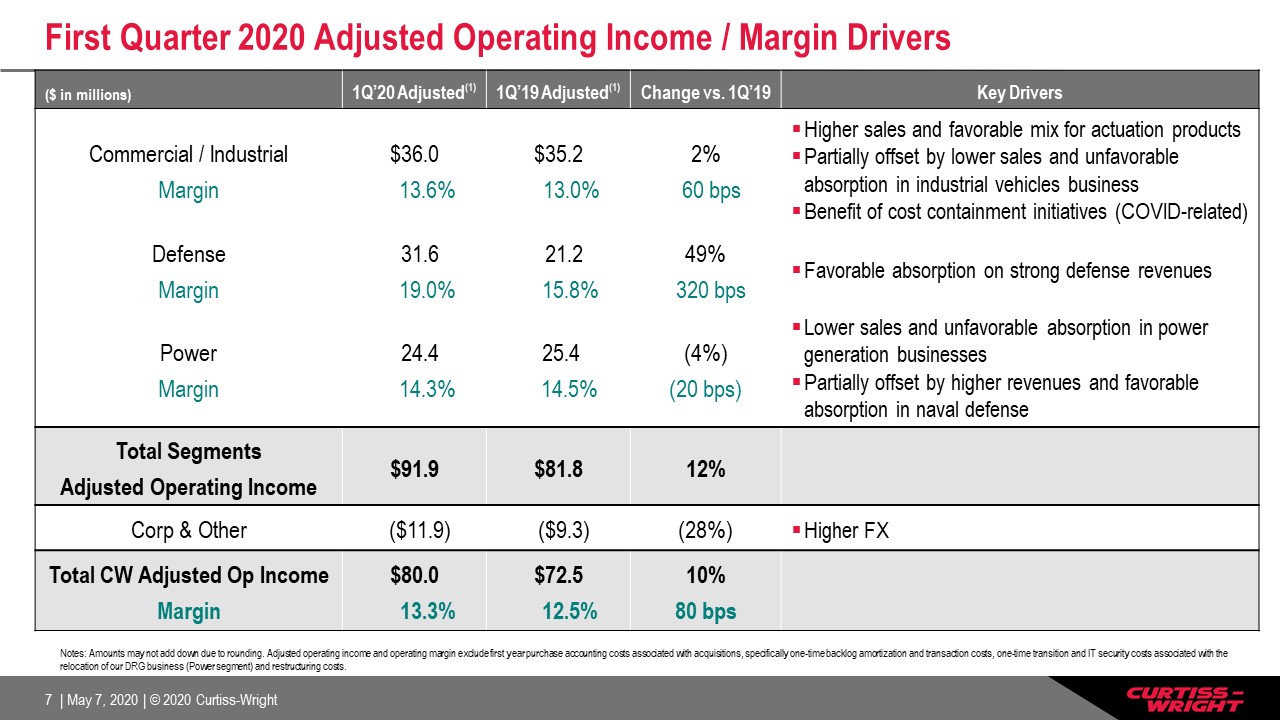
First Quarter 2020 Adjusted Operating Income / Margin Drivers ($ in millions) 1Q’20 Adjusted(1) 1Q’19
Adjusted(1) Change vs. 1Q’19 Key Drivers Commercial / IndustrialMargin $36.0 13.6% $35.2 13.0% 2% 60 bps Higher sales and favorable mix for actuation productsPartially offset by lower sales and unfavorable absorption in industrial
vehicles business Benefit of cost containment initiatives (COVID-related) DefenseMargin 31.6 19.0% 21.2 15.8% 49% 320 bps Favorable absorption on strong defense revenues PowerMargin 24.4 14.3% 25.4 14.5% (4%)(20 bps) Lower sales
and unfavorable absorption in power generation businessesPartially offset by higher revenues and favorable absorption in naval defense Total SegmentsAdjusted Operating Income $91.9 $81.8 12% Corp & Other ($11.9)
($9.3) (28%) Higher FX Total CW Adjusted Op IncomeMargin $80.0 13.3% $72.5 12.5% 10%80 bps Notes: Amounts may not add down due to rounding. Adjusted operating income and operating margin exclude first year purchase accounting costs
associated with acquisitions, specifically one-time backlog amortization and transaction costs, one-time transition and IT security costs associated with the relocation of our DRG business (Power segment) and restructuring costs.

2020 Financial Outlook and Assumptions Sales PROFITABILITY Defense Markets: Expect organic growth
led by naval defenseStrong DoD support for submarines and aircraft carriers; Stable order activityCommercial Markets: Expect growth to be challenging, primarily in the commercial aerospace and general industrial markets (globally)GI: Reduced
demand across all CW markets due to COVID-19 and lower oil pricesMagnitude of decline depends on pace of global recovery Expect overall profitability to be challenged due to significantly lower volume and under-absorption Remain positive in
DefenseCost containment actions aimed at preventing margin erosionEstimated decremental margin 25% - 30% (overall CW)Restructuring actions disclosed in Feb 2020 remain on trackExpected to drive approximately $20M in future annualized savings

Strong Balance Sheet and Liquidity (at March 31, 2020) Cash balance: $158MAdjusted Debt: $896M$750M
private placement and $146M drawn from revolver$100M in notes maturing in next three years (2021)Revolver: $500M (Current Capacity $324M)Plus $200M accordion feature Maturing in 2023Borrowing Capacity $1.5B before reaching debt covenants
Adjusted Net Debt / Net Cap: 31% Manage to internal 45% net debt / cap limitationNear-term maturities remain well funded Adjusted Debt / EBITDA: 1.7xAdjusted Net Debt / EBITDA: 1.4xInterest Coverage: 16.9xMaintain significant financial
flexibility for acquisitions and other corporate needs CASH AND DEBT LEVELS LEVERAGE RATIOS(1) Maintain Flexible and Conservative Capital Structure (1) Adjusted Debt defined as total debt less unamortized swap proceeds and debt issuance
costs. Adjusted Net Debt defined as Adjusted Debt less Cash and cash equivalents. Adjusted Debt / EBITDA defined as Adjusted Debt divided by LTM EBITDA. Adjusted Net Debt / EBITDA defined as Adjusted Net Debt divided by LTM EBITDA. Interest
Coverage defined as LTM EBITDA divided by LTM Interest Expense.
Actions Taken to Offset COVID-19 Impact on 2020 Results Implementing mitigation plans to protect
ProfitabilityReducing discretionary spendEmployee furloughs (including Executive Leadership team)Reductions in forceLower incentive compensationSlowing pace of R&D investments slightly (still expect to exceed 2019 spending level)…And Free
Cash FlowIntense focus on managing working capitalTemporarily reduced pace of CapEx spending for essential investments onlyMonitoring potential benefits of tax and other legislation resulting from COVID-19Maintain strong financial and
operational disciplineExecuted $100M Opportunistic share repurchase program in Mar’20

2020 Summary and Expectations Expect solid revenue growth in Defense; Commercial market outlook impacted
by pace of economic rebound/recoveryRecent acquisitions providing modest boost to top-lineExpect Q2 to be weakest for sales and operating incomeAgile business model helps mitigate impact of reduced profitabilityBenefit of new cost containment
measures and ongoing margin improvement initiatives Planned restructuring actions to drive approximately $20M in future annualized savingsMaintain flexible and conservative capital structure, with ample liquidity Adjusted FCF outlook remains
solid: Targeting at least 100% Adj. FCF conversion Hope to reinstate 2020 guidance with our 2Q earnings announcement Curtiss-Wright remains well-positioned to weather the challenging environment
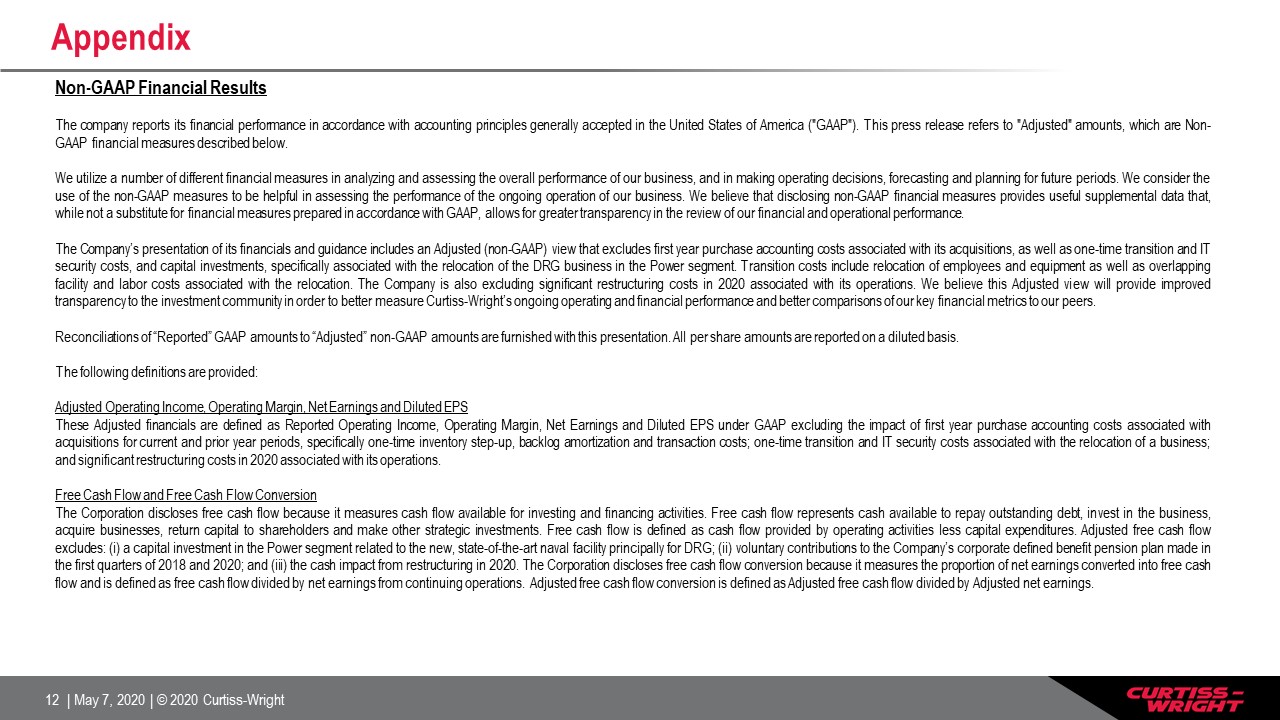
Appendix Non-GAAP Financial Results The company reports its financial performance in accordance with
accounting principles generally accepted in the United States of America ("GAAP"). This press release refers to "Adjusted" amounts, which are Non-GAAP financial measures described below. We utilize a number of different financial measures in
analyzing and assessing the overall performance of our business, and in making operating decisions, forecasting and planning for future periods. We consider the use of the non-GAAP measures to be helpful in assessing the performance of the
ongoing operation of our business. We believe that disclosing non-GAAP financial measures provides useful supplemental data that, while not a substitute for financial measures prepared in accordance with GAAP, allows for greater transparency in
the review of our financial and operational performance. The Company’s presentation of its financials and guidance includes an Adjusted (non-GAAP) view that excludes first year purchase accounting costs associated with its acquisitions, as
well as one-time transition and IT security costs, and capital investments, specifically associated with the relocation of the DRG business in the Power segment. Transition costs include relocation of employees and equipment as well as
overlapping facility and labor costs associated with the relocation. The Company is also excluding significant restructuring costs in 2020 associated with its operations. We believe this Adjusted view will provide improved transparency to the
investment community in order to better measure Curtiss-Wright’s ongoing operating and financial performance and better comparisons of our key financial metrics to our peers. Reconciliations of “Reported” GAAP amounts to “Adjusted” non-GAAP
amounts are furnished with this presentation. All per share amounts are reported on a diluted basis. The following definitions are provided: Adjusted Operating Income, Operating Margin, Net Earnings and Diluted EPSThese Adjusted financials are
defined as Reported Operating Income, Operating Margin, Net Earnings and Diluted EPS under GAAP excluding the impact of first year purchase accounting costs associated with acquisitions for current and prior year periods, specifically one-time
inventory step-up, backlog amortization and transaction costs; one-time transition and IT security costs associated with the relocation of a business; and significant restructuring costs in 2020 associated with its operations.Free Cash Flow and
Free Cash Flow ConversionThe Corporation discloses free cash flow because it measures cash flow available for investing and financing activities. Free cash flow represents cash available to repay outstanding debt, invest in the business,
acquire businesses, return capital to shareholders and make other strategic investments. Free cash flow is defined as cash flow provided by operating activities less capital expenditures. Adjusted free cash flow excludes: (i) a capital
investment in the Power segment related to the new, state-of-the-art naval facility principally for DRG; (ii) voluntary contributions to the Company’s corporate defined benefit pension plan made in the first quarters of 2018 and 2020; and (iii)
the cash impact from restructuring in 2020. The Corporation discloses free cash flow conversion because it measures the proportion of net earnings converted into free cash flow and is defined as free cash flow divided by net earnings from
continuing operations. Adjusted free cash flow conversion is defined as Adjusted free cash flow divided by Adjusted net earnings.
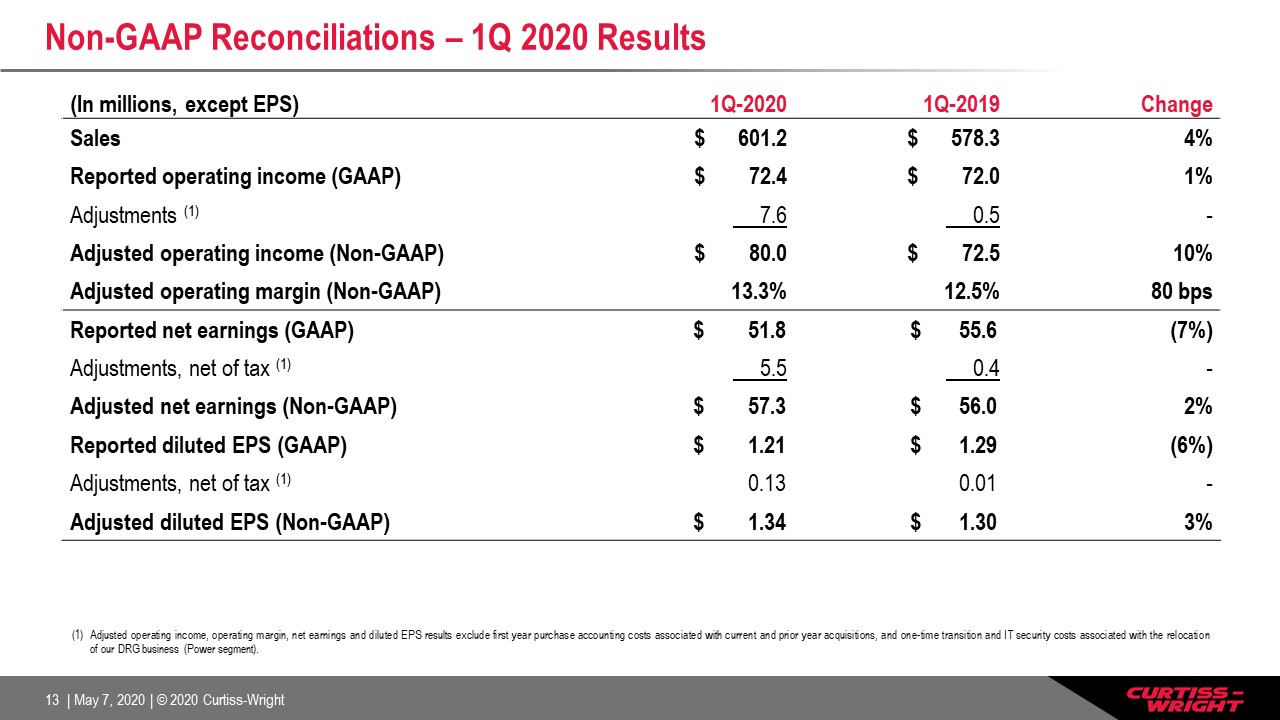
Non-GAAP Reconciliations – 1Q 2020 Results (In millions, except EPS) 1Q-2020 1Q-2019
Change Sales $ 601.2 $ 578.3 4% Reported operating income (GAAP) $ 72.4 $ 72.0 1% Adjustments (1) 7.6 0.5 - Adjusted operating income (Non-GAAP) $ 80.0 $ 72.5 10% Adjusted operating margin (Non-GAAP) 13.3% 12.5% 80
bps Reported net earnings (GAAP) $ 51.8 $ 55.6 (7%) Adjustments, net of tax (1) 5.5 0.4 - Adjusted net earnings (Non-GAAP) $ 57.3 $ 56.0 2% Reported diluted EPS (GAAP) $ 1.21 $ 1.29 (6%) Adjustments, net of tax
(1) 0.13 0.01 - Adjusted diluted EPS (Non-GAAP) $ 1.34 $ 1.30 3% Adjusted operating income, operating margin, net earnings and diluted EPS results exclude first year purchase accounting costs associated with current and prior year
acquisitions, and one-time transition and IT security costs associated with the relocation of our DRG business (Power segment).
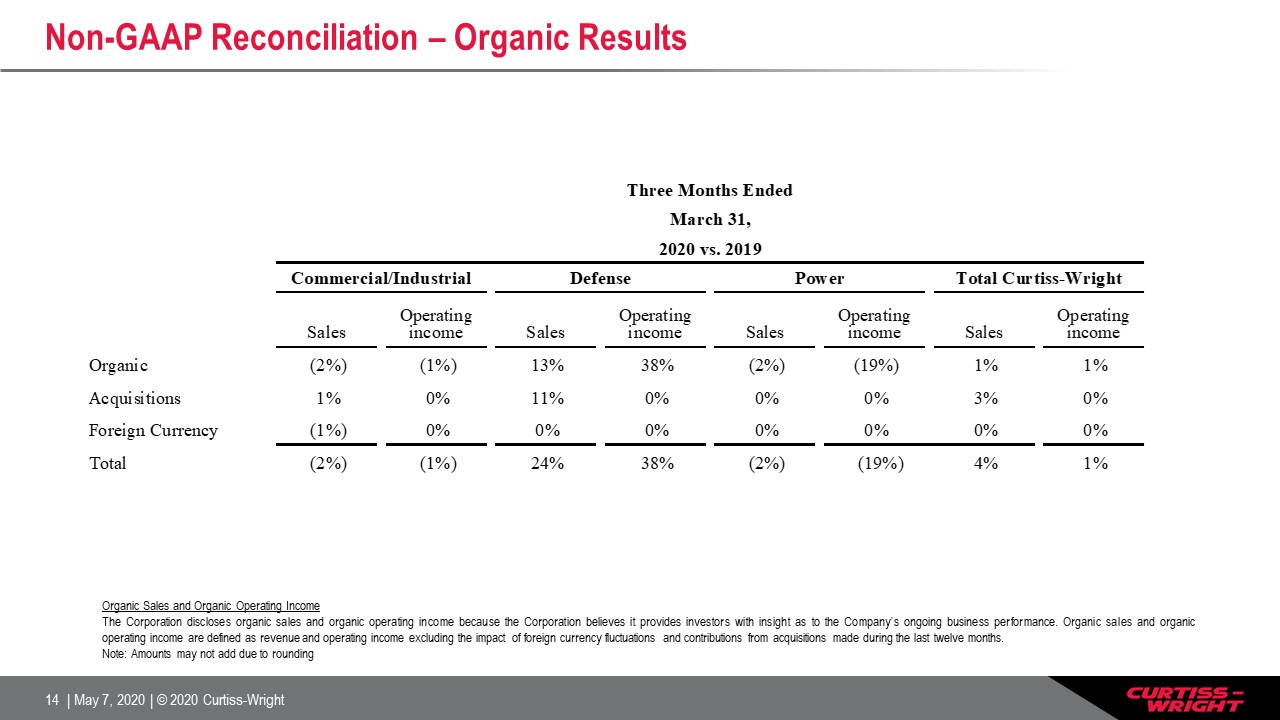
Non-GAAP Reconciliation – Organic Results Organic Sales and Organic Operating IncomeThe Corporation
discloses organic sales and organic operating income because the Corporation believes it provides investors with insight as to the Company’s ongoing business performance. Organic sales and organic operating income are defined as revenue and
operating income excluding the impact of foreign currency fluctuations and contributions from acquisitions made during the last twelve months.Note: Amounts may not add due to rounding

Non-GAAP Reconciliation – Adjusted Debt and Adjusted Net Debt Adjusted Debt and Adjusted Net DebtThe
Corporation discloses Adjusted Debt and Adjusted Net Debt as it believes that these measures provide useful information regarding contractual amounts of borrowed capital to be repaid, net of cash available to repay such obligations. Adjusted
Debt is defined as consolidated short-term and long-term debt (reported in accordance with GAAP), adjusted to exclude unamortized interest rate swap proceeds and debt issuance costs. Adjusted Net Debt is defined as Adjusted Debt less cash and
cash equivalents.
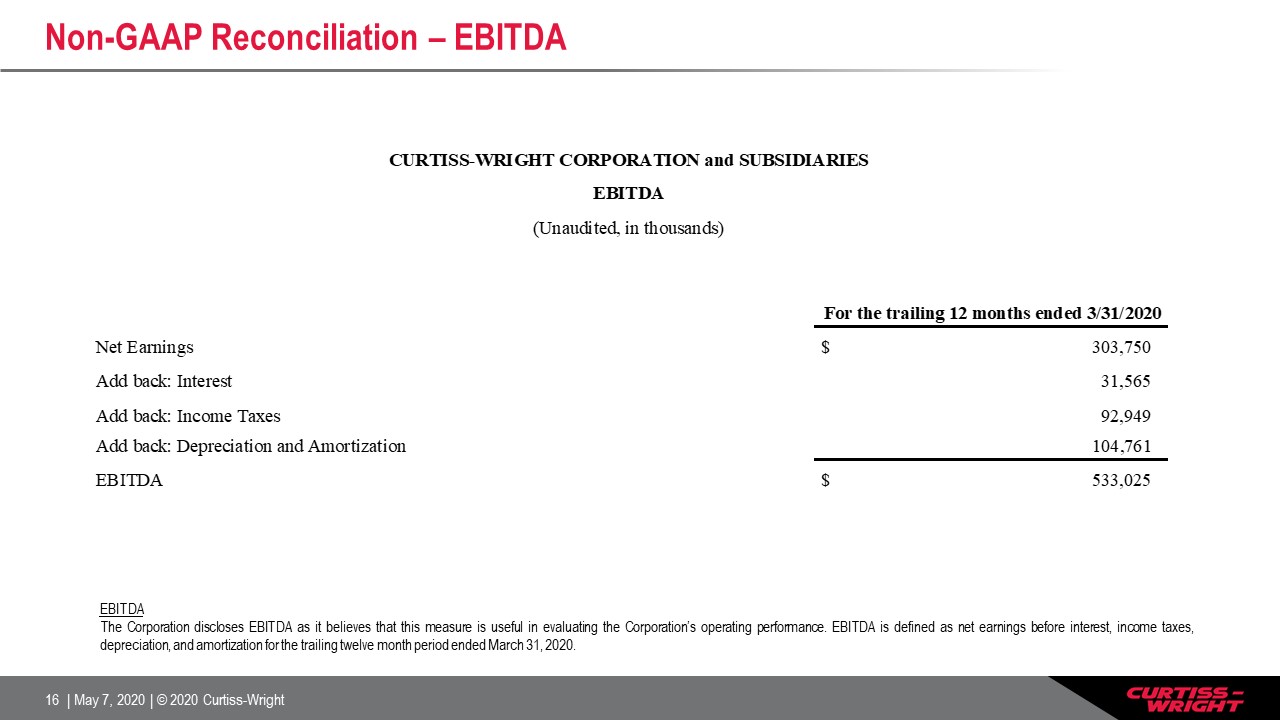
Non-GAAP Reconciliation – EBITDA EBITDAThe Corporation discloses EBITDA as it believes that this measure
is useful in evaluating the Corporation’s operating performance. EBITDA is defined as net earnings before interest, income taxes, depreciation, and amortization for the trailing twelve month period ended March 31, 2020.
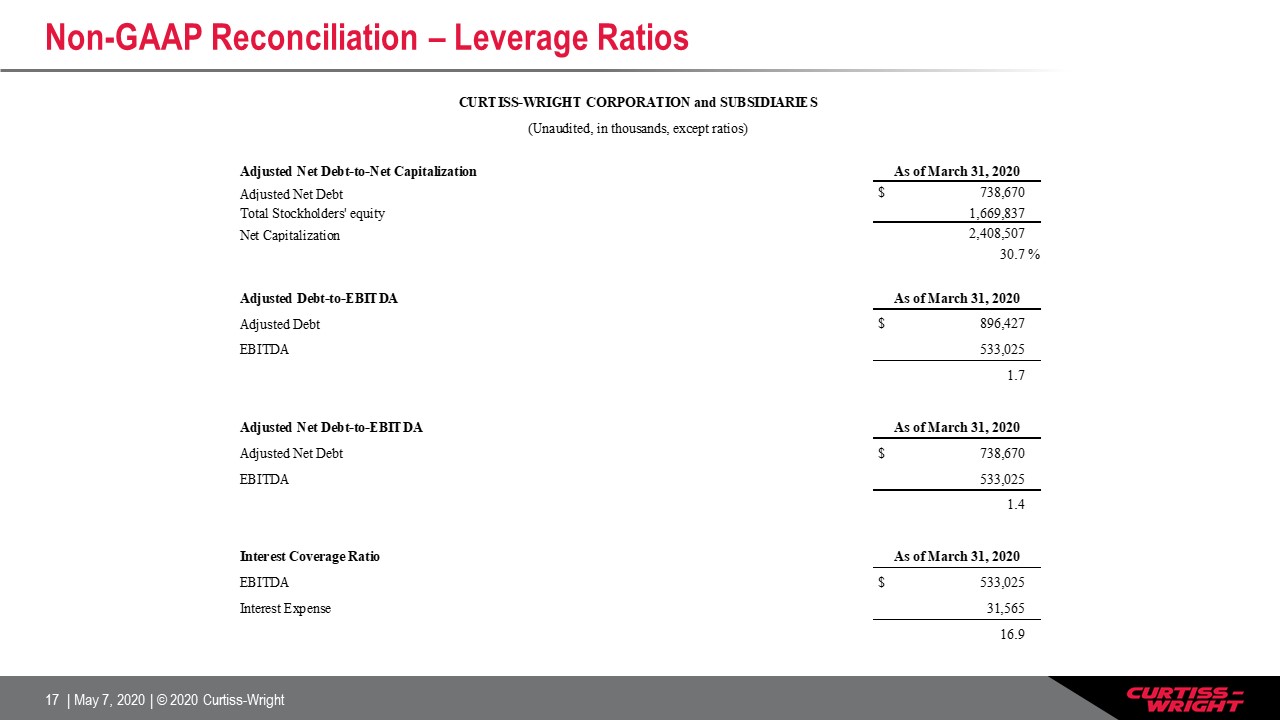
Non-GAAP Reconciliation – Leverage Ratios