Attached files
| file | filename |
|---|---|
| 8-K - 8-K - Citi Trends Inc | a19-2816_18k.htm |
| EX-99.1 - EX-99.1 - Citi Trends Inc | a19-2816_1ex99d1.htm |
This presentation contains “forward-looking statements” within the meaning of the federal securities laws and is intended to qualify for the Safe Harbor from liability established by the Private Securities Litigation Reform Act of 1995, including statements regarding expected sales, the outlook for Citi Trends’ markets and the demand for its products. These projections and statements are based on management’s estimates and assumptions with respect to future events and financial performance and are believed to be reasonable, though are inherently uncertain and difficult to predict. Actual results could differ materially from those projected as a result of certain factors. A discussion of factors that could cause results to vary is included in the section entitled “Risk Factors” in the Company’s most recent Annual Report on Form 10-K filed with the Securities and Exchange Commission. Cautionary Note about Forward-Looking Statements 2
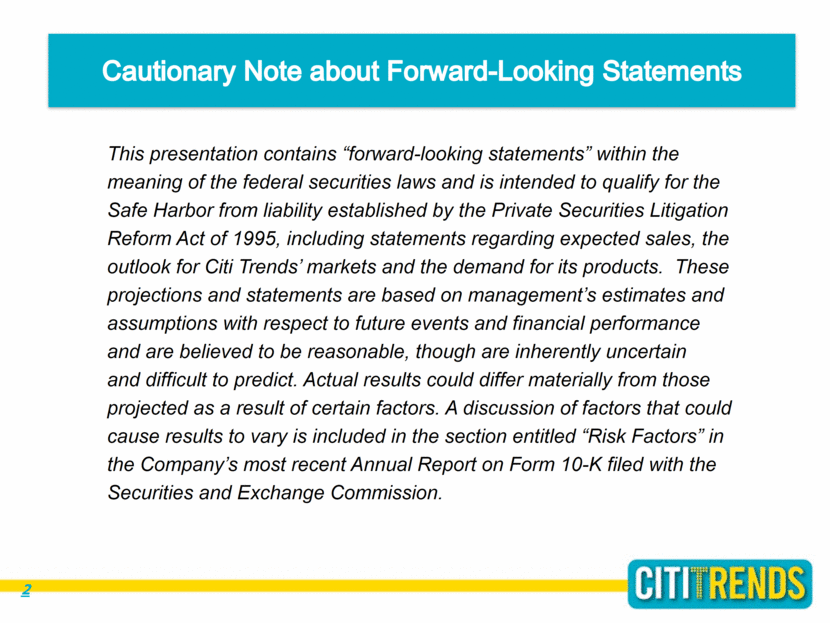
3 The Citi Trends Investment Opportunity 1. GROWTH 2. Merchandising Initiatives 3. Operational Initiatives 4. Commitment to Return Excess Capital to Shareholders
Company Overview Retailer of value-priced, urban fashion apparel and accessories Large customer base focused on trend-setting fashions at a value; 70% African American Differentiated apparel & non-apparel for the entire family Current fashions and brands that are 20% to 70% below mall and specialty store prices Specialty store feel, but with value pricing A degree of insulation against e-commerce - Low price points - Convenient locations - Buy-now; wear-now customer 4
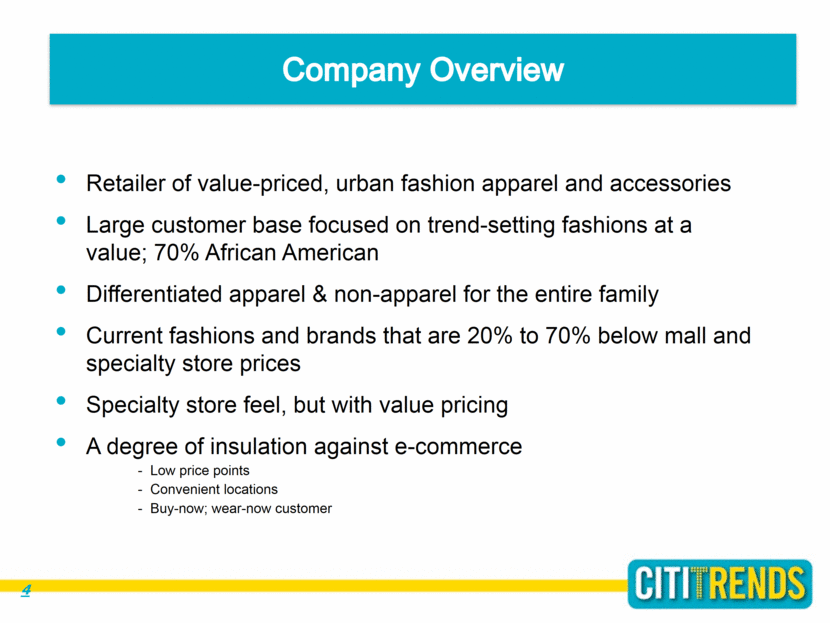
Existing store base of 558 locations Corporate Headquarters Distribution Center New markets entered in FY 2005 – 2018 Buying Office Store Locations 49 6 35 6 13 26 52 64 31 44 17 48 21 6 17 28 5 23 20 6 6 1 9 1 2 2 9 1 2 2 4 5 2
Serving the under-served low-to- moderate income consumer Serving the entire family with apparel, footwear, accessories and home High focus on current fashions, but has to be at a value Spends a higher proportion of income on apparel than other consumers The Citi Trends Customer 6
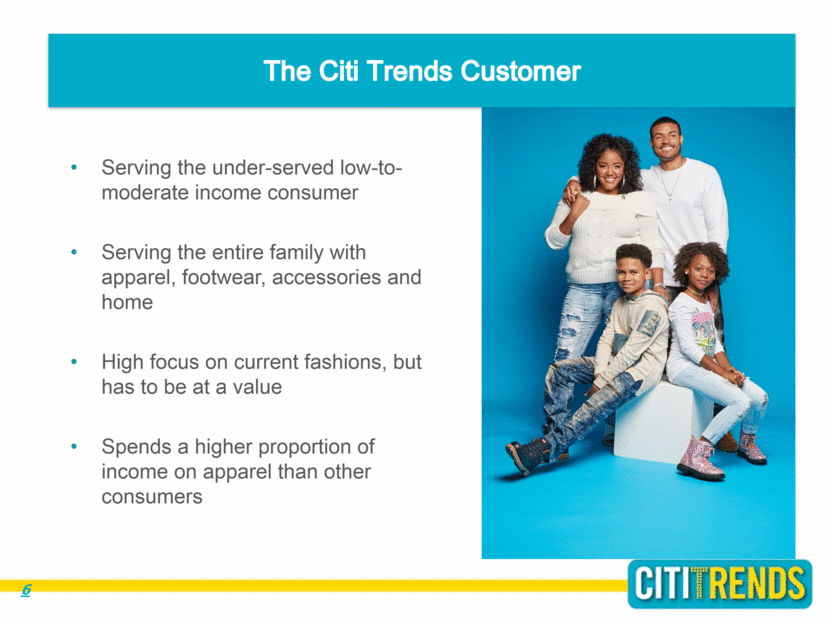
Brands At Off-Price Values 7
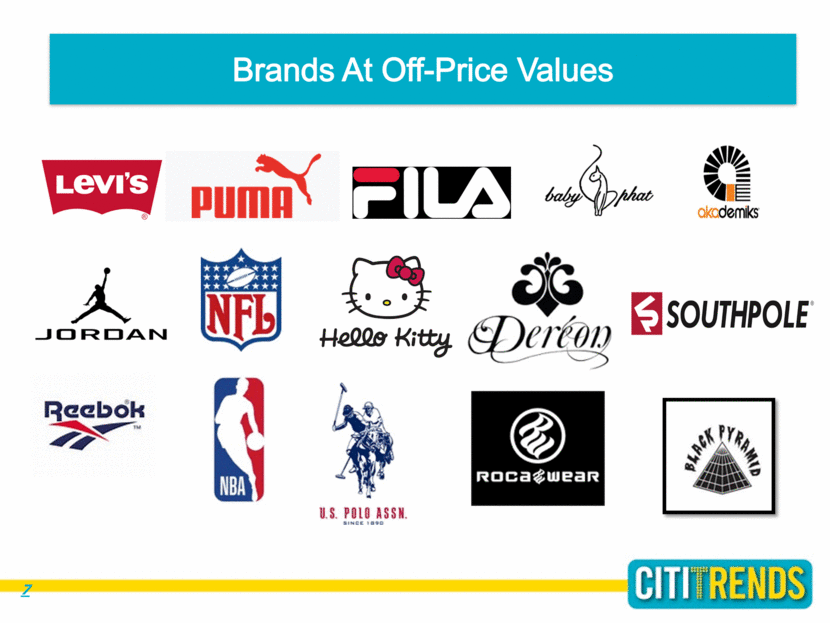
Family–Focused Merchandise Offering Value-priced apparel Growth in non-apparel Destination focus for the entire family Differentiated from competitors Net Sales(a) Fiscal 2017 Includes footwear, handbags, jewelry and other categories 8 Ladies’ 23% Children's 23% Men's 17% Accessories (b) 32% Home 5%
9 The Citi Trends Investment Opportunity 1. GROWTH 2. Merchandising Initiatives 3. Operational Initiatives 4. Commitment to Return Excess Capital to Shareholders
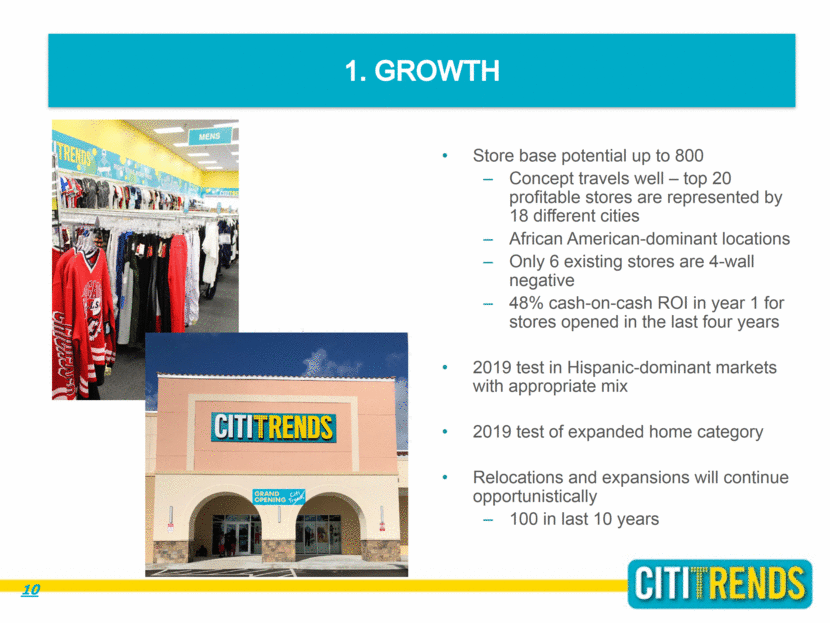
10 1. GROWTH Store base potential up to 800 Concept travels well – top 20 profitable stores are represented by 18 different cities African American-dominant locations Only 6 existing stores are 4-wall negative 48% cash-on-cash ROI in year 1 for stores opened in the last four years 2019 test in Hispanic-dominant markets with appropriate mix 2019 test of expanded home category Relocations and expansions will continue opportunistically 100 in last 10 years
Opportunity in Hispanic-Dominant Markets Already have Hispanic penetration in existing stores: 36 existing stores with at least 40% Hispanic population within 3 miles Sales in such stores are 10% higher than the Company average 4-wall profit is virtually identical to the Company average 200 existing stores have bilingual signage Opportunity is significant 11
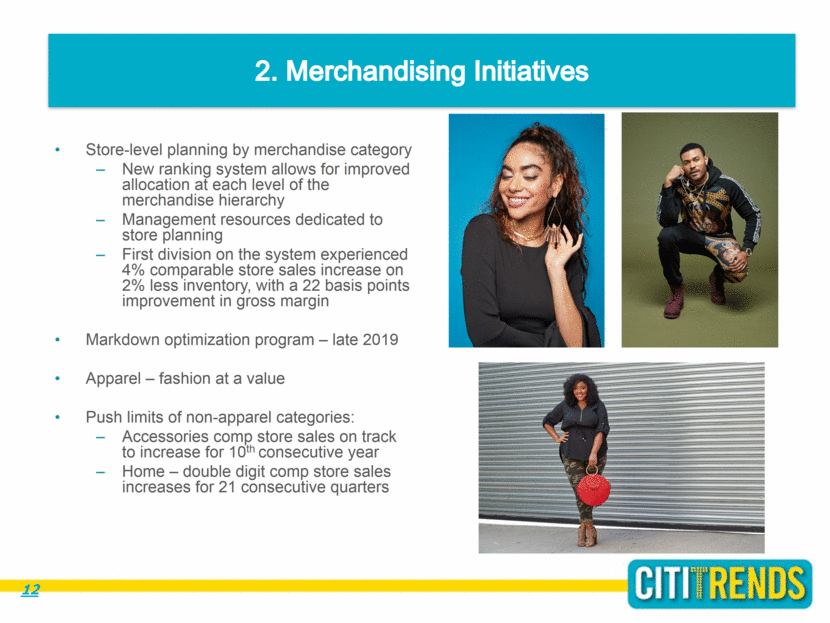
12 2. Merchandising Initiatives Store-level planning by merchandise category New ranking system allows for improved allocation at each level of the merchandise hierarchy Management resources dedicated to store planning First division on the system experienced 4% comparable store sales increase on 2% less inventory, with a 22 basis points improvement in gross margin Markdown optimization program – late 2019 Apparel – fashion at a value Push limits of non-apparel categories: Accessories comp store sales on track to increase for 10th consecutive year Home – double digit comp store sales increases for 21 consecutive quarters
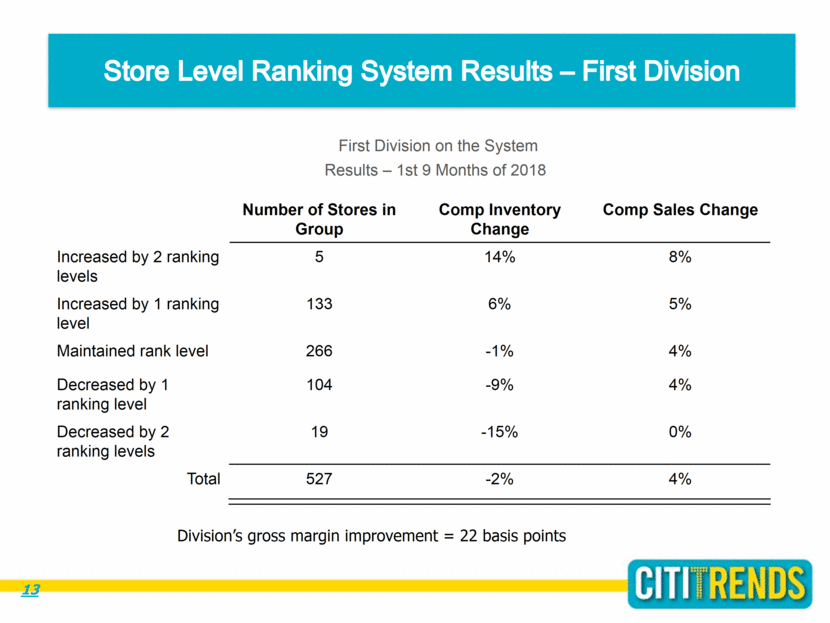
13 Store Level Ranking System Results – First Division First Division on the System Results – 1st 9 Months of 2018 Number of Stores in Group Comp Inventory Change Comp Sales Change Increased by 2 ranking levels 5 14% 8% Increased by 1 ranking level 133 6% 5% Maintained rank level 266 -1% 4% Decreased by 1 ranking level 104 -9% 4% Decreased by 2 ranking levels 19 -15% 0% Total 527 -2% 4% Division’s gross margin improvement = 22 basis points
Inventory Turn Improvement Merchandising system initiatives provide opportunity to improve inventory turnover Goal – 6% improvement in turn annually each of next three years Turn improvement should lead to: More timely response to fashion changes Fewer markdowns Higher free cash flow 14
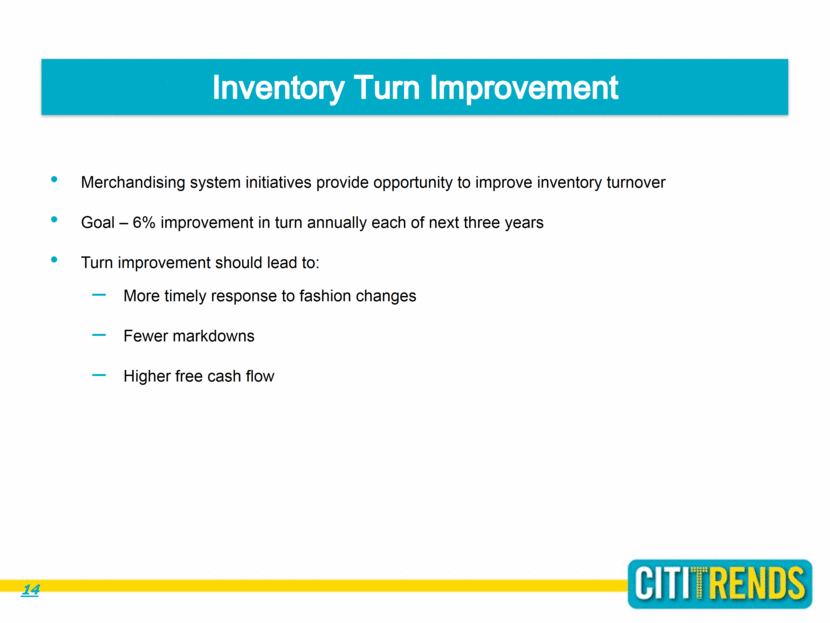
Strategy to Diversify into Complementary Product Lines Our strategy to grow sales of the non-apparel categories of accessories (including footwear) and home products has contributed positively to revenue growth and diversification Accessories & Home ($ in millions) 15 $134 $166 $181 $219 $232 $250 $278 $0 $50 $100 $150 $200 $250 $300 2011 2012 2013 2014 2015 2016 2017 Accessories & Home Sales 21% 25% 29% 33% 34% 36% 37% 0% 10% 20% 30% 40% 50% 60% 70% Accessories & Home Sales - % of Total
Strategy Has Driven Substantially Improved Performance Our merchandising strategies have been a vital factor in driving significant increases in total customer transactions and units sold, as well as improving gross margins significantly due to reduced markdowns Gross Margin Trend Customer Transactions & Total Units Sold (mm) 16 34.8% 36.6% 37.6% 39.0% 38.4% 38.3% 2012 2013 2014 2015 2016 2017 Gross Margin 75.6 77.3 84.8 87.6 95 103.3 22.3 22.4 24.5 25.1 25.9 27.6 2012 2013 2014 2015 2016 2017 Unit Sales Customer Transactions

17 3. Operational Initiatives Packing system upgrade at distribution center Expected payroll reduction - $500k annually starting Q2 2019 Freight consultant engaged Implement a Transportation Management System Leverage consultant’s relationship with shippers Expand the number of in-bound trucking options Reconsider the current out-bound-to-store model Expense consultant engaged Address categories with greatest opportunity (waste management, supplies, signage, packaging, etc.) Leverage consultant’s relationships with suppliers

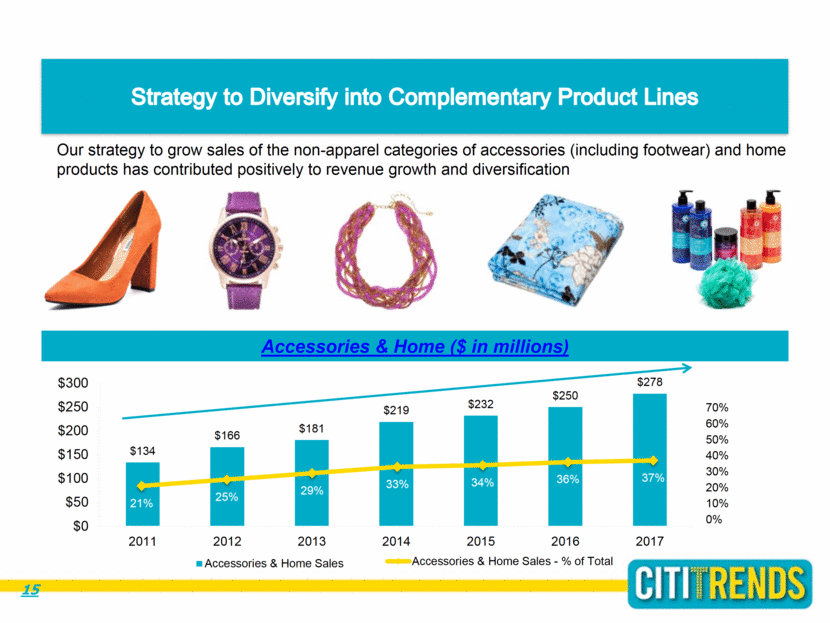
4. Return of Excess Capital Began returning excess cash to stockholders in 2015 - by Initiating a regular dividend Completing a $15 million share buyback Enhanced our capital return program in 2017 – while ensuring adequate reserves to fund growth initiatives and meet other contingencies – by Increasing the regular dividend 33% to $0.32 annually Initiating (and subsequently completing) an additional $25 million share buyback Continued capital return program in 2018 – authorized (and subsequently completed) another $25 million share buyback, and authorized an additional $25 million buyback in November 2018 22% decline in outstanding shares from 15.6 million in 2015 to 12.2 million; $90 million returned to shareholders in the form of dividends and share buybacks $81.6 million of cash and investment securities as of Q3 2018 Expected annual free cash flow of $20 million to $25 million should allow continued capital returns 18
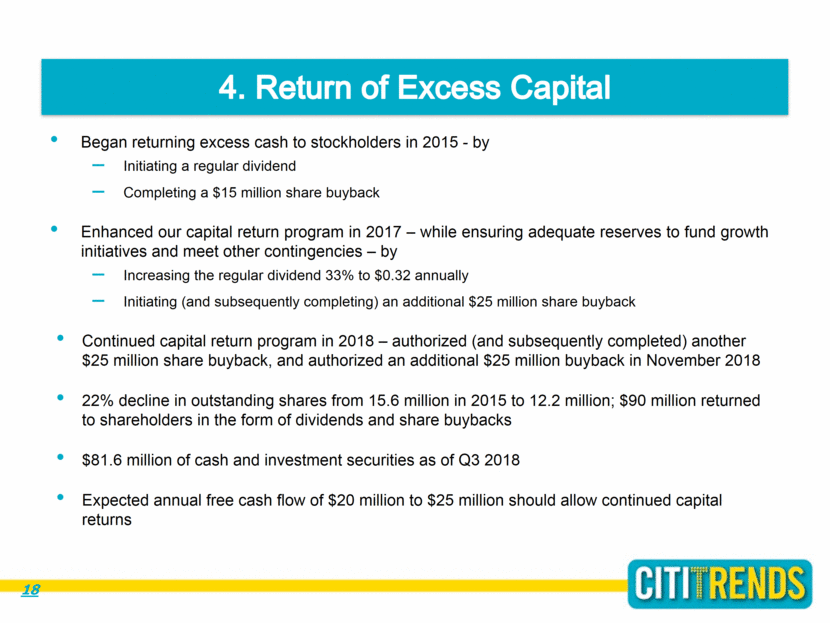
Long-Term Goals Expectations of: Consistent comparable store sales growth in a range around 3% o System initiatives o Expand growth categories Store square footage growth of 4% to 5% o Opportunity in Hispanic-dominated markets 12% to 15% annual earnings growth Return excess capital to shareholders o $90 million returned since the beginning of 2015 o 22% decline in outstanding shares during that timeframe $4 Earnings per share goal within 5 years 19
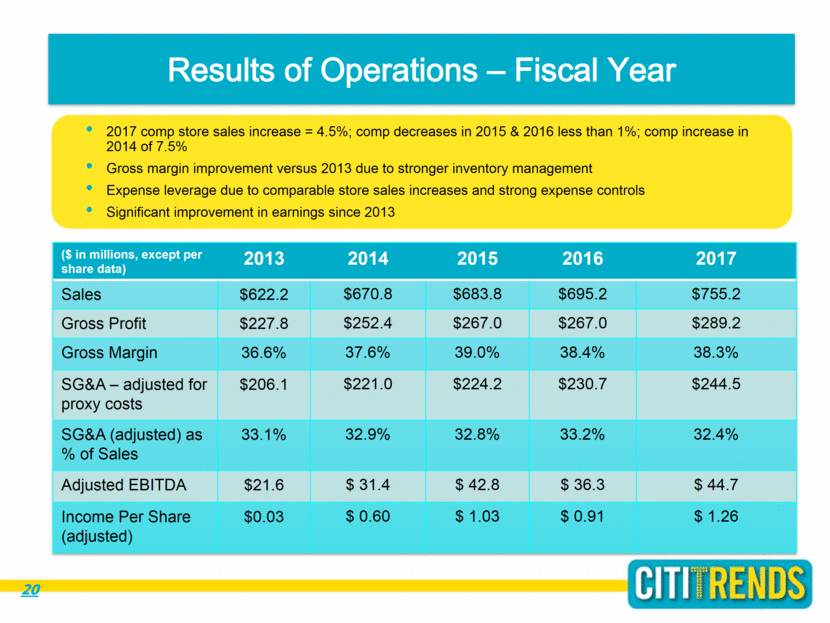
Results of Operations – Fiscal Year 2017 comp store sales increase = 4.5%; comp decreases in 2015 & 2016 less than 1%; comp increase in 2014 of 7.5% Gross margin improvement versus 2013 due to stronger inventory management Expense leverage due to comparable store sales increases and strong expense controls Significant improvement in earnings since 2013 20 ($ in millions, except per share data) 2013 2014 2015 2016 2017 Sales $622.2 $670.8 $683.8 $695.2 $755.2 Gross Profit $227.8 $252.4 $267.0 $267.0 $289.2 Gross Margin 36.6% 37.6% 39.0% 38.4% 38.3% SG&A – adjusted for proxy costs $206.1 $221.0 $224.2 $230.7 $244.5 SG&A (adjusted) as % of Sales 33.1% 32.9% 32.8% 33.2% 32.4% Adjusted EBITDA $21.6 $ 31.4 $ 42.8 $ 36.3 $ 44.7 Income Per Share (adjusted) $0.03 $ 0.60 $ 1.03 $ 0.91 $ 1.26
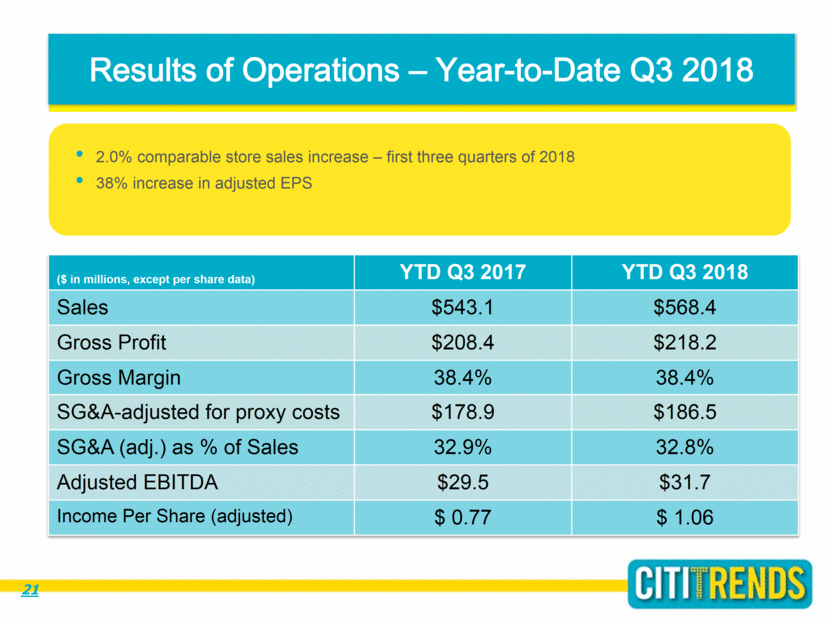
Results of Operations – Year-to-Date Q3 2018 2012 ($ in millions, except per share data) YTD Q3 2017 YTD Q3 2018 Sales $543.1 $568.4 Gross Profit $208.4 $218.2 Gross Margin 38.4% 38.4% SG&A-adjusted for proxy costs $178.9 $186.5 SG&A (adj.) as % of Sales 32.9% 32.8% Adjusted EBITDA $29.5 $31.7 Income Per Share (adjusted) $ 0.77 $ 1.06 2.0% comparable store sales increase – first three quarters of 2018 38% increase in adjusted EPS 21
Reconciliations of Non-GAAP Financial Measures APPENDIX 22
Reconciliation of Non-GAAP Financial Measure EBITDA(1) & Adjusted EBITDA reconciled to Net Income (Loss) (1) Earnings before interest, taxes, depreciation & amortization. ($ in thousands) 2013 2014 2015 2016 2017 First 3Q 2017 First 3Q 2018 Net income (loss) $464 $8,966 $15,527 $13,331 $14,574 $9,327 $14,027 Plus: Interest expense 194 200 242 159 150 112 114 Income tax expense - 2,144 8,787 6,020 8,926 4,238 3,152 Depreciation and amortization 21,974 20,177 18,577 17,090 18,883 13,863 14,250 Less: Interest Income (281) (187) (339) (571) (883) (617) (979) Income tax benefit (754) - - - - - - EBITDA 21,597 31,300 42,794 36,029 41,650 26,923 30,564 Asset impairment 1,542 83 - 313 507 77 1,122 Proxy Contest Expenses - - - - 2,516 2,516 - Gain on sale of former (1,526) - - - - - - distribution center Adjusted EBITDA $21,613 $31,383 $42,794 $36,342 $44,673 $29,516 $31,686 23

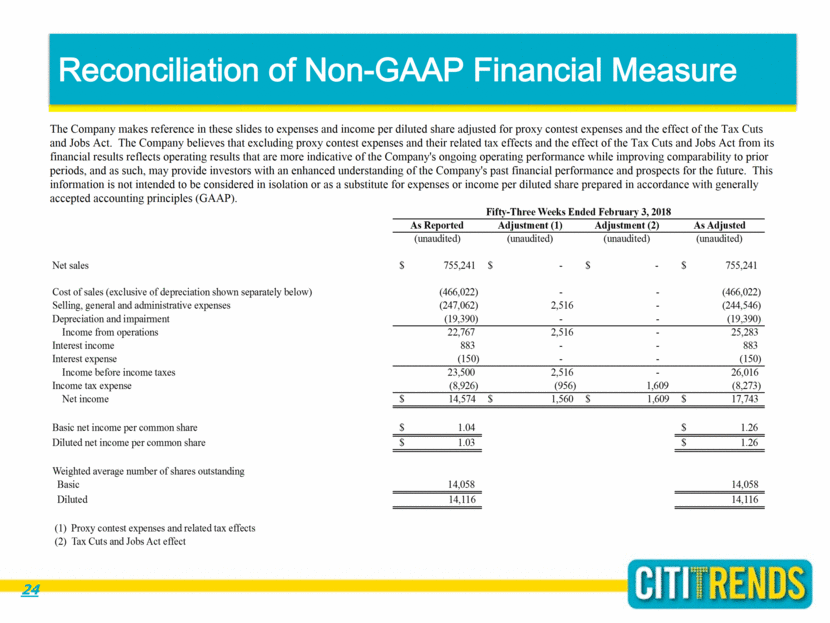
Reconciliation of Non-GAAP Financial Measure 24 The Company makes reference in these slides to expenses and income per diluted share adjusted for proxy contest expenses and the effect of the Tax Cuts and Jobs Act. The Company believes that excluding proxy contest expenses and their related tax effects and the effect of the Tax Cuts and Jobs Act from its financial results reflects operating results that are more indicative of the Company's ongoing operating performance while improving comparability to prior periods, and as such, may provide investors with an enhanced understanding of the Company's past financial performance and prospects for the future. This information is not intended to be considered in isolation or as a substitute for expenses or income per diluted share prepared in accordance with generally accepted accounting principles (GAAP). A s R e p or te d A d ju s tme n t (1) A d ju s tme n t (2) A s A d ju s te d (una udi t e d) (una udi t e d) (una udi t e d) (una udi t e d) N e t s a l e s 755,241 $ - $ - $ 755,241 $ Cos t of s a l e s (e xc l us i ve of de pre c i a t i on s how n s e pa ra t e l y be l ow ) (466,022) - - (466,022) S e l l i ng, ge ne ra l a nd a dm i ni s t ra t i ve e xpe ns e s (247,062) 2,516 - (244,546) D e pre c i a t i on a nd i m pa i rm e nt (19,390) - - (19,390) Inc om e from ope ra t i ons 22,767 2,516 - 25,283 Int e re s t i nc om e 883 - - 883 Int e re s t e xpe ns e (150) - - (150) Inc om e be fore i nc om e t a xe s 23,500 2,516 - 26,016 Inc om e t a x e xpe ns e (8,926) (956) 1,609 (8,273) N e t i nc om e 14,574 $ 1,560 $ 1,609 $ 17,743 $ Ba s i c ne t i nc om e pe r c om m on s ha re 1.04 $ 1.26 $ D i l ut e d ne t i nc om e pe r c om m on s ha re 1.03 $ 1.26 $ W e i ght e d a ve ra ge num be r of s ha re s out s t a ndi ng Ba s i c 14,058 14,058 D i l ut e d 14,1 16 14,1 16 (1) P roxy c ont e s t e xpe ns e s a nd re l a t e d t a x e f fe c t s (2) T a x Cut s a nd J obs A c t e f fe c t F i fty-Th r e e W e e k s En d e d F e b r u ar y 3, 2018
CITITRENDS


