Attached files
| file | filename |
|---|---|
| 8-K - 8-K - BLACKSTONE MORTGAGE TRUST, INC. | d629004d8k.htm |
| EX-99.1 - EX-99.1 - BLACKSTONE MORTGAGE TRUST, INC. | d629004dex991.htm |
 Blackstone Mortgage Trust, Inc. October 23, 2018 Third Quarter 2018 Results Exhibit 99.2 |
 Blackstone Mortgage Trust 1 BXMT Highlights Information included in this presentation is as of or for the period ended September 30, 2018, unless otherwise indicated.
(a) See Appendix for a definition and reconciliation to GAAP net income (b) Based on annualized dividend and BXMT closing price as of October 22, 2018
(c) Reflects weighted average LTV as of the date investments were originated or acquired by BXMT
(d) Includes $467 million of Non-Consolidated Senior Interests and investment exposure to the $1.0 billion 2018 Single Asset
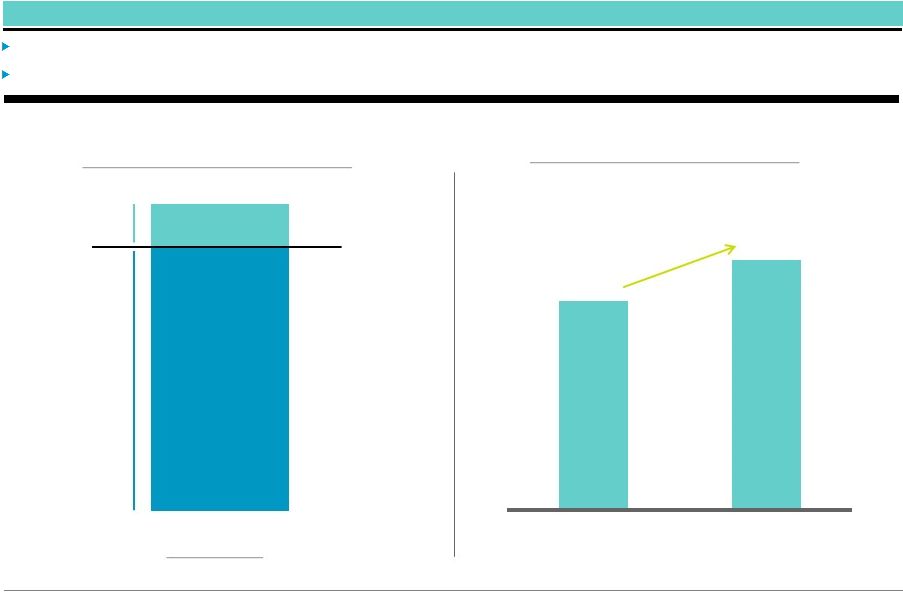
Securitization through a $99 million subordinate risk retention interest BXMT generated 3Q EPS of $0.67 and Core EPS (a) of $0.75 through continued growth in its first mortgage origination business +24% ($ in billions) Portfolio Growth (d) $11.1 $13.8 YE 2017 3Q'18 Loan-to-Value (c)(d) Dividend Yield (b) 62% 7.5% 100% 95% Performing Floating Rate (d) |
 Blackstone Mortgage Trust 2 Originations Originations $1.4 billion of originations in 3Q and record YTD originations of $7.2 billion, more than doubling 1Q-3Q 2017 volume Continued international growth: originated $316 million of loans in Australia bringing YTD non-US originations to $1.9 billion Earnings & Dividends Earnings & Dividends EPS of $0.67 and Core Earnings (a) per share of $0.75 Book value per share increased to $27.53, up 12% since 2013 re-IPO; paid $0.62 per share dividend Third Quarter 2018 Results Portfolio Composition Portfolio Composition Capitalization Capitalization Interest Rates Interest Rates Portfolio grew 24% YTD to $13.8 billion (b) 100% performing portfolio with a weighted average origination LTV (b)(c) of 62% Issued 8.2 million shares at 1.21x P/B, generating $270 million of gross proceeds and adding $0.38 to book value per share through accretive issuance levels Grew credit capacity by $2.2 billion YTD and expanded multi-currency funding capabilities (a) See Appendix for a definition and reconciliation to GAAP net income (b) Includes $467 million of Non-Consolidated Senior Interests and investment exposure to the $1.0 billion 2018 Single Asset
Securitization through a $99 million subordinate risk retention interest (c) Reflects weighted average LTV as of the date investments were originated or acquired by BXMT
95%
of
the
portfolio
(b)
is
floating
rate
Floating
rate
assets
and
matched
liabilities
support
book
value
and
earnings
stability |
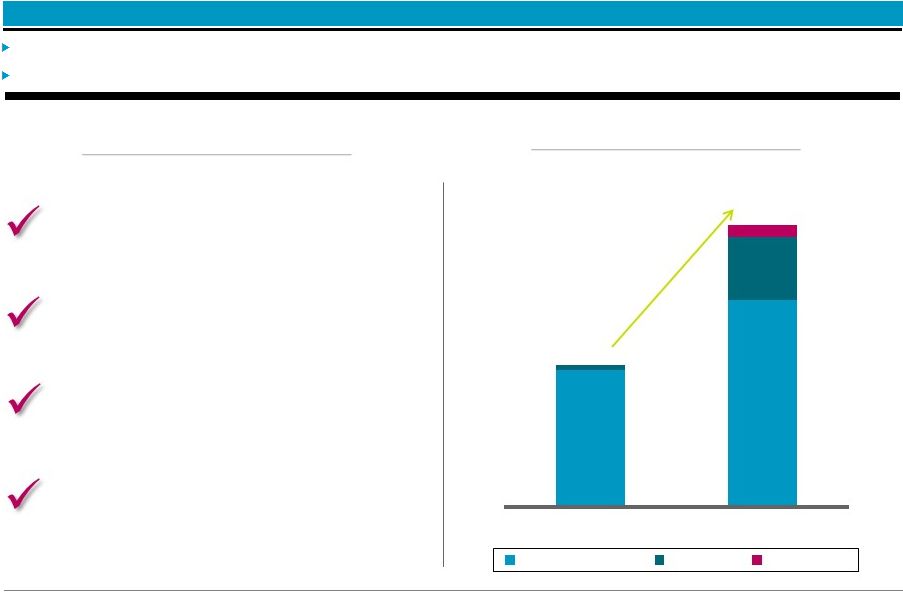
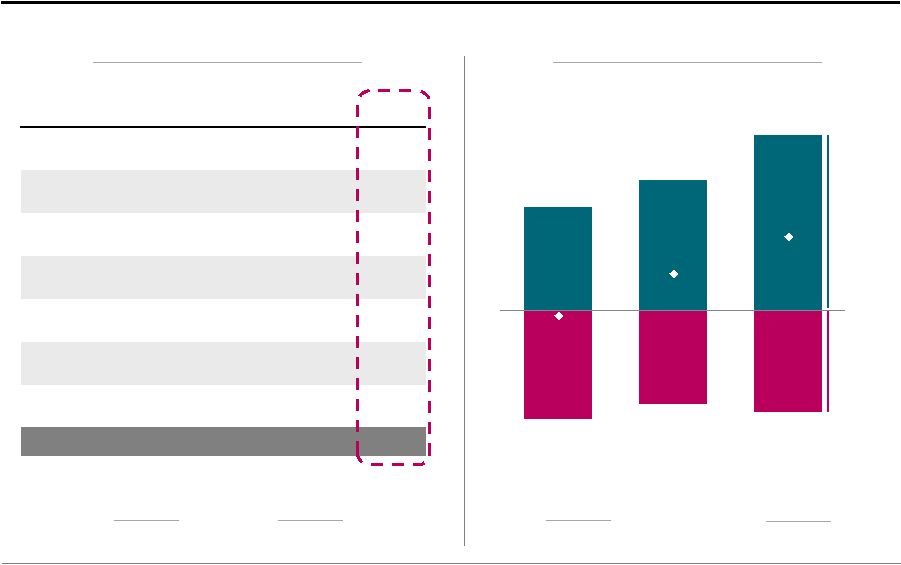
 Blackstone Mortgage Trust 3 $2.48 $0.40 Earnings & Dividends Earnings & Dividends 3Q GAAP EPS of $0.67 and Core Earnings (a) of $0.75 per share, $0.62 per share dividend equates to a 7.5% dividend yield (b) Earnings in excess of $0.62 quarterly dividend contributed to book value, which has grown 12% since 2013 re-IPO (a) See Appendix for a definition and reconciliation to GAAP net income (b) Based on annualized dividend and BXMT closing price as of October 22, 2018
(c) TTM GAAP EPS was $2.49; retained Core Earnings refers to the amount of Core Earnings in excess of dividends paid for the periods
presented
$0.62
Quarterly
Dividend
$24.67
$27.53
Re-IPO
2Q'13
3Q'18
+12%
Dividends Paid
Retained
Core Earnings
Book Value Per Share Growth
TTM Core Earnings Per Share
(c)
116%
TTM Dividend Coverage |
 Blackstone Mortgage Trust 4 $3.5 $5.3 $0.1 $1.6 $0.3 1Q'17 - 3Q'17 1Q'18 - 3Q'18 Originations Originations Origination volume of $1.4 billion in 3Q; $7.2 billion YTD volume is more than double 1Q-3Q 2017 volume Blackstone Real Estate’s scale and reach provide opportunities to access attractive investments in a wide range of markets ($ in billions) Origination Volume 100% performing 100% floating rate $286 million average loan size (b) YTD 2018 Origination Highlights 59% LTV (a) (a) Reflects weighted average LTV as of the date investments were originated or acquired by BXMT
(b) Excludes loans originated in the Walker & Dunlop joint venture $7.2 $3.6 North America Europe Australia +102% |
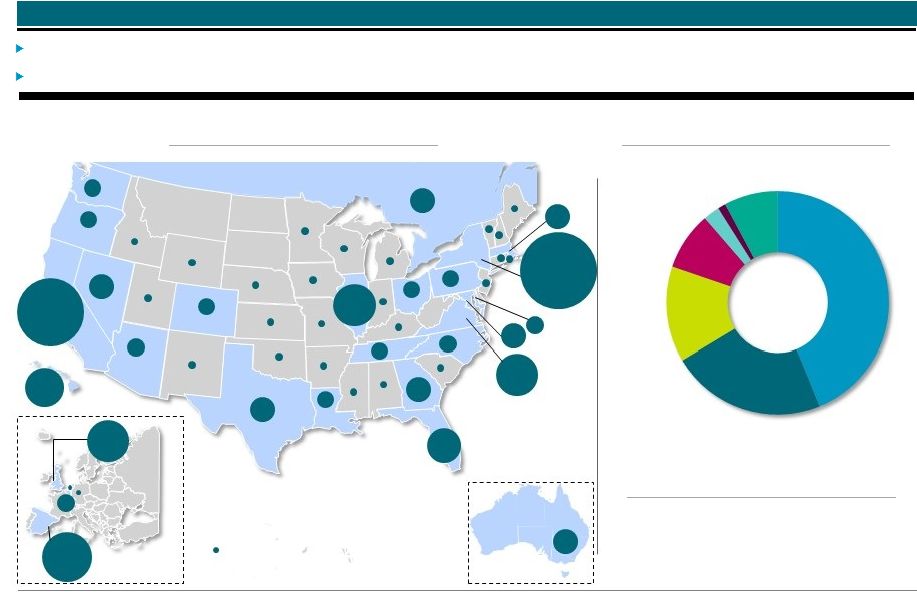 Blackstone Mortgage Trust 5 44% 23% 14% 8% 2% 1% 8% Condo Spanish Assets Retail Portfolio Composition $13.8 billion portfolio (a) (113 assets) secured by institutional quality real estate, with 54% in gateway markets High quality 100% performing portfolio with low weighted average LTV (a)(b) of 62% Office Hotel Other Multi Major Market Focus (a) Collateral Diversification (a) (a) Includes $467 million of Non-Consolidated Senior Interests and investment exposure to the $1.0 billion 2018 Single Asset
Securitization through a $99 million subordinate risk retention interest (b) Reflects weighted average LTV as of the date investments were originated or acquired by BXMT
Weighted
Average
LTV
(a)(b)
62%
$13.8B
portfolio
AU 2% 1% BE ES 8% AZ CO 1% 1% DC 2% LA 1% NC 1% OH 1% 1% OR PA 1% TN 1% 1% WA GA 2% NV 2% TX 2% 2% CAN FL 4% HI 5% IL 6% U.K. 6% VA 6% CA 15% MD 1% MA 2% NY 25% States that comprise less than 1% of total portfolio |
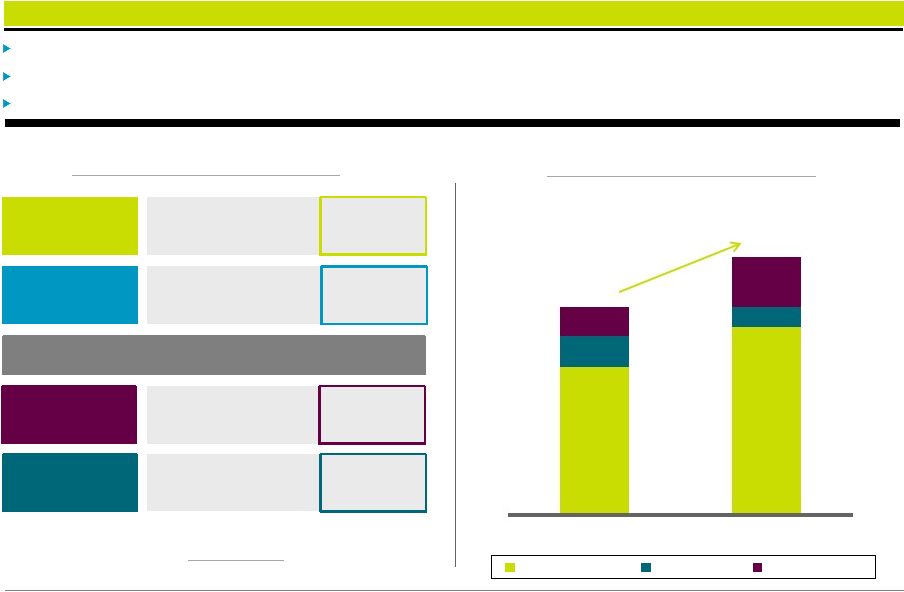 Blackstone Mortgage Trust 6 Capitalization Increased credit capacity by $2.2 billion YTD and expanded multi-currency funding capabilities Total asset-level financing capacity of $13.5 billion was 72% utilized at quarter-end $270 million of equity raised at 1.21x P/B resulting in $0.38 per share of book value accretion Credit Capacity Growth (a) Includes $1.3 billion of consolidated securitized debt obligation as well as $0.9 billion of securitized debt held by third-parties in
the $1.0 billion 2018 Single Asset Securitization, which is not
consolidated on BXMT’s balance sheet. Refer to our consolidated financial
statements for further discussion of the subordinated risk retention interest related to the 2018 Single Asset Securitization. (b) Includes $81 million of loan participations sold and $467 million of Non-Consolidated Senior Interests, which result from non-recourse sales of senior loan interests in loans BXMT originates. BXMT’s net investments in these loans are reflected in the form of mezzanine or other subordinate loans on BXMT’s balance
sheet. (c)
Represents (i) total outstanding secured debt agreements and convertible notes,
less cash, to (ii) total equity Credit
Facilities
11 Credit Providers
Corporate
Debt
Convertible Notes and
Secured Facility
Corporate Obligations
Senior Loan
Interests
(b)
$6.9
$0.8
$0.5
$7.7
Securitized
Debt
(a)
$2.2
CLO and Single Asset
Securitizations
2.3x
Debt-to-Equity Ratio
(c)
Senior Syndications
Financing
(Outstanding Balance)
+19%
$13.5 $11.3 ($ in billions) Credit Facilities Syndications Securitizations $8.6 $1.4 $1.3 YE 2017 $10.4 $0.9 $2.2 3Q'18 |
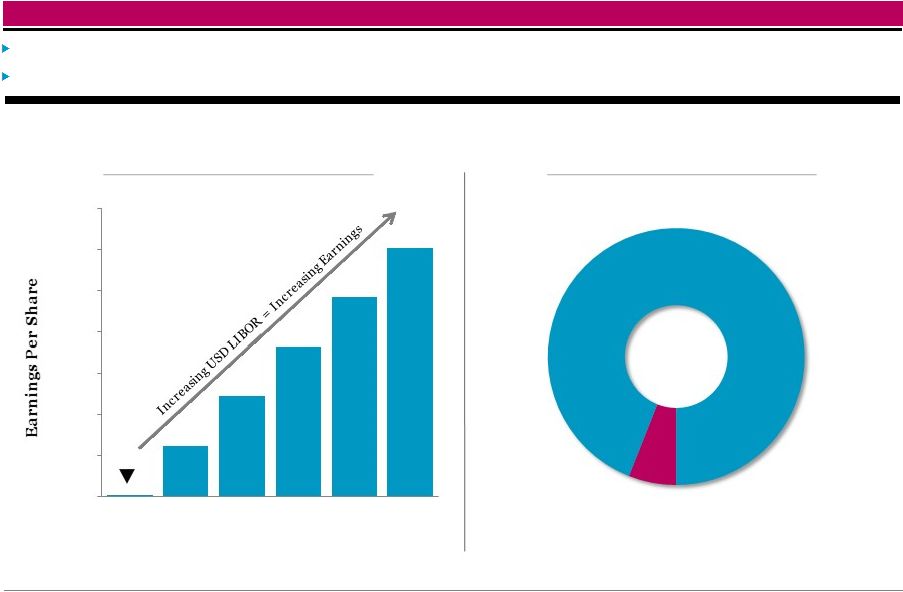 Blackstone Mortgage Trust 7 $0.00 $0.10 $0.20 $0.30 $0.40 $0.50 $0.60 $0.70 2.26% 2.76% 3.26% 3.76% 4.26% 4.76% 5% 95% Interest Rates 95% of the portfolio (a) is floating rate A 1.0% increase in USD LIBOR would increase earnings per share by $0.24 per annum (a) (a) Includes $467 million of Non-Consolidated Senior Interests and investment exposure to the $1.0 billion 2018 Single Asset
Securitization through a $99 million subordinate risk retention interest (b) Changes in interest rates and credit spreads may affect our net interest income from loans and other investments. Reflects impact on net
income, net of incentive fees. See Appendix for important
disclosures. Earnings
Sensitivity
to
USD
LIBOR
(b)
(Annual Dollars of Earnings per Share)
USD LIBOR
Portfolio
Fixed
vs.
Floating
(a) (% of Total Portfolio Exposure) Floating Fixed |
 Appendix |
 Blackstone Mortgage Trust 9 GAAP Net Income Adjustments Core Earnings Interest Income 203.1 $ $— 203.1
$
Interest Expense
(98.0)
0.6
(97.4)
Management and
Incentive Fees
(18.4)
—
(18.4)
General and Administrative
Expenses
(1.7)
—
(1.7)
Non-Cash
Compensation
(6.7)
6.7
—
Realized Foreign Currency
Gain, net
(a)
—
1.9
1.9
Net Income Attributable to
Non-controlling Interests
(0.1)
—
(0.1)
Total
78.2
$
9.2
$
87.4
$
($0.2)
$1.2
$2.3
2016
2017
2018 YTD
Appendix – Third Quarter 2018 Operating Results & Net Funding $2.3 billion YTD 2018 Net Fundings Net Funding (b) ($ in billions) Operating Results ($ in millions) (a) Primarily represents the forward points earned on our foreign currency forward contracts, which reflect the interest rate differentials
between the applicable base rate for our foreign currency
investments and USD LIBOR. These forward contracts effectively convert the rate exposure to USD LIBOR, resulting in additional interest income earned in U.S. dollar terms. These amounts are not included in GAAP net income, but rather as a component of Other Comprehensive Income in our consolidated financial
statements. (b)
Excludes the impact of changes in foreign currency rates and related hedges for
non-USD investments $0.75
Core Earnings per Share
$0.67
Net Income per Share
Fundings
Repayments
$466 million
3Q’18 Net Fundings |
 Blackstone Mortgage Trust 10 (a) Date loan was originated or acquired by BXMT, and the LTV as of such date
(b) In certain instances, loans are financed through the non-recourse sale of a senior loan interest that is not included in the
consolidated financial statements. As of September 30, 2018, three
loans in the portfolio have been financed with an aggregate $467 million of Non-Consolidated Senior Interests, which are included in the table above. (c) Portfolio excludes our $99 million subordinate risk retention interest in the $1.0 billion 2018 Single Asset Securitization
(d) Maximum maturity assumes all extension options are exercised; however, floating rate loans generally may be repaid prior to their final
maturity without penalty (e)
Consists of both floating and fixed rates. Coupon and all-in yield assume
applicable floating benchmark rates for weighted-average calculation. Portfolio Details ($ in millions) Origination Total Principal Net Book Maximum Property Loan Per Origination Loan Type Date (a) Loan (b)(c) Balance (b)(c) Value Maturity (d) Location Type SQFT / Unit / Key LTV (a) Loan 1 Senior loan 3/22/2018 $ 1,160 $ 1,160 $ 1,153 L + 3.15 % L + 3.40 % 3/15/23 Diversified - Spain Spanish Assets n/a 71 % Loan 2 Senior loan 5/11/2017 753 679 675 L + 3.40 % L + 3.60 % 6/10/2023 Northern Virginia Office $332 / sqft 62 % Loan 3 Senior loan (b) 8/6/2015 481 481 88 4.48 % 5.82 % 10/29/2022 Diversified - EUR Other n/a 71 % Loan 4 Senior loan 5/1/2015 355 340 339 L + 2.85 % L + 3.02 % 5/1/2023 New York Office $431 / sqft 68 % Loan 5 Senior loan 2/13/2018 330 312 312 L + 3.42 % L + 3.54 % 3/9/2023 New York Multi $756,199 / unit 62 % Loan 6 Senior loan 1/7/2015 315 309 309 L + 3.50 % L + 3.71 % 1/9/2021 New York Office $264 / sqft 53 % Loan 7 Senior loan 3/31/2017 339 267 264 L + 3.50 % L + 3.88 % 8/9/2023 Maui Hotel $351,479 / key 61 % Loan 8 Senior loan 8/3/2016 276 229 228 L + 4.66 % L + 5.25 % 8/9/2021 New York Office $314 / sqft 57 % Loan 9 Senior loan 12/22/2017 225 225 223 L + 2.80 % L + 3.16 % 1/9/2023 Chicago Multi $326,087 / unit 65 % Loan 10 Senior loan 5/9/2018 219 219 217 L + 3.00 % L + 3.24 % 5/9/2023 New York Industrial $62 / sqft 70 % Loan 11 Senior loan 6/23/2015 221 214 214 L + 3.65 % L + 3.78 % 5/8/2022 Washington DC Office $239 / sqft 72 % Loan 12 Senior loan 6/4/2015 208 208 210 L + 4.19 % L + 4.14 % 5/21/2021 Diversified - CAN Hotel $43,920 / key 54 % Loan 13 Senior loan 4/15/2016 225 200 198 L + 3.25 % L + 3.84 % 4/9/2023 New York Office $186 / sqft 40 % Loan 14 Senior loan 2/25/2014 195 195 195 L + 4.01 % L + 4.46 % 3/9/2021 Diversified - US Hotel $102,470 / key 55 % Loan 15 Senior loan 6/4/2018 190 190 188 L + 3.50 % L + 3.86 % 6/9/2024 New York Hotel $313,015 / key 52 % Loans 16 - 112 Senior loans Various 10,352 7,499 7,365 5.87 % (e) 6.22 % (e) Various Various Various Various 63 % Total/Wtd. avg. $ 15,844 $ 12,727 $ 12,177 5.52 % 5.89 % 3.8 yrs 63 % Cash All-in Coupon Yield |
 Blackstone Mortgage Trust 11 September 30, 2018 December 31, 2017 Assets Cash and cash equivalents 86,987 $
69,654
$
Restricted
cash —
32,864 Loans receivable, net
12,176,516 10,056,732 Other assets
155,972 99,575
Total assets 12,419,475 $
10,258,825 $
Liabilities and equity
Secured debt agreements, net
6,841,759 $
5,273,855 $
Loan participations sold, net
81,044 80,415
Securitized debt obligations, net
1,284,362 1,282,412 Convertible notes, net
780,951 563,911
Other
liabilities 123,366
140,826 Total liabilities
9,111,482 7,341,419 Commitments and contingencies
— —
Equity Class A common stock, $0.01 par value 1,197 1,079
Additional paid-in capital 3,898,841 3,506,861 Accumulated other comprehensive loss
(32,849) (29,706)
Accumulated deficit
(566,417) (567,168)
Total Blackstone
Mortgage Trust, Inc. stockholders' equity 3,300,772
2,911,066
Non-controlling
interests 7,221
6,340 Total equity
3,307,993 2,917,406 Total liabilities and equity
12,419,475 $
10,258,825 $
Consolidated Balance Sheets
($ in thousands, except per share data) |
 Blackstone Mortgage Trust 12 Consolidated Statements of Operations ($ in thousands, except per share data) Three Months Ended September 30, Nine Months Ended September 30, 2018 2017 2018 2017 Income from loans and other investments Interest and related income 203,107 $ 146,446 $ 550,011 $ 391,787 $ Less: Interest and related expenses 97,955 67,891 255,677 168,917 Income from loans and other investments, net 105,152 78,555 294,334 222,870 Other expenses Management and incentive fees 18,368 13,243 56,248 40,557 General and administrative expenses 8,443 7,419 25,897 22,219 Total other expenses 26,811 20,662 82,145 62,776 Income before income taxes 78,341 57,893 212,189 160,094 Income tax provision 48 83 272 265 Net income 78,293 $
57,810 $
211,917 $ 159,829 $ Net income attributable to non-controlling interests (128) (88) (481) (88) Net income attributable to Blackstone Mortgage Trust, Inc. 78,165 $
57,722 $
211,436 $ 159,741 $ Per share information (basic and diluted) Weighted-average shares of common stock outstanding 116,203,140 95,013,087 111,251,864 95,004,188 Net income per share of common stock 0.67 $
0.61 $
1.90 $
1.68 $
|
 Blackstone Mortgage Trust 13 Per Share Calculations (a) Represents net income attributable to Blackstone Mortgage Trust, Inc. (b) Historically, we have deferred in Core Earnings the accretion of purchase discount attributable to a certain pool of GE portfolio
investments acquired in May 2015, until repayment in full of the
remaining investments in the pool was substantially assured. During the three months ended June 30, 2018, it was determined that repayment of the remaining loans in the deferral pool was substantially assured. As such, the $8.7 million of deferred purchase discount, which has been previously recognized in GAAP net
income, was realized in Core Earnings during the three months
ended June 30, 2018. (c)
Primarily represents the forward points earned on our foreign currency forward
contracts, which reflect the interest rate differentials between the applicable base rate for our foreign currency investments and USD LIBOR. These forward contracts effectively convert the rate exposure to USD LIBOR, resulting in additional
interest income earned in U.S. dollar terms. These amounts are not
included in GAAP net income, but rather as a component of Other Comprehensive Income in our consolidated financial statements. Core Earnings Reconciliation Book Value per Share Earnings per Share (Amounts in thousands, except per share data) Three Months Ended September 30, 2018 June 30, 2018 Net income (a) 78,165 $
72,312 $
GE purchase discount accretion adjustment
(b) — 8,723 Non-cash compensation expense 6,734 6,778 Realized foreign currency gain, net (c) 1,930 1,998 Other items 590 565 Core Earnings 87,419 $
90,376 $
Weighted-average shares outstanding, basic and
diluted 116,203
109,069 Core Earnings per share, basic and diluted 0.75 $
0.83
$
Three Months Ended September 30, 2018 June 30, 2018 Stockholders’ equity 3,300,772 $
3,023,480 $
Shares Class A common stock 119,669 111,442 Deferred stock units 221 213 Total outstanding 119,890 111,655 Book value per share 27.53 $
27.08
$
Three Months Ended
September 30, 2018
June 30, 2018 Net income (a) 78,165 $
72,312 $
Weighted-average shares outstanding, basic and
diluted 116,203
109,069 Earnings per share, basic and diluted 0.67 $
0.66
$
|
 Blackstone Mortgage Trust 14 Reconciliation of Net Income to Core Earnings (a) Represents net income attributable to Blackstone Mortgage Trust, Inc. (b) Historically, we have deferred in Core Earnings the accretion of purchase discount attributable to a certain pool of GE portfolio
investments acquired in May 2015, until repayment in full of the
remaining investments in the pool was substantially assured. During the three months ended June 30, 2018, it was determined that repayment of the remaining loans in the deferral pool was substantially assured. As such, the $8.7 million of deferred purchase discount, which has been previously recognized in GAAP net
income, was realized in Core Earnings during the three months
ended June 30, 2018. (c)
Primarily represents the forward points earned on our foreign currency forward contracts, which reflect the interest rate differentials between the applicable base rate for our foreign currency investments and USD LIBOR. These forward contracts effectively convert the rate exposure to USD LIBOR, resulting in additional
interest income earned in U.S. dollar terms. These amounts are not
included in GAAP net income, but rather as a component of Other Comprehensive Income in our consolidated financial statements. (Amounts in thousands, except per share data) TTM Ended Sept 30, 2018 Sept 30, 2018 June 30, 2018 Mar 31, 2018 Dec 31, 2017 Net income (a) 269,326 $ 78,165 $ 72,312 $ 60,958 $ 57,891 $ GE purchase discount accretion adjustment (b) 8,223 — 8,723 (17) (483) Non-cash compensation expense
26,709 6,734 6,778 6,976 6,221 Realized foreign currency gain, net
(c) 5,137 1,930 1,998 854 355 Other items 2,208 590 565 534 519 Core Earnings
311,603 $ 87,419 $ 90,376 $ 69,305 $ 64,503 $ Weighted-average shares outstanding, basic and diluted 108,116 116,203 109,069 108,398 98,811 Net income per share, basic and diluted 2.49 $
0.67 $
0.66 $
0.56 $
0.59 $
Core Earnings per share, basic and diluted
2.88 $
0.75 $
0.83 $
0.64 $
0.65 $
Three Months Ended |
 Blackstone Mortgage Trust 15 Definitions Core Earnings: Blackstone Mortgage Trust, Inc. (“BXMT”) discloses Core Earnings in this presentation. Core Earnings is a financial measure that is calculated and presented on the basis of methodologies other than in accordance with generally accepted accounting principles in the United States of America (“GAAP”). Core Earnings is an adjusted measure that helps BXMT evaluate its performance excluding the effects of certain transactions and GAAP adjustments that it believes are not necessarily indicative of its current loan origination portfolio and operations. Although according to its management agreement BXMT calculates the incentive and base management fees due to its Manager using Core Earnings before incentive fees expense, BXMT reports Core Earnings after incentive fees expense, as BXMT believes this is a more meaningful presentation of the economic performance of its class A common stock. Core Earnings is defined as GAAP net income (loss), including realized gains and losses not otherwise included in GAAP net income (loss), and excluding (i) net income (loss) attributable to the CT Legacy Portfolio, (ii) non-cash equity compensation expense, (iii) depreciation and amortization, (iv) unrealized gains (losses), and (v) certain non-cash items. Core Earnings may also be adjusted from time to time to exclude one-time events pursuant to changes in GAAP and certain other non-cash charges as determined by BXMT’s manager, subject to approval by a majority of its independent directors. Core Earnings does not represent net income or cash generated from operating activities and should not be considered as an alternative to GAAP net income, or an indication of BXMT’s GAAP cash flows from operations, a measure of BXMT’s liquidity, or an indication of funds available for its cash needs. In addition, BXMT’s methodology for calculating Core Earnings may differ from the methodologies employed by other companies to calculate the same or similar supplemental performance measures, and accordingly, its reported Core Earnings may not be comparable to the Core Earnings reported by other companies. Non-Consolidated Senior Interests: Senior interests in loans originated and syndicated to third parties. These non-recourse loan participations, which are excluded from the GAAP balance sheet, constitute additional financing capacity and are included in discussions of the loan portfolio. Earnings Sensitivity to LIBOR: Reflects the impact on net income, net of incentive fees, assuming no changes in credit spreads, portfolio composition, or asset performance. Assumes no change in general and administrative expenses, management fees, or other non-interest expenses relative to those incurred for the quarter ended September 30, 2018. |
 Blackstone Mortgage Trust 16 Forward-Looking Statements This presentation may contain forward-looking statements within the meaning of Section 27A of the Securities Act of 1933, as amended, and Section 21E of the Securities Exchange Act of 1934, as amended, which reflect BXMT’s current views with respect to, among other things, its operations and financial performance. You can identify these forward-looking statements by the use of words such as “outlook,” “indicator,” “believes,” “expects,” “potential,” “continues,” “may,” “will,” “should,” “seeks,” “predicts,” “intends,” “plans,” “estimates,” “anticipates” or the negative version of these words or other comparable words. Such forward- looking statements are subject to various risks and uncertainties. Accordingly, there are or will be important factors that could cause actual outcomes or results to differ materially from those indicated in these statements. BXMT believes these factors include but are not limited to those described under the section entitled “Risk Factors” in its Annual Report on Form 10-K for the fiscal year ended December 31, 2017, as such factors may be updated from time to time in its periodic filings with the Securities and Exchange Commission (“SEC”) which are accessible on the SEC’s website at www.sec.gov. These factors should not be construed as exhaustive and should be read in conjunction with the other cautionary statements that are included in this presentation and in the filings. BXMT assumes no obligation to update or supplement forward-looking statements that become untrue because of subsequent events or circumstances. |