Attached files
| file | filename |
|---|---|
| 8-K - 8-K - Fuse Medical, Inc. | d599187d8k.htm |
| EX-99.2 - EX-99.2 - Fuse Medical, Inc. | d599187dex992.htm |
| EX-2.1 - EX-2.1 - Fuse Medical, Inc. | d599187dex21.htm |
Exhibit 99.1
FAIRNESS OPINION
RELATED TO THE ACQUISITION OF
PALM SPRINGS PARTNERS, LLC D/B/A MAXIM SURGICAL
BY FUSE MEDICAL, INC.
JULY 25, 2018
Prepared for:
Board of Directors
Fuse Medical, Inc.

July 25, 2018
Board of Directors
Fuse Medical, Inc.
1565 North Central Expressway
Suite 220
Richardson, TX 75080
Dear Members of the Board:
ValueScope, Inc. has been engaged to advise Fuse Medical, Inc. (“Fuse”) and its Board of Directors as to the fairness of the consideration to be paid by Fuse for the purchase of all of the stock of Palm Springs Partners, LLC d/b/a Maxim Surgical (“Maxim”) as outlined in the Securities Purchase Agreement (the “Purchase Agreement” of the “SPA”) dated July 27, 2018 (the “Closing Date”).
Based on a review of the Purchase Agreement, it is our understanding that the total possible consideration for the transaction is equal to the Closing Consideration of $3,400,000 plus or minus the net of the closing working capital and $100,000. The total consideration is to be paid in shares of Fuse common stock with a price equal to the 30-day VWAP as of three days prior to closing.
Our opinion is based on a review of publicly available business and financial information relating to Fuse. We have also reviewed internal financial and operating information related to Maxim. This opinion is based on financial analyses prepared in accordance with generally accepted valuation standards. These procedures included substantive valuation tests that we considered necessary and appropriate under the circumstances.
We are not acting as the financial advisor to Maxim or to Fuse or its shareholders in connection with this acquisition. It is understood that this letter is for the use of the Board of Directors and shareholders of Fuse and may be quoted, referred to, in whole or in part, in Fuse’s proxy statement. We understand that this letter may be filed with the Securities and Exchange Commission (SEC) by Fuse as part of Fuse’s Information Statement. This letter is not to be used with any other document in connection with the proposed merger, without the express written consent of ValueScope, Inc.
| VALUESCOPE | Page 1 |
Our analyses included, but were not necessarily limited to, the following procedures:
| • | A review of the Securities Purchase Agreement dated July 27, 2018 to purchase 100% of the outstanding equity of Palm Springs Partners, LLC d/b/a Maxim Surgical by Fuse Medical, Inc. |
| • | A review of Fuse’s publicly available financial statements for the fiscal years ended December 31, 2016 through December 31, 2017 and the trailing twelve-month period ended March 31, 2018. |
| • | A review of projected income statements for Maxim for the period 2018 through 2022 provided by management (the “Management”). |
| • | A review of information relating to Maxim’s industry and similar companies. |
| • | Discussions with Management regarding the historical and projected operating performance of Maxim. |
| • | Discussions with Management regarding Maxim’s industry with respect to guideline companies and transactions. |
| • | A review of publicly available historical and financial information related to Fuse. |
| • | A review of Fuse’s recent trading activity on the Over-the-Counter Bulletin Board quotation service. |
| • | A review of pricing data of comparable guideline companies and industry transactions existing as of the closest available date prior to the Closing Date. |
| • | A review of the Fuse’s capital table. |
We have not independently verified any of the foregoing information and have relied upon its completeness and accuracy in all material aspects. With respect to the financial forecasts, we have assumed that they have been reasonably prepared on a basis reflecting the best currently available estimates of Management as to the expected financial performance of Maxim.
Based upon and subject to the foregoing, including the various assumptions and limitations as set forth herein, it is our opinion that the consideration to be paid by Fuse for the outstanding stock of Maxim as outlined in the Purchase Agreement is FAIR to the shareholders of Fuse from a financial point of view.
| VALUESCOPE | Page 2 |
Our value calculations are presented in the Summary Schedule and in the tables below.
| Summary |
||||||||
| Fair Value (FV) of Fuse Equity |
$ | 36,400,000 | Schedule E | |||||
| Fuse Outstanding Shares (Pre-Transaction) |
65,890,808 | |||||||
|
|
|
|||||||
| FV of Fuse Equity Per Share (Pre-Transaction) |
$ | 0.5524 | per share | |||||
| Closing Consideration/Maxim Equity Value |
$ | 3,400,000 | Schedule J | |||||
| Plus: Closing Net Working Capital |
521,139 | |||||||
| Less: Target Net Working Capital |
(100,000 | ) | ||||||
|
|
|
|||||||
| Total Maxim Purchase Price |
$ | 3,821,139 | ||||||
| Securities Purchase Agreement Fuse Share Price |
$ | 0.7500 | Schedule K.1 | |||||
|
|
|
|||||||
| Shares Provided as Equity Payment |
5,094,852 | |||||||
| Maxim Equity Value |
$ | 3,821,139 | ||||||
| Fuse Equity Value |
$ | 36,400,000 | ||||||
|
|
|
|||||||
| Post-Transaction Equity Value |
$ | 40,221,139 | ||||||
| Fuse Outstanding Shares (Post-Transaction) |
70,985,660 | |||||||
|
|
|
|||||||
| Fully Diluted Fuse Equity Value Per Share (Post-Transaction) |
$ | 0.5666 | per share | |||||
|
|
|
|||||||
Conclusion—Deal is FAIR to Fuse Medical, Inc. Shareholders
We are independent of Fuse and Maxim and have no current or prospective economic interest in Fuse’s shares that are the subject of this opinion. Our fee for this opinion was in no way influenced by our conclusion.
| Respectfully submitted, |

|
| ValueScope, Inc. |
| /s/ Steven C. Hastings |
| Steven C. Hastings, CPA/ABV/CFF, CGMA, ASA, CVA |
| Principal |
| VALUESCOPE | Page 3 |
APPENDIX A—FUSE OFFER
Purchase Price
Fuse Medical, Inc. (the “Buyer”) will purchase one hundred percent (100%) of the outstanding equity securities (the “Securities”) of Palm Springs Partners, LLC d/b/a Maxim Surgical from Mr. Amir David Tahernia and Reed Medical Industries, Inc. (the “Sellers”) in the amount of $3,400,000 plus the excess working capital above $100,000 to be paid in membership interests (“Membership Interests”) following the closing of the transaction (the “Transaction”).
Equity Component
The purchase price for the Securities of CPM (the “Purchase Price”) would be paid by issuance of Membership Interests valued at the 30-day volume-weighted average price (VWAP) as of the three business days prior to the Closing Date.
The Purchase Price is to be paid as follows:
| i. | Within seven business days of the Closing Date, the Buyer shall issue to each Seller certificates representing each Seller’s pro rata share of the Purchase Price in the form of shares of common stock of Fuse (the “Issued Securities”), at par value $0.01, bearing restrictive legends, with an aggregate value equal to the calculated 30-day VWAP as of three business days prior to the Closing Date. |
| ii. | Each Seller may elect to forgo up to $100,000 of the Purchase Price, in the form of the Issued Securities, and instead receive at the Closing Date the right to receive a one-time cash payment of $100,000, payable within thirty days after the Closing Date by delivering written notice of such election to the Buyer at least three business days prior to the Closing Date. |
Post-Closing Adjustment
The Purchase Price is subject to adjustment following the Closing Date as follows:
| i. | As soon as reasonably practicable, and in any event within sixty days after the Closing Date, Buyer shall deliver to the Sellers’ representative a written calculation of the Closing Net Working Capital, Closing Consideration, and the Purchase Price (the “Closing Date Calculation”), as determined by reference to the relevant provisions of the Purchase Agreement. |
| VALUESCOPE | Appendix A | Page 1 |
| ii. | Following the receipt by the Sellers’ representative of the Closing Date Calculation, Buyer shall permit and cause the Sellers’ representative and its representatives to have reasonable access during normal business hours to the books, records, and other documents pertaining to or used in connection with preparation of the Closing Date Calculation and provide the Sellers’ representative with copies thereof (as reasonably requested by the Sellers’ representative). |
| iii. | If the Sellers’ representative gives a timely Objection Notice as described in Section 1.4(b) of the Purchase Agreement, then Buyer and the Sellers’ representative will negotiate in good faith to resolve their disputes regarding the Closing Date Calculation. If Purchaser and the Sellers’ Representative are unable to resolve all disputes regarding the Closing Date Calculation on or prior to the 30th day after the delivery of the Objection Notice, then Buyer and the Sellers’ representative will retain Whitley Penn (Dallas, Texas, location) (the “Independent Dispute Arbitrator”), and shall instruct the Independent Dispute Arbitrator to resolve the dispute as soon as practicable, and in any event within thirty days, and Buyer and the Sellers’ representative and their respective agents shall cooperate with the Independent Dispute Arbitrator during its engagement. |
| VALUESCOPE | Appendix A | Page 2 |
APPENDIX B—VALUATION ANALYSIS
Description of the Transaction
In the Securities Purchase Agreement (the “Purchase Agreement”) dated July 27, 2018, Fuse Medical, Inc. (“Fuse”) offered to acquire Palm Springs Partners, LLC d/b/a Maxim Surgical (“Maxim”) in exchange for a total consideration equal to $3,400,000 plus the excess working capital above $100,000 to be paid in membership interests (“Membership Interests”) following the closing of the transaction (the “Transaction”).
Maxim Surgical (“Maxim”)1
Maxim Surgical is a Texas limited liability company in Richardson, Texas that was established in 2011. Maxim is a supplier of durable medical equipment and medical supplies. Maxim main product marketed on the company website is the Max Fuse-C, a cervical interbody fusion system. The Max Fuse-C has the following features: large graft space for adequate grafting material; neutral and 6-degree lordotic options; multiple footprint options designed to maximize endplate contact and resist subsidence; superior and inferior tooth pattern to prevent implant migration; tantalum radiographic markers to provide visual assessment of implant placement and post-op examination; and machined in the USA from Solvay Zeniva® PEEK.
Fuse Medical, Inc. (“Fuse”)2
Fuse Medical, Inc., together with its subsidiaries, distributes medical devices in the United States. It offers orthopedic implants, including internal and external fixation products; upper and lower extremity plating and total joint reconstruction implants; soft tissue fixation and augmentation for sports medicine procedures; full spinal implants for trauma, degenerative disc disease, and deformity indications; and osteo-biologics and regenerative tissue which include human allografts, substitute bone materials, tendons, and regenerative tissues and fluids. The company serves hospitals, medical facilities, and sub-distributors. Fuse is based in Richardson, Texas.
| 1 | Maxim business description taken from company website <http://www.maximsurgical.com/> |
| 2 | Fuse business description provided by Capital IQ |
| VALUESCOPE | Appendix B | Page 1 |
Overview of the U.S. Economy
According to the third estimate released by the Bureau of Economic Analysis (BEA), the U.S. economy grew in the first quarter of 2018, with real gross domestic product (GDP) increasing at an annual rate of 2.0%, following a fourth quarter 2017 increase of 2.9%. The increase in real GDP in the first quarter reflected positive contributions from nonresidential fixed investment, PCE, exports, federal government spending, and state and local government spending that were partly offset by a negative contribution from residential fixed investment and private inventory investment.3
Forecasters surveyed by the Federal Reserve Bank of Philadelphia predicted, on average, a 3.0% annual real growth rate for the second and third quarters of 2018. The forecasters predicted, on average, that real GDP will grow 2.8% in 2018, 2.7% in 2019, 1.9% in 2020, and 2.0% in 2021. The forecasts for 2019 and 2021 are higher than previous estimates for the same periods.4
Employment
Nonfarm payroll employment, according to the Bureau of Labor Statistics (BLS), rose by 223,000 in May 2018. The unemployment rate in May 2018 was 3.8%. The BLS reported job gains in retail trade, health care, and construction.5
Forecasters surveyed by the Federal Reserve Bank of Philadelphia predicted, on average, that the unemployment rate will be 3.9% in 2018, 3.7% in 2019, 3.9% in 2020, and 4.0% in 2021.6
Inflation
According to the BLS, inflation, as measured by changes in the Consumer Price Index for All Urban Consumers (CPI-U), increased 0.2% in May 2018 on a seasonally adjusted basis. Over the previous 12 months, the all items index increased 2.8% before seasonal adjustment. The index for all items less food and energy rose 2.2% for the twelve-month period ending May 2018. The energy index rose 11.7% over the last year, while the food index increased 1.2%.7
| 3 | U.S. Department of Commerce, Bureau of Economic Analysis, Gross Domestic Product: First Quarter 2018 (Third Estimate), June 28, 2018 |
| 4 | Federal Reserve Bank of Philadelphia, Second Quarter 2018 Survey of Professional Forecasters, May 11, 2018 |
| 5 | United States Department of Labor, Bureau of Labor Statistics, The Employment Situation: May 2018, June 1, 2018 |
| 6 | Federal Reserve Bank of Philadelphia, Second Quarter 2018 Survey of Professional Forecasters, May 11, 2018 |
| 7 | United States Department of Labor, Bureau of Labor Statistics, Consumer Price Index: May 2018, June 12, 2018 |
| VALUESCOPE | Appendix B | Page 2 |
Forecasters surveyed by the Federal Reserve Bank of Philadelphia predicted, on average, inflation is expected to be 2.5% in 2018, 2.2% in 2019, and 2.3% in 2020. Over the next ten years, forecasters expect CPI inflation to average 2.25% annually.8
Interest Rates
The interest rate on the three-month Treasury bill increased from 1.01% as of June 30, 2017 to 1.89% as of June 30, 2018.9 The interest rate on the ten-year Treasury note increased from 2.31% as of June 30, 2017 to 2.85% as of June 30, 2018.10
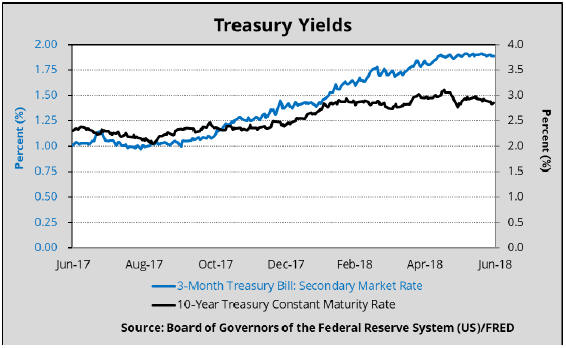
As of June 30, 2018, the yields on Moody’s Aaa-rated corporate bonds and Baa-rated corporate bonds were 3.93% and 4.84%, respectively.11
| 8 | Federal Reserve Bank of Philadelphia, Second Quarter 2018 Survey of Professional Forecasters, May 11, 2018 |
| 9 | Federal Reserve Bank of St. Louis, Federal Reserve Economic Data, Series: DTB3MS, 3-Month Treasury Bill: Secondary Market Rate, last accessed July 3, 2018 |
| 10 | Federal Reserve Bank of St. Louis, Federal Reserve Economic Data, Series: DGS10, 10-Year Treasury Constant Maturity Rate, last accessed July 3, 2018 |
| 11 | Federal Reserve Bank of St. Louis, Federal Reserve Economic Data, Series: DAAA, Moody’s Seasoned Aaa Corporate Bond Yield©, Series: DBAA, Moody’s Seasoned Baa Corporate Bond Yield©, last accessed July 3, 2018 |
| VALUESCOPE | Appendix B | Page 3 |
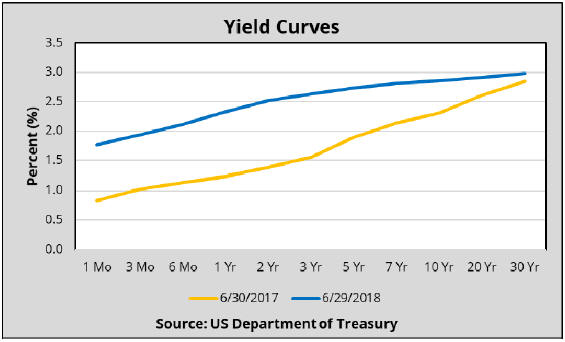
Yield Curve
The spread between the thirty-year and the one-year treasury bills declined from 1.60% as of June 30, 2017 to 0.65% as of June 30, 2018.12
| 12 | U.S. Department of the Treasury, Daily Treasury Yield Curve Rates, last accessed July 3, 2018 |
| VALUESCOPE | Appendix B | Page 4 |
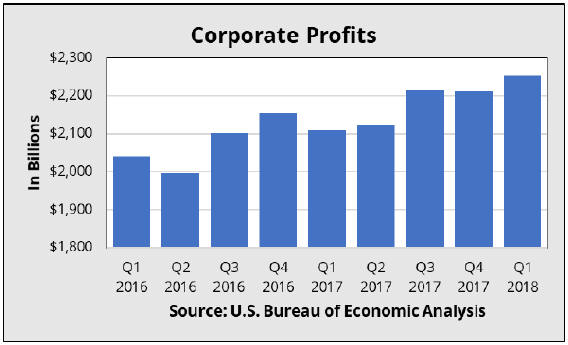
Corporate Profits
According to the BEA, profits from current production (corporate profits with inventory valuation and capital consumption adjustments) increased $39.5 billion in the first quarter over the fourth of 2017, in contrast to a decrease of $1.1 billion in the fourth quarter of 2017 over the third quarter.13, 14
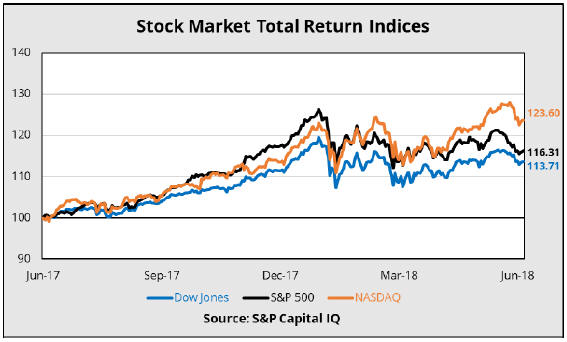
Stock Markets
The S&P 500 Total Return Index opened at 4,206.10 on June 30, 2017 and closed higher at 4,782.71 on June 30, 2018. This corresponds to an annual return of 13.7%. The NASDAQ Composite Total Return Index opened at 7,021.75 on June 30, 2017 and closed higher at 8,678.86 on June 30, 2018.15 This corresponds to an annual return of 23.6%. The Dow Jones Industrial Average Total Return Index opened at 45,510.04 on June 30, 2017 and closed higher at 52,930.99 on June 30, 2018. This corresponds to an annual return of 16.3%.
| 13 | U.S. Department of Commerce, Bureau of Economic Analysis, Corporate Profits: First Quarter 2018, June 28, 2018 |
| 14 | Federal Reserve Bank of St. Louis, Federal Reserve Economic Data, Series: CP, Corporate Profits After Tax (without IVA and CCAdj), last accessed July 3, 2018 |
| 15 | S&P Capital IQ Database, last accessed July 3, 2018 |
| VALUESCOPE | Appendix B | Page 5 |
In the graph below, the June 30, 2017 values were set to 100.
Consumer Confidence
The Conference Board reported that the Consumer Confidence Index decreased in June 2018 to 126.4, down from 128.8 in May 2018.16 The index is based on a survey of consumer perceptions of present economic conditions and expectations of future conditions. The survey is based on a representative sample of 5,000 U.S. households and is considered a leading indicator of future consumer expenditures and economic activity.
The University of Michigan Survey of Consumers reported that the Index of Consumer Sentiment increased in June 2018 to 98.2, up from 98.0 in May 2018 and 95.0 in June 2017.17 The index is based on a survey of consumer perceptions of present economic conditions and expectations of future conditions. The survey is based on a sample of 500 phone interviews consisting of 50 core questions are conducted across the continental U.S. This is considered a leading indicator of future consumer expenditures and economic activity.
| 16 | The Conference Board, Consumer Confidence Index, June 26, 2018 |
| 17 | University of Michigan, Surveys of Consumers, June 2018 |
| VALUESCOPE | Appendix B | Page 6 |
Industry Review18
The medical supplies wholesaling industry (the “Industry”) distributes dental and medical supplies and equipment intended to improve or maintain health. Demand for wholesale activities associated with these products is highly correlated with demand for the products themselves. The median age of the population has risen over the past five years; as a result, the number of age-related nonelective procedures performed in the United States increased as well. Accordingly, the Industry revenue has increased steadily over the five years to 2017.
In particular, demand for medical devices used in elderly care has increased over this period and is expected to continue rising over the next five years. Rising product prices have also supported industry growth. Over the five years to 2017, Industry revenue is expected to increase at an annualized rate of 1.9% to total $193.8 billion, including a 2.3% increase in 2017. Revenue growth began to slow down as the Patient Protection and Affordable Care Act took effect and further regulated the Industry. In addition, as a result of consolidation among medical device manufacturers, wholesalers must take on most increases in input costs, thus limiting their profit margins. However, due to only slight increases in commodity prices, profit margins have grown over the past five years to 6.8% in 2017.
Over the five years to 2022, Industry revenue is projected to grow at an annualized rate of 3.0% to $224.2 billion. Revenue is projected to rise as healthcare providers continue to invest in new equipment to keep up with growing demand for healthcare services. New product development by medical device manufacturers will also contribute to Industry growth by offering new solutions to health issues. Mergers and acquisitions among medical device manufacturers will cause wholesalers to consolidate to maintain negotiating power and meet demands of newly expanded customers. Consolidation will help Industry operators reduce costs, therefore leading to a rise in profit margins.
Products & Markets
Sales of high-priced medical instruments fluctuate substantially from year to year, principally as providers replace aging equipment with newer technologies. However, newly developed high technology electromedical, interventional cardiology and orthopedic products have consistently helped boost growth shipments of wholesale medical devices. These high-technology products have increased as a percentage of total Industry sales due to increased demand by doctors and patients for less-
| 18 | Information for this section taken from IBISWorld Industry Report 42345 – Medical Supplies Wholesaling in the U.S., dated October 2017. |
| VALUESCOPE | Appendix B | Page 7 |
invasive, innovative products that improve the quality of patients’ lives and disease diagnosis and treatment. However, while advanced technology can fluctuate in price, the rest of the Industry is made up of less advanced products. Demand for these types of goods is fairly constant from year to year, because their prices are indirectly determined by patients. Prices for these goods are responsive to patient demographics and major population trends.
Major Markets
The overall healthcare market is characterized by healthcare providers that are consolidating into larger and more sophisticated entities to lower their total costs. Many of these providers have sought to lower total costs by taking advantage of value-added services offered by medical and surgical supply wholesalers. This trend has in turn driven consolidation within the Industry due to the competitive advantages that larger operators experience. Such economies of scale include the ability to serve nationwide customers, negotiate prices, buy inventory in large volumes and develop sophisticated technology platforms.
Competitive Structure Benchmarks
Profit
Operating profit, defined as earnings before interest and taxes, represents 6.8% of revenue for the average Industry wholesaler. Over the five years to 2017, profit has increased as a result of rising product prices and mounting demand. However, the 2.3% medical excise tax has cut into margins somewhat, and volume growth has been slightly offset by the negative impact of commodity price fluctuation on the cost of products sold. Despite this, increased healthcare spending has resulted in increased demand for Industry products.
Purchases
As is the case in most wholesaling industries, purchases account for the largest share of an average company’s revenue. The input costs for a particular company depend on the effect of supplier price changes and the impact of changes in inventory mix, but on average, purchases account for 73.3% of Industry revenue. A company’s ability to sustain gross margins partially depends on favorable terms and incentives from suppliers and suppliers’ continuing use of third-party distributors to sell and deliver their products. As an Industry company refines their supplier relationships, the percentage of revenue dedicated to purchases will decrease slightly. Industry operators can also keep purchasing costs down by entering into agreements with group purchasing organizations that negotiate distribution
| VALUESCOPE | Appendix B | Page 8 |
contracts on behalf of their members. Nonetheless, Industry purchase costs have gone up in recent years, due in part to the Patient Protection and Affordable Care Act’s imposition of an excise tax on some Industry-wholesaled medical devices; some upstream manufacturers have incorporated this new cost into the price of their products, thus increasing purchase costs for Industry wholesalers.
Wages
Labor costs account for an estimated 11.7% of revenue. Over the five years to 2017, wage costs have risen as the Industry has increasingly distributed more high-tech products, which require more advanced storage and transportation solutions. To offer wholesaling solutions that cater to these products, Industry operators have hired more highly paid engineers and other specialists to design storage and transport systems to handle these new products.
Other costs
Most Industry participants incur minimal marketing expenses, relying heavily on existing arrangements with suppliers and customers. However, to win new business and retain current clients, participants perform promotional activities such as distributing reminder gifts, note pads and pens. Additionally, Industry operators are increasingly advertising and selling via the internet, reducing the costs spent on other advertising forms. Depreciation expenses account for 0.8% of revenue. As the Industry continues to improve technologically, wholesale operators will look to implement more advanced machinery and equipment and capital costs will likely increase accordingly. Other Industry costs include insurance, repairs and legal fees.
| VALUESCOPE | Appendix B | Page 9 |
Valuation Methodology
There are three conceptually distinct methodologies that can be applied to determine the fair market value of a business or asset: (a) the income approach, (b) the market approach, and (c) the cost approach. Each of these generally accepted valuation methodologies are considered in the appraisal process and are more or less relevant given the nature of the business and the observable data used to apply the method.
The income and market approaches were utilized to arrive at a conclusion of value for Fuse’s and Maxim’s pre-transaction equity. The income approach directly measures the value of a company by estimating the expected cash flows derived from the business. The market approach provides an indication of value by observing the market value of guideline companies based on various pricing measures or transactions. The cost approach was considered but deemed not necessary because this approach tends to misstate the fundamental economic value of an ongoing business enterprise.
Summary of Supporting Schedules
Historical Financial Review of Fuse
The historical financial information for Fuse for the fiscal years ended December 31, 2016 and December 31, 2017 and the trailing twelve-month period (TTM) ended March 31, 2018 (the “Review Period”) is presented in Schedules A.1 through A.3. Schedule A.1 presents Fuse’s income statements, as issued in public filings with the Securities and Exchange Commission (SEC).
Fuse’s total revenue increased from $25.667 million at the end of fiscal year 2016 to $26.821 million reported by TTM 2018. Fuse’s SEC filings reported cost of sales of $11.257 million in 2016 and $14.645 million in TTM 2018. Cost of sales as a percentage of revenue as presented in the SEC filings ranged from 43.9% to 55.2%. Selling, general and administrative expenses (SG&A) fluctuated during the Review Period, ranging between $10.798 million and $11.523 million. SG&A expense as a percentage of revenue fluctuated between 40.9% and 43.7% of revenue during the Review Period.
Fuse reported earnings before interest, taxes, depreciation and amortization (EBITDA) of $3.182 million in 2016, $1.027 million in 2017, and $0.641 million in TTM 2018. Fuse’s historical income statements are presented in Schedule A.1
| VALUESCOPE | Appendix B | Page 10 |
Fuse’s total assets decreased from $19.576 million as of December 31, 2016 to $17.210 million as of March 31, 2018. Current assets decreased along with total assets from $18.737 million as of December 31, 2016 to $15.791 million as of March 31, 2018. Fuse’s total liabilities were $8.976 million as of December 31, 2016, $27.229 million as of December 31, 2017, and $25.788 million as of March 31, 2018. Fuse’s historical balance sheets are presented in Schedule A.2. Select financial and operating ratios are presented in Schedule A.3.
Fuse Income Approach – Discounted Cash Flow Model
The projected revenue and expenses in the discounted cash flow (DCF) model were based on a review of previous projected income statements provided by Management for the fiscal years ending December 31, 2018 through December 31, 2021 and discussions with Management regarding long-term growth. The nominal growth rate consists of a long-term inflation estimate of 2.25% and a real revenue growth rate. Management’s projected income statement implies nominal revenue growth of 6.0% year-over-year from 2018 to 2021.
The projected cost of sales as a percentage of revenue is based on Management projections and decreases from 55.6% of revenue in 2018 to 51.0% of revenue in 2021. Projected cost of sales is then estimated to equal 50.0% of revenue through the rest of the projection period. Projected SG&A expenses are based on Management projections and are expected to decrease from 36.3% of revenue in 2018 to 34.0% of revenue in 2021. Operating efficiencies and economies of scale are expected to drop SG&A to 33.0% of revenue by the residual period. The projected revenue and expenses are presented in Schedule B.1 and the projected income statements are presented in Schedule B.2.
The projected balance sheets (Schedule B.3) and capital expenditures (Schedule B.4) were determined based on historical financial information and ratios with input from Management.
In determining the valuation of Fuse’s pre-transaction equity utilizing the DCF model, we derived a weighted average cost of capital (WACC) for Fuse. The two components of the WACC calculation are the firm’s cost of equity capital and the firm’s cost of debt. We estimated Fuse’s cost of equity capital to be 13.2% and its cost of debt to be 3.7% after-tax. Applying a market debt/capital ratio of 4.1%, Fuse’s WACC was estimated to be 12.8%. The calculation of the WACC is presented in greater detail in Schedule B.6.
| VALUESCOPE | Appendix B | Page 11 |
Based upon the forecasts and methodologies of the DCF method, it is our opinion that Fuse’s pre-transaction equity value, as of July 19, 2018, can be reasonably stated as $34.910 million. These calculations are presented in Schedule B.7.
Fuse Market Approach—Guideline Public Company Method
The market approach analysis included an examination of guideline companies and pricing measures and industry transactions observable in the public and private markets.
We determined a conclusion of value based on a review of the pricing multiples of guideline companies. Based on discussions with Management and our own due diligence, we identified eight publicly traded guideline companies. We calculated and reviewed pricing multiples for each comparable company and as a group. Based on our analysis, we reviewed the mean, median, and 25th percentile of the enterprise value (EV) to sales multiples, the enterprise value (EV) to EBITDA multiples, and the enterprise value (EV) to EBIT multiples to derive a range of value.
The median of the observed EV/EBITDA multiples of 14.4x was applied to Fuse’s 2019 projected EBITDA value. The 2019 projected EBITDA value was selected as it allows for the completion of transactions and gives Management the opportunity to begin executing their plan. The unadjusted enterprise value (a future value) is then discounted using the WACC to arrive at the adjusted enterprise value (a present value). We then added cash and subtracted debt to arrive at the implied equity value on a minority, marketable basis. A control premium of 28.1%19 was then applied to determine the total equity value, on a controlling basis, of $39.199 million. The guideline public company analysis is presented in Schedules C.1 through C.2.
Fuse Market Approach – Merger & Acquisition Method
Our transaction search was based upon proprietary research of target companies within the industry and discussions with Management. After a review of numerous transactions, we identified 13 transactions that we believe are relevant to Fuse and the potential acquisition.
We reviewed EV/Sales and EV/EBITDA multiples. We selected the 75th% EV/EBITDA multiple to apply to Fuse’s 2019 EBITDA. The unadjusted enterprise value (a future value) is then discounted using the WACC to arrive at the adjusted enterprise value
| 19 | A 28.1% control premium is based median control premium from the M&A transactions presented in Schedule D. Schedule K.2 provides a breakdown of the Mergerstat data and the control premiums for the identified M&A transactions. |
| VALUESCOPE | Appendix B | Page 12 |
(a present value). After applying the discount factor, the adjusted enterprise value is $38.529 million. We then added cash and subtracted debt to determine a concluded equity value of $36.503 million. The merger and acquisition analysis is presented in Schedule D.
Fuse Pre-Transaction Equity Value
We utilized the income approach and the market approach to derive conclusions of value for Fuse’s pre-transaction equity on a controlling-interest basis. The conclusion of value from the DCF model was the lowest calculated value in our analysis and equals $34.910 million. The two market approaches indicate a value between $36.503 million and $39.199 million. The income and market approaches were weighted equally and resulted in a concluded equity of $36.4 million, as presented in Schedule E.
Historical Financial Review of Maxim
The historical financial information for Maxim for the fiscal years ended December 31, 2014 through December 31, 2017 and the trailing twelve-month period (TTM) ended May 31, 2018 (the “Review Period”) is presented in Schedules F.1 through F.3.
Maxim’s total revenue decreased from $1.331 million 2014 to $1.034 million in 2015 then increased each year to $1.229 million by TTM 2018. Maxim’s cost of sales moved with revenue fluctuating between $0.526 million and $0.733 million. Cost of sales as a percentage of revenue ranged from 47.2% to 59.7%. Selling, general and administrative expenses (SG&A) fluctuated during the Review Period, ranging between $0.182 million and $0.305 million. SG&A expense as a percentage of revenue fluctuated between 15.2% and 23.3% of revenue during the Review Period.
Maxim reported earnings before interest, taxes, depreciation, and amortization (EBITDA) of $0.398 million in 2014, $0.267 million in 2015, $0.256 million in 2016, $0.341 million in 2017, and $0.224 million in TTM 2018. Maxim’s historical income statements are presented in Schedule F.1
Maxim’s total assets ranged between $0.324 million and $0.703 million during the Review Period. Maxim reported all current assets during the Review Period. Maxim’s total liabilities were $0.086 million as of December 31, 2014, $0.245 million as of December 31, 2015, then decreased to $0.109 million as of May 31, 2018. Maxim’s historical balance sheets are presented in Schedule F.2. Select financial and operating ratios are presented in Schedule F.3.
| VALUESCOPE | Appendix B | Page 13 |
Maxim Income Approach – Discounted Cash Flow Model
The projected revenue and expenses in the discounted cash flow (DCF) model were based on a review of projected income statements provided by Management for the fiscal years ending December 31, 2018 through December 31, 2021 and discussions with Management regarding long-term growth. The nominal growth rate consists of a long-term inflation estimate of 2.25% and a real revenue growth rate. Management’s projected income statement implies nominal revenue growth of 6.0% year-over-year from 2018 to 2021.
The projected cost of sales as a percentage of revenue is based on Management projections and decreases from 60.0% of revenue in 2018 to 54.0% of revenue in 2021. Projected cost of sales is then estimated to equal 54.0% of revenue through the rest of the projection period. Projected SG&A expenses are based on Management projections and are expected to decrease from 22.0% of revenue in 2018 to 16.0% of revenue in 2021. This was projected to remain throughout the rest of the projection period. The projected revenue and expenses are presented in Schedule G.1 and the projected income statements are presented in Schedule G.2.
The projected balance sheets (Schedule G.3) were determined based on historical financial information and ratios with input from Management.
In determining the valuation of Maxim’s pre-transaction equity utilizing the DCF model, we derived a weighted average cost of capital (WACC) for Maxim. The two components of the WACC calculation are the firm’s cost of equity capital and the firm’s cost of debt. We estimated Fuse’s cost of equity capital to be 13.2% and its cost of debt to be 3.7% after-tax. Applying a market debt/capital ratio of 4.1%, Fuse’s WACC was estimated to be 12.8%. The calculation of the WACC is presented in greater detail in Schedule G.4.
Based upon the forecasts and methodologies of the DCF method, it is our opinion that Maxim’s pre-transaction equity value, as of July 19, 2018, can be reasonably stated as $3.296 million. These calculations are presented in Schedule G.5.
Maxim Market Approach—Guideline Public Company Method
The market approach analysis included an examination of guideline companies and pricing measures and industry transactions observable in the public and private markets.
| VALUESCOPE | Appendix B | Page 14 |
We determined a conclusion of value based on a review of the pricing multiples of guideline companies. Based on discussions with Management and our own due diligence, we identified eight publicly traded guideline companies. We calculated and reviewed pricing multiples for each comparable company and as a group. Based on our analysis, we reviewed the mean, median, and 25th percentile of the enterprise value (EV) to sales multiples, the enterprise value (EV) to EBITDA multiples, and the enterprise value (EV) to EBIT multiples to derive a range of value.
The 25th percentile of the observed EV/EBITDA multiples of 10.5x was applied to Maxim’s TTM 2018 EBITDA value. We then added cash and subtracted debt to arrive at the implied equity value on a minority, marketable basis. A control premium of 28.1%20 was then applied to determine the total equity value, on a controlling basis, of $3.160 million. The guideline public company analysis is presented in Schedules H.1 through H.2.
Maxim Market Approach – Merger & Acquisition Method
Our transaction search was based upon proprietary research of target companies within the industry and discussions with Management. After a review of numerous transactions, we identified 13 transactions that we believe are relevant to Fuse and the potential acquisition.
We reviewed EV/Sales and EV/EBITDA multiples. We selected the median EV/EBITDA multiple to apply to Maxim’s TTM 2018 EBITDA. We then added cash and subtracted debt to determine a concluded equity value of $3.823 million. The merger and acquisition analysis is presented in Schedule I.
Maxim Pre-Transaction Equity Value
We utilized the income approach and the market approach to derive conclusions of value for Fuse’s pre-transaction equity on a controlling-interest basis. The conclusion of value from the DCF model was equal to $3.296 million. The two market approaches indicate a value between $3.160 million and $3.823 million. The income and market approaches were weighted equally and resulted in a concluded equity of $3.4 million, as presented in Schedule J.
| 20 | A 28.1% control premium is based median control premium from the M&A transactions presented in Schedule D. Schedule K.2 provides a breakdown of the Mergerstat data and the control premiums for the identified M&A transactions. |
| VALUESCOPE | Appendix B | Page 15 |
Transaction Analysis
We also reviewed Fuse’s historical trading history and share prices. According to Section 1.2(c)(i) of the Purchase Agreement, the purchase price based on the 30-day volume-weighted average price (VWAP) of Fuse.
Historical Fuse share prices and trading volume are presented in the table below.21
| Fuse Medical, Inc. (FZMD) Historical Share Data | ||||||||||||||||||||||||
| Date |
Open | High | Low | Close | Adj Close | Volume | ||||||||||||||||||
| 19-Jul-18 |
0.75 | 0.75 | 0.75 | 0.75 | 0.75 | |||||||||||||||||||
| 18-Jul-18 |
0.75 | 0.75 | 0.75 | 0.75 | 0.75 | |||||||||||||||||||
| 17-Jul-18 |
0.75 | 0.75 | 0.75 | 0.75 | 0.75 | |||||||||||||||||||
| 16-Jul-18 |
0.75 | 0.75 | 0.75 | 0.75 | 0.75 | 800 | ||||||||||||||||||
| 13-Jul-18 |
1.00 | 1.00 | 0.75 | 0.75 | 0.75 | 2,000 | ||||||||||||||||||
| 12-Jul-18 |
1.01 | 1.01 | 1.01 | 1.01 | 1.01 | |||||||||||||||||||
| 11-Jul-18 |
1.01 | 1.01 | 1.01 | 1.01 | 1.01 | |||||||||||||||||||
| 10-Jul-18 |
1.01 | 1.01 | 1.01 | 1.01 | 1.01 | |||||||||||||||||||
| 9-Jul-18 |
1.01 | 1.01 | 1.01 | 1.01 | 1.01 | |||||||||||||||||||
| 6-Jul-18 |
1.01 | 1.01 | 1.01 | 1.01 | 1.01 | |||||||||||||||||||
| 5-Jul-18 |
1.01 | 1.01 | 1.01 | 1.01 | 1.01 | |||||||||||||||||||
| 3-Jul-18 |
1.01 | 1.01 | 1.01 | 1.01 | 1.01 | |||||||||||||||||||
| 2-Jul-18 |
1.01 | 1.01 | 1.01 | 1.01 | 1.01 | |||||||||||||||||||
| 29-Jun-18 |
1.01 | 1.01 | 1.01 | 1.01 | 1.01 | |||||||||||||||||||
| 28-Jun-18 |
1.01 | 1.01 | 1.01 | 1.01 | 1.01 | |||||||||||||||||||
| 27-Jun-18 |
1.01 | 1.01 | 1.01 | 1.01 | 1.01 | |||||||||||||||||||
| 26-Jun-18 |
1.01 | 1.01 | 1.01 | 1.01 | 1.01 | |||||||||||||||||||
| 25-Jun-18 |
1.01 | 1.01 | 1.01 | 1.01 | 1.01 | |||||||||||||||||||
| 22-Jun-18 |
1.01 | 1.01 | 1.01 | 1.01 | 1.01 | |||||||||||||||||||
| 21-Jun-18 |
1.01 | 1.01 | 1.01 | 1.01 | 1.01 | |||||||||||||||||||
| 20-Jun-18 |
1.01 | 1.01 | 1.01 | 1.01 | 1.01 | |||||||||||||||||||
The most recent 30-day VWAP of Fuse is equal to $0.7500 per share. This analysis is presented in Schedule K.1
| 21 | Fuse Medical historical share data taken from Yahoo Finance. |
| VALUESCOPE | Appendix B | Page 16 |
Fairness Opinion Conclusion
We calculated Fuse’s pre-transaction equity value per share to be $0.5524. We then calculated Maxim’s equity value to equal $3.400 million. Along with the net working capital adjustment, the total purchase price was calculated to equal $3.821 million. The concluded post-transaction Fuse equity value per share is equal to $0.5666. These calculations are presented in Summary Schedule and in the tables below.
| Summary | ||||||
| Fair Value (FV) of Fuse Equity |
$ | 36,400,000 | Schedule E | |||
| Fuse Outstanding Shares (Pre-Transaction) |
65,890,808 | |||||
|
|
|
|||||
| FV of Fuse Equity Per Share (Pre-Transaction) |
$ | 0.5524 | per share | |||
|
|
|
|||||
| Closing Consideration/Maxim Equity Value |
$ | 3,400,000 | Schedule J | |||
| Plus: Closing Net Working Capital |
521,139 | |||||
| Less: Target Net Working Capital |
(100,000 | ) | ||||
|
|
|
|||||
| Total Maxim Purchase Price |
$ | 3,821,139 | ||||
| Securities Purchase Agreement Fuse Share Price |
$ | 0.7500 | Schedule K.1 | |||
|
|
|
|||||
| Shares Provided as Equity Payment |
5,094,852 | |||||
|
|
|
|||||
| Maxim Equity Value |
$ | 3,821,139 | ||||
| Fuse Equity Value |
$ | 36,400,000 | ||||
|
|
|
|||||
| Post-Transaction Equity Value |
$ | 40,221,139 | ||||
| Fuse Outstanding Shares (Post-Transaction) |
70,985,660 | |||||
|
|
|
|||||
| Fully Diluted Fuse Equity Value Per Share (Post-Transaction) |
$ | 0.5666 | per share | |||
|
|
|
|||||
| Conclusion - Deal is FAIR to Fuse Medical, Inc. Shareholders | ||||||
Based on our analysis, the Transaction is FAIR to shareholders in Fuse from a financial point of view.
| VALUESCOPE | Appendix B | Page 17 |
SCHEDULES (Page Number)
| SUMMARY AND CONCLUSION |
SUMMARY (1) | |||
| FINANCIAL STATEMENT ANALYSIS – FUSE |
A | |||
| Historical Income Statements |
A.1 (2) | |||
| Historical Balance Sheets |
A.2 (3) | |||
| Selected Financial and Operating Ratios |
A.3 (4) | |||
| DISCOUNTED CASH FLOW METHOD – FUSE |
B | |||
| Summary of Projection Inputs |
B.1 (5) | |||
| Projected Income Statements |
B.2 (6) | |||
| Projected Balance Sheets |
B.3 (7) | |||
| Projected Capital Expenditures |
B.4 (8) | |||
| Projected Tax Expenses |
B.5 (9) | |||
| Weighted Average Cost of Capital |
B.6 (10) | |||
| Synthesis of Net Cash Flow |
B.7 (11) | |||
| GUIDELINE PUBLIC COMPANY METHOD – FUSE |
C | |||
| Determination of Relevant Multiples |
C.1 (12) | |||
| Summary and Application of Multiples |
C.2 (13) | |||
| MERGER AND ACQUISITION METHOD – FUSE |
D (14) | |||
| EQUITY VALUATION SUMMARY – FUSE |
E (15) | |||
| FINANCIAL STATEMENT ANALYSIS – MAXIM |
F | |||
| Historical Income Statements |
F.1 (16) | |||
| Historical Balance Sheets |
F.2 (17) | |||
| Selected Financial and Operating Ratios |
F.3 (18) | |||
| DISCOUNTED CASH FLOW METHOD – MAXIM |
G | |||
| Summary of Projection Inputs |
G.1 (19) | |||
| Projected Income Statements |
G.2 (20) | |||
| Projected Balance Sheets |
G.3 (21) | |||
| Weighted Average Cost of Capital |
G.4 (22) | |||
| Synthesis of Net Cash Flow |
G.5 (23) |
SCHEDULES (Page Number)
| GUIDELINE PUBLIC COMPANY METHOD – MAXIM |
H | |
| Determination of Relevant Multiples |
H.1 (24) | |
| Summary and Application of Multiples |
H.2 (25) | |
| MERGER AND ACQUISITION METHOD – MAXIM |
I (26) | |
| EQUITY VALUATION SUMMARY – MAXIM |
J (27) | |
| TRANSACTION ANALYSIS |
K | |
| Securities Purchases Agreement Share Price |
K.1 (28) | |
| Review of Control Premium Data |
K.2 (29) | |
| Fairness Opinion Conclusion |
K.3 (30) |
| Fuse/Maxim Transaction Fairness Opinion |
||
| Summary and Conclusion |
Valuation Date: July 19, 2018 |
| Summary | ||||||
| Fair Value (FV) of Fuse Equity |
$ | 36,400,000 | Schedule E | |||
| Fuse Outstanding Shares (Pre-Transaction) |
65,890,808 | |||||
|
|
|
|||||
| FV of Fuse Equity Per Share (Pre-Transaction) |
$ | 0.5524 | per share | |||
|
|
|
|||||
| Closing Consideration/Maxim Equity Value |
$ | 3,400,000 | Schedule J | |||
| Plus: Closing Net Working Capital |
521,139 | |||||
| Less: Target Net Working Capital |
(100,000 | ) | ||||
|
|
|
|||||
| Total Maxim Purchase Price |
$ | 3,821,139 | ||||
| Securities Purchase Agreement Fuse Share Price |
$ | 0.7500 | Schedule K.1 | |||
|
|
|
|||||
| Shares Provided as Equity Payment |
5,094,852 | |||||
|
|
|
|||||
| Maxim Equity Value |
$ | 3,821,139 | ||||
| Fuse Equity Value |
$ | 36,400,000 | ||||
|
|
|
|||||
| Post-Transaction Equity Value |
$ | 40,221,139 | ||||
| Fuse Outstanding Shares (Post-Transaction) |
70,985,660 | |||||
|
|
|
|||||
| Fully Diluted Fuse Equity Value Per Share (Post-Transaction) |
$ | 0.5666 | per share | |||
|
|
|
|||||
| Conclusion - Deal is FAIR to Fuse Medical, Inc. Shareholders | ||||||
Page 1
| Fuse/Maxim Transaction Fairness Opinion |
Schedule A.1 | |
| Financial Statement Analysis - Fuse Medical, Inc. |
Valuation Date: July 19, 2018 | |
| Historical Income Statements |
||
| For the Year Ended: | ||||||||||||||||||||||||
| 31-Dec-16 | 31-Dec-17 | 31-Mar-18 | ||||||||||||||||||||||
| Restated | % | Restated | % | TTM | % | |||||||||||||||||||
| Revenue |
$ | 25,666,650 | 100.0 | % | $ | 26,407,206 | 100.0 | % | $ | 26,820,910 | 100.0 | % | ||||||||||||
| Cost of sales (COS) |
11,256,887 | 43.9 | % | 14,582,416 | 55.2 | % | 14,644,968 | 54.6 | % | |||||||||||||||
|
|
|
|
|
|
|
|||||||||||||||||||
| Gross Profit |
14,409,763 | 56.1 | % | 11,824,790 | 44.8 | % | 12,175,942 | 45.4 | % | |||||||||||||||
| Selling, general & administrative (SG&A) expenses |
11,227,265 | 43.7 | % | 10,797,597 | 40.9 | % | 11,523,454 | 43.0 | % | |||||||||||||||
|
|
|
|
|
|
|
|||||||||||||||||||
| Earnings before interest, taxes, depreciation & amortization (EBITDA) |
3,182,498 | 12.4 | % | 1,027,193 | 3.9 | % | 652,488 | 2.4 | % | |||||||||||||||
| Depreciation expense |
19,091 | 0.1 | % | 14,521 | 0.1 | % | 11,253 | 0.0 | % | |||||||||||||||
|
|
|
|
|
|
|
|||||||||||||||||||
| Earnings before interest & taxes (EBIT) |
3,163,407 | 12.3 | % | 1,012,672 | 3.8 | % | 641,235 | 2.4 | % | |||||||||||||||
| Interest (expense) |
(147,000 | ) | -0.6 | % | (162,000 | ) | -0.6 | % | (166,000 | ) | -0.6 | % | ||||||||||||
|
|
|
|
|
|
|
|||||||||||||||||||
| Other income, net |
(147,000 | ) | -0.6 | % | (162,000 | ) | -0.6 | % | (166,000 | ) | -0.6 | % | ||||||||||||
|
|
|
|
|
|
|
|||||||||||||||||||
| Net Income |
$ | 3,016,407 | 11.8 | % | $ | 850,672 | 3.2 | % | $ | 475,235 | 1.8 | % | ||||||||||||
|
|
|
|
|
|
|
|||||||||||||||||||
| Annualized Growth Rates |
||||||||||||||||||||||||
| Revenue |
NA | 2.9 | % | 6.5 | % | |||||||||||||||||||
| Gross Profit |
NA | -17.9 | % | 12.6 | % | |||||||||||||||||||
| EBITDA |
NA | -67.7 | % | -84.1 | % | |||||||||||||||||||
| EBIT |
NA | -68.0 | % | -84.3 | % | |||||||||||||||||||
| Net Income |
NA | -71.8 | % | -90.6 | % | |||||||||||||||||||
Page 2
| Fuse/Maxim Transaction Fairness Opinion |
Schedule A.2 | |
| Financial Statement Analysis - Fuse Medical, Inc. |
Valuation Date: July 19, 2018 | |
| Historical Balance Sheets |
||
| As of: | ||||||||||||||||||||||||
| 31-Dec-16 | 31-Dec-17 | 31-Mar-18 | ||||||||||||||||||||||
| Actual | % | Actual | % | Actual | % | |||||||||||||||||||
| Current Assets |
||||||||||||||||||||||||
| Cash & cash equivalents |
$ | 778,447 | 4.0 | % | $ | 804,715 | 4.2 | % | $ | 797,803 | 4.6 | % | ||||||||||||
| Accounts receivable, net |
6,508,286 | 33.2 | % | 6,570,382 | 34.1 | % | 4,709,077 | 27.4 | % | |||||||||||||||
| Inventory |
11,426,828 | 58.4 | % | 10,626,769 | 55.2 | % | 10,253,260 | 59.6 | % | |||||||||||||||
| Prepaid expenses and other CA |
23,018 | 0.1 | % | 32,466 | 0.2 | % | 30,757 | 0.2 | % | |||||||||||||||
|
|
|
|
|
|
|
|||||||||||||||||||
| Total Current Assets |
18,736,579 | 95.7 | % | 18,034,332 | 93.7 | % | 15,790,897 | 91.8 | % | |||||||||||||||
| Fixed assets, net |
14,747 | 0.1 | % | 16,895 | 0.1 | % | 14,817 | 0.1 | % | |||||||||||||||
| Other assets |
3,822 | 0.0 | % | 375,278 | 1.9 | % | 583,670 | 3.4 | % | |||||||||||||||
| Goodwill |
820,650 | 4.2 | % | 820,650 | 4.3 | % | 820,650 | 4.8 | % | |||||||||||||||
|
|
|
|
|
|
|
|||||||||||||||||||
| Total Assets |
$ | 19,575,798 | 100.0 | % | $ | 19,247,155 | 100.0 | % | $ | 17,210,034 | 100.0 | % | ||||||||||||
|
|
|
|
|
|
|
|||||||||||||||||||
| Current Liabilities |
||||||||||||||||||||||||
| Accounts payable |
$ | 2,452,922 | 12.5 | % | $ | 2,588,091 | 13.4 | % | $ | 1,534,437 | 8.9 | % | ||||||||||||
| Accrued expenses |
3,068,054 | 15.7 | % | 1,830,679 | 9.5 | % | 2,185,661 | 12.7 | % | |||||||||||||||
| Current portion long-term debt |
3,455,347 | 17.7 | % | 3,565,351 | 18.5 | % | 2,823,783 | 16.4 | % | |||||||||||||||
|
|
|
|
|
|
|
|||||||||||||||||||
| Total Current Liabilities |
8,976,323 | 45.9 | % | 7,984,121 | 41.5 | % | 6,543,881 | 38.0 | % | |||||||||||||||
| Other long-term liabilities |
— | 0.0 | % | 19,244,543 | 100.0 | % | 19,244,543 | 111.8 | % | |||||||||||||||
|
|
|
|
|
|
|
|||||||||||||||||||
| Total Liabilities |
8,976,323 | 45.9 | % | 27,228,664 | 141.5 | % | 25,788,424 | 149.8 | % | |||||||||||||||
| Total Equity |
10,599,475 | 54.1 | % | (7,981,509 | ) | -41.5 | % | (8,578,390 | ) | -49.8 | % | |||||||||||||
|
|
|
|
|
|
|
|||||||||||||||||||
| Total Liabilities & Equity |
$ | 19,575,798 | 100.0 | % | $ | 19,247,155 | 100.0 | % | $ | 17,210,034 | 100.0 | % | ||||||||||||
|
|
|
|
|
|
|
|||||||||||||||||||
Page 3
| Fuse/Maxim Transaction Fairness Opinion | Schedule A.3 | |
| Financial Statement Analysis - Fuse Medical, Inc. | Valuation Date: July 19, 2018 | |
| Select Financial and Operating Ratios | ||
| For the Year Ended: | ||||||||||||||||||||||||||||||
| 31-Dec-16 | 31-Dec-17 | 31-Mar-18 | ||||||||||||||||||||||||||||
| DuPont Analysis |
||||||||||||||||||||||||||||||
| Asset turnover |
131.1 | % | 137.2 | % | 155.8 | % | ||||||||||||||||||||||||
| Operating margin |
12.3 | % | 3.8 | % | 2.4 | % | ||||||||||||||||||||||||
| Interest burden |
95.4 | % | 84.0 | % | 74.1 | % | ||||||||||||||||||||||||
| Tax retention rate |
x | 100.0 | % | x | 100.0 | % | x | 100.0 | % | |||||||||||||||||||||
|
|
|
|
|
|
|
|||||||||||||||||||||||||
| Return on assets |
15.4 | % | 4.4 | % | 2.8 | % | ||||||||||||||||||||||||
| Financial leverage |
x | 1.85 | x | (2.41 | ) | x | (2.01 | ) | ||||||||||||||||||||||
|
|
|
|
|
|
|
|||||||||||||||||||||||||
| Return on book value of equity |
28.5 | % | -10.7 | % | -5.5 | % | ||||||||||||||||||||||||
| Short-term Liquidity |
Average | |||||||||||||||||||||||||||||
| Working capital, excluding short-term debt |
$13,215,603 | $ | 13,615,562 | $ | 12,070,799 | |||||||||||||||||||||||||
| % revenue |
51.5 | % | 51.6 | % | 45.0 | % | 49.4 | % | ||||||||||||||||||||||
| Current ratio |
2.1 | x | 2.3 | x | 2.4 | x | 2.3 | x | ||||||||||||||||||||||
| Quick Ratio |
0.8 | x | 0.9 | x | 0.8 | x | 0.9 | x | ||||||||||||||||||||||
| Basis |
||||||||||||||||||||||||||||||
| Days cash & equivalent |
COS + SG&A | 13 | 12 | 11 | 12 | |||||||||||||||||||||||||
| Prepaid expenses |
SG&A expenses | 0.2 | % | 0.3 | % | 0.3 | % | 0.3 | % | |||||||||||||||||||||
| Days A/R |
Revenue | 93 | 91 | 64 | 82 | |||||||||||||||||||||||||
| Days inventory |
Cost of sales | 371 | 266 | 256 | 297 | |||||||||||||||||||||||||
| Days A/P |
Cost of sales | 80 | 65 | 38 | 61 | |||||||||||||||||||||||||
| Days accrued expenses SG&A expenses |
100 | 62 | 69 | 77 | ||||||||||||||||||||||||||
| Fixed Asset Analysis |
Average | |||||||||||||||||||||||||||||
| Net fixed assets |
$ | 14,747 | $ | 16,895 | $ | 14,817 | ||||||||||||||||||||||||
| % revenue |
0.1 | % | 0.1 | % | 0.1 | % | 0.1 | % | ||||||||||||||||||||||
| Fixed asset utilization |
1,740.5 | x | 1,563.0 | x | 1,810.1 | x | 1,704.5 | x | ||||||||||||||||||||||
| Depreciation expense |
$ | 19,091 | $ | 14,521 | $ | 11,253 | ||||||||||||||||||||||||
| Solvency Ratios |
Average | |||||||||||||||||||||||||||||
| Total Liabilities-to-Total Equity |
0.8 | x | -3.4 | x | -3.0 | x | -1.9 | x | ||||||||||||||||||||||
| Total Liabilities-to-Total Liabilities & Equity |
0.5 | x | 1.4 | x | 1.5 | x | 1.1 | x | ||||||||||||||||||||||
| Profit Margins |
Average | |||||||||||||||||||||||||||||
| Gross margin |
56.1 | % | 44.8 | % | 45.4 | % | 29.3 | % | ||||||||||||||||||||||
| EBITDA margin |
12.4 | % | 3.9 | % | 2.4 | % | 3.7 | % | ||||||||||||||||||||||
| EBIT margin |
12.3 | % | 3.8 | % | 2.4 | % | 3.7 | % | ||||||||||||||||||||||
| Net income margin |
11.8 | % | 3.2 | % | 1.8 | % | 3.3 | % | ||||||||||||||||||||||
Page 4
| Fuse/Maxim Transaction Fairness Opinion | Schedule B.1 | |
| Discounted Cash Flow Method - Fuse Medical, Inc. | Valuation Date: July 19, 2018 |
| Summary of Projection Inputs | ||
| Income Statement Inputs | ||
| For the Projected Year Ended: | ||||||||||||||||||||||||||||||||||||||||||||
| 31-Dec-18 | 31-Dec-19 | 31-Dec-20 | 31-Dec-21 | 31-Dec-22 | 31-Dec-23 | 31-Dec-24 | 31-Dec-25 | 31-Dec-26 | 31-Dec-27 | Residual | ||||||||||||||||||||||||||||||||||
| Inflation estimate |
2.3 | % | 2.3 | % | 2.3 | % | 2.3 | % | 2.3 | % | 2.3 | % | 2.3 | % | 2.3 | % | 2.3 | % | 2.3 | % | 2.3 | % | ||||||||||||||||||||||
| Real revenue growth rate |
3.7 | % | 3.7 | % | 3.7 | % | 3.7 | % | 3.7 | % | 3.2 | % | 2.7 | % | 2.2 | % | 1.7 | % | 1.2 | % | 0.0 | % | ||||||||||||||||||||||
|
|
|
|
|
|
|
|
|
|
|
|
|
|
|
|
|
|
|
|
|
|
|
|||||||||||||||||||||||
| Revenue growth rate |
6.0 | % | 6.0 | % | 6.0 | % | 6.0 | % | 6.0 | % | 5.5 | % | 5.0 | % | 4.5 | % | 4.0 | % | 3.5 | % | 2.3 | % | ||||||||||||||||||||||
| Cost of sales (COS) (% of revenue) |
55.6 | % | 54.0 | % | 53.0 | % | 51.0 | % | 50.0 | % | 50.0 | % | 50.0 | % | 50.0 | % | 50.0 | % | 50.0 | % | 50.0 | % | ||||||||||||||||||||||
| Gross profit margin |
44.4 | % | 46.0 | % | 47.0 | % | 49.0 | % | 50.0 | % | 50.0 | % | 50.0 | % | 50.0 | % | 50.0 | % | 50.0 | % | 50.0 | % | ||||||||||||||||||||||
| SG&A expenses (% of revenue) |
36.3 | % | 38.0 | % | 35.0 | % | 34.0 | % | 33.0 | % | 33.0 | % | 33.0 | % | 33.0 | % | 33.0 | % | 33.0 | % | 33.0 | % | ||||||||||||||||||||||
| EBITDA margin |
8.1 | % | 8.0 | % | 12.0 | % | 15.0 | % | 17.0 | % | 17.0 | % | 17.0 | % | 17.0 | % | 17.0 | % | 17.0 | % | 17.0 | % | ||||||||||||||||||||||
| Income tax rate |
21.0 | % | 21.0 | % | 21.0 | % | 21.0 | % | 21.0 | % | 21.0 | % | 21.0 | % | 21.0 | % | 21.0 | % | 21.0 | % | 21.0 | % | ||||||||||||||||||||||
| Balance Sheet Inputs
|
| |||||||||||||||||||||||||||||||||||||||||||
| For the Projected Year Ended: | ||||||||||||||||||||||||||||||||||||||||||||
| 31-Dec-18 | 31-Dec-19 | 31-Dec-20 | 31-Dec-21 | 31-Dec-22 | 31-Dec-23 | 31-Dec-24 | 31-Dec-25 | 31-Dec-26 | 31-Dec-27 | Residual | ||||||||||||||||||||||||||||||||||
| Days cash & equivalents |
10.0 | 5.5 | 5.5 | 5.5 | 5.5 | 5.5 | 5.5 | 5.5 | 5.5 | 5.5 | 5.5 | |||||||||||||||||||||||||||||||||
| Basis: COS + SG&A |
||||||||||||||||||||||||||||||||||||||||||||
| Days A/R |
65.0 | 60.0 | 60.0 | 60.0 | 60.0 | 60.0 | 60.0 | 60.0 | 60.0 | 60.0 | 60.0 | |||||||||||||||||||||||||||||||||
| Basis: Revenue |
||||||||||||||||||||||||||||||||||||||||||||
| Days inventory |
255.0 | 275.0 | 275.0 | 275.0 | 275.0 | 275.0 | 275.0 | 275.0 | 275.0 | 275.0 | 275.0 | |||||||||||||||||||||||||||||||||
| Basis: Cost of sales |
||||||||||||||||||||||||||||||||||||||||||||
| Prepaid expenses |
0.3 | % | 0.3 | % | 0.3 | % | 0.3 | % | 0.3 | % | 0.3 | % | 0.3 | % | 0.3 | % | 0.3 | % | 0.3 | % | 0.3 | % | ||||||||||||||||||||||
| Basis: SG&A expenses |
||||||||||||||||||||||||||||||||||||||||||||
| Days A/P |
40.0 | 40.0 | 40.0 | 40.0 | 40.0 | 40.0 | 40.0 | 40.0 | 40.0 | 40.0 | 40.0 | |||||||||||||||||||||||||||||||||
| Basis: Cost of sales |
||||||||||||||||||||||||||||||||||||||||||||
| Days accrued expenses |
80.0 | 80.0 | 90.0 | 90.0 | 90.0 | 90.0 | 90.0 | 90.0 | 90.0 | 90.0 | 90.0 | |||||||||||||||||||||||||||||||||
| Basis: SG&A expenses |
||||||||||||||||||||||||||||||||||||||||||||
Page 5
| Fuse/Maxim Transaction Fairness Opinion | Schedule B.2 | |
| Discounted Cash Flow Method - Fuse Medical, Inc. | Valuation Date: July 19, 2018 |
| Projected Income Statements | ||||
| Base | ||||||||||||||||||||||||||||||||||||||||||||||||
| Period | For the Projected Year Ended: | |||||||||||||||||||||||||||||||||||||||||||||||
| 31-Dec-17 | 31-Dec-18 | 31-Dec-19 | 31-Dec-20 | 31-Dec-21 | 31-Dec-22 | 31-Dec-23 | 31-Dec-24 | 31-Dec-25 | 31-Dec-26 | 31-Dec-27 | Residual | |||||||||||||||||||||||||||||||||||||
| Revenue |
$ | 26,407,206 | $ | 27,991,638 | $ | 29,671,137 | $ | 31,451,405 | $ | 33,338,489 | $ | 35,338,799 | $ | 37,282,433 | $ | 39,146,554 | $ | 40,908,149 | $ | 42,544,475 | $ | 44,033,532 | $ | 45,024,286 | ||||||||||||||||||||||||
| Annual Growth Rate |
6.0 | % | 6.0 | % | 6.0 | % | 6.0 | % | 6.0 | % | 5.5 | % | 5.0 | % | 4.5 | % | 4.0 | % | 3.5 | % | 2.3 | % | ||||||||||||||||||||||||||
| Cost of sales (COS) |
14,582,416 | 15,563,351 | 16,022,414 | 16,669,245 | 17,002,630 | 17,669,399 | 18,641,216 | 19,573,277 | 20,454,075 | 21,272,238 | 22,016,766 | 22,512,143 | ||||||||||||||||||||||||||||||||||||
|
|
|
|
|
|
|
|
|
|
|
|
|
|
|
|
|
|
|
|
|
|
|
|
|
|||||||||||||||||||||||||
| Gross Profit |
11,824,790 | 12,428,287 | 13,648,723 | 14,782,160 | 16,335,860 | 17,669,399 | 18,641,216 | 19,573,277 | 20,454,075 | 21,272,238 | 22,016,766 | 22,512,143 | ||||||||||||||||||||||||||||||||||||
| SG&A expenses |
10,797,597 | 10,160,964 | 11,275,032 | 11,007,992 | 11,335,086 | 11,661,804 | 12,303,203 | 12,918,363 | 13,499,689 | 14,039,677 | 14,531,066 | 14,858,014 | ||||||||||||||||||||||||||||||||||||
|
|
|
|
|
|
|
|
|
|
|
|
|
|
|
|
|
|
|
|
|
|
|
|
|
|||||||||||||||||||||||||
| Earnings before interest, taxes, depreciation & amortization (EBITDA) |
1,027,193 | 2,267,323 | 2,373,691 | 3,774,169 | 5,000,773 | 6,007,596 | 6,338,014 | 6,654,914 | 6,954,385 | 7,232,561 | 7,485,700 | 7,654,129 | ||||||||||||||||||||||||||||||||||||
| Depreciation expense |
14,521 | 20,429 | 7,280 | 11,250 | 15,459 | 19,921 | 21,093 | 22,290 | 23,484 | 24,646 | 25,743 | 26,721 | ||||||||||||||||||||||||||||||||||||
|
|
|
|
|
|
|
|
|
|
|
|
|
|
|
|
|
|
|
|
|
|
|
|
|
|||||||||||||||||||||||||
| Earnings before interest & taxes (EBIT) |
1,012,672 | 2,246,894 | 2,366,411 | 3,762,918 | 4,985,314 | 5,987,675 | 6,316,920 | 6,632,625 | 6,930,902 | 7,207,915 | 7,459,957 | 7,627,408 | ||||||||||||||||||||||||||||||||||||
| Current income taxes |
459,864 | 484,685 | 777,906 | 1,034,807 | 1,245,760 | 1,314,895 | 1,381,191 | 1,443,833 | 1,502,014 | 1,554,953 | 1,601,756 | |||||||||||||||||||||||||||||||||||||
| Deferred taxes |
11,984 | 12,261 | 12,307 | 12,109 | 11,651 | 11,658 | 11,660 | 11,657 | 11,648 | 11,638 | — | |||||||||||||||||||||||||||||||||||||
|
|
|
|
|
|
|
|
|
|
|
|
|
|
|
|
|
|
|
|
|
|
|
|||||||||||||||||||||||||||
| Total taxes |
471,848 | 496,946 | 790,213 | 1,046,916 | 1,257,412 | 1,326,553 | 1,392,851 | 1,455,489 | 1,513,662 | 1,566,591 | 1,601,756 | |||||||||||||||||||||||||||||||||||||
|
|
|
|
|
|
|
|
|
|
|
|
|
|
|
|
|
|
|
|
|
|
|
|||||||||||||||||||||||||||
| Net Income |
$ | 1,775,046 | $ | 1,869,465 | $ | 2,972,705 | $ | 3,938,398 | $ | 4,730,263 | $ | 4,990,367 | $ | 5,239,773 | $ | 5,475,412 | $ | 5,694,253 | $ | 5,893,366 | $ | 6,025,652 | ||||||||||||||||||||||||||
|
|
|
|
|
|
|
|
|
|
|
|
|
|
|
|
|
|
|
|
|
|
|
|||||||||||||||||||||||||||
| Profit Margins |
Projected Profit Margins | |||||||||||||||||||||||||||||||||||||||||||||||
| Gross margin |
44.8 | % | 44.4 | % | 46.0 | % | 47.0 | % | 49.0 | % | 50.0 | % | 50.0 | % | 50.0 | % | 50.0 | % | 50.0 | % | 50.0 | % | 50.0 | % | ||||||||||||||||||||||||
| EBITDA margin |
3.9 | % | 8.1 | % | 8.0 | % | 12.0 | % | 15.0 | % | 17.0 | % | 17.0 | % | 17.0 | % | 17.0 | % | 17.0 | % | 17.0 | % | 17.0 | % | ||||||||||||||||||||||||
| EBIT margin |
3.8 | % | 8.0 | % | 8.0 | % | 12.0 | % | 15.0 | % | 16.9 | % | 16.9 | % | 16.9 | % | 16.9 | % | 16.9 | % | 16.9 | % | 16.9 | % | ||||||||||||||||||||||||
| Net income margin |
0.0 | % | 6.3 | % | 6.3 | % | 9.5 | % | 11.8 | % | 13.4 | % | 13.4 | % | 13.4 | % | 13.4 | % | 13.4 | % | 13.4 | % | 13.4 | % | ||||||||||||||||||||||||
| Effective tax rate |
NM | 21.0 | % | 21.0 | % | 21.0 | % | 21.0 | % | 21.0 | % | 21.0 | % | 21.0 | % | 21.0 | % | 21.0 | % | 21.0 | % | 21.0 | % | |||||||||||||||||||||||||
Page 6
| Fuse/Maxim Transaction Fairness Opinion | Schedule B.3 | |
| Discounted Cash Flow Method - Fuse Medical, Inc. | Valuation Date: July 19, 2018 |
Projected Balance Sheets
| Base | ||||||||||||||||||||||||||||||||||||||||||||||||
| Period | Projected As Of: | |||||||||||||||||||||||||||||||||||||||||||||||
| 31-Dec-17 | 31-Dec-18 | 31-Dec-19 | 31-Dec-20 | 31-Dec-21 | 31-Dec-22 | 31-Dec-23 | 31-Dec-24 | 31-Dec-25 | 31-Dec-26 | 31-Dec-27 | Residual | |||||||||||||||||||||||||||||||||||||
| Current Assets |
||||||||||||||||||||||||||||||||||||||||||||||||
| Cash & cash equivalents |
$ | 804,715 | $ | 704,776 | $ | 411,331 | $ | 417,054 | $ | 427,007 | $ | 441,977 | $ | 466,286 | $ | 489,600 | $ | 511,632 | $ | 532,097 | $ | 550,721 | $ | 563,112 | ||||||||||||||||||||||||
| Accounts receivable, net |
6,570,382 | 4,984,812 | 4,877,447 | 5,170,094 | 5,480,300 | 5,809,118 | 6,128,619 | 6,435,050 | 6,724,627 | 6,993,612 | 7,238,389 | 7,401,253 | ||||||||||||||||||||||||||||||||||||
| Inventory |
10,626,769 | 10,873,026 | 12,071,682 | 12,559,020 | 12,810,200 | 13,312,561 | 14,044,752 | 14,746,990 | 15,410,604 | 16,027,028 | 16,587,974 | 16,961,204 | ||||||||||||||||||||||||||||||||||||
| Prepaid expenses & other current assets |
32,466 | 30,483 | 33,825 | 33,024 | 34,005 | 34,985 | 36,910 | 38,755 | 40,499 | 42,119 | 43,593 | 44,574 | ||||||||||||||||||||||||||||||||||||
|
|
|
|
|
|
|
|
|
|
|
|
|
|
|
|
|
|
|
|
|
|
|
|
|
|||||||||||||||||||||||||
| Total Current Assets |
18,034,332 | 16,593,097 | 17,394,285 | 18,179,192 | 18,751,512 | 19,598,641 | 20,676,566 | 21,710,395 | 22,687,363 | 23,594,857 | 24,420,677 | 24,970,142 | ||||||||||||||||||||||||||||||||||||
| Fixed assets, net |
16,895 | 14,135 | 25,585 | 34,188 | 39,773 | 42,159 | 44,599 | 47,020 | 49,359 | 51,569 | 53,620 | 55,320 | ||||||||||||||||||||||||||||||||||||
| Other Assets |
375,278 | 375,278 | 375,278 | 375,278 | 375,278 | 375,278 | 375,278 | 375,278 | 375,278 | 375,278 | 375,278 | 375,278 | ||||||||||||||||||||||||||||||||||||
| Goodwill |
820,650 | 820,650 | 820,650 | 820,650 | 820,650 | 820,650 | 820,650 | 820,650 | 820,650 | 820,650 | 820,650 | 820,650 | ||||||||||||||||||||||||||||||||||||
|
|
|
|
|
|
|
|
|
|
|
|
|
|
|
|
|
|
|
|
|
|
|
|
|
|||||||||||||||||||||||||
| Total Assets |
$ | 19,247,155 | $ | 17,803,160 | $ | 18,615,798 | $ | 19,409,308 | $ | 19,987,213 | $ | 20,836,728 | $ | 21,917,094 | $ | 22,953,343 | $ | 23,932,650 | $ | 24,842,354 | $ | 25,670,226 | $ | 26,221,391 | ||||||||||||||||||||||||
|
|
|
|
|
|
|
|
|
|
|
|
|
|
|
|
|
|
|
|
|
|
|
|
|
|||||||||||||||||||||||||
| Current Liabilities |
||||||||||||||||||||||||||||||||||||||||||||||||
| Accounts payable |
$ | 2,588,091 | $ | 1,705,573 | $ | 1,755,881 | $ | 1,826,767 | $ | 1,863,302 | $ | 1,936,373 | $ | 2,042,873 | $ | 2,145,017 | $ | 2,241,542 | $ | 2,331,204 | $ | 2,412,796 | $ | 2,467,084 | ||||||||||||||||||||||||
| Accrued expenses |
1,830,679 | 2,227,061 | 2,471,240 | 2,714,299 | 2,794,953 | 2,875,513 | 3,033,666 | 3,185,350 | 3,328,691 | 3,461,838 | 3,583,002 | 3,663,620 | ||||||||||||||||||||||||||||||||||||
| Current portion of long-term debt |
3,565,351 | 3,565,351 | 3,565,351 | 3,565,351 | 3,565,351 | 3,565,351 | 3,565,351 | 3,565,351 | 3,565,351 | 3,565,351 | 3,565,351 | 3,565,351 | ||||||||||||||||||||||||||||||||||||
|
|
|
|
|
|
|
|
|
|
|
|
|
|
|
|
|
|
|
|
|
|
|
|
|
|||||||||||||||||||||||||
| Total Current Liabilities |
7,984,121 | 7,497,984 | 7,792,472 | 8,106,417 | 8,223,606 | 8,377,237 | 8,641,890 | 8,895,717 | 9,135,584 | 9,358,393 | 9,561,150 | 9,696,055 | ||||||||||||||||||||||||||||||||||||
| Deferred tax liability / (asset) |
— | 11,984 | 24,245 | 36,552 | 48,661 | 60,312 | 71,970 | 83,630 | 95,287 | 106,935 | 118,574 | 118,574 | ||||||||||||||||||||||||||||||||||||
| Other long-term liabilities |
19,244,543 | 19,244,543 | 19,244,543 | 19,244,543 | 19,244,543 | 19,244,543 | 19,244,543 | 19,244,543 | 19,244,543 | 19,244,543 | 19,244,543 | 19,244,543 | ||||||||||||||||||||||||||||||||||||
|
|
|
|
|
|
|
|
|
|
|
|
|
|
|
|
|
|
|
|
|
|
|
|
|
|||||||||||||||||||||||||
| Total Liabilities |
27,228,664 | 26,754,511 | 27,061,260 | 27,387,512 | 27,516,810 | 27,682,092 | 27,958,404 | 28,223,891 | 28,475,414 | 28,709,871 | 28,924,266 | 29,059,172 | ||||||||||||||||||||||||||||||||||||
| Total Capital |
||||||||||||||||||||||||||||||||||||||||||||||||
| Beginning capital |
(7,981,509 | ) | (8,951,351 | ) | (8,445,461 | ) | (7,978,204 | ) | (7,529,597 | ) | (6,845,364 | ) | (6,041,310 | ) | (5,270,548 | ) | (4,542,764 | ) | (3,867,518 | ) | (3,254,041 | ) | ||||||||||||||||||||||||||
| Current period earnings (loss) |
1,775,046 | 1,869,465 | 2,972,705 | 3,938,398 | 4,730,263 | 4,990,367 | 5,239,773 | 5,475,412 | 5,694,253 | 5,893,366 | 6,025,652 | |||||||||||||||||||||||||||||||||||||
| Net cash flow |
2,744,888 | 1,363,575 | 2,505,448 | 3,489,791 | 4,046,030 | 4,186,313 | 4,469,011 | 4,747,629 | 5,019,007 | 5,279,889 | 5,609,393 | |||||||||||||||||||||||||||||||||||||
|
|
|
|
|
|
|
|
|
|
|
|
|
|
|
|
|
|
|
|
|
|
|
|
|
|||||||||||||||||||||||||
| Ending Capital |
(7,981,509 | ) | (8,951,351 | ) | (8,445,461 | ) | (7,978,204 | ) | (7,529,597 | ) | (6,845,364 | ) | (6,041,310 | ) | (5,270,548 | ) | (4,542,764 | ) | (3,867,518 | ) | (3,254,041 | ) | (2,837,781 | ) | ||||||||||||||||||||||||
| Total Liabilities & Capital |
$ | 19,247,155 | $ | 17,803,160 | $ | 18,615,798 | $ | 19,409,308 | $ | 19,987,213 | $ | 20,836,728 | $ | 21,917,094 | $ | 22,953,343 | $ | 23,932,650 | $ | 24,842,354 | $ | 25,670,226 | $ | 26,221,391 | ||||||||||||||||||||||||
|
|
|
|
|
|
|
|
|
|
|
|
|
|
|
|
|
|
|
|
|
|
|
|
|
|||||||||||||||||||||||||
| Working capital (CA - CL) |
$ | 13,615,562 | $ | 12,660,463 | $ | 13,167,165 | $ | 13,638,126 | $ | 14,093,257 | $ | 14,786,755 | $ | 15,600,027 | $ | 16,380,028 | $ | 17,117,130 | $ | 17,801,815 | $ | 18,424,878 | $ | 18,839,438 | ||||||||||||||||||||||||
| WC balance as % revenue |
51.6 | % | 45.2 | % | 44.4 | % | 43.4 | % | 42.3 | % | 41.8 | % | 41.8 | % | 41.8 | % | 41.8 | % | 41.8 | % | 41.8 | % | 41.8 | % | ||||||||||||||||||||||||
| Additions (subtractions) thereto |
(955,099 | ) | 506,701 | 470,962 | 455,131 | 693,498 | 813,272 | 780,001 | 737,101 | 684,685 | 623,064 | 414,560 | ||||||||||||||||||||||||||||||||||||
Page 7
| Fuse/Maxim Transaction Fairness Opinion | Schedule B.4 | |
| Discounted Cash Flow Method - Fuse Medical, Inc. | Valuation Date: July 19, 2018 |
| Projected Capital Expenditures |
| |||||||||||||||||||||||||||||||||||||||||||||||
| 31-Dec-18 | 31-Dec-19 | 31-Dec-20 | 31-Dec-21 | 31-Dec-22 | 31-Dec-23 | 31-Dec-24 | 31-Dec-25 | 31-Dec-26 | 31-Dec-27 | Residual | ||||||||||||||||||||||||||||||||||||||
| Fixed asset utilization rate |
1,980.3x | 1,159.7x | 920.0x | 838.2x | 838.2x | 835.9x | 832.5x | 828.8x | 825.0x | 821.2x | 813.9x | |||||||||||||||||||||||||||||||||||||
| Required assets |
$ | 14,135 | $ | 25,585 | $ | 34,188 | $ | 39,773 | $ | 42,159 | $ | 44,599 | $ | 47,020 | $ | 49,359 | $ | 51,569 | $ | 53,620 | $ | 55,320 | ||||||||||||||||||||||||||
| Beginning assets |
16,895 | 14,135 | 25,585 | 34,188 | 39,773 | 42,159 | 44,599 | 47,020 | 49,359 | 51,569 | 53,620 | |||||||||||||||||||||||||||||||||||||
| Depreciation |
20,429 | 7,280 | 11,250 | 15,459 | 19,921 | 21,093 | 22,290 | 23,484 | 24,646 | 25,743 | 26,721 | |||||||||||||||||||||||||||||||||||||
|
|
|
|
|
|
|
|
|
|
|
|
|
|
|
|
|
|
|
|
|
|
|
|||||||||||||||||||||||||||
| Required capital expenditures |
$ | 17,669 | $ | 18,729 | $ | 19,853 | $ | 21,044 | $ | 22,307 | $ | 23,534 | $ | 24,710 | $ | 25,822 | $ | 26,855 | $ | 27,795 | $ | 28,421 | ||||||||||||||||||||||||||
|
|
|
|
|
|
|
|
|
|
|
|
|
|
|
|
|
|
|
|
|
|
|
|||||||||||||||||||||||||||
| As % revenue |
0.1 | % | 0.1 | % | 0.1 | % | 0.1 | % | 0.1 | % | 0.1 | % | 0.1 | % | 0.1 | % | 0.1 | % | 0.1 | % | 0.1 | % | ||||||||||||||||||||||||||
| Economic / Book Depreciation Schedule: |
||||||||||||||||||||||||||||||||||||||||||||||||
| Existing assets, net |
16,895 | |||||||||||||||||||||||||||||||||||||||||||||||
| Depreciation life - existing assets |
1 | $ | 16,895 | $ | 0 | $ | 0 | $ | 0 | $ | 0 | $ | 0 | $ | 0 | $ | 0 | $ | 0 | $ | 0 | $ | 0 | |||||||||||||||||||||||||
| Depreciation life - capital expenditure |
5 | |||||||||||||||||||||||||||||||||||||||||||||||
| Capital expenditures - 2018 |
$ | 17,669 | 3,534 | 3,534 | 3,534 | 3,534 | 3,534 | — | — | — | — | — | — | |||||||||||||||||||||||||||||||||||
| Capital expenditures - 2019 |
18,729 | 3,746 | 3,746 | 3,746 | 3,746 | 3,746 | — | — | — | — | — | |||||||||||||||||||||||||||||||||||||
| Capital expenditures - 2020 |
19,853 | 3,971 | 3,971 | 3,971 | 3,971 | 3,971 | — | — | — | — | ||||||||||||||||||||||||||||||||||||||
| Capital expenditures - 2021 |
21,044 | 4,209 | 4,209 | 4,209 | 4,209 | 4,209 | — | — | — | |||||||||||||||||||||||||||||||||||||||
| Capital expenditures - 2022 |
22,307 | 4,461 | 4,461 | 4,461 | 4,461 | 4,461 | — | — | ||||||||||||||||||||||||||||||||||||||||
| Capital expenditures - 2023 |
23,534 | 4,707 | 4,707 | 4,707 | 4,707 | 4,707 | — | |||||||||||||||||||||||||||||||||||||||||
| Capital expenditures - 2024 |
24,710 | 4,942 | 4,942 | 4,942 | 4,942 | 4,942 | ||||||||||||||||||||||||||||||||||||||||||
| Capital expenditures - 2025 |
25,822 | 5,164 | 5,164 | 5,164 | 5,164 | |||||||||||||||||||||||||||||||||||||||||||
| Capital expenditures - 2026 |
26,855 | 5,371 | 5,371 | 5,371 | ||||||||||||||||||||||||||||||||||||||||||||
| Capital expenditures - 2027 |
27,795 | 5,559 | 5,559 | |||||||||||||||||||||||||||||||||||||||||||||
| Capital expenditures - Residual |
28,421 | 5,684 | ||||||||||||||||||||||||||||||||||||||||||||||
|
|
|
|
|
|
|
|
|
|
|
|
|
|
|
|
|
|
|
|
|
|
|
|
|
|||||||||||||||||||||||||
| Total |
$ | 273,635 | $ | 20,429 | $ | 7,280 | $ | 11,250 | $ | 15,459 | $ | 19,921 | $ | 21,093 | $ | 22,290 | $ | 23,484 | $ | 24,646 | $ | 25,743 | $ | 26,721 | ||||||||||||||||||||||||
|
|
|
|
|
|
|
|
|
|
|
|
|
|
|
|
|
|
|
|
|
|
|
|
|
|||||||||||||||||||||||||
| Tax Depreciation Schedule: |
||||||||||||||||||||||||||||||||||||||||||||||||
| Existing assets, net |
16,895 | |||||||||||||||||||||||||||||||||||||||||||||||
| Depreciation life - existing assets |
1 | $ | 16,895 | $ | 0 | $ | 0 | $ | 0 | $ | 0 | $ | 0 | $ | 0 | $ | 0 | $ | 0 | $ | 0 | $ | 0 | |||||||||||||||||||||||||
| Depreciation life - capital expenditure |
5 | |||||||||||||||||||||||||||||||||||||||||||||||
| Capital expenditures - 2018 |
$ | 17,669 | 5,890 | 4,712 | 3,534 | 2,356 | 1,178 | — | — | — | — | — | — | |||||||||||||||||||||||||||||||||||
| Capital expenditures - 2019 |
18,729 | 6,243 | 4,994 | 3,746 | 2,497 | 1,249 | — | — | — | — | — | |||||||||||||||||||||||||||||||||||||
| Capital expenditures - 2020 |
19,853 | 6,618 | 5,294 | 3,971 | 2,647 | 1,324 | — | — | — | — | ||||||||||||||||||||||||||||||||||||||
| Capital expenditures - 2021 |
21,044 | 7,015 | 5,612 | 4,209 | 2,806 | 1,403 | — | — | — | |||||||||||||||||||||||||||||||||||||||
| Capital expenditures - 2022 |
22,307 | 7,436 | 5,949 | 4,461 | 2,974 | 1,487 | — | — | ||||||||||||||||||||||||||||||||||||||||
| Capital expenditures - 2023 |
23,534 | 7,845 | 6,276 | 4,707 | 3,138 | 1,569 | — | |||||||||||||||||||||||||||||||||||||||||
| Capital expenditures - 2024 |
24,710 | 8,237 | 6,589 | 4,942 | 3,295 | 1,647 | ||||||||||||||||||||||||||||||||||||||||||
| Capital expenditures - 2025 |
25,822 | 8,607 | 6,886 | 5,164 | 3,443 | |||||||||||||||||||||||||||||||||||||||||||
| Capital expenditures - 2026 |
26,855 | 8,952 | 7,161 | 5,371 | ||||||||||||||||||||||||||||||||||||||||||||
| Capital expenditures - 2027 |
27,795 | 9,265 | 7,412 | |||||||||||||||||||||||||||||||||||||||||||||
| Capital expenditures - Residual |
28,421 | 9,474 | ||||||||||||||||||||||||||||||||||||||||||||||
|
|
|
|
|
|
|
|
|
|
|
|
|
|
|
|
|
|
|
|
|
|
|
|
|
|||||||||||||||||||||||||
| Total |
$ | 273,635 | $ | 22,785 | $ | 10,955 | $ | 15,146 | $ | 18,411 | $ | 20,693 | $ | 21,898 | $ | 23,103 | $ | 24,281 | $ | 25,405 | $ | 26,455 | $ | 27,347 | ||||||||||||||||||||||||
|
|
|
|
|
|
|
|
|
|
|
|
|
|
|
|
|
|
|
|
|
|
|
|
|
|||||||||||||||||||||||||
Page 8
| Fuse/Maxim Transaction Fairness Opinion | Schedule B.5 | |
| Discounted Cash Flow Method - Fuse Medical, Inc. | Valuation Date: July 19, 2018 |
Projected Tax Expenses
| Residual PV Tax Value Calculation (Intangibles) |
||||||||||||||||||||||||||||||||||||||||||||||||||||||||||||||||||||||||
| 31-Dec-18 | 31-Dec-19 | 31-Dec-20 | 31-Dec-21 | 31-Dec-22 | 31-Dec-23 | 31-Dec-24 | 31-Dec-25 | 31-Dec-26 | 31-Dec-27 | Residual | 11 | 12 | 13 | 14 | 15 | |||||||||||||||||||||||||||||||||||||||||||||||||||||||||
| Deferred Taxes |
||||||||||||||||||||||||||||||||||||||||||||||||||||||||||||||||||||||||
| Depreciable/ Amortizable |
Estimated Life |
Annual Depreciation & Amortization Expense | ||||||||||||||||||||||||||||||||||||||||||||||||||||||||||||||||||||||
| Economic / Book Basis |
||||||||||||||||||||||||||||||||||||||||||||||||||||||||||||||||||||||||
| Fixed assets |
Y | See B.4 | $ | 20,429 | $ | 7,280 | $ | 11,250 | $ | 15,459 | $ | 19,921 | $ | 21,093 | $ | 22,290 | $ | 23,484 | $ | 24,646 | $ | 25,743 | $ | 26,721 | ||||||||||||||||||||||||||||||||||||||||||||||||
| Intangible assets |
Y | 10 | — | — | — | — | — | — | — | — | — | — | — | $ | 0 | $ | 0 | $ | 0 | $ | 0 | $ | 0 | |||||||||||||||||||||||||||||||||||||||||||||||||
| Goodwill |
N | NA | NA | NA | NA | NA | NA | NA | NA | NA | NA | NA | NA | NA | NA | NA | NA | NA | ||||||||||||||||||||||||||||||||||||||||||||||||||||||
|
|
|
|
|
|
|
|
|
|
|
|
|
|
|
|
|
|
|
|
|
|
|
|
|
|
|
|
|
|
|
|
|
|||||||||||||||||||||||||||||||||||||||||
| Total Economic / Book Basis |
$ | 20,429 | $ | 7,280 | $ | 11,250 | $ | 15,459 | $ | 19,921 | $ | 21,093 | $ | 22,290 | $ | 23,484 | $ | 24,646 | $ | 25,743 | $ | 26,721 | $ | 0 | $ | 0 | $ | 0 | $ | 0 | $ | 0 | ||||||||||||||||||||||||||||||||||||||||
| Income Tax Basis |
||||||||||||||||||||||||||||||||||||||||||||||||||||||||||||||||||||||||
| Fixed assets |
Y | See B.4 | $ | 22,785 | $ | 10,955 | $ | 15,146 | $ | 18,411 | $ | 20,693 | $ | 21,898 | $ | 23,103 | $ | 24,281 | $ | 25,405 | $ | 26,455 | $ | 26,721 | ||||||||||||||||||||||||||||||||||||||||||||||||
| Intangible assets |
Y | 15 | — | — | — | — | — | — | — | — | — | — | NA | $ | 0 | $ | 0 | $ | 0 | $ | 0 | $ | 0 | |||||||||||||||||||||||||||||||||||||||||||||||||
| Goodwill |
Y | 15 | 54,710 | 54,710 | 54,710 | 54,710 | 54,710 | 54,710 | 54,710 | 54,710 | 54,710 | 54,710 | NA | 54,710 | 54,710 | 54,710 | 54,710 | 54,710 | ||||||||||||||||||||||||||||||||||||||||||||||||||||||
|
|
|
|
|
|
|
|
|
|
|
|
|
|
|
|
|
|
|
|
|
|
|
|
|
|
|
|
|
|
|
|
|
|||||||||||||||||||||||||||||||||||||||||
| Total Tax Basis |
$ | 77,495 | $ | 65,665 | $ | 69,856 | $ | 73,121 | $ | 75,403 | $ | 76,608 | $ | 77,813 | $ | 78,991 | $ | 80,115 | $ | 81,165 | $ | 26,721 | $ | 54,710 | $ | 54,710 | $ | 54,710 | $ | 54,710 | $ | 54,710 | ||||||||||||||||||||||||||||||||||||||||
| Increase / (Decrease) in deferred tax liability @ |
21.0 | % | $ | 11,984 | $ | 12,261 | $ | 12,307 | $ | 12,109 | $ | 11,651 | $ | 11,658 | $ | 11,660 | $ | 11,657 | $ | 11,648 | $ | 11,638 | $ | 0 | $ | 11,489 | $ | 11,489 | $ | 11,489 | $ | 11,489 | $ | 11,489 | ||||||||||||||||||||||||||||||||||||||
| (Increase) / Decrease in deferred tax assets @ |
21.0 | % | — | — | — | — | — | — | — | — | — | — | — | NA | NA | NA | NA | NA | ||||||||||||||||||||||||||||||||||||||||||||||||||||||
|
|
|
|
|
|
|
|
|
|
|
|
|
|
|
|
|
|
|
|
|
|
|
|
|
|
|
|
|
|
|
|
|
|||||||||||||||||||||||||||||||||||||||||
| Deferred tax expense |
$ | 11,984 | $ | 12,261 | $ | 12,307 | $ | 12,109 | $ | 11,651 | $ | 11,658 | $ | 11,660 | $ | 11,657 | $ | 11,648 | $ | 11,638 | $ | 0 | $ | 11,489 | $ | 11,489 | $ | 11,489 | $ | 11,489 | $ | 11,489 | ||||||||||||||||||||||||||||||||||||||||
| Total deferred tax liability (asset), net |
— | 11,984 | 24,245 | 36,552 | 48,661 | 60,312 | 71,970 | 83,630 | 95,287 | 106,935 | 118,574 | 118,574 | ||||||||||||||||||||||||||||||||||||||||||||||||||||||||||||
|
|
|
|
|
|
|
|
|
|
|
|
|
|
|
|
|
|
|
|
|
|
|
|
|
|
|
|
|
|
|
|
|
|||||||||||||||||||||||||||||||||||||||||
| Present value factor @ |
12.8 | % | 0.3017 | 0.2674 | 0.2371 | 0.2102 | 0.1863 | |||||||||||||||||||||||||||||||||||||||||||||||||||||||||||||||||
| Present value |
$ | 3,466 | $ | 3,073 | $ | 2,724 | $ | 2,415 | $ | 2,141 | ||||||||||||||||||||||||||||||||||||||||||||||||||||||||||||||
|
|
|
|
|
|
|
|
|
|
|
|||||||||||||||||||||||||||||||||||||||||||||||||||||||||||||||
| Income Taxes and Net Operating Losses |
$ | 13,818 | |
Total PV of remaining tax shield |
| |||||||||||||||||||||||||||||||||||||||||||||||||||||||||||||||||||
| Pretax income |
2,246,894 | 2,366,411 | 3,762,918 | 4,985,314 | 5,987,675 | 6,316,920 | 6,632,625 | 6,930,902 | 7,207,915 | 7,459,957 | 7,627,408 | |||||||||||||||||||||||||||||||||||||||||||||||||||||||||||||
| Tax depreciation adjustment |
57,066 | 58,385 | 58,606 | 57,661 | 55,483 | 55,514 | 55,524 | 55,507 | 55,469 | 55,421 | — | |||||||||||||||||||||||||||||||||||||||||||||||||||||||||||||
|
|
|
|
|
|
|
|
|
|
|
|
|
|
|
|
|
|
|
|
|
|
|
|||||||||||||||||||||||||||||||||||||||||||||||||||
| Earnings before taxes and NOL utilization |
2,189,828 | 2,308,026 | 3,704,313 | 4,927,653 | 5,932,193 | 6,261,406 | 6,577,101 | 6,875,394 | 7,152,446 | 7,404,536 | 7,627,408 | |||||||||||||||||||||||||||||||||||||||||||||||||||||||||||||
| Net operating loss utilization |
— | — | — | — | — | — | — | — | — | — | — | |||||||||||||||||||||||||||||||||||||||||||||||||||||||||||||
|
|
|
|
|
|
|
|
|
|
|
|
|
|
|
|
|
|
|
|
|
|
|
|||||||||||||||||||||||||||||||||||||||||||||||||||
| Earnings before taxes |
2,189,828 | 2,308,026 | 3,704,313 | 4,927,653 | 5,932,193 | 6,261,406 | 6,577,101 | 6,875,394 | 7,152,446 | 7,404,536 | 7,627,408 | |||||||||||||||||||||||||||||||||||||||||||||||||||||||||||||
| Income taxes @ |
21.0 | % | 459,864 | 484,685 | 777,906 | 1,034,807 | 1,245,760 | 1,314,895 | 1,381,191 | 1,443,833 | 1,502,014 | 1,554,953 | 1,601,756 | |||||||||||||||||||||||||||||||||||||||||||||||||||||||||||
| Beginning net operating losses |
$ | 0 | $ | 0 | $ | 0 | $ | 0 | $ | 0 | $ | 0 | $ | 0 | $ | 0 | $ | 0 | $ | 0 | $ | 0 | ||||||||||||||||||||||||||||||||||||||||||||||||||
| Additions to / (utilization of) net operating losses |
— | — | — | — | — | — | — | — | — | — | — | |||||||||||||||||||||||||||||||||||||||||||||||||||||||||||||
|
|
|
|
|
|
|
|
|
|
|
|
|
|
|
|
|
|
|
|
|
|
|
|||||||||||||||||||||||||||||||||||||||||||||||||||
| Ending net operating losses |
$ | 0 | $ | 0 | $ | 0 | $ | 0 | $ | 0 | $ | 0 | $ | 0 | $ | 0 | $ | 0 | $ | 0 | $ | 0 | ||||||||||||||||||||||||||||||||||||||||||||||||||
Page 9
| Fuse/Maxim Transaction Fairness Opinion | Schedule B.6 | |
| Discounted Cash Flow Method - Fuse Medical, Inc. | Valuation Date: July 19, 2018 |
| Weighted Average Cost of Capital | (Dollar figures in millions, except for per share figures) |
| Company Name | Ticker Symbol |
Observed Beta |
ValDate Shares Out |
ValDate Share Price |
ValDate Market Cap |
ValDate Total Debt, Pref. & Min Int. |
Avg. Debt / Equity |
Debt / Total Cap |
Effective Tax Rate |
Unlevered Beta |
||||||||||||||||||||||||||||||
| Zimmer Biomet Holdings, Inc. |
ZBH | 1.16 | 203 | $ | 112.24 | $ | 22,815 | $ | 11,113 | 23.1 | % | 18.8 | % | 23.6 | % | 0.99 | ||||||||||||||||||||||||
| Orthofix International N.V. |
OFIX | 0.83 | 19 | $ | 59.19 | $ | 1,116 | $ | 0 | 20.2 | % | 16.8 | % | 48.6 | % | 0.75 | ||||||||||||||||||||||||
| Globus Medical, Inc. |
GMED | 0.69 | 97 | $ | 52.61 | $ | 5,128 | $ | 0 | 0.0 | % | 0.0 | % | 28.6 | % | 0.69 | ||||||||||||||||||||||||
| NuVasive, Inc. |
NUVA | 0.87 | 51 | $ | 53.98 | $ | 2,767 | $ | 643 | 23.6 | % | 19.1 | % | 31.7 | % | 0.75 | ||||||||||||||||||||||||
| Exacompta Clairefontaine S.A. |
EXAC | 0.89 | 1 | $ | 126.00 | $ | 143 | $ | 146 | 164.7 | % | 62.2 | % | 29.9 | % | 0.41 | ||||||||||||||||||||||||
| Cardinal Health, Inc. |
CAH | 0.82 | 311 | $ | 49.00 | $ | 15,224 | $ | 9,591 | 26.4 | % | 20.9 | % | 40.0 | % | 0.71 | ||||||||||||||||||||||||
| Medtronic plc |
MDT | 0.98 | 1,352 | $ | 88.42 | $ | 119,518 | $ | 25,879 | 22.9 | % | 18.7 | % | 20.8 | % | 0.83 | ||||||||||||||||||||||||
| Stryker Corporation |
SYK | 0.91 | 374 | $ | 172.86 | $ | 64,600 | $ | 7,913 | 8.5 | % | 7.8 | % | 28.5 | % | 0.85 | ||||||||||||||||||||||||
| High | 164.7 | % | 62.2 | % | 48.6 | % | 0.99 | |||||||||||||||||||||||||||||||||
| Mean | 20.7 | % | 11.7 | % | 18.0 | % | 0.75 | |||||||||||||||||||||||||||||||||
| Median | 4.2 | % | 3.9 | % | 22.2 | % | 0.75 | |||||||||||||||||||||||||||||||||
| CV | 2.08 | 1.46 | 0.97 | 0.22 | ||||||||||||||||||||||||||||||||||||
| Capital Asset Pricing Model (CAPM) Inputs |
| |||
| (1) Effective tax rate |
21.0 | % | ||
| (2) Risk-free rate [Rf] |
2.9 | % | ||
| (3) Equity Risk Premium [ERP] |
6.0 | % | ||
| (4) Unlevered beta |
0.75 | |||
| (5) Target debt/equity |
4.2 | % | ||
| (6) Pretax cost of debt |
4.7 | % | ||
| (7) Small Stock Risk Premium [SSRP] |
5.6 | % | ||
| Capital Asset Pricing Model (CAPM) Calculations |
| |||
| Relevered beta |
0.77 | |||
| Ke = Rf + (Levered Beta x ERP) + SSRP | ||||
| CAPM Cost of Equity ( k e ) |
13.2 | % | ||
| After-tax cost of debt |
3.7 | % | ||
| Debt/capital ratio |
4.1 | % | ||
| Weighted Average Cost of Capital (WACC) |
12.8 | % | ||
Notes:
| (1) | Reflects a C Corporation status for valuation purposes |
| (2) | 20-Year United States Treasury rate as of July 19, 2018 |
| (3) | Duff & Phelps 2016 Valuation Handbook, long-term supply side ERP |
| (4) | Unlevered and relevered using Hamada method |
| (5) | Median debt-to-equity of the guideline companies |
| (6) | Yield on Moody’s Baa-rated corporate bonds as of July 19, 2018 |
| (7) | Small stock risk premium 10th decile (Source: Duff & Phelps 2016 Valuation Handbook) 6 |
Page 10
| Fuse/Maxim Transaction Fairness Opinion | Schedule B.7 | |
| Discounted Cash Flow Method - Fuse Medical, Inc. | Valuation Date: July 19, 2018 |
Synthesis of Net Cash Flow
| For the Projected Year Ended: | ||||||||||||||||||||||||||||||||||||||||||||
| 31-Dec-18 | 31-Dec-19 | 31-Dec-20 | 31-Dec-21 | 31-Dec-22 | 31-Dec-23 | 31-Dec-24 | 31-Dec-25 | 31-Dec-26 | 31-Dec-27 | Residual | ||||||||||||||||||||||||||||||||||
| Sources of Cash Flow: |
||||||||||||||||||||||||||||||||||||||||||||
| Net income |
1,775,046 | 1,869,465 | 2,972,705 | 3,938,398 | 4,730,263 | 4,990,367 | 5,239,773 | 5,475,412 | 5,694,253 | 5,893,366 | 6,025,652 | |||||||||||||||||||||||||||||||||
| Depreciation |
20,429 | 7,280 | 11,250 | 15,459 | 19,921 | 21,093 | 22,290 | 23,484 | 24,646 | 25,743 | 26,721 | |||||||||||||||||||||||||||||||||
| Increase in deferred taxes |
11,984 | 12,261 | 12,307 | 12,109 | 11,651 | 11,658 | 11,660 | 11,657 | 11,648 | 11,638 | — | |||||||||||||||||||||||||||||||||
|
|
|
|
|
|
|
|
|
|
|
|
|
|
|
|
|
|
|
|
|
|
|
|||||||||||||||||||||||
| Total Sources of Cash Flow |
1,807,459 | 1,889,005 | 2,996,263 | 3,965,966 | 4,761,835 | 5,023,118 | 5,273,723 | 5,510,553 | 5,730,547 | 5,930,748 | 6,052,373 | |||||||||||||||||||||||||||||||||
| Uses of Cash Flow: |
||||||||||||||||||||||||||||||||||||||||||||
| Additions to working capital |
(955,099 | ) | 506,701 | 470,962 | 455,131 | 693,498 | 813,272 | 780,001 | 737,101 | 684,685 | 623,064 | 414,560 | ||||||||||||||||||||||||||||||||
| Capital expenditures |
17,669 | 18,729 | 19,853 | 21,044 | 22,307 | 23,534 | 24,710 | 25,822 | 26,855 | 27,795 | 28,421 | |||||||||||||||||||||||||||||||||
| Net cash flow |
2,744,888 | 1,363,575 | 2,505,448 | 3,489,791 | 4,046,030 | 4,186,313 | 4,469,011 | 4,747,629 | 5,019,007 | 5,279,889 | 5,609,393 | |||||||||||||||||||||||||||||||||
|
|
|
|
|
|
|
|
|
|
|
|
|
|
|
|
|
|
|
|
|
|
|
|||||||||||||||||||||||
| Total Uses of Cash Flow |
1,807,459 | 1,889,005 | 2,996,263 | 3,965,966 | 4,761,835 | 5,023,118 | 5,273,723 | 5,510,553 | 5,730,547 | 5,930,748 | 6,052,373 | |||||||||||||||||||||||||||||||||
| Net Cash Flow |
$ | 2,744,888 | $ | 1,363,575 | $ | 2,505,448 | $ | 3,489,791 | $ | 4,046,030 | $ | 4,186,313 | $ | 4,469,011 | $ | 4,747,629 | $ | 5,019,007 | $ | 5,279,889 | $ | 5,609,393 | ||||||||||||||||||||||
| Period (Mid—Period) |
0.23 | 0.95 | 1.95 | 2.95 | 3.95 | 4.95 | 5.95 | 6.95 | 7.95 | 8.95 | ||||||||||||||||||||||||||||||||||
| PV Factor @ WACC = 12.8% |
0.9733 | 0.8919 | 0.7907 | 0.7010 | 0.6214 | 0.5509 | 0.4884 | 0.4330 | 0.3838 | 0.3403 | ||||||||||||||||||||||||||||||||||
| Partial Period Factor (January 1, 2018—July 19, 2018) |
0.45 | |||||||||||||||||||||||||||||||||||||||||||
| Present Value (PV) Net Cash Flow |
$ | 1,202,175 | $ | 1,216,145 | $ | 1,980,992 | $ | 2,446,175 | $ | 2,514,248 | $ | 2,306,225 | $ | 2,182,591 | $ | 2,055,552 | $ | 1,926,462 | $ | 1,796,629 | ||||||||||||||||||||||||
| PV net cash flow |
$ | 19,627,194 | ||
| PV residual value |
18,092,431 | |||
| PV remaining tax |
13,818 | |||
|
|
|
|||
| Enterprise Value |
$ | 37,733,443 | ||
|
|
|
|||
| Less: total debt |
(2,823,783 | ) | ||
|
|
|
|||
| Value of Equity |
$ | 34,909,660 | ||
|
|
|
| Residual Value - Gordon Growth Model | ||||
| Residual net cash flow : |
$ | 5,609,393 | ||
| Residual discount rate (k) : |
12.8 | % | ||
| Residual growth rate (g) : |
2.3 | % | ||
|
|
|
|||
| x Gordon multiple [ 1 / (k-g) ] : |
9.5x | |||
|
|
|
|||
| Residual value : |
$ | 53,169,598 | ||
| x PV factor : |
0.3403 | |||
|
|
|
|||
| PV residual value : |
$ | 18,092,431 | ||
Page 11
| Fuse/Maxim Transaction Fairness Opinion | Schedule C.1 | |
| Guideline Public Company Method - Fuse Medical, Inc. | Valuation Date: July 19, 2018 |
| Determination of Relevant Multiples | (Dollar figures in millions, except for per share figures) |
| Valuation Date | ||||||||||||||||||||||||||||||||||||||||||
| 6/30/17 | Ticker: | ZBH | OFIX | GMED | NUVA | EXAC | CAH | MDT | SYK | |||||||||||||||||||||||||||||||||
| Company: | Zimmer Biomet Holdings, Inc. |
Orthofix International N.V. |
Globus Medical, Inc. |
NuVasive, Inc. |
Exacompta Clairefontain e S.A. |
Cardinal Health, Inc. |
Medtronic plc |
Stryker Corporation |
||||||||||||||||||||||||||||||||||
| LTM Operating Performance | Mean | Median | ||||||||||||||||||||||||||||||||||||||||
| Revenue (S) |
$ | 7,869 | $ | 440 | $ | 655 | $ | 1,041 | $ | 718 | $ | 134,426 | $ | 29,953 | $ | 12,730 | ||||||||||||||||||||||||||
| Gross profit |
$ | 5,692 | $ | 345 | $ | 501 | $ | 760 | $ | 382 | $ | 7,069 | $ | 20,983 | $ | 8,432 | ||||||||||||||||||||||||||
| % margin |
72.3 | % | 78.5 | % | 76.6 | % | 73.0 | % | 53.2 | % | 5.3 | % | 70.1 | % | 66.2 | % | 61.9 | % | 71.2 | % | ||||||||||||||||||||||
| Earnings before interest, taxes, depreciation & amortization (EBITDA) |
$ | 2,774 | $ | 58 | $ | 211 | $ | 226 | $ | 63 | $ | 3,222 | $ | 9,499 | $ | 3,476 | ||||||||||||||||||||||||||
| % margin |
35.3 | % | 13.2 | % | 32.2 | % | 21.7 | % | 8.8 | % | 2.4 | % | 31.7 | % | 27.3 | % | 21.6 | % | 24.5 | % | ||||||||||||||||||||||
| Earnings before interest & taxes (EBIT) |
$ | 1,716 | $ | 37 | $ | 171 | $ | 112 | $ | 29 | $ | 2,251 | $ | 6,855 | $ | 2,808 | ||||||||||||||||||||||||||
| % margin |
21.8 | % | 8.4 | % | 26.2 | % | 10.8 | % | 4.0 | % | 1.7 | % | 22.9 | % | 22.1 | % | 14.7 | % | 16.3 | % | ||||||||||||||||||||||
| Net income to common shareholders |
$ | 1,689 | $ | 14 | $ | 118 | $ | 43 | $ | 15 | $ | 1,696 | $ | 3,104 | $ | 1,019 | ||||||||||||||||||||||||||
| % margin |
21.5 | % | 3.2 | % | 18.1 | % | 4.2 | % | 2.2 | % | 1.3 | % | 10.4 | % | 8.0 | % | 8.6 | % | 6.1 | % | ||||||||||||||||||||||
| Calculation of Equity and Capital Value | ||||||||||||||||||||||||||||||||||||||||||
| Share price as of |
6/30/2017 | $ | 112.24 | $ | 59.19 | $ | 52.61 | $ | 53.98 | $ | 126.00 | $ | 49.00 | $ | 88.42 | $ | 172.86 | |||||||||||||||||||||||||
| Shares out (000s) |
203 | 19 | 97 | 51 | 1 | 311 | 1,352 | 374 | ||||||||||||||||||||||||||||||||||
|
|
|
|
|
|
|
|
|
|
|
|
|
|
|
|
|
|||||||||||||||||||||||||||
| Market capitalization |
22,815 | 1,116 | 5,128 | 2,767 | 143 | 15,224 | 119,518 | 64,600 | ||||||||||||||||||||||||||||||||||
| Less: cash & equivalents |
1,765 | 93 | 369 | 74 | 164 | 2,175 | 11,227 | 2,455 | ||||||||||||||||||||||||||||||||||
|
|
|
|
|
|
|
|
|
|
|
|
|
|
|
|
|
|||||||||||||||||||||||||||
| Equity value less cash (P) |
21,050 | 1,023 | 4,759 | 2,693 | (21 | ) | 13,049 | 108,291 | 62,145 | |||||||||||||||||||||||||||||||||
| Minority interest |
1 | — | — | — | — | 13 | 102 | 9 | ||||||||||||||||||||||||||||||||||
| Preferred stock |
— | — | — | — | — | — | — | — | ||||||||||||||||||||||||||||||||||
| Total debt |
11,112 | — | — | 643 | 146 | 9,578 | 25,777 | 7,904 | ||||||||||||||||||||||||||||||||||
|
|
|
|
|
|
|
|
|
|
|
|
|
|
|
|
|
|||||||||||||||||||||||||||
| Enterprise value (EV) |
32,163 | 1,023 | 4,759 | 3,336 | 125 | 22,640 | 134,170 | 70,058 | ||||||||||||||||||||||||||||||||||
| Operating Multiples | Mean | Median | ||||||||||||||||||||||||||||||||||||||
| EV/S |
4.1 | 2.3 | 7.3 | 3.2 | 0.2 | 0.2 | 4.5 | 5.5 | 3.4 | 3.6 | ||||||||||||||||||||||||||||||
| EV/EBITDA |
11.6 | 17.7 | 22.6 | 14.8 | 2.0 | 7.0 | 14.1 | 20.2 | 13.7 | 14.4 | ||||||||||||||||||||||||||||||
| EV/EBIT |
18.7 | 27.8 | 27.8 | 29.7 | 4.3 | 10.1 | 19.6 | 24.9 | 20.4 | 22.3 | ||||||||||||||||||||||||||||||
Page 12
| Fuse/Maxim Transaction Fairness Opinion | Schedule C.2 | |
| Guideline Public Company Method - Fuse Medical, Inc. | Valuation Date: July 19, 2018 |
| Summary and Application of Multiples |
| Observed Multiples | ZBH | OFIX | GMED | NUVA | EXAC | CAH | MDT | SYK | ||||||||||||||||||||||||
| EV/S |
4.1 | 2.3 | 7.3 | 3.2 | 0.2 | 0.2 | 4.5 | 5.5 | ||||||||||||||||||||||||
| EV/EBITDA |
11.6 | 17.7 | 22.6 | 14.8 | 2.0 | 7.0 | 14.1 | 20.2 | ||||||||||||||||||||||||
| EV/EBIT |
18.7 | 27.8 | 27.8 | 29.7 | 4.3 | 10.1 | 19.6 | 24.9 | ||||||||||||||||||||||||
| Summary Statistics | Low | 25th Percentile |
Mean | Median | 75th Percentile |
High | CV | |||||||||||||||||||||||||
| EV/S |
0.2 | 1.8 | 3.4 | 3.6 | 4.7 | 7.3 | 0.7 | |||||||||||||||||||||||||
| EV/EBITDA |
2.0 | 10.5 | 13.7 | 14.4 | 18.3 | 22.6 | 0.5 | |||||||||||||||||||||||||
| EV/EBIT |
4.3 | 16.6 | 20.4 | 22.3 | 27.8 | 29.7 | 0.4 | |||||||||||||||||||||||||
| Select Income Statement |
Projected Year 2019 |
Multiples |
75th Percentile |
Median | 25th Percentile |
Implied Values |
75th Percentile |
Median | 25th Percentile |
|||||||||||||||||||||||
| Revenue (S) |
$ | 29,671,137 | EV/S | 4.7 | 3.6 | 1.8 | EV/S |
$ | 140,503,343 | $ | 108,175,442 | $ | 53,072,717 | |||||||||||||||||||
| Earnings before interest, taxes, |
EV/EBITDA | 18.3 | 14.4 | 10.5 | EV/EBITDA |
$ | 43,421,254 | $ | 34,275,835 | $ | 24,810,057 | |||||||||||||||||||||
| depreciation & amortization (EBITDA) |
$ | 2,373,691 | EV/EBIT | 27.8 | 22.3 | 16.6 | EV/EBIT |
$ | 65,781,797 | $ | 52,678,569 | $ | 39,224,789 | |||||||||||||||||||
| Earnings before interest & taxes (EBIT) |
$ | 2,366,411 | ||||||||||||||||||||||||||||||
| Unadjusted Enterprise Value |
$ | 38,848,545 | ||||||||||||||||||||||||||||||
| Discount Factor Adjustment @ |
12.8 | % | 0.8398 | |||||||||||||||||||||||||||||
|
|
|
|||||||||||||||||||||||||||||||
| Select Balance Sheet Items |
3/31/2018 | Adjusted Enterprise Value |
$ | 32,623,200 | ||||||||||||||||||||||||||||
| Cash and equivalents |
$ | 797,803 | Plus: Cash |
$ | 797,803 | |||||||||||||||||||||||||||
| Total debt |
$ | 2,823,783 | Less: Total Debt |
($ | 2,823,783 | ) | ||||||||||||||||||||||||||
|
|
|
|||||||||||||||||||||||||||||||
| Implied Equity Value—Minority, Marketable |
|
$ | 30,597,220 | |||||||||||||||||||||||||||||
| Control Premium @ |
28.1 | % | $ | 8,602,072 | ||||||||||||||||||||||||||||
|
|
|
|||||||||||||||||||||||||||||||
| Concluded Equity Value—Control |
$ | 39,199,292 | ||||||||||||||||||||||||||||||
Page 13
| Fuse/Maxim Transaction Fairness Opinion | Schedule D | |
| Merger & Acquisition Method - Fuse Medical, Inc. | Valuation Date: July 19, 2018 | |
| Transaction Approach |
| Industry Transactions - See Criteria Below |
Transaction Multiples | |||||||||||||||||||||||||||
| Target Revenue | Target EBITDA | Target EBITDA | Enterprise Value | |||||||||||||||||||||||||
| Date |
Target |
($mm) | ($mm) | Margin (%) | ($mm) | Acquirer |
EV/S | EV/EBITDA | ||||||||||||||||||||
| 12/4/2017 |
Exactech, Inc. | 264.4 | 43.0 | 16.3 | % | 812.8 | — | 3.1 | 18.9 | |||||||||||||||||||
| 10/23/2017 |
Exactech, Inc. | 264.4 | 43.0 | 16.3 | % | 709.6 | TPG Capital, L.P. | 2.7 | 16.5 | |||||||||||||||||||
| 9/27/2017 |
Bird and Cronin, Inc. | 24.0 | — | — | 15.5 | Dynatronics Corporation | 0.6 | — | ||||||||||||||||||||
| 7/20/2017 |
WPI Holdings Inc. | 50.0 | — | — | 120.5 | Convatec Group Plc | 2.4 | — | ||||||||||||||||||||
| 5/1/2017 |
Span-America Medical Systems Inc | 61.8 | 7.3 | 11.8 | % | 73.8 | Savaria Corp | 1.2 | 10.1 | |||||||||||||||||||
| 11/20/2015 |
Liberator Medical Holdings Inc | 81.6 | 24.1 | 29.6 | % | 174.6 | CR Bard Inc | 2.1 | 7.2 | |||||||||||||||||||
| 8/14/2015 |
HASCO Medical Inc | 93.5 | 5.2 | 5.6 | % | 48.8 | WMK Inc | 0.5 | 9.3 | |||||||||||||||||||
| 8/4/2014 |
Symmetry Medical Inc | 397.3 | 51.1 | 12.9 | % | 436.3 | Tecomet Inc | 1.1 | 8.5 | |||||||||||||||||||
| 6/25/2014 |
Medical Action Industries Inc | 287.8 | 15.2 | 5.3 | % | 279.8 | Owens & Minor Inc | 1.0 | 18.4 | |||||||||||||||||||
| 4/24/2014 |
Biomet Inc | 3,162.8 | 813.2 | 25.7 | % | 18,970.5 | Zimmer Holdings Inc | 6.0 | 23.3 | |||||||||||||||||||
| 2/17/2014 |
Chindex International Inc | 187.7 | 13.3 | 7.1 | % | 446.7 | Investor Group | 2.4 | 33.5 | |||||||||||||||||||
| 11/14/2013 |
Kimberly-Clark Health Care Inc | 1,664.0 | 250.6 | 15.1 | % | 1,742.2 | Shareholders | 1.0 | 7.0 | |||||||||||||||||||
| 6/12/2013 |
Pioneer Surgical Technology Inc | 88.2 | 7.0 | 7.9 | % | 137.6 | RTI Biologics Inc | 1.6 | 19.8 | |||||||||||||||||||
Page 14
| Fuse/Maxim Transaction Fairness Opinion | Schedule E | |
| Equity Valuation Summary - Fuse Medical, Inc. Synthesis of Equity Value |
Valuation Date: July 19, 2018 |
| Summary - Fuse Post -Transaction Equity Value | ||||||||||||
| Valuation Method |
Indicated Value |
Weight | Reference | |||||||||
| Income Approach |
||||||||||||
| Discounted Cash Flow Method |
$ | 34,909,660 | 50.0 | % | Schedule B.7 | |||||||
| Market Approach |
||||||||||||
| Guideline Public Company Method |
$ | 39,199,292 | 25.0 | % | Schedule C.2 | |||||||
| Merger and Acquisition Method |
$ | 36,502,610 | 25.0 | % | Schedule D | |||||||
|
|
|
|
|
|||||||||
| Equity Value (Rounded) - Control, Marketable |
$ | 36,400,000 | ||||||||||
Page 15
| Fuse/Maxim Transaction Fairness Opinion | Schedule F.1 | |
| Financial Statement Analysis - Maxim Surgical | Valuation Date: July 19, 2018 |
Historical Income Statements
| For the Year Ended: | ||||||||||||||||||||||||||||||||||||||||
| 31-Dec-14 | 31-Dec-15 | 31-Dec-16 | 31-Dec-17 | 31-May-18 | ||||||||||||||||||||||||||||||||||||
| Actual | % | Actual | % | Actual | % | Actual | % | TTM | % | |||||||||||||||||||||||||||||||
| Revenue |
$ | 1,330,992 | 100.0 | % | $ | 1,034,170 | 100.0 | % | $ | 1,091,760 | 100.0 | % | $ | 1,200,089 | 100.0 | % | $ | 1,228,938 | 100.0 | % | ||||||||||||||||||||
| Cost of sales (COS) |
628,082 | 47.2 | % | 526,085 | 50.9 | % | 638,691 | 58.5 | % | 676,655 | 56.4 | % | 733,135 | 59.7 | % | |||||||||||||||||||||||||
|
|
|
|
|
|
|
|
|
|
|
|||||||||||||||||||||||||||||||
| Gross Profit |
702,910 | 52.8 | % | 508,085 | 49.1 | % | 453,069 | 41.5 | % | 523,433 | 43.6 | % | 495,803 | 40.3 | % | |||||||||||||||||||||||||
| Selling, general & administrative (SG&A) expenses |
305,354 | 22.9 | % | 241,478 | 23.3 | % | 196,890 | 18.0 | % | 182,247 | 15.2 | % | 271,860 | 22.1 | % | |||||||||||||||||||||||||
|
|
|
|
|
|
|
|
|
|
|
|||||||||||||||||||||||||||||||
| Earnings before interest, taxes, depreciation & amortization (EBITDA) |
397,557 | 29.9 | % | 266,607 | 25.8 | % | 256,178 | 23.5 | % | 341,186 | 28.4 | % | 223,942 | 18.2 | % | |||||||||||||||||||||||||
| Depreciation expense |
— | 0.0 | % | — | 0.0 | % | — | 0.0 | % | — | 0.0 | % | — | 0.0 | % | |||||||||||||||||||||||||
|
|
|
|
|
|
|
|
|
|
|
|||||||||||||||||||||||||||||||
| Earnings before interest & taxes (EBIT) |
397,557 | 29.9 | % | 266,607 | 25.8 | % | 256,178 | 23.5 | % | 341,186 | 28.4 | % | 223,942 | 18.2 | % | |||||||||||||||||||||||||
| Interest (expense) |
— | 0.0 | % | — | 0.0 | % | — | 0.0 | % | — | 0.0 | % | — | 0.0 | % | |||||||||||||||||||||||||
|
|
|
|
|
|
|
|
|
|
|
|||||||||||||||||||||||||||||||
| Net Income |
$ | 397,557 | 29.9 | % | $ | 266,607 | 25.8 | % | $ | 256,178 | 23.5 | % | $ | 341,186 | 28.4 | % | $ | 223,942 | 18.2 | % | ||||||||||||||||||||
|
|
|
|
|
|
|
|
|
|
|
|||||||||||||||||||||||||||||||
| Annualized Growth Rates |
||||||||||||||||||||||||||||||||||||||||
| Revenue |
NA | -22.3 | % | 5.6 | % | 9.9 | % | 5.9 | % | |||||||||||||||||||||||||||||||
| Gross Profit |
NA | -27.7 | % | -10.8 | % | 15.5 | % | -12.3 | % | |||||||||||||||||||||||||||||||
| EBITDA |
NA | -32.9 | % | -3.9 | % | 33.2 | % | -63.9 | % | |||||||||||||||||||||||||||||||
| EBIT |
NA | -32.9 | % | -3.9 | % | 33.2 | % | -63.9 | % | |||||||||||||||||||||||||||||||
| Net Income |
NA | -32.9 | % | -3.9 | % | 33.2 | % | -63.9 | % | |||||||||||||||||||||||||||||||
Page 16
| Fuse/Maxim Transaction Fairness Opinion | Schedule F.2 | |
| Financial Statement Analysis - Maxim Surgical | Valuation Date: July 19, 2018 |
Historical Balance Sheets
| As of: | ||||||||||||||||||||||||||||||||||||||||
| 31-Dec-14 | 31-Dec-15 | 31-Dec-16 | 31-Dec-17 | 31-May-18 | ||||||||||||||||||||||||||||||||||||
| Actual | % | Actual | % | Actual | % | Actual | % | TTM | % | |||||||||||||||||||||||||||||||
| Current Assets |
||||||||||||||||||||||||||||||||||||||||
| Cash & cash equivalents |
$ | 40,426 | 12.5 | % | $ | 11,556 | 2.6 | % | $ | 35,942 | 9.1 | % | $ | 97,154 | 13.8 | % | $ | 126,174 | 20.0 | % | ||||||||||||||||||||
| Accounts receivable, net |
143,378 | 44.2 | % | 266,252 | 59.2 | % | 183,182 | 46.5 | % | 290,716 | 41.4 | % | 234,238 | 37.2 | % | |||||||||||||||||||||||||
| Inventory |
133,311 | 41.1 | % | 159,069 | 35.3 | % | 183,587 | 46.6 | % | 315,133 | 44.8 | % | 278,367 | 44.2 | % | |||||||||||||||||||||||||
| Prepaid expenses and other CA |
7,112 | 2.2 | % | 13,123 | 2.9 | % | (8,542 | ) | -2.2 | % | (347 | ) | 0.0 | % | (8,970 | ) | -1.4 | % | ||||||||||||||||||||||
|
|
|
|
|
|
|
|
|
|
|
|||||||||||||||||||||||||||||||
| Total Current Assets |
324,227 | 100.0 | % | 450,000 | 100.0 | % | 394,168 | 100.0 | % | 702,655 | 100.0 | % | 629,810 | 100.0 | % | |||||||||||||||||||||||||
| Fixed assets, net |
— | 0.0 | % | — | 0.0 | % | — | 0.0 | % | — | 0.0 | % | — | 0.0 | % | |||||||||||||||||||||||||
|
|
|
|
|
|
|
|
|
|
|
|||||||||||||||||||||||||||||||
| Total Assets |
$ | 324,227 | 100.0 | % | $ | 450,000 | 100.0 | % | $ | 394,168 | 100.0 | % | $ | 702,655 | 100.0 | % | $ | 629,810 | 100.0 | % | ||||||||||||||||||||
|
|
|
|
|
|
|
|
|
|
|
|||||||||||||||||||||||||||||||
| Current Liabilities |
||||||||||||||||||||||||||||||||||||||||
| Accounts payable |
$ | 70,221 | 21.7 | % | $ | 168,187 | 37.4 | % | $ | 117,367 | 29.8 | % | $ | 177,655 | 25.3 | % | $ | 79,892 | 12.7 | % | ||||||||||||||||||||
| Accrued expenses |
15,658 | 4.8 | % | 76,858 | 17.1 | % | 15,668 | 4.0 | % | 28,778 | 4.1 | % | 28,778 | 4.6 | % | |||||||||||||||||||||||||
|
|
|
|
|
|
|
|
|
|
|
|||||||||||||||||||||||||||||||
| Total Current Liabilities |
85,879 | 26.5 | % | 245,045 | 54.5 | % | 133,035 | 33.8 | % | 206,433 | 29.4 | % | 108,671 | 17.3 | % | |||||||||||||||||||||||||
| Total Liabilities |
85,879 | 26.5 | % | 245,045 | 54.5 | % | 133,035 | 33.8 | % | 206,433 | 29.4 | % | 108,671 | 17.3 | % | |||||||||||||||||||||||||
|
|
|
|
|
|
|
|
|
|
|
|||||||||||||||||||||||||||||||
| Total Equity |
238,348 | 73.5 | % | 204,955 | 45.5 | % | 261,133 | 66.2 | % | 496,222 | 70.6 | % | 521,139 | 82.7 | % | |||||||||||||||||||||||||
|
|
|
|
|
|
|
|
|
|
|
|||||||||||||||||||||||||||||||
| Total Liabilities & Equity |
$ | 324,227 | 100.0 | % | $ | 450,000 | 100.0 | % | $ | 394,168 | 100.0 | % | $ | 702,655 | 100.0 | % | $ | 629,810 | 100.0 | % | ||||||||||||||||||||
|
|
|
|
|
|
|
|
|
|
|
|||||||||||||||||||||||||||||||
Page 17
| Fuse/Maxim Transaction Fairness Opinion | Schedule F.3 | |
| Financial Statement Analysis - Maxim Surgical | Valuation Date: July 19, 2018 |
Select Financial and Operating Ratios
| For the Year Ended: | ||||||||||||||||||||||||||||||||||||||||||||||
| 31-Dec-14 | 31-Dec-15 | 31-Dec-16 | 31-Dec-17 | 31-May-18 | ||||||||||||||||||||||||||||||||||||||||||
| DuPont Analysis |
||||||||||||||||||||||||||||||||||||||||||||||
| Asset turnover |
410.5 | % | 229.8 | % | 277.0 | % | 170.8 | % | 195.1 | % | ||||||||||||||||||||||||||||||||||||
| Operating margin |
29.9 | % | 25.8 | % | 23.5 | % | 28.4 | % | 18.2 | % | ||||||||||||||||||||||||||||||||||||
| Interest burden |
100.0 | % | 100.0 | % | 100.0 | % | 100.0 | % | 100.0 | % | ||||||||||||||||||||||||||||||||||||
| Tax retention rate |
x | 100.0 | % | x | 100.0 | % | x | 100.0 | % | x | 100.0 | % | x | 100.0 | % | |||||||||||||||||||||||||||||||
|
|
|
|
|
|
|
|
|
|
|
|||||||||||||||||||||||||||||||||||||
| Return on assets |
122.6 | % | 59.2 | % | 65.0 | % | 48.6 | % | 35.6 | % | ||||||||||||||||||||||||||||||||||||
| Financial leverage |
x | 1.36 | x | 2.20 | x | 1.51 | x | 1.42 | x | 1.21 | ||||||||||||||||||||||||||||||||||||
|
|
|
|
|
|
|
|
|
|
|
|||||||||||||||||||||||||||||||||||||
| Return on book value of equity |
166.8 | % | 130.1 | % | 98.1 | % | 68.8 | % | 43.0 | % | ||||||||||||||||||||||||||||||||||||
| Short-term Liquidity | Average | |||||||||||||||||||||||||||||||||||||||||||||
| Working capital, excluding short-term debt |
$238,348 | $204,955 | $ | 261,133 | $ | 496,222 | $521,139 | |||||||||||||||||||||||||||||||||||||||
| % revenue |
17.9 | % | 19.8 | % | 23.9 | % | 41.3 | % | 42.4 | % | 29.1 | % | ||||||||||||||||||||||||||||||||||
| Current ratio |
3.8 | x | 1.8 | x | 3.0 | x | 3.4 | x | 5.8 | x | 3.6 | x | ||||||||||||||||||||||||||||||||||
| Quick Ratio |
2.1 | x | 1.1 | x | 1.6 | x | 1.9 | x | 3.3 | x | 2.0 | x | ||||||||||||||||||||||||||||||||||
| Basis |
||||||||||||||||||||||||||||||||||||||||||||||
| Days cash & equivalents |
COS + SG&A | 16 | 5 | 16 | 41 | 46 | 25 | |||||||||||||||||||||||||||||||||||||||
| Prepaid expenses |
SG&A expenses | 2.3 | % | 5.4 | % | -4.3 | % | -0.2 | % | -3.3 | % | 0.0 | % | |||||||||||||||||||||||||||||||||
| Days A/R |
Revenue | 39 | 94 | 61 | 88 | 70 | 71 | |||||||||||||||||||||||||||||||||||||||
| Days inventory |
Cost of sales | 77 | 110 | 105 | 170 | 139 | 120 | |||||||||||||||||||||||||||||||||||||||
| Days A/P |
Cost of sales | 41 | 117 | 67 | 96 | 40 | 72 | |||||||||||||||||||||||||||||||||||||||
| Days accrued expenses |
SG&A expenses | 19 | 116 | 29 | 58 | 39 | 52 | |||||||||||||||||||||||||||||||||||||||
| Fixed Asset Analysis | Average | |||||||||||||||||||||||||||||||||||||||||||||
| Net fixed assets |
$ | 0 | $ | 0 | $ | 0 | $ | 0 | $ | 0 | ||||||||||||||||||||||||||||||||||||
| % revenue |
0.0 | % | 0.0 | % | 0.0 | % | 0.0 | % | 0.0 | % | 0.0 | % | ||||||||||||||||||||||||||||||||||
| Fixed asset utilization |
NM | NM | NM | NM | NM | #DIV/0! | ||||||||||||||||||||||||||||||||||||||||
| Depreciation expense |
$ | 0 | $ | 0 | $ | 0 | $ | 0 | $ | 0 | ||||||||||||||||||||||||||||||||||||
| Solvency Ratios | Average | |||||||||||||||||||||||||||||||||||||||||||||
| Total Liabilities-to-Total Equity |
0.4 | x | 1.2 | x | 0.5 | x | 0.4 | x | 0.2 | x | 0.5 | x | ||||||||||||||||||||||||||||||||||
| Total Liabilities-to-Total Liabilities & Equity |
0.3 | x | 0.5 | x | 0.3 | x | 0.3 | x | 0.2 | x | 0.3 | x | ||||||||||||||||||||||||||||||||||
| Profit Margins | Average | |||||||||||||||||||||||||||||||||||||||||||||
| Gross margin |
52.8 | % | 49.1 | % | 41.5 | % | 43.6 | % | 40.3 | % | 45.5 | % | ||||||||||||||||||||||||||||||||||
| EBITDA margin |
29.9 | % | 25.8 | % | 23.5 | % | 28.4 | % | 18.2 | % | 25.2 | % | ||||||||||||||||||||||||||||||||||
| EBIT margin |
29.9 | % | 25.8 | % | 23.5 | % | 28.4 | % | 18.2 | % | 25.2 | % | ||||||||||||||||||||||||||||||||||
| Net income margin |
29.9 | % | 25.8 | % | 23.5 | % | 28.4 | % | 18.2 | % | 25.2 | % | ||||||||||||||||||||||||||||||||||
Page 18
| Fuse/Maxim Transaction Fairness Opinion | Schedule G.1 | |
| Discounted Cash Flow Method - Maxim Surgical | Valuation Date: July 19, 2018 |
Summary of Projection Inputs
Income Statement Inputs
| For the Projected Year Ended: | ||||||||||||||||||||||||||||||||||||||||||||
| 31-Dec-18 | 31-Dec-19 | 31-Dec-20 | 31-Dec-21 | 31-Dec-22 | 31-Dec-23 | 31-Dec-24 | 31-Dec-25 | 31-Dec-26 | 31-Dec-27 | Residual | ||||||||||||||||||||||||||||||||||
| Inflation estimate |
2.3 | % | 2.3 | % | 2.3 | % | 2.3 | % | 2.3 | % | 2.3 | % | 2.3 | % | 2.3 | % | 2.3 | % | 2.3 | % | 2.3 | % | ||||||||||||||||||||||
| Real revenue growth rate |
3.7 | % | 3.7 | % | 3.7 | % | 3.7 | % | 3.7 | % | 3.2 | % | 2.7 | % | 2.2 | % | 1.7 | % | 1.2 | % | 0.0 | % | ||||||||||||||||||||||
|
|
|
|
|
|
|
|
|
|
|
|
|
|
|
|
|
|
|
|
|
|
|
|||||||||||||||||||||||
| Revenue growth rate |
6.0 | % | 6.0 | % | 6.0 | % | 6.0 | % | 6.0 | % | 5.5 | % | 5.0 | % | 4.5 | % | 4.0 | % | 3.5 | % | 2.3 | % | ||||||||||||||||||||||
| Cost of sales (COS) (% of revenue) |
60.0 | % | 58.0 | % | 56.0 | % | 54.0 | % | 54.0 | % | 54.0 | % | 54.0 | % | 54.0 | % | 54.0 | % | 54.0 | % | 54.0 | % | ||||||||||||||||||||||
| Gross profit margin |
40.0 | % | 42.0 | % | 44.0 | % | 46.0 | % | 46.0 | % | 46.0 | % | 46.0 | % | 46.0 | % | 46.0 | % | 46.0 | % | 46.0 | % | ||||||||||||||||||||||
| SG&A expenses (% of revenue) |
22.0 | % | 20.0 | % | 18.0 | % | 16.0 | % | 16.0 | % | 16.0 | % | 16.0 | % | 16.0 | % | 16.0 | % | 16.0 | % | 16.0 | % | ||||||||||||||||||||||
| EBITDA margin |
18.0 | % | 22.0 | % | 26.0 | % | 30.0 | % | 30.0 | % | 30.0 | % | 30.0 | % | 30.0 | % | 30.0 | % | 30.0 | % | 30.0 | % | ||||||||||||||||||||||
| Income tax rate |
21.0 | % | 21.0 | % | 21.0 | % | 21.0 | % | 21.0 | % | 21.0 | % | 21.0 | % | 21.0 | % | 21.0 | % | 21.0 | % | 21.0 | % | ||||||||||||||||||||||
Balance Sheet Inputs
| For the Projected Year Ended: | ||||||||||||||||||||||||||||||||||||||||||||
| 31-Dec-18 | 31-Dec-19 | 31-Dec-20 | 31-Dec-21 | 31-Dec-22 | 31-Dec-23 | 31-Dec-24 | 31-Dec-25 | 31-Dec-26 | 31-Dec-27 | Residual | ||||||||||||||||||||||||||||||||||
| Days cash & equivalents |
45.0 | 45.0 | 45.0 | 45.0 | 45.0 | 45.0 | 45.0 | 45.0 | 45.0 | 45.0 | 45.0 | |||||||||||||||||||||||||||||||||
| Days A/R |
70.0 | 70.0 | 70.0 | 70.0 | 70.0 | 70.0 | 70.0 | 70.0 | 70.0 | 70.0 | 70.0 | |||||||||||||||||||||||||||||||||
| Days inventory |
140.0 | 140.0 | 140.0 | 140.0 | 140.0 | 140.0 | 140.0 | 140.0 | 140.0 | 140.0 | 140.0 | |||||||||||||||||||||||||||||||||
| Prepaid expenses |
0.0 | % | 0.0 | % | 0.0 | % | 0.0 | % | 0.0 | % | 0.0 | % | 0.0 | % | 0.0 | % | 0.0 | % | 0.0 | % | 0.0 | % | ||||||||||||||||||||||
| Days A/P |
40.0 | 40.0 | 40.0 | 40.0 | 40.0 | 40.0 | 40.0 | 40.0 | 40.0 | 40.0 | 40.0 | |||||||||||||||||||||||||||||||||
| Days accrued expenses |
40.0 | 40.0 | 40.0 | 40.0 | 40.0 | 40.0 | 40.0 | 40.0 | 40.0 | 40.0 | 40.0 | |||||||||||||||||||||||||||||||||
Page 19
| Fuse/Maxim Transaction Fairness Opinion | Schedule G.2 | |
| Discounted Cash Flow Method - Maxim Surgical | Valuation Date: July 19, 2018 |
Projected Income Statements
| Base | ||||||||||||||||||||||||||||||||||||||||||||||||
| Period | For the Projected Year Ended: | |||||||||||||||||||||||||||||||||||||||||||||||
| 31-Dec-17 | 31-Dec-18 | 31-Dec-19 | 31-Dec-20 | 31-Dec-21 | 31-Dec-22 | 31-Dec-23 | 31-Dec-24 | 31-Dec-25 | 31-Dec-26 | 31-Dec-27 | Residual | |||||||||||||||||||||||||||||||||||||
| Revenue |
$ | 1,200,089 | $ | 1,272,094 | $ | 1,348,420 | $ | 1,429,325 | $ | 1,515,084 | $ | 1,605,989 | $ | 1,694,319 | $ | 1,779,035 | $ | 1,859,091 | $ | 1,933,455 | $ | 2,001,126 | $ | 2,046,151 | ||||||||||||||||||||||||
| Annual Growth Rate |
6.0 | % | 6.0 | % | 6.0 | % | 6.0 | % | 6.0 | % | 5.5 | % | 5.0 | % | 4.5 | % | 4.0 | % | 3.5 | % | 2.3 | % | ||||||||||||||||||||||||||
| Cost of sales (COS) |
676,655 | 763,256 | 782,083 | 800,422 | 818,146 | 867,234 | 914,932 | 960,679 | 1,003,909 | 1,044,066 | 1,080,608 | 1,104,922 | ||||||||||||||||||||||||||||||||||||
|
|
|
|
|
|
|
|
|
|
|
|
|
|
|
|
|
|
|
|
|
|
|
|
|
|||||||||||||||||||||||||
| Gross Profit |
523,433 | 508,838 | 566,336 | 628,903 | 696,939 | 738,755 | 779,387 | 818,356 | 855,182 | 889,389 | 920,518 | 941,230 | ||||||||||||||||||||||||||||||||||||
| SG&A expenses |
182,247 | 279,861 | 269,684 | 257,278 | 242,413 | 256,958 | 271,091 | 284,646 | 297,455 | 309,353 | 320,180 | 327,384 | ||||||||||||||||||||||||||||||||||||
|
|
|
|
|
|
|
|
|
|
|
|
|
|
|
|
|
|
|
|
|
|
|
|
|
|||||||||||||||||||||||||
| Earnings before interest, taxes, depreciation & amortization (EBITDA) |
341,186 | 228,977 | 296,652 | 371,624 | 454,525 | 481,797 | 508,296 | 533,710 | 557,727 | 580,036 | 600,338 | 613,845 | ||||||||||||||||||||||||||||||||||||
| Depreciation expense |
— | — | — | — | — | — | — | — | — | — | — | — | ||||||||||||||||||||||||||||||||||||
|
|
|
|
|
|
|
|
|
|
|
|
|
|
|
|
|
|
|
|
|
|
|
|
|
|||||||||||||||||||||||||
| Earnings before interest & taxes (EBIT) |
341,186 | 228,977 | 296,652 | 371,624 | 454,525 | 481,797 | 508,296 | 533,710 | 557,727 | 580,036 | 600,338 | 613,845 | ||||||||||||||||||||||||||||||||||||
| Current income taxes |
48,085 | 62,297 | 78,041 | 95,450 | 101,177 | 106,742 | 112,079 | 117,123 | 121,808 | 126,071 | 128,908 | |||||||||||||||||||||||||||||||||||||
| Deferred taxes |
— | — | — | — | — | — | — | — | — | — | — | |||||||||||||||||||||||||||||||||||||
|
|
|
|
|
|
|
|
|
|
|
|
|
|
|
|
|
|
|
|
|
|
|
|
|
|||||||||||||||||||||||||
| Total taxes |
48,085 | 62,297 | 78,041 | 95,450 | 101,177 | 106,742 | 112,079 | 117,123 | 121,808 | 126,071 | 128,908 | |||||||||||||||||||||||||||||||||||||
|
|
|
|
|
|
|
|
|
|
|
|
|
|
|
|
|
|
|
|
|
|
|
|
|
|||||||||||||||||||||||||
| Net Income |
$ | 341,186 | $ | 180,892 | $ | 234,355 | $ | 293,583 | $ | 359,075 | $ | 380,619 | $ | 401,554 | $ | 421,631 | $ | 440,605 | $ | 458,229 | $ | 474,267 | $ | 484,938 | ||||||||||||||||||||||||
|
|
|
|
|
|
|
|
|
|
|
|
|
|
|
|
|
|
|
|
|
|
|
|
|
|||||||||||||||||||||||||
| Profit Margins |
Projected Profit Margins | |||||||||||||||||||||||||||||||||||||||||||||||
| Gross margin |
43.6 | % | 40.0 | % | 42.0 | % | 44.0 | % | 46.0 | % | 46.0 | % | 46.0 | % | 46.0 | % | 46.0 | % | 46.0 | % | 46.0 | % | 46.0 | % | ||||||||||||||||||||||||
| EBITDA margin |
28.4 | % | 18.0 | % | 22.0 | % | 26.0 | % | 30.0 | % | 30.0 | % | 30.0 | % | 30.0 | % | 30.0 | % | 30.0 | % | 30.0 | % | 30.0 | % | ||||||||||||||||||||||||
| EBIT margin |
28.4 | % | 18.0 | % | 22.0 | % | 26.0 | % | 30.0 | % | 30.0 | % | 30.0 | % | 30.0 | % | 30.0 | % | 30.0 | % | 30.0 | % | 30.0 | % | ||||||||||||||||||||||||
| Net income margin |
28.4 | % | 14.2 | % | 17.4 | % | 20.5 | % | 23.7 | % | 23.7 | % | 23.7 | % | 23.7 | % | 23.7 | % | 23.7 | % | 23.7 | % | 23.7 | % | ||||||||||||||||||||||||
| Effective tax rate |
NM | 21.0 | % | 21.0 | % | 21.0 | % | 21.0 | % | 21.0 | % | 21.0 | % | 21.0 | % | 21.0 | % | 21.0 | % | 21.0 | % | 21.0 | % | |||||||||||||||||||||||||
Page 20
| Fuse/Maxim Transaction Fairness Opinion | Schedule G.3 | |
| Discounted Cash Flow Method - Maxim Surgical Projected Balance Sheets |
Valuation Date: July 19, 2018
|
| Base Period |
Projected As Of: | |||||||||||||||||||||||||||||||||||||||||||||||
| 31-Dec-17 | 31-Dec-18 | 31-Dec-19 | 31-Dec-20 | 31-Dec-21 | 31-Dec-22 | 31-Dec-23 | 31-Dec-24 | 31-Dec-25 | 31-Dec-26 | 31-Dec-27 | Residual | |||||||||||||||||||||||||||||||||||||
| Current Assets |
||||||||||||||||||||||||||||||||||||||||||||||||
| Cash & cash equivalents |
$ | 97,154 | $ | 128,603 | $ | 129,670 | $ | 130,401 | $ | 130,754 | $ | 138,599 | $ | 146,222 | $ | 153,533 | $ | 160,442 | $ | 166,860 | $ | 172,700 | $ | 176,586 | ||||||||||||||||||||||||
| Accounts receivable, net |
290,716 | 243,963 | 258,601 | 274,117 | 290,564 | 307,998 | 324,938 | 341,185 | 356,538 | 370,800 | 383,778 | 392,413 | ||||||||||||||||||||||||||||||||||||
| Inventory |
315,133 | 292,756 | 299,977 | 307,011 | 313,809 | 332,638 | 350,933 | 368,480 | 385,061 | 400,464 | 414,480 | 423,806 | ||||||||||||||||||||||||||||||||||||
| Prepaid expenses & other current assets |
(347 | ) | — | — | — | — | — | — | — | — | — | — | — | |||||||||||||||||||||||||||||||||||
|
|
|
|
|
|
|
|
|
|
|
|
|
|
|
|
|
|
|
|
|
|
|
|
|
|||||||||||||||||||||||||
| Total Assets |
$ | 702,655 | $ | 665,323 | $ | 688,248 | $ | 711,530 | $ | 735,127 | $ | 779,235 | $ | 822,093 | $ | 863,197 | $ | 902,041 | $ | 938,123 | $ | 970,957 | $ | 992,804 | ||||||||||||||||||||||||
|
|
|
|
|
|
|
|
|
|
|
|
|
|
|
|
|
|
|
|
|
|
|
|
|
|||||||||||||||||||||||||
| Current Liabilities |
||||||||||||||||||||||||||||||||||||||||||||||||
| Accounts payable |
$ | 177,655 | $ | 83,645 | $ | 85,708 | $ | 87,717 | $ | 89,660 | $ | 95,039 | $ | 100,267 | $ | 105,280 | $ | 110,017 | $ | 114,418 | $ | 118,423 | $ | 121,087 | ||||||||||||||||||||||||
| Accrued expenses |
28,778 | 30,670 | 29,554 | 28,195 | 26,566 | 28,160 | 29,709 | 31,194 | 32,598 | 33,902 | 35,088 | 35,878 | ||||||||||||||||||||||||||||||||||||
|
|
|
|
|
|
|
|
|
|
|
|
|
|
|
|
|
|
|
|
|
|
|
|
|
|||||||||||||||||||||||||
| Total Liabilities |
206,433 | 114,314 | 115,262 | 115,912 | 116,226 | 123,199 | 129,975 | 136,474 | 142,615 | 148,320 | 153,511 | 156,965 | ||||||||||||||||||||||||||||||||||||
| Total Capital |
||||||||||||||||||||||||||||||||||||||||||||||||
| Beginning capital |
496,222 | 551,008 | 572,986 | 595,617 | 618,901 | 656,035 | 692,117 | 726,723 | 759,426 | 789,803 | 817,446 | |||||||||||||||||||||||||||||||||||||
| Current period earnings (loss) |
180,892 | 234,355 | 293,583 | 359,075 | 380,619 | 401,554 | 421,631 | 440,605 | 458,229 | 474,267 | 484,938 | |||||||||||||||||||||||||||||||||||||
| Net cash flow |
126,105 | 212,378 | 270,952 | 335,791 | 343,485 | 365,472 | 387,025 | 407,902 | 427,852 | 446,624 | 466,545 | |||||||||||||||||||||||||||||||||||||
|
|
|
|
|
|
|
|
|
|
|
|
|
|
|
|
|
|
|
|
|
|
|
|||||||||||||||||||||||||||
| Ending Capital |
496,222 | 551,008 | 572,986 | 595,617 | 618,901 | 656,035 | 692,117 | 726,723 | 759,426 | 789,803 | 817,446 | 835,838 | ||||||||||||||||||||||||||||||||||||
| Total Liabilities & Capital |
$ | 702,655 | $ | 665,323 | $ | 688,248 | $ | 711,530 | $ | 735,127 | $ | 779,235 | $ | 822,093 | $ | 863,197 | $ | 902,041 | $ | 938,123 | $ | 970,957 | $ | 992,804 | ||||||||||||||||||||||||
|
|
|
|
|
|
|
|
|
|
|
|
|
|
|
|
|
|
|
|
|
|
|
|
|
|||||||||||||||||||||||||
| Working capital (CA - CL) |
$ | 496,222 | $ | 551,008 | $ | 572,986 | $ | 595,617 | $ | 618,902 | $ | 656,036 | $ | 692,118 | $ | 726,724 | $ | 759,426 | $ | 789,803 | $ | 817,446 | $ | 835,839 | ||||||||||||||||||||||||
| WC balance as % revenue |
41.3 | % | 43.3 | % | 42.5 | % | 41.7 | % | 40.8 | % | 40.8 | % | 40.8 | % | 40.8 | % | 40.8 | % | 40.8 | % | 40.8 | % | 40.8 | % | ||||||||||||||||||||||||
| Additions (subtractions) thereto |
54,786 | 21,978 | 22,631 | 23,284 | 37,134 | 36,082 | 34,606 | 32,703 | 30,377 | 27,643 | 18,393 | |||||||||||||||||||||||||||||||||||||
Page 21
| Fuse/Maxim Transaction Fairness Opinion | Schedule G.4 | |
| Discounted Cash Flow Method - Maxim Surgical | Valuation Date: July 19, 2018 | |
| Weighted Average Cost of Capital | (Dollar figures in millions, except for per share figures) | |
| ValDate | ValDate | ValDate | ValDate Total | Avg. | ||||||||||||||||||||||||||||||||||||
| Ticker | Observed | Shares | Share | Market | Debt, Pref. | Debt / | Debt / | Effective | Unlevered | |||||||||||||||||||||||||||||||
| Company Name |
Symbol | Beta | Out | Price | Cap | & Min Int. | Equity | Total Cap | Tax Rate | Beta | ||||||||||||||||||||||||||||||
| Zimmer Biomet Holdings, Inc. |
ZBH | 1.16 | 203 | $ | 112.24 | $ | 22,815 | $ | 11,113 | 23.1 | % | 18.8 | % | 23.6 | % | 0.99 | ||||||||||||||||||||||||
| Orthofix International N.V. |
OFIX | 0.83 | 19 | $ | 59.19 | $ | 1,116 | $ | 0 | 20.2 | % | 16.8 | % | 48.6 | % | 0.75 | ||||||||||||||||||||||||
| Globus Medical, Inc. |
GMED | 0.69 | 97 | $ | 52.61 | $ | 5,128 | $ | 0 | 0.0 | % | 0.0 | % | 28.6 | % | 0.69 | ||||||||||||||||||||||||
| NuVasive, Inc. |
NUVA | 0.87 | 51 | $ | 53.98 | $ | 2,767 | $ | 643 | 23.6 | % | 19.1 | % | 31.7 | % | 0.75 | ||||||||||||||||||||||||
| Exacompta Clairefontaine S.A. |
EXAC | 0.89 | 1 | $ | 126.00 | $ | 143 | $ | 146 | 164.7 | % | 62.2 | % | 29.9 | % | 0.41 | ||||||||||||||||||||||||
| Cardinal Health, Inc. |
CAH | 0.82 | 311 | $ | 49.00 | $ | 15,224 | $ | 9,591 | 26.4 | % | 20.9 | % | 40.0 | % | 0.71 | ||||||||||||||||||||||||
| Medtronic plc |
MDT | 0.98 | 1,352 | $ | 88.42 | $ | 119,518 | $ | 25,879 | 22.9 | % | 18.7 | % | 20.8 | % | 0.83 | ||||||||||||||||||||||||
| Stryker Corporation |
SYK | 0.91 | 374 | $ | 172.86 | $ | 64,600 | $ | 7,913 | 8.5 | % | 7.8 | % | 28.5 | % | 0.85 | ||||||||||||||||||||||||
| High | 164.7 | % | 62.2 | % | 48.6 | % | 0.99 | |||||||||||||||||||||||||||||||||
| Mean | 20.7 | % | 11.7 | % | 18.0 | % | 0.75 | |||||||||||||||||||||||||||||||||
| Median | 4.2 | % | 3.9 | % | 22.2 | % | 0.75 | |||||||||||||||||||||||||||||||||
| CV | 2.08 | 1.46 | 0.97 | 0.22 | ||||||||||||||||||||||||||||||||||||
Notes:
| (1) | Reflects a C Corporation status for valuation purposes |
| (2) | 20-Year United States Treasury rate as of July 19, 2018 |
| (3) | Duff & Phelps 2016 Valuation Handbook, long-term supply side ERP |
| (4) | Unlevered and relevered using Hamada method |
| (5) | Median debt-to-equity of the guideline companies |
| (6) | Yield on Moody’s Baa-rated corporate bonds as of July 19, 2018 |
| (7) | Small stock risk premium 10th decile (Source: Duff & Phelps 2016 Valuation Handbook) |
Page 22
| Fuse/Maxim Transaction Fairness Opinion | Schedule G.5 | |
| Discounted Cash Flow Method - Maxim Surgical Synthesis of Net Cash Flow |
Valuation Date: July 19, 2018 | |
| For the Projected Year Ended: | ||||||||||||||||||||||||||||||||||||||||||||
| 31-Dec-18 | 31-Dec-19 | 31-Dec-20 | 31-Dec-21 | 31-Dec-22 | 31-Dec-23 | 31-Dec-24 | 31-Dec-25 | 31-Dec-26 | 31-Dec-27 | Residual | ||||||||||||||||||||||||||||||||||
| Sources of Cash Flow: |
||||||||||||||||||||||||||||||||||||||||||||
| Net income |
180,892 | 234,355 | 293,583 | 359,075 | 380,619 | 401,554 | 421,631 | 440,605 | 458,229 | 474,267 | 484,938 | |||||||||||||||||||||||||||||||||
| Depreciation |
— | — | — | — | — | — | — | — | — | — | — | |||||||||||||||||||||||||||||||||
| Increase in deferred taxes |
— | — | — | — | — | — | — | — | — | — | — | |||||||||||||||||||||||||||||||||
|
|
|
|
|
|
|
|
|
|
|
|
|
|
|
|
|
|
|
|
|
|
|
|||||||||||||||||||||||
| Total Sources of Cash Flow |
180,892 | 234,355 | 293,583 | 359,075 | 380,619 | 401,554 | 421,631 | 440,605 | 458,229 | 474,267 | 484,938 | |||||||||||||||||||||||||||||||||
| Uses of Cash Flow: |
||||||||||||||||||||||||||||||||||||||||||||
| Additions to working capital |
54,786 | 21,978 | 22,631 | 23,284 | 37,134 | 36,082 | 34,606 | 32,703 | 30,377 | 27,643 | 18,393 | |||||||||||||||||||||||||||||||||
| Capital expenditures |
— | — | — | — | — | — | — | — | — | — | — | |||||||||||||||||||||||||||||||||
| Net cash flow |
126,105 | 212,378 | 270,952 | 335,791 | 343,485 | 365,472 | 387,025 | 407,902 | 427,852 | 446,624 | 466,545 | |||||||||||||||||||||||||||||||||
|
|
|
|
|
|
|
|
|
|
|
|
|
|
|
|
|
|
|
|
|
|
|
|||||||||||||||||||||||
| Total Uses of Cash Flow |
180,892 | 234,355 | 293,583 | 359,075 | 380,619 | 401,554 | 421,631 | 440,605 | 458,229 | 474,267 | 484,938 | |||||||||||||||||||||||||||||||||
| Net Cash Flow |
$ | 126,105 | $ | 212,378 | $ | 270,952 | $ | 335,791 | $ | 343,485 | $ | 365,472 | $ | 387,025 | $ | 407,902 | $ | 427,852 | $ | 446,624 | $ | 466,545 | ||||||||||||||||||||||
| Period (Mid - Period) |
0.23 | 0.95 | 1.95 | 2.95 | 3.95 | 4.95 | 5.95 | 6.95 | 7.95 | 8.95 | ||||||||||||||||||||||||||||||||||
| PV Factor @ WACC = 12.8% |
0.9733 | 0.8919 | 0.7907 | 0.7010 | 0.6214 | 0.5509 | 0.4884 | 0.4330 | 0.3838 | 0.3403 | ||||||||||||||||||||||||||||||||||
| Partial Period Factor (January 1, 2018 - July 19, 2018) |
0.45 | |||||||||||||||||||||||||||||||||||||||||||
| Present Value (PV) Net Cash Flow |
$ | 55,230 | $ | 189,415 | $ | 214,235 | $ | 235,373 | $ | 213,446 | $ | 201,337 | $ | 189,017 | $ | 176,607 | $ | 164,224 | $ | 151,976 | ||||||||||||||||||||||||
Page 23
| Fuse/Maxim Transaction Fairness Opinion | Schedule H.1 | |
| Guideline Public Company Method - Maxim Surgical Determination of Relevant Multiples |
Valuation Date: July 19, 2018 (Dollar figures in millions, except for per share figures) | |
| Valuation Date | ||||||||||||||||||||||||||||||||||||||||||||
| 6/30/17 | Ticker: | ZBH | OFIX | GMED | NUVA | EXAC | CAH | MDT | SYK | |||||||||||||||||||||||||||||||||||
| Company: | Zimmer Biomet Holdings, Inc. |
Orthofix International N.V. |
Globus Medical, Inc. |
NuVasive, Inc. |
Exacompta Clairefontain e S.A. |
Cardinal Health, Inc. |
Medtronic plc |
Stryker Corporation |
||||||||||||||||||||||||||||||||||||
| LTM Operating Performance |
|
Mean | Median | |||||||||||||||||||||||||||||||||||||||||
| Revenue (S) |
|
$ | 7,869 | $ | 440 | $ | 655 | $ | 1,041 | $ | 718 | $ | 134,426 | $ | 29,953 | $ | 12,730 | |||||||||||||||||||||||||||
| Gross profit |
|
$ | 5,692 | $ | 345 | $ | 501 | $ | 760 | $ | 382 | $ | 7,069 | $ | 20,983 | $ | 8,432 | |||||||||||||||||||||||||||
| % margin |
|
72.3 | % | 78.5 | % | 76.6 | % | 73.0 | % | 53.2 | % | 5.3 | % | 70.1 | % | 66.2 | % | 61.9 | % | 71.2 | % | |||||||||||||||||||||||
| Earnings before interest, taxes, depreciation & amortization (EBITDA) |
|
$ | 2,774 | $ | 58 | $ | 211 | $ | 226 | $ | 63 | $ | 3,222 | $ | 9,499 | $ | 3,476 | |||||||||||||||||||||||||||
| % margin |
35.3 | % | 13.2 | % | 32.2 | % | 21.7 | % | 8.8 | % | 2.4 | % | 31.7 | % | 27.3 | % | 21.6 | % | 24.5 | % | ||||||||||||||||||||||||
| Earnings before interest & taxes (EBIT) |
|
$ | 1,716 | $ | 37 | $ | 171 | $ | 112 | $ | 29 | $ | 2,251 | $ | 6,855 | $ | 2,808 | |||||||||||||||||||||||||||
| % margin |
21.8 | % | 8.4 | % | 26.2 | % | 10.8 | % | 4.0 | % | 1.7 | % | 22.9 | % | 22.1 | % | 14.7 | % | 16.3 | % | ||||||||||||||||||||||||
| Net income to common shareholders |
|
$ | 1,689 | $ | 14 | $ | 118 | $ | 43 | $ | 15 | $ | 1,696 | $ | 3,104 | $ | 1,019 | |||||||||||||||||||||||||||
| % margin |
21.5 | % | 3.2 | % | 18.1 | % | 4.2 | % | 2.2 | % | 1.3 | % | 10.4 | % | 8.0 | % | 8.6 | % | 6.1 | % | ||||||||||||||||||||||||
| Calculation of Equity and Capital Value |
||||||||||||||||||||||||||||||||||||||||||||
| Share price as of |
6/30/2017 | $ | 112.24 | $ | 59.19 | $ | 52.61 | $ | 53.98 | $ | 126.00 | $ | 49.00 | $ | 88.42 | $ | 172.86 | |||||||||||||||||||||||||||
| Shares out (000s) |
203 | 19 | 97 | 51 | 1 | 311 | 1,352 | 374 | ||||||||||||||||||||||||||||||||||||
|
|
|
|
|
|
|
|
|
|
|
|
|
|
|
|
|
|||||||||||||||||||||||||||||
| Market capitalization |
|
22,815 | 1,116 | 5,128 | 2,767 | 143 | 15,224 | 119,518 | 64,600 | |||||||||||||||||||||||||||||||||||
| Less: cash & equivalents |
|
1,765 | 93 | 369 | 74 | 164 | 2,175 | 11,227 | 2,455 | |||||||||||||||||||||||||||||||||||
|
|
|
|
|
|
|
|
|
|
|
|
|
|
|
|
|
|||||||||||||||||||||||||||||
| Equity value less cash (P) |
|
21,050 | 1,023 | 4,759 | 2,693 | (21 | ) | 13,049 | 108,291 | 62,145 | ||||||||||||||||||||||||||||||||||
| Minority interest |
1 | — | — | — | — | 13 | 102 | 9 | ||||||||||||||||||||||||||||||||||||
| Preferred stock |
— | — | — | — | — | — | — | — | ||||||||||||||||||||||||||||||||||||
| Total debt |
11,112 | — | — | 643 | 146 | 9,578 | 25,777 | 7,904 | ||||||||||||||||||||||||||||||||||||
|
|
|
|
|
|
|
|
|
|
|
|
|
|
|
|
|
|||||||||||||||||||||||||||||
| Enterprise value (EV) |
|
32,163 | 1,023 | 4,759 | 3,336 | 125 | 22,640 | 134,170 | 70,058 | |||||||||||||||||||||||||||||||||||
| Operating Multiples |
|
Mean | Median | |||||||||||||||||||||||||||||||||||||||||
| EV/S |
4.1 | 2.3 | 7.3 | 3.2 | 0.2 | 0.2 | 4.5 | 5.5 | 3.4 | 3.6 | ||||||||||||||||||||||||||||||||||
| EV/EBITDA |
11.6 | 17.7 | 22.6 | 14.8 | 2.0 | 7.0 | 14.1 | 20.2 | 13.7 | 14.4 | ||||||||||||||||||||||||||||||||||
| EV/EBIT |
18.7 | 27.8 | 27.8 | 29.7 | 4.3 | 10.1 | 19.6 | 24.9 | 20.4 | 22.3 | ||||||||||||||||||||||||||||||||||
Page 24
| Fuse/Maxim Transaction Fairness Opinion | Schedule H.2 | |
| Guideline Public Company Method - Maxim Surgical | Valuation Date: July 19, 2018 |
Summary and Application of Multiples
| Observed Multiples |
ZBH | OFIX | GMED | NUVA | EXAC | CAH | MDT | SYK | ||||||||||||||||||||||||
| EV/S |
4.1 | 2.3 | 7.3 | 3.2 | 0.2 | 0.2 | 4.5 | 5.5 | ||||||||||||||||||||||||
| EV/EBITDA |
11.6 | 17.7 | 22.6 | 14.8 | 2.0 | 7.0 | 14.1 | 20.2 | ||||||||||||||||||||||||
| EV/EBIT |
18.7 | 27.8 | 27.8 | 29.7 | 4.3 | 10.1 | 19.6 | 24.9 | ||||||||||||||||||||||||
| 25th | 75th | |||||||||||||||||||||||||||
| Summary Statistics |
Low | Percentile | Mean | Median | Percentile | High | CV | |||||||||||||||||||||
| EV/S |
0.2 | 1.8 | 3.4 | 3.6 | 4.7 | 7.3 | 0.7 | |||||||||||||||||||||
| EV/EBITDA |
2.0 | 10.5 | 13.7 | 14.4 | 18.3 | 22.6 | 0.5 | |||||||||||||||||||||
| EV/EBIT |
4.3 | 16.6 | 20.4 | 22.3 | 27.8 | 29.7 | 0.4 | |||||||||||||||||||||
| TTM Base | 75th | 25th | 75th | 25th | ||||||||||||||||||||||||||||
| Select Income Statement Items |
Period | Multiples |
Percentile | Median | Percentile | Implied Values |
Percentile | Median | Percentile | |||||||||||||||||||||||
| Revenue (S) |
$ | 1,228,938 | EV/S |
4.7 | 3.6 | 1.8 | EV/S |
$ | 5,819,455 | $ | 4,480,478 | $ | 2,198,199 | |||||||||||||||||||
| Earnings before interest, taxes, |
EV/EBITDA |
18.3 | 14.4 | 10.5 | EV/EBITDA |
$ | 4,096,511 | $ | 3,233,701 | $ | 2,340,667 | |||||||||||||||||||||
| depreciation & amortization (EBITDA) |
$ | 223,942 | EV/EBIT |
27.8 | 22.3 | 16.6 | EV/EBIT |
$ | 6,225,174 | $ | 4,985,167 | $ | 3,711,986 | |||||||||||||||||||
|
|
|
|
|
|
|
|||||||||||||||||||||||||||
| Earnings before interest & taxes (EBIT) |
$ | 223,942 | ||||||||||||||||||||||||||||||
| Net income |
$ | 699,177 | ||||||||||||||||||||||||||||||
| Enterprise Value |
$ | 2,340,667 | ||||||||||||||||||||||||||||||
|
|
|
|||||||||||||||||||||||||||||||
| Select Balance Sheet Items |
5/31/2018 | Indicated Enterprise Value |
$ | 2,340,667 | ||||||||||||||||||||||||||||
| Cash and equivalents |
$ | 126,174 | Plus: Cash |
$ | 126,174 | |||||||||||||||||||||||||||
| Total debt |
$ | 0 | Less: Total Debt |
$ | 0 | |||||||||||||||||||||||||||
|
|
|
|||||||||||||||||||||||||||||||
| Implied Equity Value - Minority, Marketable |
$ | 2,466,841 | ||||||||||||||||||||||||||||||
| Control Premium @ |
28.1 | % | $ | 693,525 | ||||||||||||||||||||||||||||
|
|
|
|||||||||||||||||||||||||||||||
| Concluded Equity Value - Control |
$ | 3,160,366 | ||||||||||||||||||||||||||||||
Page 25
| Fuse/Maxim Transaction Fairness Opinion | Schedule I | |
| Merger & Acquisition Method - Maxim Surgical | Valuation Date: July 19, 2018 |
Transaction Approach
| Industry Transactions - See Criteria Below |
Transaction Multiples | |||||||||||||||||||||||||||
| Target Revenue | Target EBITDA | Target EBITDA | Enterprise Value | |||||||||||||||||||||||||
| Date |
Target |
($mm) | ($mm) | Margin (%) | ($mm) | Acquirer |
EV/S | EV/EBITDA | ||||||||||||||||||||
| 12/4/2017 |
Exactech, Inc. | 264.4 | 43.0 | 16.3 | % | 812.8 | — | 3.1 | 18.9 | |||||||||||||||||||
| 10/23/2017 |
Exactech, Inc. | 264.4 | 43.0 | 16.3 | % | 709.6 | TPG Capital, L.P. | 2.7 | 16.5 | |||||||||||||||||||
| 9/27/2017 |
Bird and Cronin, Inc. | 24.0 | — | — | 15.5 | Dynatronics Corporation | 0.6 | — | ||||||||||||||||||||
| 7/20/2017 |
WPI Holdings Inc. | 50.0 | — | — | 120.5 | Convatec Group Plc | 2.4 | — | ||||||||||||||||||||
| 5/1/2017 |
Span-America Medical Systems Inc | 61.8 | 7.3 | 11.8 | % | 73.8 | Savaria Corp | 1.2 | 10.1 | |||||||||||||||||||
| 11/20/2015 |
Liberator Medical Holdings Inc | 81.6 | 24.1 | 29.6 | % | 174.6 | CR Bard Inc | 2.1 | 7.2 | |||||||||||||||||||
| 8/14/2015 |
HASCO Medical Inc | 93.5 | 5.2 | 5.6 | % | 48.8 | WMK Inc | 0.5 | 9.3 | |||||||||||||||||||
| 8/4/2014 |
Symmetry Medical Inc | 397.3 | 51.1 | 12.9 | % | 436.3 | Tecomet Inc | 1.1 | 8.5 | |||||||||||||||||||
| 6/25/2014 |
Medical Action Industries Inc | 287.8 | 15.2 | 5.3 | % | 279.8 | Owens & Minor Inc | 1.0 | 18.4 | |||||||||||||||||||
| 4/24/2014 |
Biomet Inc | 3,162.8 | 813.2 | 25.7 | % | 18,970.5 | Zimmer Holdings Inc | 6.0 | 23.3 | |||||||||||||||||||
| 2/17/2014 |
Chindex International Inc | 187.7 | 13.3 | 7.1 | % | 446.7 | Investor Group | 2.4 | 33.5 | |||||||||||||||||||
| 11/14/2013 |
Kimberly-Clark Health Care Inc | 1,664.0 | 250.6 | 15.1 | % | 1,742.2 | Shareholders | 1.0 | 7.0 | |||||||||||||||||||
| 6/12/2013 |
Pioneer Surgical Technology Inc | 88.2 | 7.0 | 7.9 | % | 137.6 | RTI Biologics Inc | 1.6 | 19.8 | |||||||||||||||||||
Page 26
| Fuse/Maxim Transaction Fairness Opinion | Schedule J | |
| Equity Valuation Summary - Maxim Surgical | Valuation Date: July 19, 2018 | |
| Synthesis of Equity Value | ||
| Summary - Fuse Post -Transaction Equity Value |
||||||||||||
| Valuation Method |
Indicated Value | Weight | Reference | |||||||||
| Income Approach |
||||||||||||
| Discounted Cash Flow Method |
$ | 3,295,646 | 50.0 | % | Schedule G.5 | |||||||
| Market Approach |
||||||||||||
| Guideline Public Company Method |
$ | 3,160,366 | 25.0 | % | Schedule H.2 | |||||||
| Merger and Acquisition Method |
$ | 3,822,542 | 25.0 | % | Schedule I | |||||||
|
|
|
|
|
|||||||||
| Equity Value (Rounded) - Control, Marketable |
$ | 3,400,000 | ||||||||||
Page 27
| Fuse/Maxim Transaction Fairness Opinion | Schedule K.1 | |
| Transaction Analysis | Valuation Date: July 19, 2018 | |
| Securities Purchases Agreement Share Price | ||
| Fuse Medical, Inc. (FZMD) Historical Share Data (1) | ||||||||||||||||||||||||
| Date |
Open | High | Low | Close | Adj Close | Volume | ||||||||||||||||||
| 19-Jul-18 |
0.75 | 0.75 | 0.75 | 0.75 | 0.75 | |||||||||||||||||||
| 18-Jul-18 |
0.75 | 0.75 | 0.75 | 0.75 | 0.75 | |||||||||||||||||||
| 17-Jul-18 |
0.75 | 0.75 | 0.75 | 0.75 | 0.75 | |||||||||||||||||||
| 16-Jul-18 |
0.75 | 0.75 | 0.75 | 0.75 | 0.75 | 800 | ||||||||||||||||||
| 13-Jul-18 |
1.00 | 1.00 | 0.75 | 0.75 | 0.75 | 2,000 | ||||||||||||||||||
| 12-Jul-18 |
1.01 | 1.01 | 1.01 | 1.01 | 1.01 | |||||||||||||||||||
| 11-Jul-18 |
1.01 | 1.01 | 1.01 | 1.01 | 1.01 | |||||||||||||||||||
| 10-Jul-18 |
1.01 | 1.01 | 1.01 | 1.01 | 1.01 | |||||||||||||||||||
| 9-Jul-18 |
1.01 | 1.01 | 1.01 | 1.01 | 1.01 | |||||||||||||||||||
| 6-Jul-18 |
1.01 | 1.01 | 1.01 | 1.01 | 1.01 | |||||||||||||||||||
| 5-Jul-18 |
1.01 | 1.01 | 1.01 | 1.01 | 1.01 | |||||||||||||||||||
| 3-Jul-18 |
1.01 | 1.01 | 1.01 | 1.01 | 1.01 | |||||||||||||||||||
| 2-Jul-18 |
1.01 | 1.01 | 1.01 | 1.01 | 1.01 | |||||||||||||||||||
| 29-Jun-18 |
1.01 | 1.01 | 1.01 | 1.01 | 1.01 | |||||||||||||||||||
| 28-Jun-18 |
1.01 | 1.01 | 1.01 | 1.01 | 1.01 | |||||||||||||||||||
| 27-Jun-18 |
1.01 | 1.01 | 1.01 | 1.01 | 1.01 | |||||||||||||||||||
| 26-Jun-18 |
1.01 | 1.01 | 1.01 | 1.01 | 1.01 | |||||||||||||||||||
| 25-Jun-18 |
1.01 | 1.01 | 1.01 | 1.01 | 1.01 | |||||||||||||||||||
| 22-Jun-18 |
1.01 | 1.01 | 1.01 | 1.01 | 1.01 | |||||||||||||||||||
| 21-Jun-18 |
1.01 | 1.01 | 1.01 | 1.01 | 1.01 | |||||||||||||||||||
| 20-Jun-18 |
1.01 | 1.01 | 1.01 | 1.01 | 1.01 | |||||||||||||||||||
| 30-Day Volume Weighted Average Price (2) |
|
$ | 0.75 | |||||||||||||||||||||
Notes:
| (1) | Fuse Medical historical share data taken from Yahoo Finance. |
| (2) | Estimated Purchase Price defined as 30-day volume weighted average price (VWAP) as of three business days prior to Closing, Section 1.2(c)(i) in Securities Purchase Agreement by and among Fuse Medical, Inc. and Springs Partners, LLC, dated July 27, 2018. |
Page 28
| Fuse/Maxim Transaction Fairness Opinion | Schedule K.2 | |
| Transaction Analysis | Valuation Date: July 19, 2018 | |
| Review of Control Premium Data | ||
SIC codes and descriptions:
SIC 8742 - Medical, Dental and Hospital Equipment and Supplies
Notes:
| (1) | Control premium data from M&A transactions in the Capital IQ database. See Schedule D. |
| (2) | Discount for Lack of Control (DLOC) calculated as [ Control Premium / (1 + Control Premium) ] |
Page 29
| Fuse/Maxim Transaction Fairness Opinion | Schedule K.3 | |
| Transaction Analysis | Valuation Date: July 19, 2018 | |
| Fairness Opinion Conclusion | ||
| Summary |
||||||||
| Fair Value (FV) of Fuse Equity |
$ | 36,400,000 | Schedule E | |||||
| Fuse Outstanding Shares (Pre-Transaction) |
65,890,808 | |||||||
|
|
|
|||||||
| FV of Fuse Equity Per Share (Pre-Transaction) |
$ | 0.5524 | per share | |||||
| Closing Consideration/Maxim Equity Value |
$ | 3,400,000 | Schedule J | |||||
| Plus: Closing Net Working Capital |
521,139 | |||||||
| Less: Target Net Working Capital |
(100,000 | ) | ||||||
|
|
|
|||||||
| Total Maxim Purchase Price |
$ | 3,821,139 | ||||||
| Securities Purchase Agreement Fuse Share Price |
$ | 0.7500 | Schedule K.1 | |||||
|
|
|
|||||||
| Shares Provided as Equity Payment |
5,094,852 | |||||||
| Maxim Equity Value |
$ | 3,821,139 | ||||||
| Fuse Equity Value |
$ | 36,400,000 | ||||||
|
|
|
|||||||
| Post-Transaction Equity Value |
$ | 40,221,139 | ||||||
| Fuse Outstanding Shares (Post-Transaction) |
70,985,660 | |||||||
|
|
|
|||||||
| Fully Diluted Fuse Equity Value Per Share (Post-Transaction) |
$ | 0.5666 | per share | |||||
|
|
|
|||||||
| Conclusion - Deal is FAIR to Fuse Medical, Inc. Shareholders | ||||||||
Page 30