Attached files
| file | filename |
|---|---|
| 8-K - 8-K - HEALTHCARE REALTY TRUST INC | hr-2018630xearnings8xk.htm |
| EX-99.1 - EXHIBIT 99.1 - HEALTHCARE REALTY TRUST INC | exhibit991secondquarter201.htm |
2Q2018 |
Supplemental Information |
FURNISHED AS OF AUGUST 2, 2018 - UNAUDITED |
 |
FORWARD LOOKING STATEMENTS & RISK FACTORS |
This Supplemental Information report contains disclosures that are “forward-looking statements” as defined in Section 27A of the Securities Act of 1933, as amended, and Section 21E of the Securities Exchange Act of 1934, as amended. Forward-looking statements include all statements that do not relate solely to historical or current facts and can be identified by the use of words and phrases such as “can,” “may,” “payable,” “indicative,” “annualized,” “expect,” “expected,” “range of expectations,” "budget," and other comparable terms in this report. These forward-looking statements are made as of the date of this report and are not guarantees of future performance. These statements are based on the current plans and expectations of Company management and are subject to a number of unknown risks, uncertainties, assumptions and other factors that could cause actual results to differ materially from those described in this release or implied by such forward-looking statements. Such risks and uncertainties include, among other things, the following: changes in the economy; increases in interest rates; the availability and cost of capital at expected rates; changes to facility-related healthcare regulations; competition for quality assets; negative developments in the operating results or financial condition of the Company's tenants, including, but not limited to, their ability to pay rent and repay loans; the Company's ability to reposition or sell facilities with profitable results; the Company's ability to re-lease space at similar rates as vacancies occur;
the Company's ability to renew expiring long-term single-tenant net leases; the Company's ability to timely reinvest proceeds from the sale of assets at similar yields; government regulations affecting tenants' Medicare and Medicaid reimbursement rates and operational requirements; unanticipated difficulties and/or expenditures relating to future acquisitions and developments; changes in rules or practices governing the Company's financial reporting; the Company may be required under purchase options to sell properties and may not be able to reinvest the proceeds from such sales at rates of return equal to the return received on the properties sold; uninsured or underinsured losses related to casualty or liability; the incurrence of impairment charges on its real estate properties or other assets; and other legal and operational matters. Other risks, uncertainties and factors that could cause actual results to differ materially from those projected are detailed under the heading “Risk Factors,” in the Company's Annual Report on Form 10-K filed with the Securities and Exchange Commission (“SEC”) for the year ended December 31, 2017 and other risks described from time to time thereafter in the Company's SEC filings. The Company undertakes no obligation to publicly update or revise any forward-looking statements, whether as a result of new information, future events or otherwise.
Table of Contents |
4 | Highlights | |
5 | Salient Facts | |
6 | Corporate Information | |
7 | Balance Sheet Information | |
8 | Statements of Income Information | |
9 | FFO, Normalized FFO & FAD | |
10 | Capital Funding & Commitments | |
11 | Debt Metrics | |
12 | Investment Activity | |
13 | Portfolio | |
14 | Associated Health Systems | |
15 | Top Tenants | |
16 | MOB Proximity to Hospital | |
17 | Lease Maturity, Lease & Building Size | |
18 | Historical Occupancy | |
19 | Occupancy Reconciliation | |
20 | Same Store Leasing Statistics | |
21 | Same Store Performance | |
22 | Reconciliation of NOI | |
23 | Reconciliation of EBITDA | |
24 | Components of Net Asset Value | |
25 | Components of Expected FFO | |
Copies of this report may be obtained at www.healthcarerealty.com or by contacting Investor Relations at 615.269.8175 or communications@healthcarerealty.com.
HEALTHCARE REALTY | 2Q 2018 SUPPLEMENTAL INFORMATION 3 |
Highlights |
QUARTERLY HIGHLIGHTS |
For the trailing twelve months ended June 30 2018, same store revenue grew 2.8%, operating expenses increased 2.1%, and same store cash NOI grew 3.2%:
• | Same store revenue per average occupied square foot increased 2.6%. |
• | Average same store occupancy increased 30 basis points to 89.6% from 89.3%. |
Four predictive growth measures in the same store multi-tenant portfolio:
• | In-place contractual rent increases averaged 2.84%, up from 2.74% a year ago. |
• | Weighted average cash leasing spreads were 6.4% on 229,000 square feet renewed: |
◦ | 1% (<0% spread) |
◦ | 7% (0-3%) |
◦ | 57% (3-4%) |
◦ | 35% (>4%) |
• | Tenant retention was 84.4%. |
• | The average yield on renewed leases increased 70 basis points. |
Leasing activity in the second quarter totaled 480,000 square feet related to 122 leases:
• | 346,000 square feet of renewals |
• | 134,000 square feet of new and expansion leases |
Acquisitions totaled $70.4 million in the second quarter and comprised 371,000 square feet, including:
• | A medical office building adjacent to the Overlake Hospital Medical Center campus in Seattle for $7.8 million. The 13,000 square foot building is 100% leased and adjacent to a 191,000 square foot medical office development completed by the Company in 2011 and a 26,000 square foot medical office building purchased in 2017. |
• | Two buildings adjacent to Catholic Health Initiatives' St. Anthony Hospital campus in Denver for $25.0 million. The 78% leased properties total 188,000 square feet on 13.0 acres of fee simple land. The buildings are adjacent to three on-campus medical office buildings totaling 287,000 square feet developed by the Company in 2011 and 2017, and a 48,000 square foot medical office building the Company purchased in 2015. |
• | A medical office building adjacent to Integris Health's Baptist Medical Center campus in Oklahoma City for $11.4 million. The 83,000 square foot building is 96% leased. |
• | A medical office building on MultiCare Health System's Allenmore Hospital campus in Seattle for $26.2 million. The 91% leased, 87,000 square foot building is attached to both the hospital and a 68,000 square foot medical office building acquired by the Company in 2008. |
Dispositions totaled $55.7 million in the second quarter, including seven properties in Roanoke, Virginia for $46.2 million pursuant to the exercise of a fixed-price purchase option and five skilled nursing facilities in rural Michigan for $9.5 million.
A dividend of $0.30 per common share was declared, which is equal to 75.0% of normalized FFO per share.
Dividends paid as a percentage of funds available for distribution were 98.4% year-to-date.
OTHER ITEMS OF NOTE |
During the second quarter, the Company disposed of 12 properties for$55.7 million at an average cap rate of 15.4% and reinvested the proceeds into five properties at an average cap rate of 5.9%. The partial period net FFO decrease recognized in the second quarter from these transactions was $0.8 million. The third quarter is expected to be impacted by an additional $0.5 million. Total dilution from these transactions is expected to be $1.3 million per quarter.
The Company traditionally experiences an increase in property operating expenses during the third quarter related to seasonal utilities. Over the past three years, third quarter same store cash NOI growth has been sequentially flat as revenue growth has been offset by increases in utility expenses averaging $1.5 million due to seasonally high temperatures.
HEALTHCARE REALTY | 2Q 2018 SUPPLEMENTAL INFORMATION 4 |
Salient Facts |
AS OF JUNE 30, 2018 |
Properties | 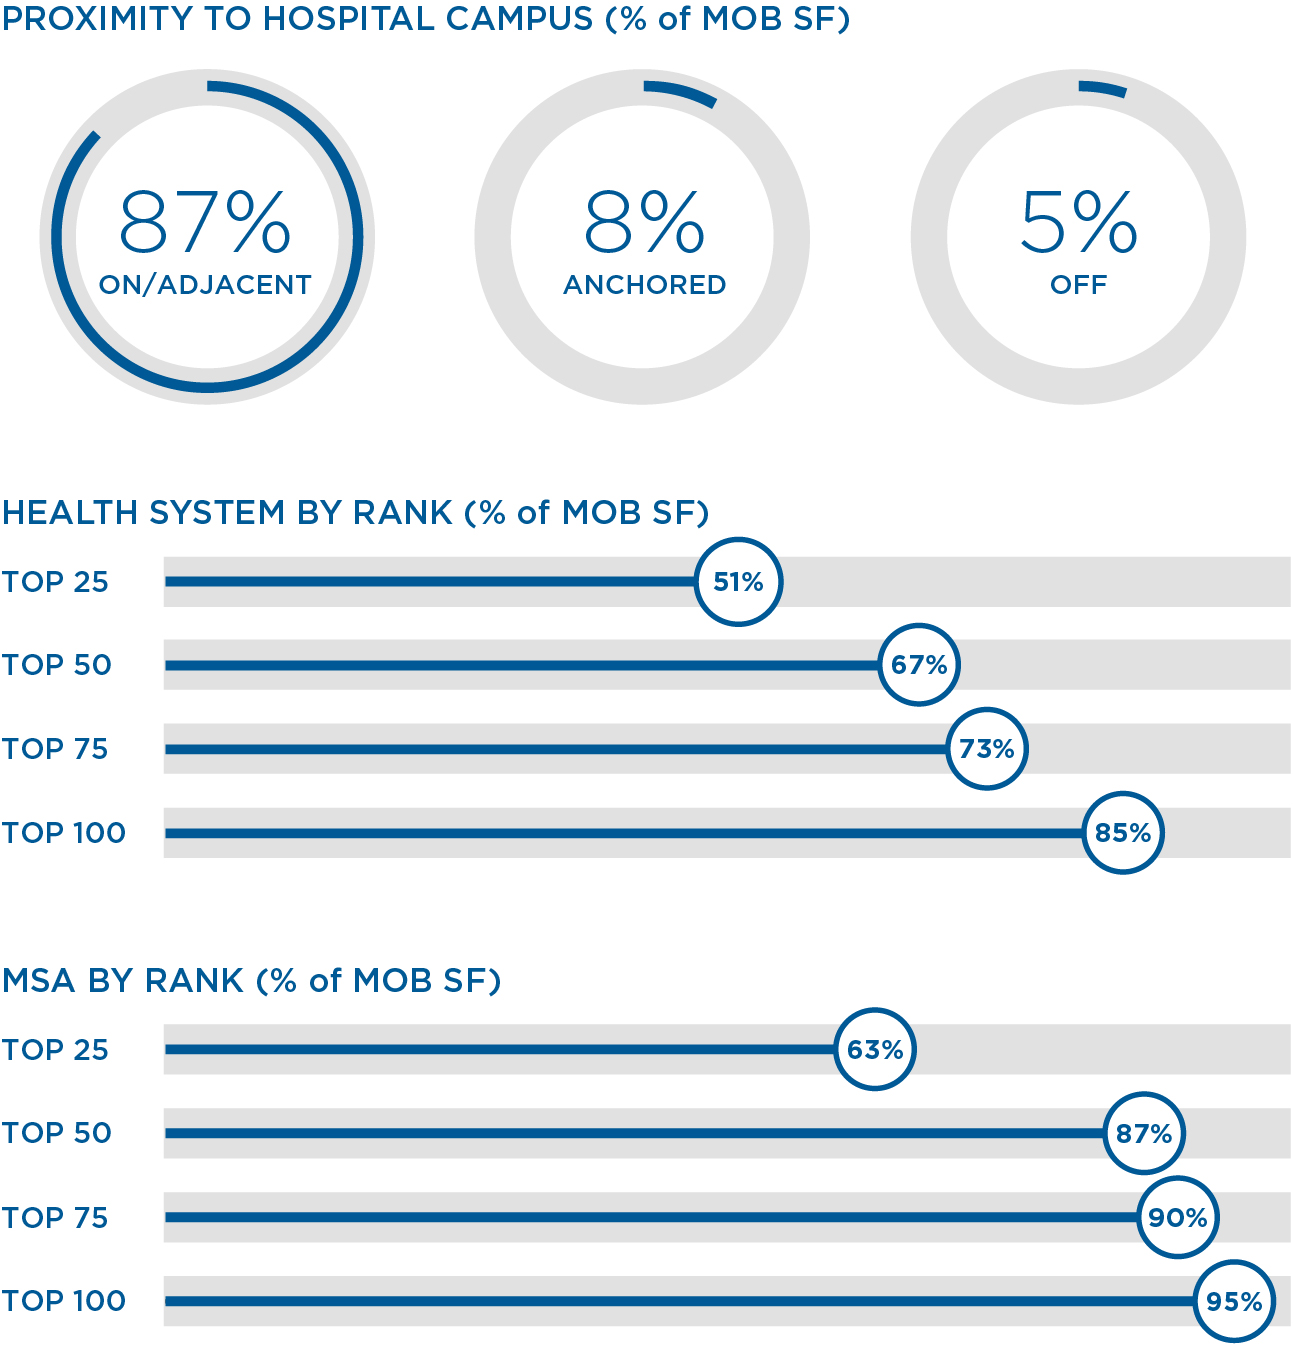 | ||
$3.9B invested in 201 properties | |||
14.9M SF owned in 27 states | |||
11.2M SF managed by Healthcare Realty | |||
92.9% medical office and outpatient | |||
87.2% on/adjacent to hospital campuses | |||
3.2% same store cash NOI growth (TTM) | |||
Capitalization | |||
$5.0B enterprise value as of 7/27/2018 | |||
$3.7B market capitalization as of 7/27/2018 | |||
125.2M shares outstanding | |||
$0.30 quarterly dividend per share | |||
BBB/Baa2 credit rating | |||
27.0% debt to enterprise value at 6/30/2018 | |||
5.1x net debt to adjusted EBITDA | |||
HEALTHCARE REALTY | 2Q 2018 SUPPLEMENTAL INFORMATION 5 |
Corporate Information |
CORPORATE HEADQUARTERS |
Healthcare Realty Trust Incorporated
3310 West End Avenue, Suite 700
Nashville, Tennessee 37203
Phone 615.269.8175 Fax 615.269.8461
communications@healthcarerealty.com
www.healthcarerealty.com
EXECUTIVE OFFICERS |
David R. Emery
Executive Chairman of the Board
Todd J. Meredith
President and Chief Executive Officer
John M. Bryant, Jr.
Executive Vice President and General Counsel
J. Christopher Douglas
Executive Vice President and Chief Financial Officer
Robert E. Hull
Executive Vice President - Investments
ANALYST COVERAGE |
BMO Capital Markets
BTIG, LLC
Cantor Fitzgerald, L.P.
CapitalOne Securities, Inc.
Green Street Advisors, Inc.
J.J.B. Hilliard W.L. Lyons, LLC
J.P. Morgan Securities LLC
Jefferies LLC
JMP Securities LLC
KeyBanc Capital Markets Inc.
Mizuho Securities USA Inc
Morgan Stanley
Stifel, Nicolaus & Company, Inc.
SunTrust Robinson Humphrey, Inc.
Wells Fargo Securities, LLC
BOARD OF DIRECTORS |
David R. Emery
Executive Chairman of the Board
Healthcare Realty Trust Incorporated
Nancy H. Agee
President and Chief Executive Officer
Carilion Clinic
Edward H. Braman
Retired Audit Partner
Ernst & Young LLP
Peter F. Lyle
Vice President
Medical Management Associates, Inc.
Todd J. Meredith
President and Chief Executive Officer
Healthcare Realty Trust Incorporated
Edwin B. Morris III
Retired Managing Director
Morris & Morse Company, Inc.
J. Knox Singleton
Retired Chief Executive Officer
Inova Health System
Bruce D. Sullivan
Retired Audit Partner
Ernst & Young LLP
Christann M. Vasquez
President
Dell Seton Medical Center at University of Texas
Seton Medical Center Austin
Seton Shoal Creek Hospital
HEALTHCARE REALTY | 2Q 2018 SUPPLEMENTAL INFORMATION 6 |
Balance Sheet Information |
DOLLARS IN THOUSANDS, EXCEPT PER SHARE DATA |
ASSETS | ||||||||||||||||
2Q 2018 | 1Q 2018 | 4Q 2017 | 3Q 2017 | 2Q 2017 | ||||||||||||
Real estate properties | ||||||||||||||||
Land | $214,755 | $201,090 | $201,283 | $196,217 | $193,072 | |||||||||||
Buildings, improvements and lease intangibles | 3,668,938 | 3,600,826 | 3,601,460 | 3,400,224 | 3,388,734 | |||||||||||
Personal property | 10,355 | 10,205 | 10,314 | 10,300 | 10,155 | |||||||||||
Construction in progress | 23,102 | 14,990 | 5,458 | 1,138 | — | |||||||||||
Land held for development | 24,633 | 20,123 | 20,123 | 20,123 | 20,123 | |||||||||||
Total real estate properties | 3,941,783 | 3,847,234 | 3,838,638 | 3,628,002 | 3,612,084 | |||||||||||
Less accumulated depreciation and amortization | (959,732 | ) | (924,304 | ) | (897,430 | ) | (888,875 | ) | (864,573 | ) | ||||||
Total real estate properties, net | 2,982,051 | 2,922,930 | 2,941,208 | 2,739,127 | 2,747,511 | |||||||||||
Cash and cash equivalents | 7,414 | 3,796 | 6,215 | 196,981 | 2,033 | |||||||||||
Restricted cash | — | — | — | — | 9,151 | |||||||||||
Assets held for sale, net | 8,788 | 36,118 | 33,147 | 8,772 | 8,767 | |||||||||||
Other assets | 216,437 | 220,576 | 213,015 | 200,824 | 191,036 | |||||||||||
Total assets | $3,214,690 | $3,183,420 | $3,193,585 | $3,145,704 | $2,958,498 | |||||||||||
LIABILITIES AND STOCKHOLDERS' EQUITY | ||||||||||||||||
2Q 2018 | 1Q 2018 | 4Q 2017 | 3Q 2017 | 2Q 2017 | ||||||||||||
Liabilities | ||||||||||||||||
Notes and bonds payable | $1,335,732 | $1,306,951 | $1,283,880 | $1,166,060 | $1,203,146 | |||||||||||
Accounts payable and accrued liabilities | 66,490 | 62,318 | 70,995 | 69,918 | 62,121 | |||||||||||
Liabilities of properties held for sale | 340 | 201 | 93 | 59 | 398 | |||||||||||
Other liabilities | 44,072 | 49,402 | 48,734 | 45,405 | 46,556 | |||||||||||
Total liabilities | 1,446,634 | 1,418,872 | 1,403,702 | 1,281,442 | 1,312,221 | |||||||||||
Commitments and contingencies | ||||||||||||||||
Stockholders' equity | ||||||||||||||||
Preferred stock, $.01 par value; 50,000 shares authorized | — | — | — | — | — | |||||||||||
Common stock, $.01 par value; 300,000 shares authorized | 1,252 | 1,252 | 1,251 | 1,249 | 1,165 | |||||||||||
Additional paid-in capital | 3,178,514 | 3,175,809 | 3,173,429 | 3,173,167 | 2,923,519 | |||||||||||
Accumulated other comprehensive income (loss) | 5 | (639 | ) | (1,299 | ) | (1,274 | ) | (1,316 | ) | |||||||
Cumulative net income attributable to common stockholders | 1,065,256 | 1,027,528 | 1,018,348 | 1,055,499 | 1,052,326 | |||||||||||
Cumulative dividends | (2,476,971 | ) | (2,439,402 | ) | (2,401,846 | ) | (2,364,379 | ) | (2,329,417 | ) | ||||||
Total stockholders' equity | 1,768,056 | 1,764,548 | 1,789,883 | 1,864,262 | 1,646,277 | |||||||||||
Total liabilities and stockholders' equity | $3,214,690 | $3,183,420 | $3,193,585 | $3,145,704 | $2,958,498 | |||||||||||
HEALTHCARE REALTY | 2Q 2018 SUPPLEMENTAL INFORMATION 7 |
Statements of Income Information |
DOLLARS IN THOUSANDS |
2Q 2018 | 1Q 2018 | 4Q 2017 | 3Q 2017 | 2Q 2017 | 1Q 2017 | 4Q 2016 | 3Q 2016 | |||||||||||||||||||
Revenues | ||||||||||||||||||||||||||
Rental income | $109,566 | $110,229 | $105,806 | $105,078 | $103,384 | $102,709 | $103,066 | $101,250 | ||||||||||||||||||
Other operating | 2,068 | 1,895 | 1,943 | 1,947 | 1,934 | 1,935 | 2,316 | 2,492 | ||||||||||||||||||
111,634 | 112,124 | 107,749 | 107,025 | 105,318 | 104,644 | 105,382 | 103,742 | |||||||||||||||||||
Expenses | ||||||||||||||||||||||||||
Property operating | 41,737 | 41,818 | 40,590 | 40,627 | 38,184 | 37,852 | 37,307 | 37,528 | ||||||||||||||||||
General and administrative | 8,373 | 9,101 | 8,272 | 8,022 | 8,005 | 8,694 | 7,622 | 7,859 | ||||||||||||||||||
Acquisition and pursuit costs 1 | 120 | 277 | 302 | 507 | 785 | 586 | 1,085 | 865 | ||||||||||||||||||
Depreciation and amortization | 40,130 | 39,573 | 37,324 | 35,873 | 34,823 | 34,452 | 34,022 | 31,984 | ||||||||||||||||||
Bad debts, net of recoveries | 104 | — | (17 | ) | 4 | 105 | 66 | (13 | ) | (47 | ) | |||||||||||||||
90,464 | 90,769 | 86,471 | 85,033 | 81,902 | 81,650 | 80,023 | 78,189 | |||||||||||||||||||
Other income (expense) | ||||||||||||||||||||||||||
Gain on sales of real estate properties | 29,590 | — | — | (7 | ) | 16,124 | 23,408 | 41,037 | — | |||||||||||||||||
Interest expense | (13,069 | ) | (12,668 | ) | (13,707 | ) | (14,107 | ) | (14,315 | ) | (14,272 | ) | (13,839 | ) | (13,759 | ) | ||||||||||
Loss on extinguishment of debt | — | — | (44,985 | ) | — | — | — | — | — | |||||||||||||||||
Impairment of real estate assets | — | — | 2 | (5,059 | ) | (5 | ) | (323 | ) | (121 | ) | — | ||||||||||||||
Interest and other income, net | 38 | 493 | 261 | 354 | 4 | 38 | 1 | 40 | ||||||||||||||||||
16,559 | (12,175 | ) | (58,429 | ) | (18,819 | ) | 1,808 | 8,851 | 27,078 | (13,719 | ) | |||||||||||||||
Net income (loss) | $37,729 | $9,180 | ($37,151 | ) | $3,173 | $25,224 | $31,845 | $52,437 | $11,834 | |||||||||||||||||
1 | Includes third party and travel costs related to the pursuit of acquisitions and developments. |
HEALTHCARE REALTY | 2Q 2018 SUPPLEMENTAL INFORMATION 8 |
FFO, Normalized FFO, & FAD 1, 2 |
DOLLARS IN THOUSANDS, EXCEPT PER SHARE DATA |
2Q 2018 | 1Q 2018 | 4Q 2017 | 3Q 2017 | 2Q 2017 | 1Q 2017 | 4Q 2016 | 3Q 2016 | |||||||||||||||||||
Net income (loss) | $37,729 | $9,180 | ($37,151 | ) | $3,173 | $25,224 | $31,845 | $52,437 | $11,834 | |||||||||||||||||
Gain on sales of real estate assets | (29,590 | ) | — | — | 7 | (16,124 | ) | (23,408 | ) | (41,037 | ) | — | ||||||||||||||
Impairments of real estate assets | — | — | (2 | ) | 5,059 | 5 | 323 | 121 | — | |||||||||||||||||
Real estate depreciation and amortization | 40,747 | 40,003 | 37,869 | 36,478 | 35,421 | 35,555 | 34,699 | 32,557 | ||||||||||||||||||
FFO | $48,886 | $49,183 | $716 | $44,717 | $44,526 | $44,315 | $46,220 | $44,391 | ||||||||||||||||||
Acquisition and pursuit costs 3 | 120 | 277 | 302 | 507 | 785 | 586 | 915 | 649 | ||||||||||||||||||
Write-off of deferred financing costs upon amendment of credit facilities | — | — | 21 | — | — | — | — | 81 | ||||||||||||||||||
Forfeited earnest money received | — | (466 | ) | — | — | — | — | — | — | |||||||||||||||||
Interest incurred related to the timing of issuance/redemption of senior notes | — | — | 767 | — | — | — | — | — | ||||||||||||||||||
Loss on extinguishment of debt | — | — | 44,985 | — | — | — | — | — | ||||||||||||||||||
Normalized FFO | $49,006 | $48,994 | $46,791 | $45,224 | $45,311 | $44,901 | $47,135 | $45,121 | ||||||||||||||||||
Non-real estate depreciation and amortization | 1,481 | 1,466 | 1,439 | 1,388 | 1,369 | 1,355 | 1,339 | 1,386 | ||||||||||||||||||
Provision for bad debt, net | 104 | — | (17 | ) | 4 | 105 | 66 | (13 | ) | (47 | ) | |||||||||||||||
Straight-line rent receivable, net | (683 | ) | (1,330 | ) | (201 | ) | (1,156 | ) | (1,623 | ) | (1,595 | ) | (1,595 | ) | (1,684 | ) | ||||||||||
Stock-based compensation | 2,593 | 2,822 | 2,531 | 2,429 | 2,453 | 2,614 | 1,949 | 1,851 | ||||||||||||||||||
Non-cash items | 3,495 | 2,958 | 3,752 | 2,665 | 2,304 | 2,440 | 1,680 | 1,506 | ||||||||||||||||||
2nd generation TI | (7,755 | ) | (5,867 | ) | (6,929 | ) | (4,481 | ) | (3,680 | ) | (5,277 | ) | (7,918 | ) | (6,013 | ) | ||||||||||
Leasing commissions paid | (1,947 | ) | (1,851 | ) | (2,705 | ) | (1,826 | ) | (984 | ) | (1,584 | ) | (1,030 | ) | (1,514 | ) | ||||||||||
Capital additions | (7,117 | ) | (4,184 | ) | (6,400 | ) | (4,203 | ) | (5,667 | ) | (2,520 | ) | (4,283 | ) | (5,088 | ) | ||||||||||
FAD | $35,682 | $40,050 | $34,509 | $37,379 | $37,284 | $37,960 | $35,584 | $34,012 | ||||||||||||||||||
Dividends paid | $37,569 | $37,556 | $37,467 | $34,964 | $34,961 | $34,937 | $34,761 | $34,759 | ||||||||||||||||||
FFO per common share - diluted | $0.39 | $0.40 | $0.01 | $0.37 | $0.38 | $0.38 | $0.40 | $0.39 | ||||||||||||||||||
Normalized FFO per common share - diluted | $0.40 | $0.40 | $0.38 | $0.38 | $0.39 | $0.39 | $0.41 | $0.39 | ||||||||||||||||||
FFO weighted average common shares outstanding - diluted 4 | 123,983 | 123,984 | 124,125 | 120,081 | 115,674 | 115,507 | 115,408 | 115,052 | ||||||||||||||||||
1 | Funds from operations (“FFO”) and FFO per share are operating performance measures adopted by the National Association of Real Estate Investment Trusts, Inc. (“NAREIT”). NAREIT defines FFO as the most commonly accepted and reported measure of a REIT’s operating performance equal to “net income (computed in accordance with GAAP), excluding gains (or losses) from sales of property, plus depreciation and amortization (including amortization of leasing commissions), and after adjustments for unconsolidated partnerships and joint ventures.” |
2 | FFO, Normalized FFO and Funds Available for Distribution ("FAD") do not represent cash generated from operating activities determined in accordance with accounting principles generally accepted in the United States of America and is not necessarily indicative of cash available to fund cash needs. FFO, Normalized FFO and FAD should not be considered alternatives to net income attributable to common stockholders as indicators of the Company's operating performance or as alternatives to cash flow as measures of liquidity. |
3 | Acquisition and pursuit costs include third party and travel costs related to the pursuit of acquisitions and developments. |
4 | Diluted weighted average common shares outstanding for the three months ended June 30, 2018 includes the dilutive effect of nonvested share-based awards outstanding of 662,270. The diluted FFO weighted average common shares outstanding decreased in the second quarter as compared to the first quarter because of the impact of the treasury method of accounting applied to the Company's nonvested share-based awards. The Company did not repurchase any outstanding stock in the quarter. |
HEALTHCARE REALTY | 2Q 2018 SUPPLEMENTAL INFORMATION 9 |
Capital Funding & Commitments |
DOLLARS IN THOUSANDS, EXCEPT PER SHARE DATA |
ACQUISITION AND RE/DEVELOPMENT FUNDING | ||||||||||||
2Q 2018 | 1Q 2018 | 4Q 2017 | 3Q 2017 | 2Q 2017 | ||||||||
Acquisitions | $70,350 | $ | — | $246,568 | $16,300 | $50,786 | ||||||
Re/development | 10,998 | 12,658 | 4,010 | 7,196 | 8,940 | |||||||
1st gen. TI & acq. cap. ex. 1 | 4,668 | 1,194 | 1,271 | 1,586 | 1,380 | |||||||
MAINTENANCE CAPITAL EXPENDITURES | ||||||||||||
2Q 2018 | 1Q 2018 | 4Q 2017 | 3Q 2017 | 2Q 2017 | ||||||||
$ Spent | ||||||||||||
2nd generation TI | $7,755 | $5,867 | $6,929 | $4,481 | $3,680 | |||||||
Leasing commissions paid | 1,947 | 1,851 | 2,705 | 1,826 | 984 | |||||||
Capital expenditures | 7,117 | 4,184 | 6,400 | 4,203 | 5,667 | |||||||
$16,819 | $11,902 | $16,034 | $10,510 | $10,331 | ||||||||
% of NOI | ||||||||||||
2nd generation TI | 11.2 | % | 8.5 | % | 10.4 | % | 6.9 | % | 5.6 | % | ||
Leasing commissions paid | 2.8 | % | 2.7 | % | 4.0 | % | 2.8 | % | 1.5 | % | ||
Capital expenditures | 10.3 | % | 6.1 | % | 9.6 | % | 6.5 | % | 8.7 | % | ||
24.3 | % | 17.3 | % | 24.0 | % | 16.2 | % | 15.8 | % | |||
LEASING COMMITMENTS | ||||||||||||
2Q 2018 | 1Q 2018 | 4Q 2017 | 3Q 2017 | 2Q 2017 | ||||||||
Renewals | ||||||||||||
Square feet | 346,539 | 309,665 | 394,721 | 420,603 | 279,738 | |||||||
2nd generation TI/square foot/lease year | $2.48 | $1.86 | $1.67 | $1.38 | $2.30 | |||||||
Leasing commissions/square foot/lease year | $0.57 | $0.56 | $0.59 | $0.28 | $0.39 | |||||||
WALT (in months) 2 | 75.6 | 51.8 | 46.0 | 35.8 | 37.3 | |||||||
New leases | ||||||||||||
Square feet | 95,542 | 140,884 | 111,788 | 109,038 | 134,590 | |||||||
2nd generation TI/square foot/lease year | $4.04 | $5.42 | $4.74 | $3.92 | $2.10 | |||||||
Leasing commissions/square foot/lease year | $0.84 | $1.06 | $0.92 | $0.46 | $0.47 | |||||||
WALT (in months) 2 | 63.8 | 93.8 | 90.7 | 68.4 | 103.8 | |||||||
All | ||||||||||||
Square feet | 442,081 | 450,549 | 506,509 | 529,641 | 414,328 | |||||||
2nd generation TI/square foot/lease year | $2.77 | $3.47 | $2.77 | $2.22 | $2.18 | |||||||
Leasing commissions/square foot/lease year | $0.62 | $0.79 | $0.71 | $0.34 | $0.44 | |||||||
Leasing commitments as a % of annual net rent | 15.8 | % | 20.7 | % | 16.0 | % | 12.3 | % | 12.8 | % | ||
WALT (in months) 2 | 73.0 | 64.9 | 55.9 | 42.6 | 58.9 | |||||||
1 | Planned capital expenditures for acquisitions include expected near-term fundings that were contemplated as part of the acquisition. |
2 | WALT = weighted average lease term. |
HEALTHCARE REALTY | 2Q 2018 SUPPLEMENTAL INFORMATION 10 |
Debt Metrics |
DOLLARS IN THOUSANDS |
SUMMARY OF INDEBTEDNESS AS OF JUNE 30, 2018 | |||||||||
INTEREST EXPENSE | PRINCIPAL BALANCE | BALANCE 1 | MONTHS TO MATURITY | CONTRACTUAL RATE | EFFECTIVE RATE | ||||
Senior notes due 2023 | $2,395 | $250,000 | $247,909 | 58 | 3.75 | % | 3.95 | % | |
Senior notes due 2025 2 | 2,469 | 250,000 | 248,160 | 82 | 3.88 | % | 4.08 | % | |
Senior notes due 2028 | 2,771 | 300,000 | 294,977 | 114 | 3.63 | % | 3.84 | % | |
Total senior notes outstanding | $7,635 | $800,000 | $791,046 | 86 | 3.74 | % | 3.95 | % | |
$700 million unsecured credit facility due 2020 | 1,642 | 235,000 | 235,000 | 25 | LIBOR + 1.00% | 3.09 | % | ||
Unsecured term loan facility due 2022 3 | 1,230 | 150,000 | 149,081 | 54 | LIBOR + 1.10% | 3.33 | % | ||
Mortgage notes payable, net | 1,886 | 160,409 | 160,605 | 62 | 5.06 | % | 4.83 | % | |
Total outstanding notes and bonds payable | $12,393 | $1,345,409 | $1,335,732 | 69 | 3.74 | % | 3.84 | % | |
Interest cost capitalization | (285) | ||||||||
Unsecured credit facility fee and deferred financing costs | 961 | ||||||||
Total quarterly consolidated interest expense | $13,069 | ||||||||
SELECTED FINANCIAL DEBT COVENANTS 4 | ||||
CALCULATION | REQUIREMENT | TTM ENDED 6/30 | ||
Revolving credit facility and term loan | ||||
Leverage ratio | Total debt/total capital | Not greater than 60% | 33.1 | % |
Secured leverage ratio | Total secured debt/total capital | Not greater than 30% | 3.9 | % |
Unencumbered leverage ratio | Unsecured debt/unsecured real estate | Not greater than 60% | 33.6 | % |
Fixed charge coverage ratio | EBITDA/fixed charges | Not less than 1.50x | 4.1x | |
Unsecured coverage ratio | Unsecured EBITDA/unsecured interest | Not less than 1.75x | 4.7x | |
Construction and development | CIP/total assets | Not greater than 15% | 0.7 | % |
Asset investments | Mortgages & unimproved land/total assets | Not greater than 20% | 1.0 | % |
Senior notes 5 | ||||
Incurrence of total debt | Total debt/total assets | Not greater than 60% | 32.9 | % |
Incurrence of debt secured by any lien | Secured debt/total assets | Not greater than 40% | 3.9 | % |
Maintenance of total unsecured assets | Unencumbered assets/unsecured debt | Not less than 150% | 309.4 | % |
Debt service coverage | EBITDA/interest expense | Not less than 1.5x | 4.7x | |
Other | ||||
Net debt to adjusted EBITDA 6 | Net debt (debt less cash)/adjusted EBITDA | Not required | 5.1x | |
Debt to enterprise value 7 | Debt/enterprise value | Not required | 27.0 | % |
1 | Balances are reflected net of discounts and deferred financing costs and include premiums. |
2 | The effective interest rate includes the impact of the $1.7 million settlement of a forward-starting interest rate swap that is included in accumulated other comprehensive income on the Company's Condensed Consolidated Balance Sheets. |
3 | The effective interest rate includes the impact of interest rate swaps on $25.0 million and $50.0 million of the outstanding balance at a rate of 2.18% and 2.46%, respectively (plus the applicable margin rate, currently 110 basis points). |
4 | Does not include all financial and non-financial covenants and restrictions that are required by the Company's various debt agreements. |
5 | The senior note covenants calculations apply to the senior notes due 2025 and 2028. The senior notes due 2023 have similar covenants but contain a less restrictive definition of total assets. |
6 | Adjusted EBITDA is based on the current quarter results, annualized. See page 23 for a reconciliation of adjusted EBITDA. |
7 | Based on the closing price of $29.08 on June 30, 2018 and 125,233,695 shares outstanding. |
HEALTHCARE REALTY | 2Q 2018 SUPPLEMENTAL INFORMATION 11 |
Investment Activity |
DOLLARS IN THOUSANDS |
ACQUISITION ACTIVITY | ||||||||||
LOCATION | TYPE 1 | MILES TO CAMPUS | HEALTH SYSTEM AFFILIATION | CLOSING | PURCHASE PRICE | SQUARE FEET | LEASED % | CAP RATE 2 | ||
Seattle, WA | MOB | 0.04 | Overlake Health | 5/4/2018 | $7,750 | 13,314 | 100 | % | 5.0 | % |
Denver, CO | MOB | 0.06 | CHI | 5/18/2018 | 12,068 | 93,992 | 70 | % | 5.5 | % |
Denver, CO | OFC | 0.06 | CHI | 5/18/2018 | 12,932 | 93,869 | 87 | % | 7.3 | % |
Oklahoma City, OK | MOB | 0.10 | Integris Health | 5/21/2018 | 11,400 | 82,647 | 96 | % | 5.9 | % |
Seattle, WA | MOB | 0.00 | MultiCare Health | 6/29/2018 | 26,200 | 86,942 | 91 | % | 5.7 | % |
2018 acquisition activity | $70,350 | 370,764 | 86 | % | 5.9 | % | ||||
DISPOSITION ACTIVITY | ||||||||||
LOCATION | TYPE 1 | MILES TO CAMPUS | HEALTH SYSTEM AFFILIATION | CLOSING | SALES PRICE | SQUARE FEET | LEASED % | CAP RATE 3 | ||
Virginia 4 | MOB, OFC | Various | HCA | 4/26/2018 | $46,236 | 460,881 | 75 | % | 13.3 | % |
Michigan 5 | SNF | NA | NA | 6/27/2018 | 9,516 | 121,672 | 100 | % | 25.5 | % |
2018 disposition activity | $55,752 | 582,553 | 80 | % | 15.4 | % | ||||
RE/DEVELOPMENT ACTIVITY | |||||||||||
LOCATION | TYPE 1 | CAMPUS LOCATION | SQUARE FEET | BUDGET | 2Q 2018 FUNDING | TOTAL THRU 6/30/2018 | REMAINING FUNDINGS | AGGREGATE LEASED % | COMPLETION DATE | ||
Same store redevelopment | |||||||||||
Charlotte, NC 6 | MOB | ON | 204,000 | $12,000 | $2,930 | $7,936 | $4,064 | 87 | % | Q1 2019 | |
Development | |||||||||||
Seattle, WA | MOB | ON | 151,000 | 64,120 | 5,182 | 15,467 | 48,653 | 60 | % | Q2 2019 | |
2018 re/development activity | 355,000 | $76,120 | $8,112 | $23,403 | $52,717 | 76 | % | ||||
HISTORICAL INVESTMENT ACTIVITY | ||||||||||||||
ACQUISITIONS 7 | MORTGAGE FUNDING | CONSTRUCTION MORTGAGE FUNDING | RE/DEVELOPMENT FUNDING | TOTAL INVESTMENTS | DISPOSITIONS | |||||||||
2013 | $216,956 | $— | $58,731 | $— | $275,687 | $101,910 | ||||||||
2014 | 85,077 | 1,900 | 1,244 | 4,384 | 92,605 | 34,840 | ||||||||
2015 | 187,216 | — | — | 27,859 | 215,075 | 157,975 | ||||||||
2016 | 241,939 | — | — | 45,343 | 287,282 | 94,683 | ||||||||
2017 | 327,167 | — | — | 32,305 | 359,472 | 122,700 | ||||||||
YTD 2018 | 70,350 | — | — | 23,656 | 94,006 | 55,752 | ||||||||
Average (2013-2017) | 211,671 | 380 | 11,995 | 21,978 | 246,024 | 102,422 | ||||||||
% of Average | 86.0 | % | 0.2 | % | 4.9 | % | 8.9 | % | 100.0 | % | ||||
1 | MOB = Medical office building; OFC = Office; SNF = Skilled nursing facility. |
2 | For acquisitions, cap rate represents the forecasted first year cash NOI / purchase price plus acquisition costs and expected capital additions. |
3 | For dispositions, cap rate represents the next twelve month forecasted cash NOI / sales price. |
4 | Includes five single-tenant net lease medical office buildings and two multi-tenant buildings. |
5 | Includes five single-tenant net lease skilled nursing facilities. Sales price includes $0.5 million of forfeited earnest money from a prior terminated transaction. |
6 | Redevelopment project is a 38,000 square foot expansion to an existing medical office building. |
7 | Net of mortgage notes receivable payoffs upon acquisition. |
HEALTHCARE REALTY | 2Q 2018 SUPPLEMENTAL INFORMATION 12 |
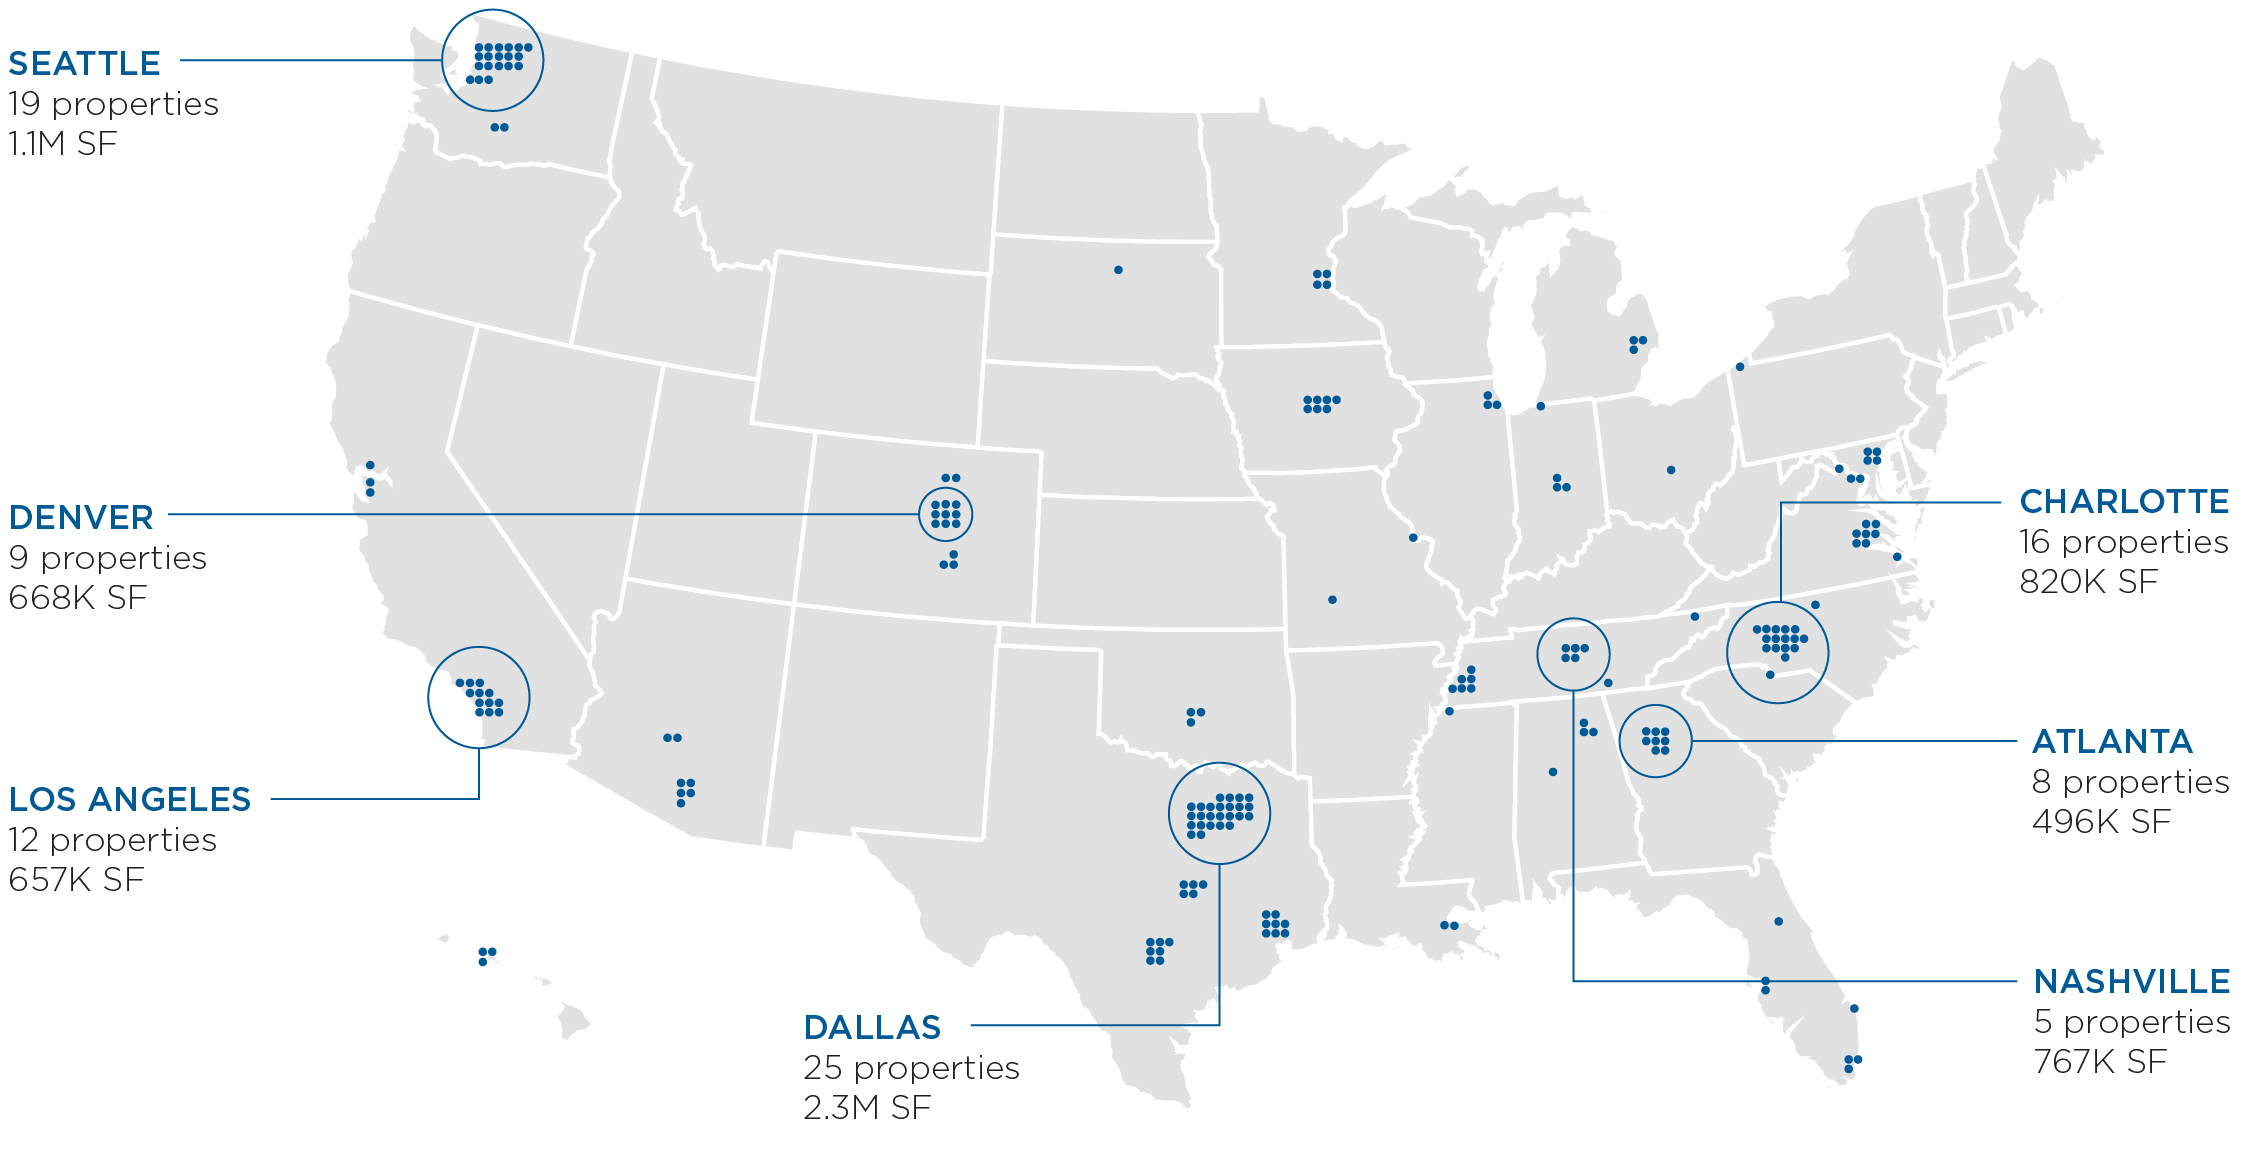
Portfolio |
DOLLARS IN THOUSANDS |
MARKETS (BY SQUARE FEET) | ||||||||||||||||||||
MOB 92.9% | NON-MOB 7.1% | |||||||||||||||||||
MARKET | MSA RANK | INVESTMENT 1 | COUNT | MULTI-TENANT | SINGLE-TENANT | INPATIENT REHAB 2 | INPATIENT SURGICAL | OFFICE | TOTAL | % OF TOTAL | ||||||||||
Dallas, TX | 4 | $479,046 | 25 | 2,004,574 | 156,245 | 145,365 | 2,306,184 | 15.5 | % | |||||||||||
Seattle, WA | 15 | 467,037 | 19 | 1,049,651 | 67,510 | 1,117,161 | 7.5 | % | ||||||||||||
Charlotte, NC | 22 | 168,998 | 16 | 820,457 | 820,457 | 5.5 | % | |||||||||||||
Nashville, TN | 36 | 160,887 | 5 | 766,523 | 766,523 | 5.2 | % | |||||||||||||
Denver, CO | 19 | 153,943 | 9 | 540,284 | 34,068 | 93,869 | 668,221 | 4.5 | % | |||||||||||
Los Angeles, CA | 2 | 183,506 | 12 | 594,163 | 63,000 | 657,163 | 4.4 | % | ||||||||||||
Houston, TX | 5 | 132,014 | 8 | 533,857 | 57,170 | 591,027 | 4.0 | % | ||||||||||||
Richmond, VA | 45 | 147,168 | 7 | 548,801 | 548,801 | 3.7 | % | |||||||||||||
Des Moines, IA | 89 | 134,621 | 7 | 197,994 | 181,961 | 152,655 | 532,610 | 3.6 | % | |||||||||||
Memphis, TN | 42 | 95,116 | 7 | 515,876 | 515,876 | 3.5 | % | |||||||||||||
Atlanta, GA | 9 | 188,807 | 8 | 476,054 | 19,732 | 495,786 | 3.3 | % | ||||||||||||
San Antonio, TX | 24 | 95,436 | 7 | 483,811 | 483,811 | 3.3 | % | |||||||||||||
Indianapolis, IN | 34 | 75,099 | 3 | 382,695 | 382,695 | 2.6 | % | |||||||||||||
Austin, TX | 31 | 105,087 | 5 | 375,333 | 375,333 | 2.5 | % | |||||||||||||
Oklahoma City, OK | 41 | 120,592 | 3 | 151,507 | 200,000 | 351,507 | 2.3 | % | ||||||||||||
Washington, DC | 6 | 100,814 | 4 | 348,998 | 348,998 | 2.3 | % | |||||||||||||
Chicago, IL | 3 | 86,188 | 3 | 337,917 | 337,917 | 2.3 | % | |||||||||||||
Honolulu, HI | 54 | 141,948 | 3 | 298,427 | 298,427 | 2.0 | % | |||||||||||||
San Francisco, CA | 11 | 117,474 | 3 | 286,270 | 286,270 | 1.9 | % | |||||||||||||
Miami, FL | 8 | 56,809 | 4 | 241,980 | 241,980 | 1.6 | % | |||||||||||||
Colorado Springs, CO | 79 | 52,340 | 3 | 241,224 | 241,224 | 1.6 | % | |||||||||||||
Other (22 markets) | 625,497 | 40 | 1,840,048 | 322,482 | 165,123 | 186,000 | 2,513,653 | 16.9 | % | |||||||||||
Total | $3,888,427 | 201 | 13,036,444 | 791,685 | 262,191 | 342,245 | 449,059 | 14,881,624 | 100.0 | % | ||||||||||
Number of properties | 180 | 11 | 4 | 2 | 4 | 201 | ||||||||||||||
% of square feet | 87.6 | % | 5.3 | % | 1.8 | % | 2.3 | % | 3.0 | % | 100.0 | % | ||||||||
Investment 1 | $3,287,871 | $239,384 | $53,605 | $208,725 | $98,842 | $3,888,427 | ||||||||||||||
Quarterly cash NOI | $55,911 | $4,831 | $1,665 | $4,698 | $1,348 | $68,453 | ||||||||||||||
% of cash NOI | 81.6 | % | 7.1 | % | 2.4 | % | 6.9 | % | 2.0 | % | 100.0 | % | ||||||||
BY BUILDING TYPE | |||||||||
MOB TOTAL | MULTI-TENANT | SINGLE-TENANT | TOTAL | ||||||
Number of properties | 191 | 184 | 17 | 201 | |||||
Square feet | 13,828,129 | 13,485,503 | 1,396,121 | 14,881,624 | |||||
% of square feet | 92.9 | % | 90.6 | % | 9.4 | % | 100.0 | % | |
Investment 1 | $3,527,255 | $3,386,713 | $501,714 | $3,888,427 | |||||
Quarterly cash NOI | $60,742 | $57,259 | $11,194 | $68,453 | |||||
% of cash NOI | 88.7 | % | 83.6 | % | 16.4 | % | 100.0 | % | |
1 | Excludes gross assets held for sale, land held for development, construction in progress and corporate property. |
2 | Includes inpatient rehab facilities, a behavioral health facility and a skilled nursing facility. |
HEALTHCARE REALTY | 2Q 2018 SUPPLEMENTAL INFORMATION 13 |
Associated Health Systems 1 |
MOB PORTFOLIO (BY SQUARE FEET) | ||||||||||||||||
ASSOCIATED 94.9% 2 | ||||||||||||||||
HEALTH SYSTEM | SYSTEM RANK 3 | CREDIT RATING | ON | ADJACENT 4 | ANCHORED 5 | OFF CAMPUS | TOTAL MOB | % OF TOTAL MOB | ||||||||
Baylor Scott & White Health | 19 | AA-/Aa3 | 1,834,256 | 142,759 | 163,188 | — | 2,140,203 | 15.5 | % | |||||||
Ascension Health | 3 | AA+/Aa2 | 1,065,798 | 156,328 | — | — | 1,222,126 | 8.8 | % | |||||||
Catholic Health Initiatives | 8 | BBB+/Baa1 | 807,182 | 274,117 | 95,486 | — | 1,176,785 | 8.5 | % | |||||||
Atrium Health | 33 | AA-/Aa3 | 353,537 | 98,066 | 313,513 | — | 765,116 | 5.5 | % | |||||||
Tenet Healthcare Corporation | 6 | B/B2 | 621,077 | 67,790 | 30,096 | — | 718,963 | 5.2 | % | |||||||
Bon Secours Health System | 79 | A/A2 | 548,801 | — | — | — | 548,801 | 4.0 | % | |||||||
WellStar Health System | 83 | A/A2 | 476,054 | — | — | — | 476,054 | 3.4 | % | |||||||
Baptist Memorial Health Care | 92 | BBB+/-- | 424,306 | — | 39,345 | — | 463,651 | 3.4 | % | |||||||
HCA | 2 | BB+/Ba2 | 177,340 | 177,155 | 78,305 | — | 432,800 | 3.1 | % | |||||||
Indiana University Health | 26 | AA/Aa2 | 280,129 | 102,566 | — | — | 382,695 | 2.8 | % | |||||||
University of Colorado Health | 66 | AA-/Aa3 | 150,291 | 161,099 | 33,850 | — | 345,240 | 2.5 | % | |||||||
Trinity Health | 5 | AA-/Aa3 | 267,952 | 73,331 | — | — | 341,283 | 2.5 | % | |||||||
Providence St. Joseph Health | 4 | AA-/Aa3 | 176,854 | 129,181 | — | — | 306,035 | 2.2 | % | |||||||
UW Medicine (Seattle) | 49 | AA+/Aaa | 194,536 | 102,540 | — | — | 297,076 | 2.1 | % | |||||||
Medstar Health | 37 | A/A2 | 241,739 | — | — | — | 241,739 | 1.7 | % | |||||||
Advocate Health Care | 25 | AA+/Aa2 | 142,955 | 95,436 | — | — | 238,391 | 1.7 | % | |||||||
Overlake Health System | 299 | A/A2 | 191,051 | 39,659 | — | — | 230,710 | 1.7 | % | |||||||
Memorial Hermann | 44 | A+/A1 | — | 206,090 | — | — | 206,090 | 1.5 | % | |||||||
Community Health | 9 | CCC+/Caa2 | 201,574 | — | — | — | 201,574 | 1.5 | % | |||||||
Mercy (St. Louis) | 35 | AA-/Aa3 | — | — | 200,000 | — | 200,000 | 1.4 | % | |||||||
MultiCare Health System | 105 | AA-/Aa3 | 154,452 | 33,169 | — | — | 187,621 | 1.4 | % | |||||||
Other (20 credit rated systems) | 1,034,511 | 619,977 | 110,339 | — | 1,764,827 | 12.8 | % | |||||||||
Subtotal - credit rated 6 | 9,344,395 | 2,479,263 | 1,064,122 | — | 12,887,780 | 93.2 | % | |||||||||
Non-credit rated | 238,710 | — | — | 701,639 | 940,349 | 6.8 | % | |||||||||
Total | 9,583,105 | 2,479,263 | 1,064,122 | 701,639 | 13,828,129 | 100.0 | % | |||||||||
% of total | 69.3 | % | 17.9 | % | 7.7 | % | 5.1 | % | ||||||||
1 | Excludes mortgage notes receivable, construction in progress and assets classified as held for sale. |
2 | Includes total square feet of buildings located on-campus, adjacent and off-campus/anchored by healthcare systems. |
3 | Ranked by revenue based on Modern Healthcare's Healthcare Systems Financials Database. |
4 | The Company defines an adjacent property as being no more than 0.25 miles from a hospital campus. |
5 | Includes buildings where health systems lease 40% or more of the property. |
6 | Based on square footage, 83.4% is associated with an investment-grade rated healthcare provider. |
HEALTHCARE REALTY | 2Q 2018 SUPPLEMENTAL INFORMATION 14 |
Top Tenants 1 |
LEASED SQUARE FEET | ||||||||||||||||
HEALTH SYSTEM | SYSTEM RANK 2 | CREDIT RATING | # OF PROPERTIES | # OF LEASES | MOB | INPATIENT | TOTAL | % OF TOTAL LEASED | % OF TTM REVENUE | |||||||
Baylor Scott & White Health | 19 | AA-/Aa3 | 20 | 165 | 1,017,353 | 156,245 | 1,173,598 | 9.0 | % | 9.6 | % | |||||
Atrium Health | 33 | AA-/Aa3 | 16 | 80 | 611,304 | — | 611,304 | 4.7 | % | 4.2 | % | |||||
Mercy (St. Louis) | 35 | AA-/Aa3 | 2 | 2 | 200,000 | 186,000 | 386,000 | 2.9 | % | 4.2 | % | |||||
Catholic Health Initiatives | 8 | BBB+/Baa1 | 16 | 67 | 530,091 | — | 530,091 | 4.1 | % | 3.7 | % | |||||
Ascension Health | 3 | AA+/Aa2 | 11 | 66 | 382,719 | — | 382,719 | 2.9 | % | 2.5 | % | |||||
Bon Secours Health System | 79 | A/A2 | 7 | 63 | 274,927 | — | 274,927 | 2.1 | % | 2.1 | % | |||||
Indiana University Health | 26 | AA/Aa2 | 3 | 39 | 261,159 | — | 261,159 | 2.0 | % | 2.0 | % | |||||
Tenet Healthcare Corporation | 6 | B/B2 | 14 | 37 | 152,865 | 63,000 | 215,865 | 1.6 | % | 1.7 | % | |||||
UW Medicine (Seattle) | 49 | AA+/Aaa | 5 | 23 | 177,995 | — | 177,995 | 1.4 | % | 1.7 | % | |||||
University of Colorado Health | 66 | AA-/Aa3 | 5 | 13 | 160,156 | — | 160,156 | 1.2 | % | 1.4 | % | |||||
WellStar Health System | 83 | A/A2 | 7 | 42 | 268,984 | — | 268,984 | 2.1 | % | 1.2 | % | |||||
34.0 | % | 34.3 | % | |||||||||||||
1 | Excludes mortgage notes receivable, construction in progress and assets classified as held for sale. |
2 | Includes total square feet of buildings located on-campus, adjacent and off-campus/anchored by healthcare systems. |
HEALTHCARE REALTY | 2Q 2018 SUPPLEMENTAL INFORMATION 15 |
MOB Proximity to Hospital 1, 2 |
MEDICAL OFFICE BUILDINGS BY LOCATION | |||||||||||||
2Q 2018 | 1Q 2018 | 4Q 2017 | 3Q 2017 | 2Q 2017 | 1Q 2017 | ||||||||
On campus | 69.3 | % | 69.1 | % | 69.1 | % | 68.4 | % | 67.9 | % | 67.4 | % | |
Adjacent to campus 3 | 17.9 | % | 17.6 | % | 17.6 | % | 17.5 | % | 17.4 | % | 17.7 | % | |
Total on/adjacent | 87.2 | % | 86.7 | % | 86.7 | % | 85.9 | % | 85.3 | % | 85.1 | % | |
Off campus - anchored by health system 4 | 7.7 | % | 7.7 | % | 7.7 | % | 8.4 | % | 8.4 | % | 8.5 | % | |
Off campus | 5.1 | % | 5.6 | % | 5.6 | % | 5.7 | % | 6.3 | % | 6.4 | % | |
100.0 | % | 100.0 | % | 100.0 | % | 100.0 | % | 100.0 | % | 100.0 | % | ||
DISTANCE TO HOSPITAL CAMPUS | |||||||||||||
GROUND LEASE PROPERTIES | |||||||||||||
GREATER THAN | LESS THAN OR EQUAL TO | # OF PROPERTIES | SQUARE FEET | % OF TOTAL | CUMULATIVE % | CAMPUS PROXIMITY | SQUARE FEET | % OF TOTAL | |||||
0.00 | 123 | 9,583,105 | 69.3 | % | 69.3 | % | On campus | 7,536,206 | 89.7 | % | |||
0.00 | 250 yards | 22 | 1,345,175 | 9.7 | % | 79.0 | % | Adjacent 3 | 80,525 | 1.0 | % | ||
250 yards | 0.25 miles | 20 | 1,134,088 | 8.2 | % | 87.2 | % | 120,036 | 1.4 | % | |||
0.25 miles | 0.50 | 1 | 124,925 | 0.9 | % | 88.1 | % | Off campus | 124,925 | 1.5 | % | ||
0.50 | 1.00 | 2 | 280,873 | 2.1 | % | 90.2 | % | — | — | % | |||
1.00 | 2.00 | 6 | 590,339 | 4.3 | % | 94.5 | % | 319,446 | 3.8 | % | |||
2.00 | 5.00 | 8 | 338,246 | 2.4 | % | 96.9 | % | 13,818 | 0.2 | % | |||
5.00 | 10.00 | 5 | 275,189 | 2.0 | % | 98.9 | % | 205,631 | 2.4 | % | |||
10.00 | 4 | 156,189 | 1.1 | % | 100.0 | % | — | — | % | ||||
Total | 191 | 13,828,129 | 100.0 | % | 8,400,587 | 100.0 | % | ||||||
1 | Excludes mortgage notes receivable, construction in progress and assets classified as held for sale. |
2 | Proximity to hospital campus includes acute care hospitals with inpatient beds. The Company does not consider inpatient rehab hospitals (IRFs), skilled nursing facilities (SNFs) or long-term acute care hospitals (LTACHs) to be hospital campuses for distance calculations. |
3 | The Company defines an adjacent property as being no more than 0.25 miles from a hospital campus. |
4 | Includes buildings where health systems lease 40% or more of the property. |
HEALTHCARE REALTY | 2Q 2018 SUPPLEMENTAL INFORMATION 16 |
Lease Maturity, Lease & Building Size 1 |
LEASE MATURITY SCHEDULE | ||||||||||||||||
MULTI-TENANT | SINGLE-TENANT | TOTAL | ||||||||||||||
# OF LEASES | SQUARE FEET | % OF SQUARE FEET | # OF LEASES | SQUARE FEET | % OF SQUARE FEET | # OF LEASES | SQUARE FEET | % OF TOTAL SQUARE FEET | % OF BASE REVENUE 2 | |||||||
2018 | 371 | 1,269,348 | 10.9 | % | — | — | — | % | 371 | 1,269,348 | 9.7 | % | 10.0 | % | ||
2019 | 597 | 2,253,434 | 19.3 | % | 2 | 153,123 | 11.0 | % | 599 | 2,406,557 | 18.4 | % | 18.1 | % | ||
2020 | 466 | 1,733,894 | 14.8 | % | 1 | 83,318 | 6.0 | % | 467 | 1,817,212 | 13.9 | % | 13.8 | % | ||
2021 | 368 | 1,290,662 | 11.0 | % | — | — | — | % | 368 | 1,290,662 | 9.8 | % | 9.6 | % | ||
2022 | 311 | 1,352,072 | 11.6 | % | 1 | 58,285 | 4.2 | % | 312 | 1,410,357 | 10.8 | % | 10.6 | % | ||
2023 | 235 | 1,077,436 | 9.2 | % | — | — | — | % | 235 | 1,077,436 | 8.2 | % | 8.0 | % | ||
2024 | 153 | 856,424 | 7.4 | % | — | — | — | % | 153 | 856,424 | 6.5 | % | 6.1 | % | ||
2025 | 83 | 609,943 | 5.2 | % | 2 | 91,561 | 6.5 | % | 85 | 701,504 | 5.4 | % | 5.2 | % | ||
2026 | 68 | 235,766 | 2.0 | % | — | — | — | % | 68 | 235,766 | 1.8 | % | 1.8 | % | ||
2027 | 60 | 292,940 | 2.5 | % | 2 | 342,245 | 24.5 | % | 62 | 635,185 | 4.9 | % | 7.4 | % | ||
Thereafter | 117 | 718,750 | 6.1 | % | 9 | 667,589 | 47.8 | % | 126 | 1,386,339 | 10.6 | % | 9.4 | % | ||
Total leased | 2,829 | 11,690,669 | 86.7 | % | 17 | 1,396,121 | 100.0 | % | 2,846 | 13,086,790 | 87.9 | % | 100.0 | % | ||
Total building | 13,485,503 | 100.0 | % | 1,396,121 | 100.0 | % | 14,881,624 | 100.0 | % | |||||||
WALTR (months) 3 | 42.6 | 103.2 | 49.1 | |||||||||||||
WALT (months) 3 | 89.9 | 163.2 | 97.8 | |||||||||||||
# OF LEASES BY SIZE | BY BUILDING SIZE | ||||||||||
LEASED SQUARE FEET | MULTI-TENANT 4 | SINGLE-TENANT | BUILDING SQUARE FEET | % OF TOTAL | TOTAL SQUARE FOOTAGE | AVERAGE SQUARE FEET | # OF PROPERTIES | ||||
0 - 2,500 | 1,501 | — | >100,000 | 41.3 | % | 6,158,609 | 146,634 | 42 | |||
2,501 - 5,000 | 700 | — | <100,000 and >75,000 | 26.8 | % | 3,982,683 | 86,580 | 46 | |||
5,001 - 7,500 | 221 | — | <75,000 and >50,000 | 17.1 | % | 2,540,775 | 63,519 | 40 | |||
7,501 - 10,000 | 139 | — | <50,000 | 14.8 | % | 2,199,557 | 30,131 | 73 | |||
10,001 + | 268 | 17 | Total | 100.0 | % | 14,881,624 | 74,038 | 201 | |||
Total Leases | 2,829 | 17 | |||||||||
1 | Excludes mortgage notes receivable, land held for development, construction in progress, corporate property and assets classified as held for sale. |
2 | Represents the current annualized minimum rents on in-place leases, excluding the impact of potential lease renewals and sponsor support payments under financial support arrangements and straight-line rent. |
3 | WALTR = weighted average lease term remaining; WALT = weighted average lease term. |
4 | The average lease size in the multi-tenant properties is 4,132 square feet. |
HEALTHCARE REALTY | 2Q 2018 SUPPLEMENTAL INFORMATION 17 |
Historical Occupancy 1 |
DOLLARS IN THOUSANDS |
SAME STORE PROPERTIES | |||||||||||
2Q 2018 | 1Q 2018 | 4Q 2017 | 3Q 2017 | 2Q 2017 | |||||||
Multi-tenant | |||||||||||
Investment | $2,738,045 | $2,708,228 | $2,665,547 | $2,547,282 | $2,492,031 | ||||||
Number of properties | 144 | 143 | 142 | 138 | 137 | ||||||
Total building square feet | 11,221,175 | 11,236,857 | 11,203,468 | 10,937,805 | 10,764,672 | ||||||
Period end % occupied | 88.3 | % | 87.9 | % | 88.0 | % | 88.0 | % | 88.0 | % | |
Single-tenant | |||||||||||
Investment | $481,727 | $473,636 | $486,602 | $524,444 | $524,444 | ||||||
Number of properties | 15 | 14 | 19 | 24 | 24 | ||||||
Total building square feet | 1,341,781 | 1,306,362 | 1,428,034 | 1,762,488 | 1,762,488 | ||||||
Period end % occupied | 100.0 | % | 100.0 | % | 100.0 | % | 100.0 | % | 100.0 | % | |
Total same store properties | |||||||||||
Investment | $3,219,772 | $3,181,864 | $3,152,149 | $3,071,726 | $3,016,475 | ||||||
Number of properties | 159 | 157 | 161 | 162 | 161 | ||||||
Total building square feet | 12,562,956 | 12,543,219 | 12,631,502 | 12,700,293 | 12,527,160 | ||||||
Period end % occupied | 89.6 | % | 89.2 | % | 89.4 | % | 89.7 | % | 89.7 | % | |
PROPERTIES NOT IN SAME STORE | |||||||||||
2Q 2018 | 1Q 2018 | 4Q 2017 | 3Q 2017 | 2Q 2017 | |||||||
Acquisitions 2 | |||||||||||
Investment | $557,434 | $526,129 | $563,499 | $428,579 | $445,164 | ||||||
Number of properties | 27 | 24 | 25 | 18 | 19 | ||||||
Total building square feet | 1,644,315 | 1,383,200 | 1,452,912 | 1,056,118 | 1,113,659 | ||||||
Period end % occupied | 92.7 | % | 92.7 | % | 93.0 | % | 92.3 | % | 94.0 | % | |
Development completions | |||||||||||
Investment | $28,970 | $31,929 | $31,627 | $30,537 | $26,967 | ||||||
Number of properties | 1 | 2 | 2 | 2 | 2 | ||||||
Total building square feet | 99,957 | 112,837 | 112,837 | 112,837 | 112,837 | ||||||
Period end % occupied | 29.9 | % | 34.9 | % | 34.9 | % | 22.7 | % | 11.4 | % | |
% leased | 41.8 | % | 48.4 | % | 45.4 | % | 45.4 | % | 42.4 | % | |
Reposition 3 | |||||||||||
Investment | $82,251 | $66,538 | $60,179 | $70,310 | $97,766 | ||||||
Number of properties | 14 | 13 | 13 | 15 | 15 | ||||||
Total building square feet | 574,396 | 471,604 | 435,281 | 561,708 | 714,500 | ||||||
Period end % occupied | 48.5 | % | 47.6 | % | 47.7 | % | 39.7 | % | 53.5 | % | |
TOTAL PROPERTIES | |||||||||||
2Q 2018 | 1Q 2018 | 4Q 2017 | 3Q 2017 | 2Q 2017 | |||||||
Investment | $3,888,427 | $3,806,460 | $3,807,454 | $3,601,152 | $3,586,372 | ||||||
Number of properties | 201 | 196 | 201 | 197 | 197 | ||||||
Total building square feet | 14,881,624 | 14,510,860 | 14,632,532 | 14,430,956 | 14,468,156 | ||||||
Period end % occupied | 87.9 | % | 87.7 | % | 88.1 | % | 87.4 | % | 87.6 | % | |
1 | Excludes mortgage notes receivable, land held for development, construction in progress, corporate property and assets classified as held for sale. |
2 | Acquisition includes properties acquired within the last 8 quarters of the period presented and are excluded from same store. |
3 | Reposition includes properties that meet any of the Company-defined criteria: properties having less than 60% occupancy that is expected to last at least two quarters; properties that experience a loss of occupancy over 30% in a single quarter; or properties with negative net operating income that is expected to last at least two quarters. |
HEALTHCARE REALTY | 2Q 2018 SUPPLEMENTAL INFORMATION 18 |
Occupancy Reconciliation |
SQUARE FEET |
SEQUENTIAL | |||||||||||||
PORTFOLIO | SAME STORE | ||||||||||||
OCCUPIED | TOTAL | % | OCCUPIED | TOTAL | % | ||||||||
Beginning March 31, 2018 | 12,733,020 | 14,510,860 | 87.7 | % | 11,186,862 | 12,543,219 | 89.2 | % | |||||
Portfolio activity | |||||||||||||
Acquisitions | 320,485 | 370,764 | 86.4 | % | NA | NA | NA | ||||||
Re/development completions | — | — | — | % | — | — | — | % | |||||
Dispositions 1 | — | — | — | % | — | — | — | % | |||||
Same store reclassifications | |||||||||||||
Acquisitions | NA | NA | NA | 91,264 | 109,649 | 83.2 | % | ||||||
Development completions | NA | NA | NA | 12,880 | 12,880 | 100.0 | % | ||||||
Reposition to same store | NA | NA | NA | — | — | — | % | ||||||
Reposition from same store | NA | NA | NA | (62,499 | ) | (102,792 | ) | 60.8 | % | ||||
13,053,505 | 14,881,624 | 87.7 | % | 11,228,507 | 12,562,956 | 89.4 | % | ||||||
Leasing activity | |||||||||||||
New leases/expansions | 133,750 | NA | NA | 111,574 | NA | NA | |||||||
Move-outs/contractions | (100,465 | ) | NA | NA | (85,848 | ) | NA | NA | |||||
Net absorption | 33,285 | NA | NA | 25,726 | NA | NA | |||||||
Ending June 30, 2018 | 13,086,790 | 14,881,624 | 87.9 | % | 11,254,233 | 12,562,956 | 89.6 | % | |||||
YEAR-OVER-YEAR | |||||||||||||
PORTFOLIO | SAME STORE | ||||||||||||
OCCUPIED | TOTAL | % | OCCUPIED | TOTAL | % | ||||||||
Beginning June 30, 2017 | 12,677,514 | 14,468,156 | 87.6 | % | 11,235,981 | 12,527,160 | 89.7 | % | |||||
Portfolio activity | |||||||||||||
Acquisitions | 970,193 | 1,076,001 | 90.2 | % | NA | NA | NA | ||||||
Re/development completions | — | — | — | % | — | — | — | % | |||||
Dispositions 1 | (500,340 | ) | (662,533 | ) | 75.5 | % | (456,126 | ) | (456,126 | ) | 100.0 | % | |
Same store reclassifications | |||||||||||||
Acquisitions | NA | NA | NA | 495,648 | 545,345 | 90.9 | % | ||||||
Development completions | NA | NA | NA | 12,880 | 12,880 | 100.0 | % | ||||||
Reposition to same store | NA | NA | NA | 154,590 | 154,590 | 100.0 | % | ||||||
Reposition from same store | NA | NA | NA | (151,777 | ) | (220,893 | ) | 68.7 | % | ||||
13,147,367 | 14,881,624 | 88.3 | % | 11,291,196 | 12,562,956 | 89.9 | % | ||||||
Leasing activity | |||||||||||||
New leases/expansions | 568,681 | NA | NA | 502,662 | NA | NA | |||||||
Move-outs/contractions | (629,258 | ) | NA | NA | (539,625 | ) | NA | NA | |||||
Net absorption | (60,577 | ) | NA | NA | (36,963 | ) | NA | NA | |||||
Ending June 30, 2018 | 13,086,790 | 14,881,624 | 87.9 | % | 11,254,233 | 12,562,956 | 89.6 | % | |||||
1 | Includes properties reclassified as held for sale. |
HEALTHCARE REALTY | 2Q 2018 SUPPLEMENTAL INFORMATION 19 |
Same Store Leasing Statistics 1 |
2Q 2018 | 1Q 2018 | 4Q 2017 | 3Q 2017 | 2Q 2017 | 1Q 2017 | 4Q 2016 | 3Q 2016 | |||||||||||
Average in-place contractual increases | ||||||||||||||||||
Multi-tenant | 2.84 | % | 2.81 | % | 2.80 | % | 2.78 | % | 2.74 | % | 2.72 | % | 2.69 | % | 2.68 | % | ||
Single-tenant | 2.13 | % | 2.12 | % | 2.12 | % | 2.10 | % | 2.04 | % | 1.98 | % | 1.78 | % | 1.84 | % | ||
2.73 | % | 2.71 | % | 2.69 | % | 2.65 | % | 2.61 | % | 2.59 | % | 2.50 | % | 2.49 | % | |||
Multi-tenant renewals | ||||||||||||||||||
Cash leasing spreads | 6.4 | % | 5.2 | % | 3.7 | % | 4.6 | % | 9.5 | % | 4.5 | % | 3.9 | % | 4.3 | % | ||
Tenant retention rate | 84.4 | % | 81.5 | % | 81.9 | % | 80.5 | % | 90.3 | % | 79.2 | % | 88.5 | % | 90.1 | % | ||
AVERAGE IN-PLACE CONTRACTUAL INCREASES 2 | ||||||||||||||
MULTI-TENANT | SINGLE-TENANT | TOTAL | ||||||||||||
% INCREASE | % OF BASE RENT | % INCREASE | % OF BASE RENT | % INCREASE | % OF BASE RENT | |||||||||
Annual increase | ||||||||||||||
CPI | 2.21 | % | 1.36 | % | 2.07 | % | 55.20 | % | 2.09 | % | 9.41 | % | ||
Fixed | 2.96 | % | 93.11 | % | 2.39 | % | 16.49 | % | 2.94 | % | 81.66 | % | ||
Non-annual increase (annualized) | ||||||||||||||
CPI | 1.24 | % | 1.09 | % | 0.50 | % | 2.50 | % | 1.03 | % | 1.30 | % | ||
Fixed | 1.26 | % | 3.00 | % | 2.25 | % | 25.81 | % | 1.86 | % | 6.41 | % | ||
No increase | ||||||||||||||
Term > 1 year | — | % | 1.44 | % | — | % | — | % | — | % | 1.22 | % | ||
Total 2 | 2.84 | % | 100.00 | % | 2.13 | % | 100.00 | % | 2.73 | % | 100.00 | % | ||
TYPE AND OWNERSHIP STRUCTURE (% OF SQUARE FEET) | |||||||
MULTI-TENANT | SINGLE-TENANT | TOTAL | |||||
Tenant type | |||||||
Hospital | 45.9 | % | 81.6 | % | 50.2 | % | |
Physician and other | 54.1 | % | 18.4 | % | 49.8 | % | |
Lease structure | |||||||
Gross | 13.6 | % | — | % | 12.0 | % | |
Modified gross | 29.7 | % | — | % | 26.1 | % | |
Net | 56.7 | % | — | % | 49.9 | % | |
Absolute net 3 | — | % | 100.0 | % | 12.0 | % | |
Ownership type | |||||||
Ground lease | 61.0 | % | 13.5 | % | 55.9 | % | |
Fee simple | 39.0 | % | 86.5 | % | 44.1 | % | |
1 | Excludes recently acquired or disposed properties, mortgage notes receivable, construction in progress, land held for development, corporate property, reposition properties and assets classified as held for sale. |
2 | Excludes leases with terms of one year or less. |
3 | Tenant is typically responsible for operating expenses and capital obligations. |
HEALTHCARE REALTY | 2Q 2018 SUPPLEMENTAL INFORMATION 20 |
Same Store Performance 1 |
DOLLARS IN THOUSANDS, EXCEPT PER SQUARE FOOT DATA |
TTM 2018 | 2Q 2018 | 1Q 2018 | 4Q 2017 | 3Q 2017 | TTM 2017 | 2Q 2017 | 1Q 2017 | 4Q 2016 | 3Q 2016 | ||||||||||||||
Multi-tenant | |||||||||||||||||||||||
Revenues | $333,340 | $84,035 | $83,029 | $82,709 | $83,567 | $324,061 | $82,449 | $81,013 | $80,245 | $80,354 | |||||||||||||
Expenses | 136,623 | 33,963 | 34,188 | 33,510 | 34,962 | 133,622 | 33,357 | 33,140 | 32,942 | 34,183 | |||||||||||||
Cash NOI | $196,717 | $50,072 | $48,841 | $49,199 | $48,605 | $190,439 | $49,092 | $47,873 | $47,303 | $46,171 | |||||||||||||
Revenue per occ SF 2 | $33.61 | $33.94 | $33.52 | $33.38 | $33.65 | $32.76 | $33.18 | $32.74 | $32.50 | $32.62 | |||||||||||||
Margin | 59.0 | % | 59.6 | % | 58.8 | % | 59.5 | % | 58.2 | % | 58.8 | % | 59.5 | % | 59.1 | % | 58.9 | % | 57.5 | % | |||
Average occupancy | 88.4 | % | 88.3 | % | 88.3 | % | 88.3 | % | 88.5 | % | 88.2 | % | 88.6 | % | 88.2 | % | 88.0 | % | 87.8 | % | |||
Period end occupancy | 88.3 | % | 88.3 | % | 88.2 | % | 88.4 | % | 88.3 | % | 88.8 | % | 88.8 | % | 88.4 | % | 88.0 | % | 88.0 | % | |||
Number of properties | 144 | 144 | 144 | 144 | 144 | 144 | 144 | 144 | 144 | 144 | |||||||||||||
Single-tenant | |||||||||||||||||||||||
Revenues | $44,816 | $11,256 | $11,257 | $11,239 | $11,064 | $43,652 | $10,706 | $11,092 | $10,790 | $11,064 | |||||||||||||
Expenses | 1,730 | 378 | 439 | 427 | 486 | 1,831 | 426 | 492 | 468 | 445 | |||||||||||||
Cash NOI | $43,086 | $10,878 | $10,818 | $10,812 | $10,578 | $41,821 | $10,280 | $10,600 | $10,322 | $10,619 | |||||||||||||
Revenue per occ SF 2 | $33.62 | $33.70 | $33.84 | $33.79 | $33.26 | $32.80 | $32.18 | $33.35 | $32.44 | $33.26 | |||||||||||||
Average occupancy | 99.3 | % | 99.6 | % | 99.2 | % | 99.2 | % | 99.2 | % | 99.2 | % | 99.2 | % | 99.2 | % | 99.2 | % | 99.2 | % | |||
Number of properties | 15 | 15 | 15 | 15 | 15 | 15 | 15 | 15 | 15 | 15 | |||||||||||||
Total | |||||||||||||||||||||||
Revenues | $378,156 | $95,291 | $94,286 | $93,948 | $94,631 | $367,713 | $93,155 | $92,105 | $91,035 | $91,418 | |||||||||||||
Expenses | 138,353 | 34,341 | 34,627 | 33,937 | 35,448 | 135,453 | 33,783 | 33,632 | 33,410 | 34,628 | |||||||||||||
Cash NOI | $239,803 | $60,950 | $59,659 | $60,011 | $59,183 | $232,260 | $59,372 | $58,473 | $57,625 | $56,790 | |||||||||||||
Revenue per occ SF 2 | $33.61 | $33.91 | $33.56 | $33.43 | $33.61 | $32.76 | $33.06 | $32.81 | $32.49 | $32.70 | |||||||||||||
Margin | 63.4 | % | 64.0 | % | 63.3 | % | 63.9 | % | 62.5 | % | 63.2 | % | 63.7 | % | 63.5 | % | 63.3 | % | 62.1 | % | |||
Average occupancy | 89.6 | % | 89.5 | % | 89.4 | % | 89.5 | % | 89.7 | % | 89.3 | % | 89.7 | % | 89.4 | % | 89.2 | % | 89.0 | % | |||
Number of properties | 159 | 159 | 159 | 159 | 159 | 159 | 159 | 159 | 159 | 159 | |||||||||||||
SAME STORE GROWTH | ||||||||||||
YEAR-OVER-YEAR | ||||||||||||
TTM 2018 | 2Q 2018 | 1Q 2018 | 4Q 2017 | 3Q 2017 | ||||||||
Multi-tenant | ||||||||||||
Revenue per occ SF 2 | 2.6 | % | 2.3 | % | 2.4 | % | 2.7 | % | 3.2 | % | ||
Avg occupancy (bps) | +20 | -30 | +10 | +30 | +70 | |||||||
Revenues | 2.9 | % | 1.9 | % | 2.5 | % | 3.1 | % | 4.0 | % | ||
Expenses | 2.2 | % | 1.8 | % | 3.2 | % | 1.7 | % | 2.3 | % | ||
Cash NOI | 3.3 | % | 2.0 | % | 2.0 | % | 4.0 | % | 5.3 | % | ||
Single-tenant | ||||||||||||
Cash NOI | 3.0 | % | 5.8 | % | 2.1 | % | 4.7 | % | (0.4 | %) | ||
Total | ||||||||||||
Revenues | 2.8 | % | 2.3 | % | 2.4 | % | 3.2 | % | 3.5 | % | ||
Cash NOI | 3.2 | % | 2.7 | % | 2.0 | % | 4.1 | % | 4.2 | % | ||
1 | Excludes recently acquired or disposed properties, mortgage notes receivable, development completions, construction in progress, land held for development, corporate property, reposition properties and assets classified as held for sale. |
2 | Revenue per occ SF is calculated by dividing revenue by the average of the occupied SF for the period provided. Quarterly revenue per OCC SF is annualized. |
HEALTHCARE REALTY | 2Q 2018 SUPPLEMENTAL INFORMATION 21 |
Reconciliation of NOI |
DOLLARS IN THOUSANDS |
BOTTOM UP RECONCILIATION | |||||||||||||||||||||||||
2Q 2018 | 1Q 2018 | 4Q 2017 | 3Q 2017 | 2Q 2017 | 1Q 2017 | 4Q 2016 | 3Q 2016 | ||||||||||||||||||
Net income (loss) | $37,729 | $9,180 | ($37,151 | ) | $3,173 | $25,224 | $31,845 | $52,437 | $11,834 | ||||||||||||||||
Other income (expense) | (16,559 | ) | 12,175 | 58,429 | 18,819 | (1,808 | ) | (8,851 | ) | (27,078 | ) | 13,719 | |||||||||||||
General and administrative expense | 8,373 | 9,101 | 8,272 | 8,022 | 8,005 | 8,694 | 7,622 | 7,859 | |||||||||||||||||
Depreciation and amortization expense | 40,130 | 39,573 | 37,324 | 35,873 | 34,823 | 34,452 | 34,022 | 31,984 | |||||||||||||||||
Other expenses 1 | 1,939 | 1,968 | 2,522 | 1,921 | 2,204 | 1,979 | 2,431 | 1,488 | |||||||||||||||||
Straight-line rent revenue | (1,074 | ) | (1,722 | ) | (1,205 | ) | (1,332 | ) | (1,783 | ) | (1,751 | ) | (1,754 | ) | (1,223 | ) | |||||||||
Other revenue 2 | (1,268 | ) | (1,438 | ) | (1,258 | ) | (1,327 | ) | (1,196 | ) | (785 | ) | (1,218 | ) | (1,420 | ) | |||||||||
Cash NOI | $69,270 | $68,837 | $66,933 | $65,149 | $65,469 | $65,583 | $66,462 | $64,241 | |||||||||||||||||
Acquisitions/development completions | (6,980 | ) | (6,593 | ) | (4,402 | ) | (3,241 | ) | (2,778 | ) | (2,316 | ) | (2,132 | ) | (197 | ) | |||||||||
Reposition | (524 | ) | (612 | ) | (594 | ) | (642 | ) | (672 | ) | (705 | ) | (664 | ) | (622 | ) | |||||||||
Dispositions/other | (816 | ) | (1,973 | ) | (1,926 | ) | (2,083 | ) | (2,647 | ) | (4,089 | ) | (6,041 | ) | (6,632 | ) | |||||||||
Same store cash NOI | $60,950 | $59,659 | $60,011 | $59,183 | $59,372 | $58,473 | $57,625 | $56,790 | |||||||||||||||||
TOP DOWN RECONCILIATION | |||||||||||||||||||||||||
2Q 2018 | 1Q 2018 | 4Q 2017 | 3Q 2017 | 2Q 2017 | 1Q 2017 | 4Q 2016 | 3Q 2016 | ||||||||||||||||||
Property operating | $96,419 | $95,294 | $91,523 | $90,935 | $88,869 | $86,682 | $85,686 | $83,974 | |||||||||||||||||
Single-tenant net lease | 12,073 | 13,213 | 13,078 | 12,811 | 12,732 | 14,276 | 15,626 | 16,053 | |||||||||||||||||
Straight-line rent revenue | 1,074 | 1,722 | 1,205 | 1,332 | 1,783 | 1,751 | 1,754 | 1,223 | |||||||||||||||||
Rental income | 109,566 | 110,229 | 105,806 | 105,078 | 103,384 | 102,709 | 103,066 | 101,250 | |||||||||||||||||
Property lease guaranty income | 146 | 175 | 182 | 168 | 153 | 224 | 354 | 817 | |||||||||||||||||
Parking income | 1,819 | 1,626 | 1,705 | 1,669 | 1,669 | 1,568 | 1,867 | 1,500 | |||||||||||||||||
Exclude straight-line rent revenue | (1,074 | ) | (1,722 | ) | (1,205 | ) | (1,332 | ) | (1,783 | ) | (1,751 | ) | (1,754 | ) | (1,223 | ) | |||||||||
Exclude other revenue 3 | (1,165 | ) | (1,345 | ) | (1,201 | ) | (1,218 | ) | (1,085 | ) | (642 | ) | (1,123 | ) | (1,245 | ) | |||||||||
Revenue | 109,292 | 108,963 | 105,287 | 104,365 | 102,338 | 102,108 | 102,410 | 101,099 | |||||||||||||||||
Property operating expense | (41,737 | ) | (41,818 | ) | (40,590 | ) | (40,627 | ) | (38,184 | ) | (37,852 | ) | (37,307 | ) | (37,528 | ) | |||||||||
Exclude other expenses 4 | 1,715 | 1,692 | 2,236 | 1,411 | 1,315 | 1,327 | 1,359 | 670 | |||||||||||||||||
Cash NOI | $69,270 | $68,837 | $66,933 | $65,149 | $65,469 | $65,583 | $66,462 | $64,241 | |||||||||||||||||
Acquisitions/development completions | (6,980 | ) | (6,593 | ) | (4,402 | ) | (3,241 | ) | (2,778 | ) | (2,316 | ) | (2,132 | ) | (197 | ) | |||||||||
Reposition | (524 | ) | (612 | ) | (594 | ) | (642 | ) | (672 | ) | (705 | ) | (664 | ) | (622 | ) | |||||||||
Dispositions/other | (816 | ) | (1,973 | ) | (1,926 | ) | (2,083 | ) | (2,647 | ) | (4,089 | ) | (6,041 | ) | (6,632 | ) | |||||||||
Same store cash NOI | $60,950 | $59,659 | $60,011 | $59,183 | $59,372 | $58,473 | $57,625 | $56,790 | |||||||||||||||||
TTM ENDED 6/30/2018 - CASH NOI | ||||||||
2018 | 2017 | % CHANGE | ||||||
Same store cash NOI | $239,803 | $232,260 | 3.2 | % | ||||
Reposition | 2,372 | 2,663 | (10.9 | %) | ||||
$242,175 | $234,923 | 3.1 | % | |||||
Acquisitions/development completions | 21,216 | 7,423 | 185.8 | % | ||||
Dispositions/other | 6,798 | 19,409 | (65.0 | %) | ||||
Cash NOI | $270,189 | $261,755 | 3.2 | % | ||||
1 | Includes acquisition and development expense, bad debt, above and below market ground lease intangible amortization, leasing commission amortization, and ground lease straight-line rent. |
2 | Includes management fee income, interest, mortgage interest income, above and below market lease intangible amortization, lease inducement amortization, lease terminations and tenant improvement overage amortization. |
3 | Includes above and below market lease intangibles, lease inducements, lease terminations and TI amortization. |
4 | Includes above and below market ground lease intangible amortization, leasing commission amortization, and ground lease straight-line rent. |
HEALTHCARE REALTY | 2Q 2018 SUPPLEMENTAL INFORMATION 22 |
Reconciliation of EBITDA |
DOLLARS IN THOUSANDS |
TTM | Q2 2018 | Q1 2018 | 4Q 2017 | 3Q 2017 | |||||||||||||
Net income | $12,931 | $37,729 | $9,180 | ($37,151 | ) | $3,173 | |||||||||||
Interest expense | 53,551 | 13,069 | 12,668 | 13,707 | 14,107 | ||||||||||||
Depreciation and amortization | 152,900 | 40,130 | 39,573 | 37,324 | 35,873 | ||||||||||||
EBITDA | $219,382 | $90,928 | $61,421 | $13,880 | $53,153 | ||||||||||||
Other amortization expense 1 | 7,812 | 2,018 | 1,817 | 1,983 | 1,994 | ||||||||||||
Gain on sales of real estate properties | (29,583 | ) | (29,590 | ) | — | — | 7 | ||||||||||
Impairments on real estate assets | 5,057 | — | — | (2 | ) | 5,059 | |||||||||||
EBITDAre 2 | $202,668 | $63,356 | $63,238 | $15,861 | $60,213 | ||||||||||||
EBITDA | $219,382 | $90,928 | $61,421 | $13,880 | $53,153 | ||||||||||||
Acquisition and development expense | 1,206 | 120 | 277 | 302 | 507 | ||||||||||||
Gain on sales of real estate properties | (29,583 | ) | (29,590 | ) | — | — | 7 | ||||||||||
Impairments on real estate assets | 5,057 | — | — | (2 | ) | 5,059 | |||||||||||
Loss on extinguishment of debt | 44,985 | — | — | 44,985 | — | ||||||||||||
Debt Covenant EBITDA | $241,047 | $61,458 | $61,698 | $59,165 | $58,726 | ||||||||||||
Other amortization expense | 7,812 | 2,018 | 1,817 | 1,983 | 1,994 | ||||||||||||
Timing impact 3 | 3,071 | (249 | ) | — | 2,761 | 559 | |||||||||||
Stock based compensation | 10,375 | 2,593 | 2,822 | 2,531 | 2,429 | ||||||||||||
Adjusted EBITDA | $262,305 | $65,820 | $66,337 | $66,440 | $63,708 | ||||||||||||
1 | Includes leasing commission amortization, above and below market lease intangible amortization, deferred financing costs amortization and the amortization of discounts and premiums on debt. |
2 | Earnings before interest, taxes, depreciation and amortization for real estate ("EBITDAre") is an operating performance measure adopted by NAREIT. NAREIT defines EBITDAre equal to “net income (computed in accordance with GAAP) plus interest expense, income tax expense, depreciation and amortization, impairments and minus gains on the disposition of depreciated property.” |
3 | Adjusted to reflect quarterly EBITDA from properties acquired or disposed in the quarter and the out-of-period impact of a ground lease straight-line rent adjustment recorded in the fourth quarter of 2017. |
HEALTHCARE REALTY | 2Q 2018 SUPPLEMENTAL INFORMATION 23 |
Components of Net Asset Value |
DOLLARS IN THOUSANDS, EXCEPT PER SHARE DATA |
NOI BY PROPERTY TYPE | |||||||||||||||||||||
2Q 2018 | |||||||||||||||||||||
ASSET TYPE | SAME STORE NOI 1 | ACQ./DEV. COMPLETIONS NOI 2 | REPOSITION NOI 3 | TIMING ADJUSTMENTS 4 | ADJUSTED NOI | ANNUALIZED ADJUSTED NOI | % OF ADJUSTED NOI | ||||||||||||||
MOB/outpatient | $53,381 | $6,838 | $631 | $889 | $61,739 | $246,956 | 88.7 | % | |||||||||||||
Inpatient rehab | 1,665 | — | — | — | 1,665 | 6,660 | 2.4 | % | |||||||||||||
Inpatient surgical | 4,697 | — | — | — | 4,697 | 18,788 | 6.8 | % | |||||||||||||
Office | 1,207 | 141 | — | 121 | 1,469 | 5,876 | 2.1 | % | |||||||||||||
Total NOI | $60,950 | $6,979 | $631 | $1,010 | $69,570 | $278,280 | 100.0 | % | |||||||||||||
DEVELOPMENT PROPERTIES | |||
Land held for development | $24,633 | ||
Construction in progress | 23,102 | ||
Unstabilized development 5 | 28,970 | ||
$76,705 | |||
OTHER ASSETS | |||
Assets held for sale 6 | $8,699 | ||
Reposition properties (net book value) 3 | 3,049 | ||
Cash and other assets 7 | 72,851 | ||
$84,599 | |||
DEBT | |||
Unsecured credit facility | $235,000 | ||
Unsecured term loan | 150,000 | ||
Senior notes | 800,000 | ||
Mortgage notes payable | 160,409 | ||
Other liabilities 8 | 66,178 | ||
$1,411,587 | |||
TOTAL SHARES OUTSTANDING | |||||
As of July 27, 2018 | 125,232,465 | ||||
IMPLIED CAP RATE | |||||
STOCK PRICE | IMPLIED CAP RATE | ||||
As of 7/27/2018 | $29.21 | 5.67 | % | ||
Q2 2018 high | $29.08 | 5.69 | % | ||
Q2 2018 low | $26.31 | 6.12 | % | ||
1 | See Same Store Performance schedule on page 21 for details on same store NOI. |
2 | Adjusted to reflect quarterly NOI from properties acquired or stabilized developments completed during the full eight quarter period that are not included in same store NOI. Stabilized developments include developments completed during the full eight quarter period that are not included in same store, but are 90% occupied or greater. |
3 | Reposition properties includes 14 properties which comprise 574,396 square feet. The NOI table above includes 11 of these properties comprising 423,161 square feet that have generated positive NOI totaling approximately $0.6 million. The remaining 3 properties, comprising 151,235 square feet, have generated negative NOI of approximately $0.1 million and are reflected at a net book value of $3.0 million in the other assets table above. |
4 | Timing adjustments related to current quarter acquisitions and the difference between leased and occupied square feet on previous re/developments. |
5 | Unstabilized development includes the gross book value of one property that was completed on June 30, 2017. The building is 42% leased and 30% occupied as of June 30, 2018. |
6 | Assets held for sale includes one real estate property that is excluded from same store NOI and reflects net book value. |
7 | Includes cash of $7.4 million and prepaid assets of $65.5 million that are expected to generate future cash or NOI and assets that are currently causing non-cash reductions to NOI. |
8 | Includes only liabilities that are expected to reduce future cash or NOI and that are currently producing non-cash benefits to NOI. Included are accounts payable and accrued liabilities of $59.0 million, security deposits of $6.9 million, and deferred operating expense reimbursements of $0.3 million. |
HEALTHCARE REALTY | 2Q 2018 SUPPLEMENTAL INFORMATION 24 |
Components of Expected FFO |
DOLLARS IN THOUSANDS, EXCEPT PER SHARE DATA |
SAME STORE QUARTERLY RANGE OF EXPECTATIONS | |||||||
EXPECTED 2018 | ACTUAL | ||||||
LOW | HIGH | 2Q 2018 | |||||
Occupancy | |||||||
Multi-tenant | 87.5 | % | 89.0 | % | 88.3 | % | |
Single-tenant | 95.0 | % | 100.0 | % | 100.0 | % | |
TTM revenue per occupied square foot | |||||||
Multi-tenant | $33.00 | $34.00 | $33.61 | ||||
Single-tenant | $33.50 | $34.50 | $33.62 | ||||
TTM Multi-tenant cash NOI margin | 58.5 | % | 60.0 | % | 59.0 | % | |
Multi-tenant contractual rent increases by type (% of base rent) | |||||||
Annual increase | 92.0 | % | 95.0 | % | 94.5 | % | |
Non-annual increase | 4.0 | % | 5.0 | % | 4.1 | % | |
No increase (term > 1 year) | 1.0 | % | 2.0 | % | 1.4 | % | |
Multi-tenant cash leasing spreads | 3.0 | % | 6.0 | % | 6.4 | % | |
Multi-tenant lease retention rate | 75.0 | % | 90.0 | % | 84.4 | % | |
TTM cash NOI growth | |||||||
Multi-tenant | 3.0 | % | 4.5 | % | 3.3 | % | |
Single-tenant | 1.0 | % | 3.0 | % | 3.0 | % | |
Total | 3.0 | % | 4.0 | % | 3.2 | % | |
ANNUAL RANGE OF EXPECTATIONS | |||||||
LOW | HIGH | YTD | |||||
G&A | $33,000 | $34,500 | $17,473 | ||||
Funding activity | |||||||
Acquisitions | 75,000 | 125,000 | 70,350 | ||||
Dispositions | |||||||
YTD dispositions | (55,752) | (55,752) | (55,752) | ||||
Remaining dispositions | (20,000) | (70,000) | — | ||||
Re/development | 30,000 | 50,000 | 23,656 | ||||
1st generation TI and acq. cap. ex. | 8,000 | 10,000 | 5,862 | ||||
2nd generation TI | 22,000 | 26,000 | 13,622 | ||||
Leasing commissions | 7,000 | 9,000 | 3,798 | ||||
Capital expenditures | 18,000 | 24,000 | 11,301 | ||||
Cash yield | |||||||
Acquisitions | 5.25 | % | 6.00 | % | 5.9 | % | |
Dispositions | |||||||
YTD dispositions | 15.4 | % | 15.4 | % | 15.4 | % | |
Remaining dispositions | 5.5 | % | 7.0 | % | — | % | |
Re/development (stabilized) | 6.25 | % | 7.50 | % | NA | ||
Leverage (debt/cap) | 30.0 | % | 35.0 | % | 33.1 | % | |
Net debt to adjusted EBITDA | 4.75x | 5.5x | 5.1x | ||||
HEALTHCARE REALTY | 2Q 2018 SUPPLEMENTAL INFORMATION 25 |