Attached files
| file | filename |
|---|---|
| 8-K - BANKWELL FINANCIAL GROUP, INC. 8-K 07 26 18 - Bankwell Financial Group, Inc. | bwfg8k-072618.htm |
| EX-99.1 - EXHIBIT 99.1 - PRESS RELEASE - Bankwell Financial Group, Inc. | ex99-1.htm |

Bankwell Financial Group2Q’18 Investor Presentation

Safe Harbor This presentation may contain certain forward-looking statements about the Company. Forward-looking statements include statements regarding anticipated future events and can be identified by the fact that they do not relate strictly to historical or current facts. They often include words such as “believe,” “expect,” “would,” “should,” “could,” or “may.” Forward-looking statements, by their nature, are subject to risks and uncertainties. Certain factors that could cause actual results to differ materially from expected results include increased competitive pressures, changes in the interest rate environment, general economic conditions or conditions within the securities markets, and legislative and regulatory changes that could adversely affect the business in which the Company and its subsidiaries are engaged.

Bankwell MILESTONESAssets Bankwell’s Story Bankwell is one of the fastest growing and most profitable community banks in Connecticut. Bankwell was named one of the “Top 100 Best Performing Community Banks of 2016” between $1 billion and $10 billion in assets nationwide based on certain metrics for the year ended December 31, 2016 by S&P Global Market IntelligenceBankwell was named one of 29 banks nationwide to make the Sandler O’Neill + Partners list of “Sm-All Stars”, and the only CT bank to make the list 2002 2007 2008 2010 2013 2014 2017 2016 2Q18 $0 $190,906 $247,041 $395,708 $779,618 $1,099,531 $1,628,919 $1,796,607 $1,870,802 Dollars in thousands Founded The Bank of New Canaan Holding Company formed (BNC Financial Group) Founded second bank, The Bank of Fairfield Founded third bank, Stamford First Bank, a division of The Bank of New Canaan The banks merge into “Bankwell”; Bankwell acquires The Wilton Bank Bankwell acquires Quinnipiac Bank & Trust Company Named one of the “Top 100 Best Performing Community Banks of 2016”1 Named to Sandler O’Neill “Sm-All Stars Class of 2017”2 Opened 3 new branches in Fairfield County

Industry and Community Recognition Named by S&P Global Market Intelligence one of the “Top 100 Best Performing Community Banks of 2016” Named by Banking Choice Awards “#1 Bank in Fairfield County for Customer Service” Named to Sandler O’Neill “Sm-All Stars Class of 2017”

Bankwell Profile $1.87B asset Connecticut-based bank with focus on CRE and C&I lending12 existing branches in Fairfield & New Haven Counties Company Overview NASDAQ: BWFG $158MM deposits per branch, highest in Fairfield & New Haven Counties1Attractive core market of Fairfield County / Bridgeport-Stamford-Norwalk MSAMost affluent MSA in the Nation in per capita personal income (PCPI)2 1 Source: S&P Global Market Intelligence’s Branch Competitors & Pricing Report as of 6/30/17, excluding global money center banks (tickers BAC, WFC, JPM, TD & C)2 Source: Bureau of Economic Analysis’ Metropolitan Area Table, contained within the Local Area Personal Income, 2016 news release on 11/16/17 Existing branches (12) Fairfield County

Why Bankwell? Consistently strong performer in highly attractive markets 1 as of June 29th, 20182 as of June 30th, 2018
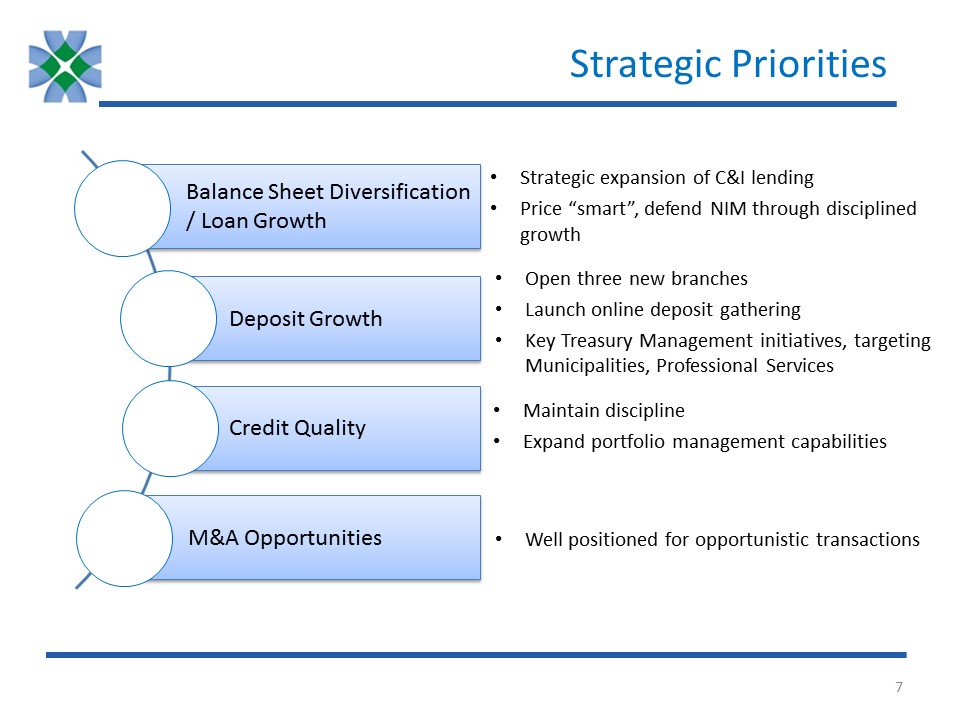
Strategic Priorities Balance Sheet Diversification/ Loan Growth Deposit Growth Credit Quality M&A Opportunities Strategic expansion of C&I lendingPrice “smart”, defend NIM through disciplined growth Maintain disciplineExpand portfolio management capabilities Open three new branchesLaunch online deposit gatheringKey Treasury Management initiatives, targeting Municipalities, Professional Services Well positioned for opportunistic transactions

2Q’18 Highlights Profitability Growth Stability $4.7 million Net Income1.03% Return on Average Assets 11.28% Return on Equity$21.56 Tangible Book Value $1.6 billion of gross loans, 7% growth year over year$1.5 billion of deposits, 4% growth year over yearOpened 3 new branches in June$12.7MM of assets per employee 2Q’18 dividend of $0.12 declaredConsidered “Well Capitalized” with 10.03% Tier 1 Leverage11.31% CET1 / RWA12.47% Total Capital / RWA
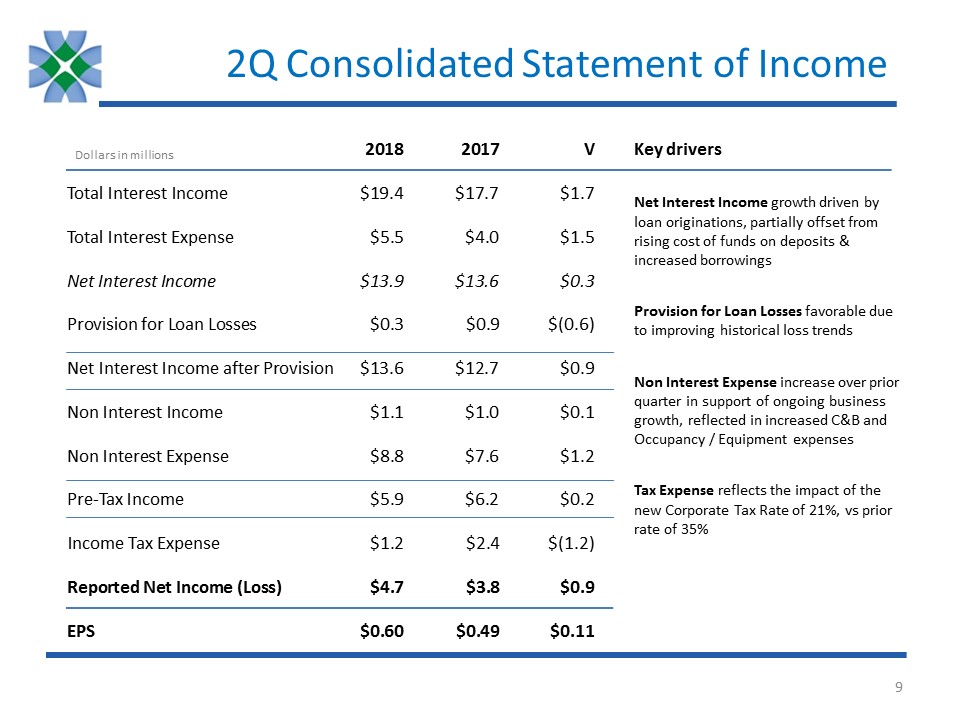
2Q Consolidated Statement of Income 2018 2017 VTotal Interest Income $19.4 $17.7 $1.7Total Interest Expense $5.5 $4.0 $1.5Net Interest Income $13.9 $13.6 $0.3Provision for Loan Losses $0.3 $0.9 $(0.6)Net Interest Income after Provision $13.6 $12.7 $0.9Non Interest Income $1.1 $1.0 $0.1Non Interest Expense $8.8 $7.6 $1.2Pre-Tax Income $5.9 $6.2 $0.2Income Tax Expense $1.2 $2.4 $(1.2)Reported Net Income (Loss) $4.7 $3.8 $0.9EPS $0.60 $0.49 $0.11 Dollars in millions Key driversNet Interest Income growth driven by loan originations, partially offset from rising cost of funds on deposits & increased borrowingsProvision for Loan Losses favorable due to improving historical loss trendsNon Interest Expense increase over prior quarter in support of ongoing business growth, reflected in increased C&B and Occupancy / Equipment expensesTax Expense reflects the impact of the new Corporate Tax Rate of 21%, vs prior rate of 35%

2Q YTD Consolidated Statement of Income 2018 2017 VTotal Interest Income $38.0 $34.1 $3.9Total Interest Expense $10.4 $7.5 $2.9Net Interest Income $27.6 $26.6 $1.0Provision for Loan Losses $0.3 $1.4 $(1.1)Net Interest Income after Provision $27.3 $25.2 $2.1Non Interest Income $2.4 $2.3 $0.2Non Interest Expense $18.0 $15.8 $2.2Pre-Tax Income $11.8 $11.6 $0.2Income Tax Expense $2.4 $4.1 $1.7Reported Net Income (Loss) $9.3 $7.5 $1.8EPS $1.19 $0.97 $0.22 Dollars in millions Key driversNet Interest Income growth driven by loan originations, partially offset from rising cost of funds on deposits & increased borrowingsProvision for Loan Losses favorable due to improving historical loss trendsNon Interest Expense increase over prior quarter in support of ongoing business growth, reflected in increased C&B and Occupancy / Equipment expenses, as well as reduced loan origination costs as a result of year-over-year lower loan volumeTax Expense reflects the impact of the new Corporate Tax Rate of 21%, vs prior rate of 35%

Financial Snapshot Dollars in thousands, except per share data 2014 2015 2016 2017 1Q’18 2Q’18 Total assets $1,099,531 $1,330,372 $1,628,919 $1,796,607 $1,831,243 $1,870,802 Net loans $915,981 $1,129,748 $1,343,895 $1,520,879 $1,534,565 $1,572,591 Loans to deposits 110.7% 109.1% 105.6% 110.1% 108.7% 108.4% Efficiency ratio 68.7% 62.3% 56.5% 54.9% 62.0% 60.1% Net interest margin 3.84% 3.77% 3.54% 3.30% 3.15% 3.15% Total capital to risk weighted assets 13.55% 13.39% 12.85% 12.19% 12.35% 12.47% Return on average equity 5.13% 6.76% 8.94% 8.93% 11.35% 11.28% Tangible book value per share $16.35 $17.43 $18.98 $20.59 $21.12 $21.56 Net interest income $31,660 $42,788 $49,092 $54,364 $13,705 $13,908 Net income $4,568 $9,030 $12,350 $13,830 $4,600 $4,715 EPS (fully diluted) $0.78 $1.21 $1.62 $1.78 $0.59 $0.60 1 1 Values are based on reported earnings / performance, which were impacted primarily as a result of the Tax Cut and Jobs Act passed in December 2017 along with several other smaller items. Please refer to BWFG’s 4Q’17 Earnings Release for further detail

Financial Performance Trends Net IncomeCAGR 40% RevenueCAGR 16% EPS $0.78 $1.21 $1.62 $1.78 $1.19Efficiency Ratio 68.7% 62.3% 56.5% 54.9% 60.1%NIM 3.84% 3.77% 3.54% 3.30% 3.15% 1 4Q’17 EPS reduced by $0.26 due to the impact of the Tax Cut and Jobs Act passed in December 2017 along with several other smaller items; on a “core” basis, 2017 EPS is $2.03, please refer to BWFG’s 4Q’17 Earnings Release for further detail 1 The second quarter efficiency ratio was 58.2%, versus 62.0% in Q1, bringing the year to date ratio down to 60.1%NIM has remained constant from Q1 at 3.15%, despite rising pressure on deposit costs Dollars in millions
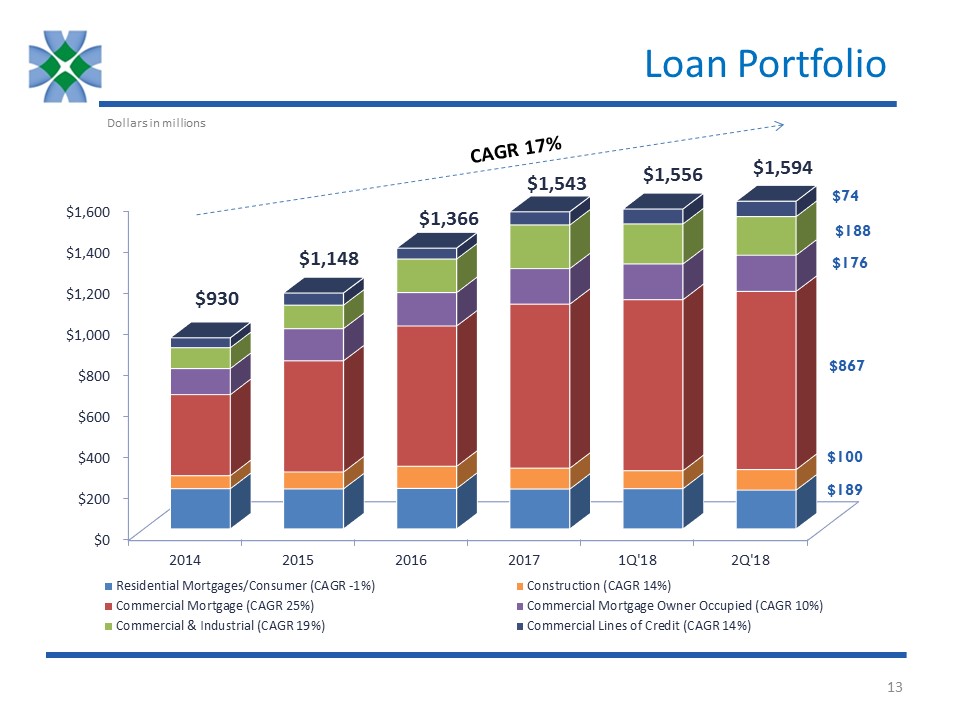
Loan Portfolio CAGR 17% $1,543 $1,366 $1,148 $930 $1,556 $1,594 Dollars in millions

Loan Portfolio Team of 10 skilled credit analysts, most with > 10 years’ experienceStrong risk management practices in placeDeveloped rigorous suite of risk management reports, enabling multi-level portfolio stratificationProven track record as CRE Lender
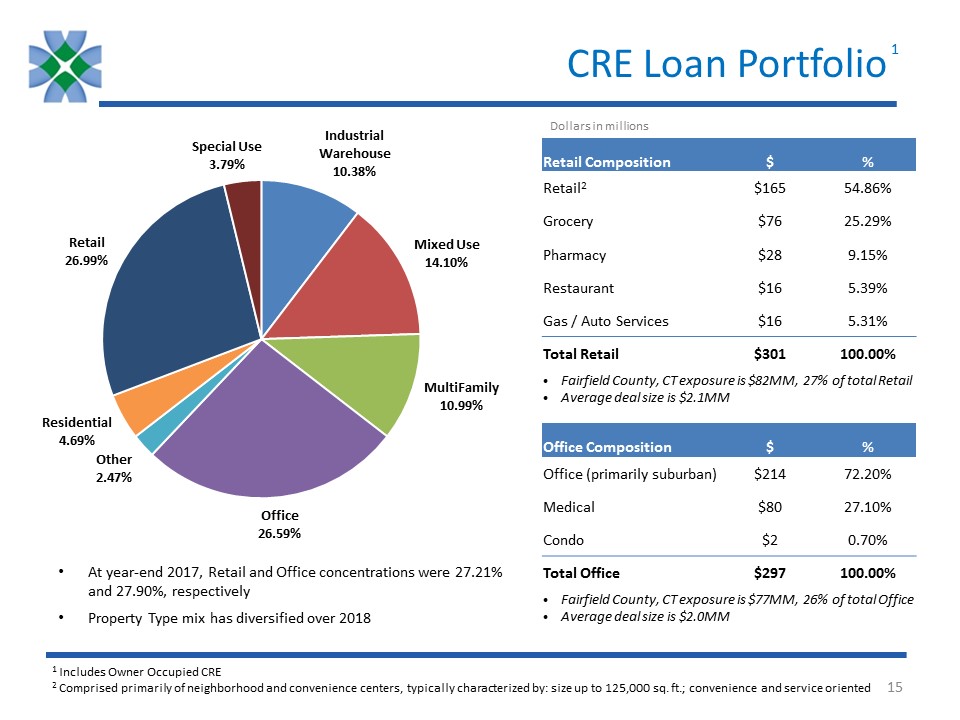
CRE Loan Portfolio Retail Composition $ % Retail2 $165 54.86% Grocery $76 25.29% Pharmacy $28 9.15% Restaurant $16 5.39% Gas / Auto Services $16 5.31% Total Retail $301 100.00% Fairfield County, CT exposure is $82MM, 27% of total RetailAverage deal size is $2.1MM Office Composition $ % Office (primarily suburban) $214 72.20% Medical $80 27.10% Condo $2 0.70% Total Office $297 100.00% Fairfield County, CT exposure is $77MM, 26% of total OfficeAverage deal size is $2.0MM 1 Includes Owner Occupied CRE2 Comprised primarily of neighborhood and convenience centers, typically characterized by: size up to 125,000 sq. ft.; convenience and service oriented 1 Dollars in millions At year-end 2017, Retail and Office concentrations were 27.21% and 27.90%, respectivelyProperty Type mix has diversified over 2018
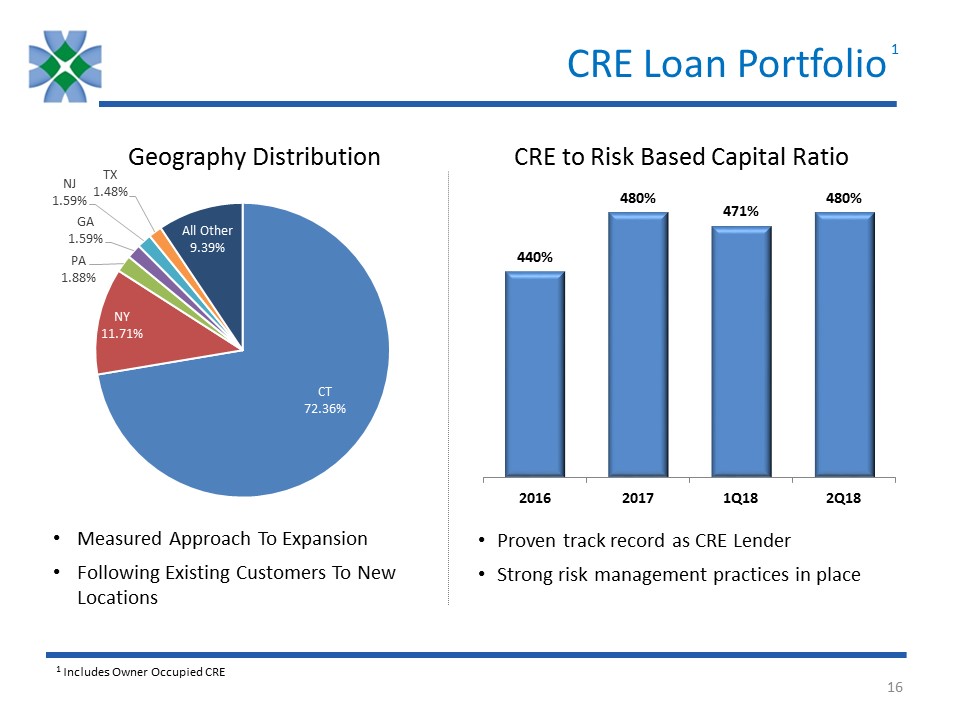
Geography Distribution Measured Approach To ExpansionFollowing Existing Customers To New Locations CRE to Risk Based Capital Ratio Proven track record as CRE LenderStrong risk management practices in place 1 1 Includes Owner Occupied CRE CRE Loan Portfolio

Asset Quality NPAs $4.31 $5.04 $3.21 $5.48 $20.86 $23.33 $MMs NPA to Total Assets Update on the 2 recent NPAsNPA #1$4MM loan fully paid off (subsequent to quarter-end)BWFG recovered 100% principal plus default interest and expensesAll else equal, NPA / Total Assets would have been 1.04% for 2Q, excluding this loanNPA #2Continuing to work with borrower on multiple pathways to repayment$3MM specific reserve taken in 2Q 1Q increase in NPAs driven by two specific relationshipsIncrease seen in 2Q NPAs attributable to required repurchase of guaranteed portion of SBA loan deemed an NPA in 1QThe total allowance for loan loss (“ALLL”) reserve is $19.0MM and represents 1.19% of total loansThe general ALLL reserve provides 256% coverage of NPAs that are not already covered by specific reservesNet Charge-Offs / Total Loans remains low at 0.01%
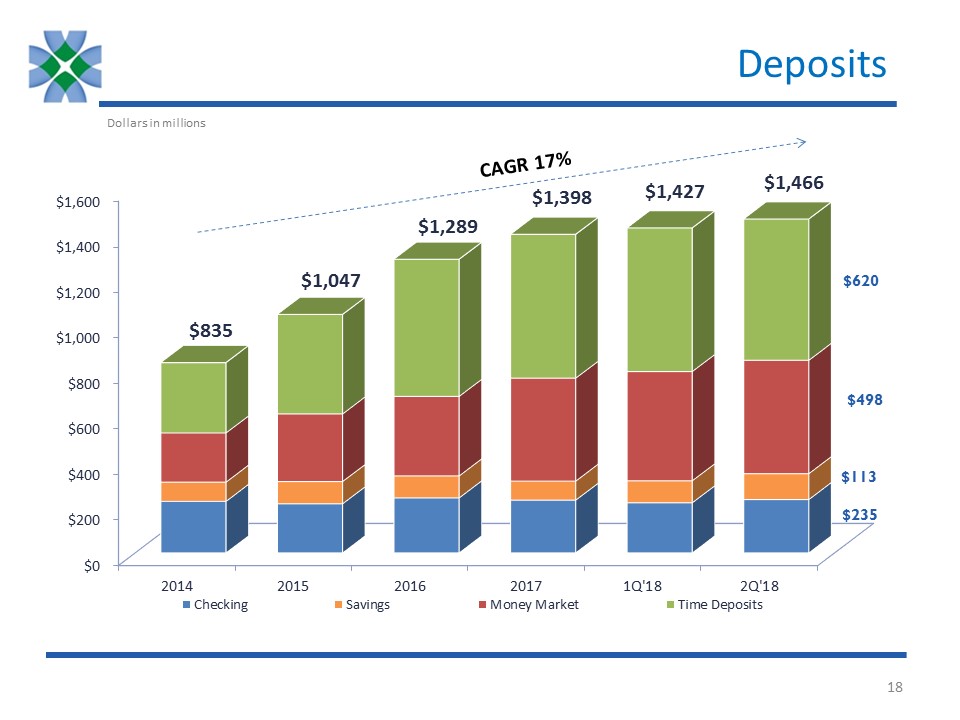
Deposits CAGR 17% $835 $1,047 $1,289 $1,398 $1,427 $1,466 Dollars in millions

Deposit Market Share Deposit Market Share Location 2013 2014 2015 2016 2017 New Canaan 19.77% 22.71% 24.40% 29.59% 31.10% Fairfield 5.95% 7.65% 6.38% 7.58% 9.18% Stamford 1.99% 2.84% 2.00% 1.92% 2.28% Wilton 6.26% 6.87% 7.76% 9.85% 13.81% Norwalk not applicable 1.44% 1.97% 2.92% Fairfield County 1.51% 2.00% 1.94% 2.17% 2.54% New Haven County 0.40% 0.43% 0.45% 0.55% 0.61% From FDIC Market Share Report as of June 30, 2017 Growing deposit share in all markets

Deposit Initiatives Targeting the 12 municipalities in Bankwell’s existing footprint$2+ billion of annual budgets represent large potential banking opportunities in footprint alone Targeted Professional Services campaign focusing on Attorneys, CPAs, Medical & Non-Profits, Property ManagersTreasury Management officers assigned to each Lender for coordinated sales Expanded Network Treasury Management Municipal Deposits 3 new branches opened in 2Q in the desirable markets of Darien, Westport and Stamford CT, bringing in $11 million in new deposits by the end of the quarterLaunched online deposit generation in 2Q Continued expansion of deposit gathering abilities

Management Team Name Years Experience Selected Professional Biography Christopher GrusekePresident & CEO(since 2015) 25+ Founding investor of Bankwell’s precursor, Bank of New Canaan, member of BoD and ALCO Committee 2009 to 201220 year Investment Banking career focused on financial institutions, securitizations and interest rate risk managementManagement positions include Chief Operating Officer of Greenwich Capital Markets Penko IvanovEVP & CFO(since 2016) 25+ CFO for Darien Rowayton Bank & Doral Bank’s US OperationsProven track record in building, improving and overseeing all areas of Finance, including Controllership, SOX, Treasury, FP&A, as well as internal and external reporting functionsPrior experience includes 8 years with GE Capital in various finance roles Heidi S. DeWyngaertEVP & Chief Lending Officer(since 2004) 30+ Previously at Webster Bank, managing the Fairfield County Commercial Real Estate group10 years as Vice President for CRE at First Union National Bank David P. DineenEVP & Head of Community Banking(since 2016) 30+ Previously at Capital One Commercial Bank as the National Market Manager for Treasury Management and Deposit Services Managed Retail Branch networks and Treasury Management sales teams at NorthFork Bank and Commerce Bank Christine A. ChivilyEVP & Chief Risk & Credit Officer (since 2013) 30+ Previously a Risk Manager for CRE and C&I at Peoples United BankSVP/Senior Credit Officer at RBS Greenwich Capital Markets (11 years); Director - Northeast Region, Multifamily at Freddie Mac (5 years); Manager, Loan Servicing - Distressed Assets at M&T Bank Laura J. WaitzEVP & Chief of Staff(since 2017) 30+ Previously Senior Managing Director, Global Head of Human Resources at The Blackstone Group (9 years)Also at Citi Alternative Investments as MD & Global Head of Compensation & at Deutsche Bank as Head of Compensation (Americas) & as Global Compensation Mgr. for Private Equity & Investment Bank Experienced management team with a diverse, non-community banking background
