Attached files
| file | filename |
|---|---|
| 8-K - 8-K - 2ND QUARTER FISCAL 2018 EARNINGS PRESS RELEASE - MATTHEWS INTERNATIONAL CORP | form8k-2018q2earnings.htm |
| EX-99.1 - EXHIBIT 99.1 2ND QUARTER FISCAL 2018 EARNINGS PRESS RELEASE - MATTHEWS INTERNATIONAL CORP | ex991_2q2018earningspr.htm |
©2018 Matthews International Corporation. All Rights Reserved.
Second Quarter Fiscal 2018
Earnings Teleconference
April 27, 2018
Joseph C. Bartolacci
President and Chief Executive Officer
Steven F. Nicola
Chief Financial Officer

©2018 Matthews International Corporation. All Rights Reserved. 2
Disclaimer
Any forward-looking statements with respect to Matthews International Corporation (the “Company”) in connection with this presentation are being made pursuant to the safe harbor provisions of the
Private Securities Litigation Reform Act of 1995. Such forward-looking statements involve known and unknown risks and uncertainties that may cause the Company’s actual results in future periods to be
materially different from management’s expectations. Although the Company believes that the expectations reflected in such forward-looking statements are reasonable, no assurance can be given that
such expectations will prove correct. Factors that could cause the Company’s results to differ from those presented herein are set forth in the Company’s Annual Report on Form 10-K and other periodic
filings with the Securities and Exchange Commission (“SEC”).
The Company periodically provides information derived from financial data which is not presented in the consolidated financial statements prepared in accordance with U.S. generally accepted accounting
principles (“GAAP”). Certain of this information are considered “non-GAAP financial measures” under the SEC rules. The Company believes that this information provides management and investors
with a useful measure of the Company’s financial performance on a comparable basis. These non-GAAP financial measures are supplemental to the Company’s GAAP disclosures and should not be
considered an alternative to the GAAP financial information.
The Company uses non-GAAP financial measures to assist in comparing its performance on a consistent basis for purposes of business decision making by removing the impact of certain items that
management believes do not directly reflect the Company’s core operations including acquisition-related items, system-integration costs, adjustments related to intangible assets, litigation items, and
strategic initiative and other charges, which includes non-recurring charges related to operational initiatives and exit activities. Management believes that presenting non-GAAP financial measures is
useful to investors because it (i) provides investors with meaningful supplemental information regarding financial performance by excluding certain items, (ii) permits investors to view performance using
the same tools that management uses to budget, forecast, make operating and strategic decisions, and evaluate historical performance, and (iii) otherwise provides supplemental information that may be
useful to investors in evaluating the Company’s results. The Company believes that the presentation of these non-GAAP financial measures, when considered together with the corresponding GAAP
financial measures and the reconciliations to those measures, provided herein, provides investors with an additional understanding of the factors and trends affecting the Company’s business that could
not be obtained absent these disclosures.
The Company has presented free cash flow and free cash flow yield as supplemental measures of cash flow that are not required by, or presented in accordance with, GAAP. Management believes that
these measures provide relevant and useful information, which is widely used by analysts and investors as well as by our management. These measures provide management with insight on the cash
generated by operations, excluding certain expenses, above and beyond the annual capital expenditures. These measures allows management, as well as analysts and investors, to assess the
Company’s ability to pursue growth and investment opportunities designed to increase Shareholder value.
The Company also has presented adjusted operating profit and believes that it provides relevant and useful information, which is widely used by analysts and investors, as well as by the Company’s
management in assessing both consolidated and segment performance. Adjusted operating profit provides the Company with an understanding of the results from the primary operations of its business
by excluding the effects of certain acquisition and system-integration costs, and items that do not reflect the ordinary earnings of the Company’s operations. This measure may be useful to an investor in
evaluating the underlying primary operating performance of the Company’s segments and business overall on a consistent basis.
Similarly, the Company believes that EBITDA and adjusted EBITDA provide relevant and useful information, which is widely used by analysts and investors, as well as by the Company’s management in
assessing the performance of its business. Adjusted EBITDA provides the Company with an understanding of earnings before the impact of investing and financing charges and income taxes, and the
effects of certain acquisition and system-integration costs, and items that do not reflect the ordinary earnings of the Company’s operations. This measure may be useful to an investor in evaluating
operating performance. It is also useful as a financial measure for lenders and is used by the Company’s management to measure performance as well as strategic planning and forecasting.
The Company has also presented adjusted earnings per share and believes it provides relevant and useful information, which is widely used by analysts and investors, as well as by the Company’s
management in assessing the performance of its business. Adjusted earnings per share provides the Company with an understanding of the results from the primary operations of our business by
excluding the per share effects of certain acquisition and system-integration costs, and items that do not reflect the ordinary earnings of our operations. This measure provides management with insight
into the earning value for shareholders excluding certain costs, not related to the Company’s primary operations. Likewise, this measure may be useful to an investor in evaluating the underlying operating
performance of the Company’s business overall, as well as performance trends, on a consistent basis.
Lastly, the Company has presented adjusted net income and believes it provides relevant and useful information, which is widely used by analysts and investors, as well as by the Company’s
management in assessing financial performance. Adjusted net income provides the Company with an understanding of the results from the primary operations of its business by excluding the effects of
certain acquisition and system-integration costs, and items that do not reflect the ordinary earnings of the Company’s operations. This measure may be useful to an investor in evaluating the underlying
performance of the business.

©2018 Matthews International Corporation. All Rights Reserved. 3
Financial Overview

©2018 Matthews International Corporation. All Rights Reserved. 4
Q2 FY2018 Highlights
$0.46
$0.57
Q2 FY2017 Q2 FY2018
EPS - Diluted
$0.84
$0.93
Q2 FY17 Q2 FY18
Adjusted EPS*
Drivers of Q2 EPS growth
Higher sales – all segments
Acquisitions and acquisition
synergies
Lower acquisition
integration costs
Lower US tax rates
Favorable foreign currency
* See supplemental slide for Adjusted EPS reconciliation and other important disclaimers regarding Matthews’ use of Non-GAAP measures
©2018 Matthews International Corporation. All Rights Reserved. 5
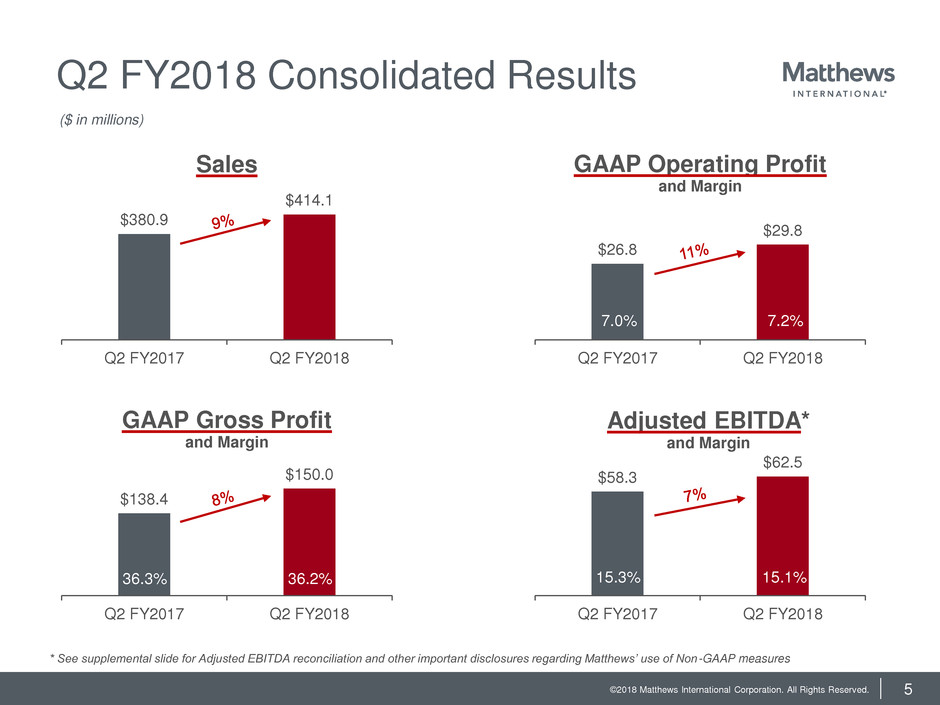
Q2 FY2018 Consolidated Results
$380.9
$414.1
Q2 FY2017 Q2 FY2018
Sales
$138.4
$150.0
Q2 FY2017 Q2 FY2018
GAAP Gross Profit
and Margin
$26.8
$29.8
Q2 FY2017 Q2 FY2018
GAAP Operating Profit
and Margin
$58.3
$62.5
Q2 FY2017 Q2 FY2018
Adjusted EBITDA*
and Margin
36.3% 36.2%
7.0% 7.2%
15.3% 15.1%
($ in millions)
* See supplemental slide for Adjusted EBITDA reconciliation and other important disclosures regarding Matthews’ use of Non-GAAP measures

©2018 Matthews International Corporation. All Rights Reserved. 6
1H FY2018 Consolidated Results
$729.9
$783.5
1H FY2017 1H FY2018
Sales
$265.7
$280.7
1H FY2017 1H FY2018
GAAP Gross Profit
and Margin
$45.9
$47.7
1H FY2017 1H FY2018
GAAP Operating Profit
and Margin
$109.0 $109.0
1H FY2017 1H FY2018
Adjusted EBITDA*
and Margin
36.4% 35.8%
* See supplemental slide for Adjusted EBITDA reconciliation and other important disclosures regarding Matthews’ use of Non-GAAP measures
6.3% 6.1%
14.9% 13.9%
($ in millions)

©2018 Matthews International Corporation. All Rights Reserved. 7
Q2 FY2018 SGK Brand Solutions Results
$190.1
$207.1
Q2 FY2017 Q2 FY2018
Sales
$24.4
$26.0
Q2 FY2017 Q2 FY2018
Adjusted EBITDA*
and Margin
$4.4
$5.1
Q2 FY2017 Q2 FY2018
GAAP Operating Profit
and Margin
Sales growth driven by EMEA,
acquisitions, favorable currency
Operating profit includes $4.3 million
and $5.3 million of amortization
expense in Q2 FY2017 and Q2 FY2018
Adjusted EBITDA benefited from sales
growth, acquisitions and currency 12.8% 12.5%
* See supplemental slides for Adjusted EBITDA reconciliation and other important disclosures regarding Matthews’ use of Non-GAAP measures
2.3% 2.5%
($ in millions)
©2018 Matthews International Corporation. All Rights Reserved. 8
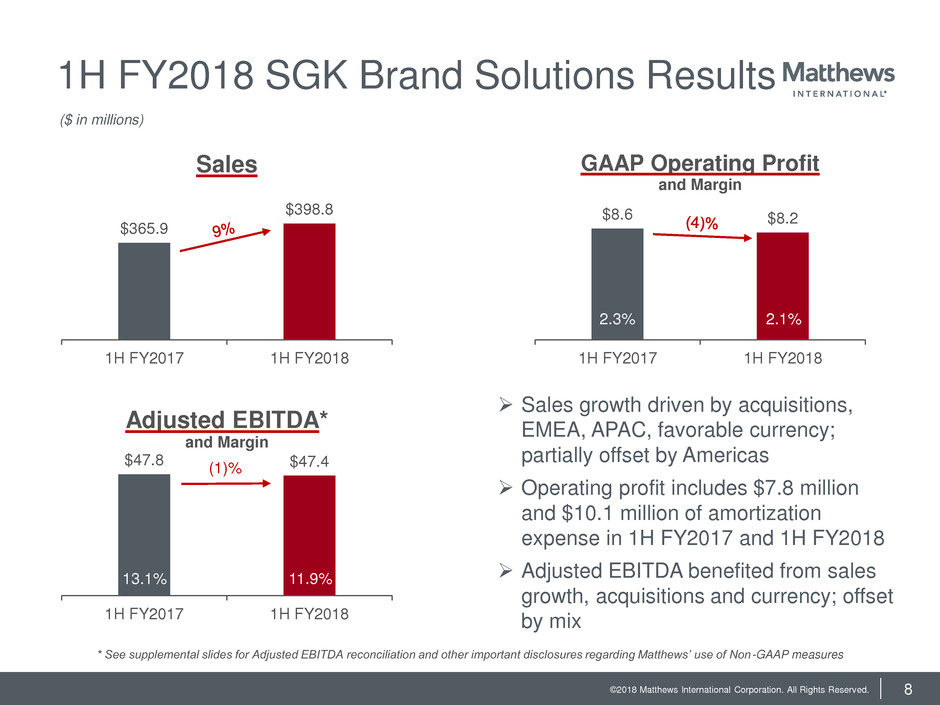
Sales growth driven by acquisitions,
EMEA, APAC, favorable currency;
partially offset by Americas
Operating profit includes $7.8 million
and $10.1 million of amortization
expense in 1H FY2017 and 1H FY2018
Adjusted EBITDA benefited from sales
growth, acquisitions and currency; offset
by mix
1H FY2018 SGK Brand Solutions Results
$365.9
$398.8
1H FY2017 1H FY2018
Sales
$47.8 $47.4
1H FY2017 1H FY2018
Adjusted EBITDA*
and Margin
$8.6 $8.2
1H FY2017 1H FY2018
GAAP Operating Profit
and Margin
13.1% 11.9%
(1)%
2.3% 2.1%
($ in millions)
* See supplemental slides for Adjusted EBITDA reconciliation and other important disclosures regarding Matthews’ use of Non-GAAP measures
©2018 Matthews International Corporation. All Rights Reserved. 9
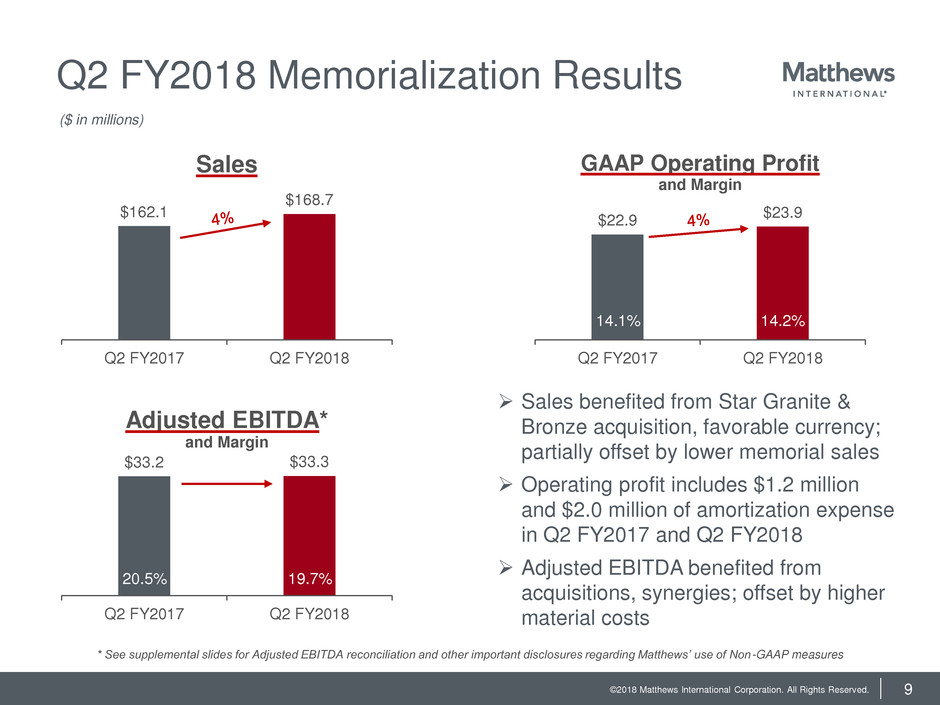
Q2 FY2018 Memorialization Results
$162.1
$168.7
Q2 FY2017 Q2 FY2018
Sales
$33.2 $33.3
Q2 FY2017 Q2 FY2018
Adjusted EBITDA*
and Margin
$22.9
$23.9
Q2 FY2017 Q2 FY2018
GAAP Operating Profit
and Margin
Sales benefited from Star Granite &
Bronze acquisition, favorable currency;
partially offset by lower memorial sales
Operating profit includes $1.2 million
and $2.0 million of amortization expense
in Q2 FY2017 and Q2 FY2018
Adjusted EBITDA benefited from
acquisitions, synergies; offset by higher
material costs
20.5% 19.7%
14.1% 14.2%
($ in millions)
* See supplemental slides for Adjusted EBITDA reconciliation and other important disclosures regarding Matthews’ use of Non-GAAP measures
©2018 Matthews International Corporation. All Rights Reserved. 10
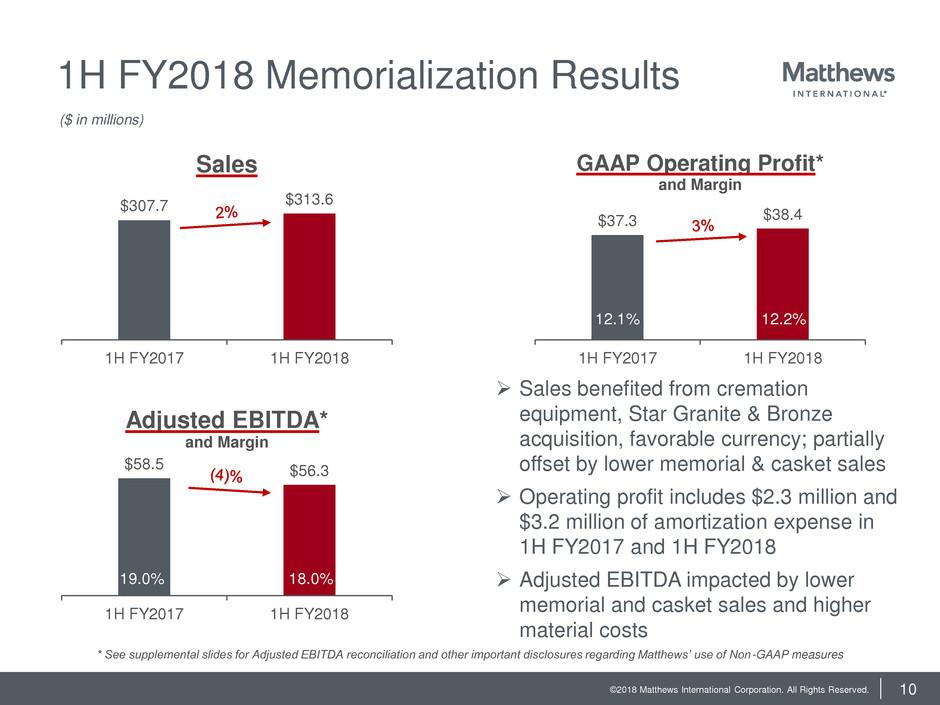
1H FY2018 Memorialization Results
$307.7 $313.6
1H FY2017 1H FY2018
Sales
$58.5 $56.3
1H FY2017 1H FY2018
Adjusted EBITDA*
and Margin
$37.3 $38.4
1H FY2017 1H FY2018
GAAP Operating Profit*
and Margin
Sales benefited from cremation
equipment, Star Granite & Bronze
acquisition, favorable currency; partially
offset by lower memorial & casket sales
Operating profit includes $2.3 million and
$3.2 million of amortization expense in
1H FY2017 and 1H FY2018
Adjusted EBITDA impacted by lower
memorial and casket sales and higher
material costs
19.0% 18.0%
12.1% 12.2%
($ in millions)
* See supplemental slides for Adjusted EBITDA reconciliation and other important disclosures regarding Matthews’ use of Non-GAAP measures
©2018 Matthews International Corporation. All Rights Reserved. 11
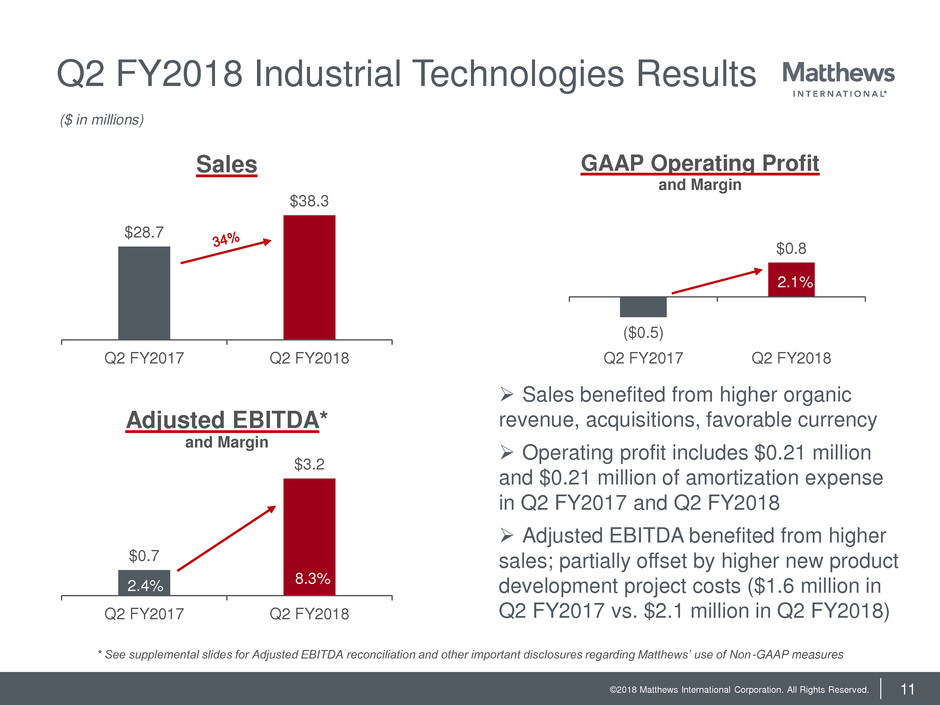
Q2 FY2018 Industrial Technologies Results
$28.7
$38.3
Q2 FY2017 Q2 FY2018
Sales
$0.7
$3.2
Q2 FY2017 Q2 FY2018
Adjusted EBITDA*
and Margin
($0.5)
$0.8
-1
-0.5
0
0.5
1
1.5
2
Q2 FY2017 Q2 FY2018
GAAP Operating Profit
and Margin
Sales benefited from higher organic
revenue, acquisitions, favorable currency
Operating profit includes $0.21 million
and $0.21 million of amortization expense
in Q2 FY2017 and Q2 FY2018
Adjusted EBITDA benefited from higher
sales; partially offset by higher new product
development project costs ($1.6 million in
Q2 FY2017 vs. $2.1 million in Q2 FY2018)
2.4% 8.3%
2.1%
($ in millions)
* See supplemental slides for Adjusted EBITDA reconciliation and other important disclosures regarding Matthews’ use of Non-GAAP measures

©2018 Matthews International Corporation. All Rights Reserved. 12
1H FY2018 Industrial Technologies Results
$56.3
$71.1
1H FY2017 1H FY2018
Sales
$2.7
$5.2
1H FY2017 1H FY2018
Adjusted EBITDA*
and Margin
$0.04
$1.1
1H FY2017 1H FY2018
GAAP Operating Profit
and Margin
Sales benefited from higher organic
revenue, acquisitions, favorable currency
Operating profit includes $0.42 million
and $1.6 million of amortization expense in
1H FY2017 and 1H FY2018
Adjusted EBITDA benefited from higher
sales; partially offset by higher new product
development project costs ($3.2 million in
1H FY2017 vs. $3.9 million in 1H FY2018)
4.8% 7.4%
1.6%
($ in millions)
* See supplemental slides for Adjusted EBITDA reconciliation and other important disclosures regarding Matthews’ use of Non-GAAP measures
©2018 Matthews International Corporation. All Rights Reserved. 13
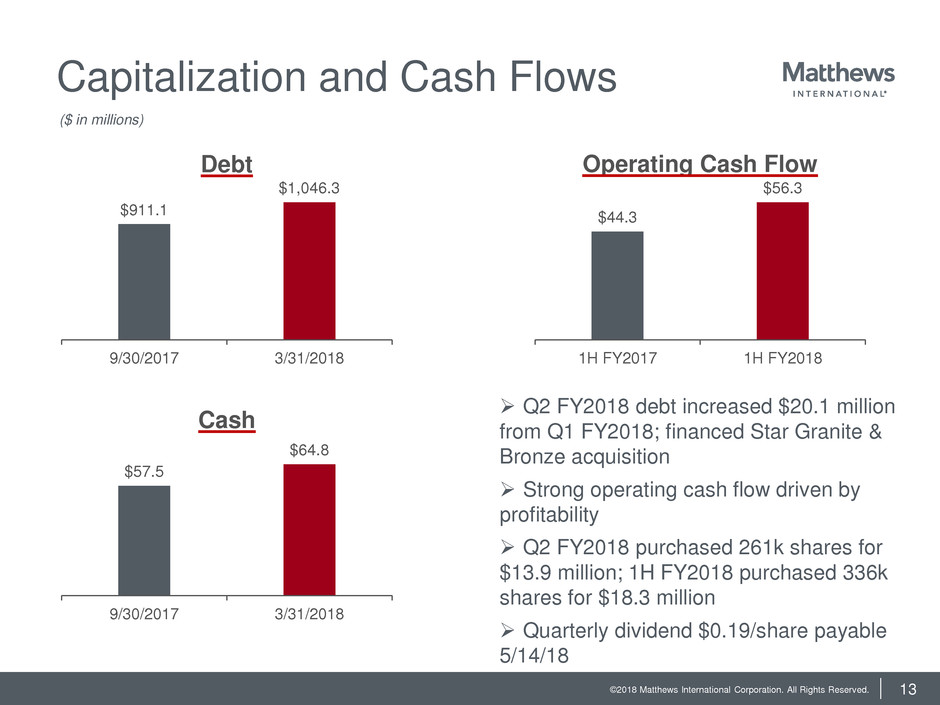
Capitalization and Cash Flows
$911.1
$1,046.3
9/30/2017 3/31/2018
Debt
$57.5
$64.8
9/30/2017 3/31/2018
Cash
$44.3
$56.3
1H FY2017 1H FY2018
Operating Cash Flow
Q2 FY2018 debt increased $20.1 million
from Q1 FY2018; financed Star Granite &
Bronze acquisition
Strong operating cash flow driven by
profitability
Q2 FY2018 purchased 261k shares for
$13.9 million; 1H FY2018 purchased 336k
shares for $18.3 million
Quarterly dividend $0.19/share payable
5/14/18
($ in millions)
©2018 Matthews International Corporation. All Rights Reserved. 14
Business Overview

©2018 Matthews International Corporation. All Rights Reserved. 15
Business Highlights & Market Climate
Gaining market share – environmental solutions, pet cremation,
Star Granite & Bronze, Aurora showing strength
Commodity cost pressures
Very strong organic growth driving backlog, Compass showing
strength
Expecting new product beta testing in Q3 FY2018, new product
launch by January 2019
Robust pipeline driven by solid sales discipline – EMEA tobacco
orders, Equator, APAC and Americas new wins ramping up,
Ungricht and VCG progressing well
Minor UK divestiture
SGK Brand
Solutions
Memorialization
Industrial
Technologies

©2018 Matthews International Corporation. All Rights Reserved. 16
Acquisitions Integration
SGK Brand Solutions
Equator (March 2017)
Ungricht (January 2017)
VCG (January 2017)
Memorialization
Star Granite & Bronze (February 2018)
Aurora (August 2015)
Industrial Technologies
Compass Engineering (November 2017)
RAF Technology (February 2017)

©2018 Matthews International Corporation. All Rights Reserved. 17
Outlook for Fiscal 2018*
Growth in non-GAAP EPS by at least 10% over FY 2017
Operating cash flow currently expected to exceed
FY2017 record level
* As of April 26, 2018

©2018 Matthews International Corporation. All Rights Reserved. 18
Supplemental Information

©2018 Matthews International Corporation. All Rights Reserved. 19
Reconciliations of
Non-GAAP Financial Measures
The Company uses non-GAAP financial measures to assist in comparing its performance on a
consistent basis for purposes of business decision making by removing the impact of certain items
that management believes do not directly reflect the Company’s core operations including
acquisition-related items, adjustments related to intangible assets, litigation items, and strategic
initiative and other charges, which includes non-recurring charges related to operational initiatives
and exit activities. Management believes that presenting non-GAAP financial measures (such as
EBITDA, Adjusted EBITDA, Adjusted EBITDA margin, Adjusted net income and Adjusted EPS) is
useful to investors because it (i) provides investors with meaningful supplemental information
regarding financial performance by excluding certain items, (ii) permits investors to view
performance using the same tools that management uses to budget, forecast, make operating and
strategic decisions, and evaluate historical performance, and (iii) otherwise provides supplemental
information that may be useful to investors in evaluating the Company’s results. The Company
believes that the presentation of these non-GAAP financial measures, when considered together
with the corresponding GAAP financial measures and the reconciliations to those measures,
provided herein, provides investors with an additional understanding of the factors and trends
affecting the Company’s business that could not be obtained absent these disclosures. These non-
GAAP financial measures are supplemental to the Company’s GAAP disclosures and should not be
considered an alternative to the GAAP financial information.
©2018 Matthews International Corporation. All Rights Reserved. 20
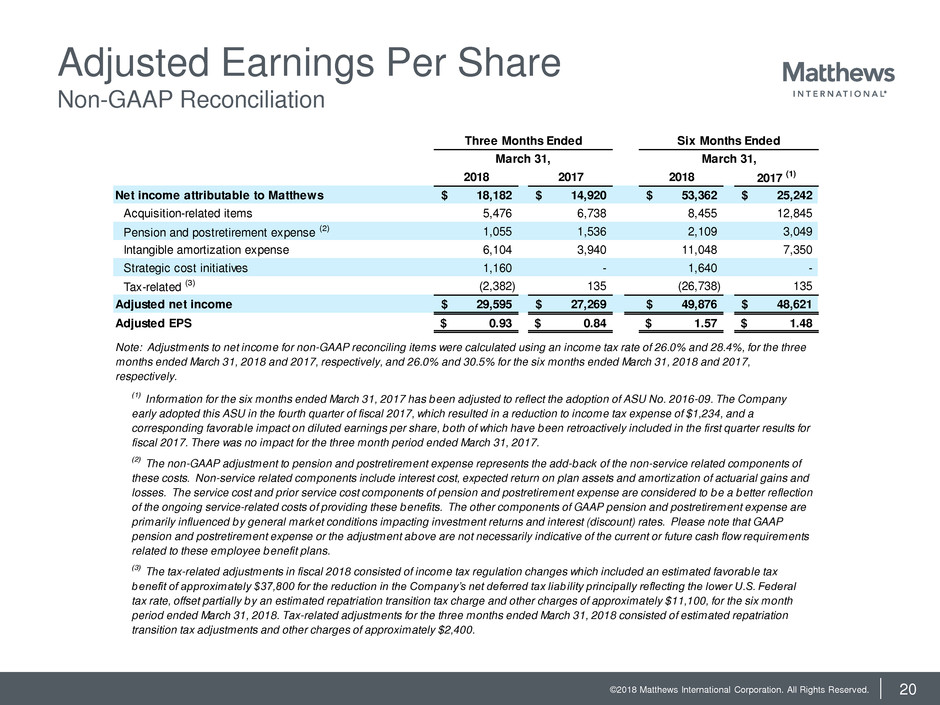
Adjusted Earnings Per Share
Non-GAAP Reconciliation
2018 2017 2018 2017 (1)
Net income attributable to Matthews 18,182$ 14,920$ 53,362$ 25,242$
Acquisition-related items 5,476 6,738 8,455 12,845
Pension and postretirement expense (2) 1,055 1,536 2,109 3,049
Intangible amortization expense 6,104 3,940 11,048 7,350
Strategic cost initiatives 1,160 - 1,640 -
Tax-related (3) (2,382) 135 (26,738) 135
Adjusted net income 29,595$ 27,269$ 49,876$ 48,621$
Adjusted EPS 0.93$ 0.84$ 1.57$ 1.48$
(1)
Information for the six months ended March 31, 2017 has been adjusted to reflect the adoption of ASU No. 2016-09. The Company
early adopted this ASU in the fourth quarter of fiscal 2017, which resulted in a reduction to income tax expense of $1,234, and a
corresponding favorable impact on diluted earnings per share, both of which have been retroactively included in the first quarter results for
fiscal 2017. There was no impact for the three month period ended March 31, 2017.
(2)
The non-GAAP adjustment to pension and postretirement expense represents the add-back of the non-service related components of
these costs. Non-service related components include interest cost, expected return on plan assets and amortization of actuarial gains and
losses. The service cost and prior service cost components of pension and postretirement expense are considered to be a better reflection
of the ongoing service-related costs of providing these benefits. The other components of GAAP pension and postretirement expense are
primarily influenced by general market conditions impacting investment returns and interest (discount) rates. Please note that GAAP
pension and postretirement expense or the adjustment above are not necessarily indicative of the current or future cash flow requirements
related to these employee benefit plans.
(3)
The tax-related adjustments in fiscal 2018 consisted of income tax regulation changes which included an estimated favorable tax
benefit of approximately $37,800 for the reduction in the Company’s net deferred tax liab ility principally reflecting the lower U.S. Federal
tax rate, offset partially by an estimated repatriation transition tax charge and other charges of approximately $11,100, for the six month
period ended March 31, 2018. Tax-related adjustments for the three months ended March 31, 2018 consisted of estimated repatriation
transition tax adjustments and other charges of approximately $2,400.
Three Months Ended Six Months Ended
March 31, March 31,
Note: Adjustments to net income for non-GAAP reconciling items were calculated using an income tax rate of 26.0% and 28.4%, for the three
months ended March 31, 2018 and 2017, respectively, and 26.0% and 30.5% for the six months ended March 31, 2018 and 2017,
respectively.

©2018 Matthews International Corporation. All Rights Reserved. 21
EBITDA and Adjusted EBITDA
Non-GAAP Reconciliation
2018 2017 2018 2017 (1)
Net income attributable to Matthews 18,182$ 14,920$ 53,362$ 25,242$
Interest expense 9,262 6,614 17,063 12,762
Income taxes (2) 2,212 5,973 (23,015) 8,462
Depreciation and amortization 19,748 17,135 36,986 32,294
EBITDA 49,404 44,642 84,396 78,760
Acquisition-related items 7,400 8,574 11,358 16,800
Strategic initiatives and other charges 1,568 - 2,215 -
Stock-based compensation 2,658 2,920 8,132 9,017
Pension and postretirement expense (3) 1,425 2,194 2,850 4,388
Adjusted EBITDA 62,455$ 58,330$ 108,951$ 108,965$
Adjusted EBITDA margin 15.1% 15.3% 13.9% 14.9%
Six Months EndedThree Months Ended
March 31, March 31,
(3)
The non-GAAP adjustment to pension and postretirement expense represents the add-back of the non-service related components
of these costs. Non-service related components include interest cost, expected return on plan assets and amortization of actuarial
gains and losses. The service cost and prior service cost components of pension and postretirement expense are considered to be a
better reflection of the ongoing service-related costs of providing these benefits. The other components of GAAP pension and
postretirement expense are primarily influenced by general market conditions impacting investment returns and interest (discount)
rates. Please note that GAAP pension and postretirement expense or the adjustment above are not necessarily indicative of the
current or future cash flow requirements related to these employee benefit plans.
(1)
Information for the six months ended March 31, 2017 has been adjusted to reflect the adoption of ASU No. 2016-09. The Company
early adopted this ASU in the fourth quarter of fiscal 2017, which resulted in a reduction to income tax expense of $1,234, and a
corresponding favorable impact on diluted earnings per share, both of which have been retroactively included in the first quarter
results for fiscal 2017. There was no impact for the three month period ended March 31, 2017.
(2)
The income tax regulation changes identified in the adjusted net income/earnings per share reconciliation are included in this line
and therefore not separately identified in the calculation of adjusted EBITDA.

©2018 Matthews International Corporation. All Rights Reserved. 22
Adjusted EBITDA by Segment
Non-GAAP Reconciliation
Note: See Disclaimer (Page 2) for Management’s assessment of
supplemental information related to EBITDA and adjusted EBITDA.
(1) Information for the first six months ended March 31, 2017 has
been adjusted to reflect the adoption of ASU No. 2016-09. The
Company early adopted this ASU in the fourth quarter of fiscal
2017, which resulted in a reduction to income tax expense of
$1,234, and a corresponding favorable impact on diluted
earnings per share, both of which have been retroactively
included in the first quarter results for fiscal 2017. There was
no impact for the three month period ended March 31, 2017.
(2) One-time depreciation and amortization charges related to recent
acquisitions are included in the Depreciation and amortization.
(3) Other represents Investment (loss) income, Other income
(deductions), net, and Net loss (income) attributable to
noncontrolling interests
(4) One-time non-operating related charges are included in the
calculation of Adjusted EBITDA.
(5) The non-GAAP adjustment to pension and postretirement
expense represents the add-back of the non-service related
components of these costs. Non-service related components
include interest cost, expected return on plan assets and
amortization of actuarial gains and losses. The service cost and
prior service cost components of pension and post retirement
expense are considered to be a better reflection of the ongoing
service-related costs of providing these benefits. The other
components of GAAP pension and postretirement expense are
primarily influenced by general market conditions impacting
investment returns and interest (discount) rates. Please note that
GAAP pension and postretirement expense or the adjustment
above are not necessarily indicative of the current or future cash
flow requirements related to these employee benefit plans.
2018 2017 2018 2017 (1)
SGK Brand Solutions
Operating profit 5,090$ 4,361$ 8,242$ 8,551$
Depreciation and amortization (2) 12,565 10,926 24,018 19,898
Other (3) (63) 316 (142) 267
EBITDA 17,592 15,602 32,118 28,717
Acquisition-related items (2) 6,139 6,475 9,646 12,877
Strategic initiatives and other charges (4) 429 - 698 -
Stock-based compensation 1,159 1,331 3,576 4,149
Pension and postretirement expense (5) 663 1,020 1,325 2,040
Adjusted EBITDA 25,982$ 24,429$ 47,363$ 47,783$
Memorialization
Operating profit 23,910$ 22,938$ 38,364$ 37,305$
Depreciation and amortization (2) 5,647 5,574 10,248 11,103
Other (3) (64) 323 (145) 273
EBITDA 29,493 28,834 48,467 48,681
Acquisition-related items (2) 1,180 1,956 1,631 3,479
Strategic initiatives and other charges (4) 642 - 930 -
Stock-based compensation 1,290 1,371 3,961 4,259
Pension and postretirement expense (5) 677 1,042 1,354 2,084
Adjusted EBITDA 33,282$ 33,203$ 56,343$ 58,503$
Industrial Technologies
Operating profit 791$ (471)$ 1,109$ 35$
Depreciation and amortization (2) 1,536 636 2,720 1,293
Other (3) (8) 41 (18) 35
EBITDA 2,319 205 3,811 1,362
Acquisition-related items (2) 81 143 81 444
Strategic initiatives and other charges (4) 497 - 587 -
Stock-based compensation 209 218 595 610
Pension and postretirement expense (5) 86 132 171 263
Adjusted EBITDA 3,191$ 698$ 5,244$ 2,679$
Consolidated
Operating profit 29,791$ 26,828$ 47,715$ 45,891$
Depreciation and amortization (2) 19,748 17,135 36,986 32,294
Other (3) (135) 679 (305) 575
EBITDA 49,404 44,642 84,396 78,760
Acquisition-related items (2) 7,400 8,574 11,358 16,800
Strategic initiatives a d other charges (4) 1,568 - 2,215 -
Stock-based com s tion 2,658 2,920 8,132 9,017
Pension and postr ti ent expense (5) 1,425 2,194 2,850 4,388
Adjusted EBITDA 62,455$ 58,330$ 108,951$ 108,965$
March 31, March 31,

©2018 Matthews International Corporation. All Rights Reserved.
Second Quarter Fiscal 2018
Earnings Teleconference
April 27, 2018
