Attached files
| file | filename |
|---|---|
| 8-K - 8-K - BLACKSTONE MORTGAGE TRUST, INC. | d565486d8k.htm |
| EX-99.1 - EX-99.1 - BLACKSTONE MORTGAGE TRUST, INC. | d565486dex991.htm |
 Blackstone Mortgage Trust, Inc. April 24, 2018 First Quarter 2018 Results Exhibit 99.2 |
 Blackstone Mortgage Trust 1 BXMT Highlights 8.1% Dividend Yield (b) Blackstone Real Estate platform provides expert management 100% performing loan portfolio generates current cash income Stable assets financed with long- term, match-funded liabilities Portfolio positioned for yield and value protection in changing rate environment Information included in this presentation is as of or for the period ended March 31, 2018, unless otherwise indicated.
(a) See Appendix for a definition and reconciliation to GAAP net income (b) Based on annualized dividend and BXMT closing price as of April 23, 2018
(c) Reflects LTV as of the date loans were originated or acquired by BXMT (d) Changes in interest rates and credit spreads may affect our net interest income from loans and other investments. Reflects impact on net
income, net of incentive fees. See Appendix for important
disclosures. $0.62
1Q Dividend
62%
Loan-to-Value
(c)
$12.1B
Senior Loan Portfolio
94%
Floating Rate
+$0.24
Earnings
Impact
per
1%
Increase in LIBOR
(d)
$120B
BX Real Estate Investor
Capital under Management
$1.9B
1Q Originations
BXMT
originated $1.9 billion of senior commercial real estate loans
growing its portfolio by
$1.0
billion
in
1Q
and
generating
$0.56
of
GAAP
EPS
and
$0.64
of
Core
EPS
(a)
Expertise
Income
Stability
Protection |
 Blackstone Mortgage Trust 2 Loan Originations Loan Originations Record direct origination volume of $1.9 billion and net fundings of $1.0 billion Closed €1.0 billion loan secured by portfolio of Spanish assets, and subsequent to quarter end closed a $1.8 billion office construction loan in Hudson Yards, Manhattan Earnings & Dividends Earnings & Dividends 1Q EPS of $0.56 and Core Earnings (a) of $0.64 per share, or $69 million Paid $0.62 per share dividend and increased book value per share by $0.02 to $26.95 First Quarter 2018 Results Portfolio Composition Portfolio Composition Financing Financing Interest Rates Interest Rates Growth of 9% during 1Q resulted in a $12.1 billion total portfolio of senior loans (b) 100% performing portfolio with a weighted average origination LTV (c) of 62% Issued $220 million of five-year convertible notes with a coupon of 4.75% Added $2.8 billion of term and currency matched credit facility capacity (a) See Appendix for a definition and reconciliation to GAAP net income (b) Includes $996 million of Non-Consolidated Senior Interests; see Appendix for definition
(c) Reflects LTV as of the date loans were originated or acquired by BXMT (d) Changes in interest rates and credit spreads may affect our net interest income from loans and other investments. Reflects impact on net
income, net of incentive fees. See Appendix for important
disclosures. 94%
of
the
portfolio
is
floating
rate
1.0%
increase
in
LIBOR
would
increase
earnings
per
share
by
$0.24
per
annum
(d) |
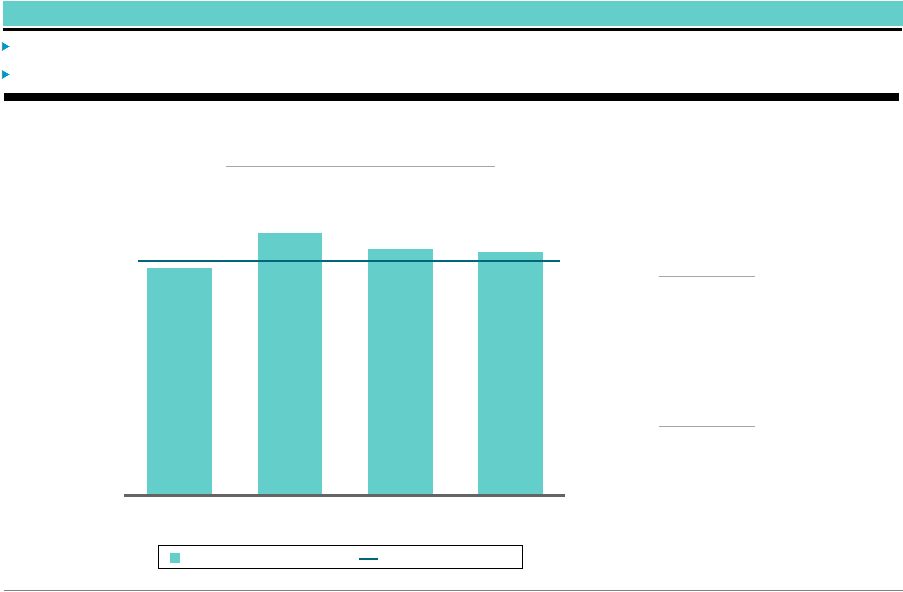 Blackstone Mortgage Trust 3 $0.60 $0.69 $0.65 $0.64 2Q'17 3Q'17 4Q'17 1Q'18 Dividends per Share Dividend Coverage (c) Earnings & Dividends Earnings & Dividends 1Q GAAP earnings of $0.56 per share and Core Earnings (a) of $0.64 per share $0.62 per share dividend equates to a 8.1% dividend yield (b) (a) See Appendix for a definition and reconciliation to GAAP net income (b) Based on annualized dividend and BXMT closing price as of April 23, 2018
(c) GAAP EPS of $0.53, $0.61, $0.59 and $0.56 as of 2Q’17, 3Q’17, 4Q’17 and 1Q’18, respectively
$0.62
Quarterly Dividend
104%
Dividend Coverage
Core Earnings per Share |
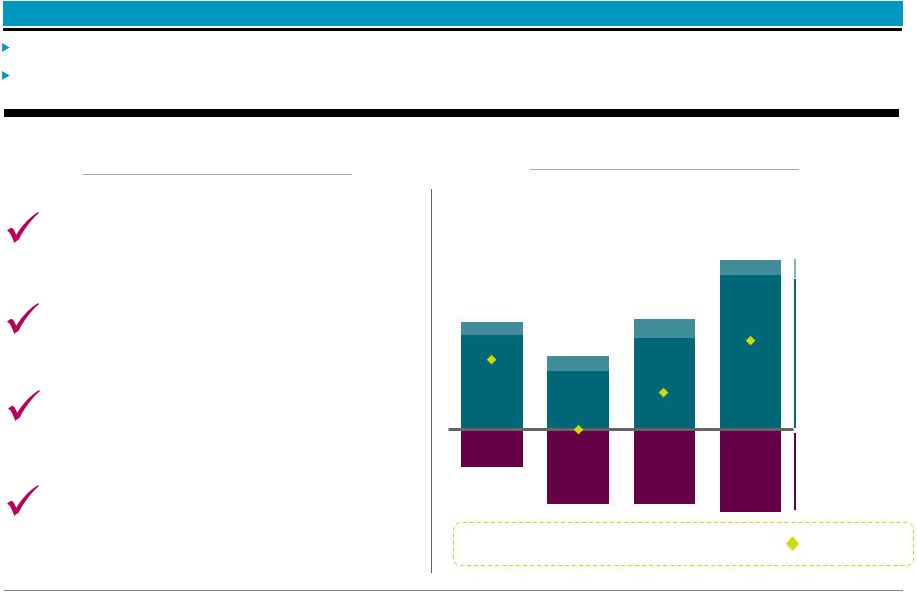 Blackstone Mortgage Trust 4 $1.1 $0.7 $1.1 $1.8 ($0.4) ($0.9) ($0.9) ($1.0) 2Q'17 3Q'17 4Q'17 1Q'18 Loan Originations Loan Originations Origination volume of $1.9 billion, up $651 million from 4Q and net fundings of $1.0 billion, up $601 million $180 million in fundings of previously originated commitments resulting in total gross fundings of $2.0 billion, up $692 million from 4Q ($ in billions) $0.8 Fundings of New Loans Repayments Net Fundings $0.4 Net Fundings $1.3 $0.9 $1.3 $2.0 ($0.0) $1.0 Fundings of Existing Loans 100% senior loans 100% floating rate Large loans: $309 million avg. size (b) 1Q Origination Highlights Weighted average LTV (a) of 66% (a) Reflects LTV as of the date loans were originated or acquired by BXMT (b) Excludes loans originated in the BXMT-Walker & Dunlop joint venture |
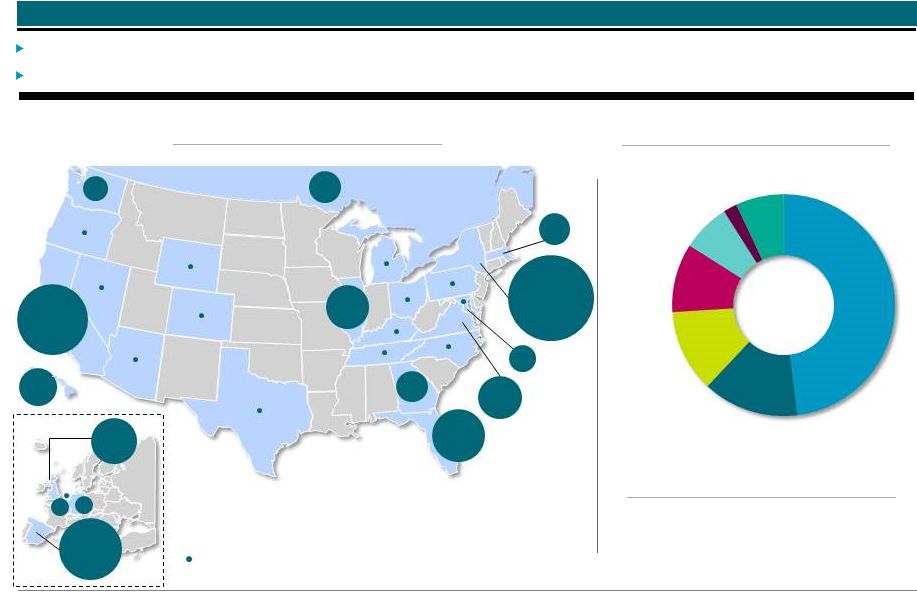 Blackstone Mortgage Trust 5 48% 14% 12% 10% 7% 2% 7% Retail Portfolio Composition $12.1 billion portfolio (106 senior loans) secured by institutional quality real estate with 59% of loans in gateway markets Sole previously “4
”
risk
rated
loan
($20
million)
was
upgraded
to
“3 ” during 1Q and repaid in full subsequent to quarter end Office Spanish Assets Hotel Other Multi Geographic Diversification (a) Collateral Diversification (a) (a) In certain instances, we finance our loans through the non-recourse sale of a senior loan interest that is not included in our
consolidated financial statements. See Note 2 in our Form
10-Q for further discussion. Total loan exposure encompasses the entire loan we originated and financed, including $996 million of such Non- Consolidated Senior Interests as of March 31, 2018. (b) Reflects LTV as of the date loans were originated or acquired by BXMT Weighted Average LTV (b) 62% States that comprise less than 1% of total loan portfolio $12.1B portfolio MA 3% CAN 3% CA 16% WA 2% HI 4% DC 2% GA 3% IL 6% FL 8% VA 6% NY 22% DEU 1% BE 1% UK 7% ES 10% Condo |
 Blackstone Mortgage Trust 6 Financing Issued $220 million of five-year convertible notes with a coupon of 4.75% Added $2.8 billion of term and currency matched credit facility capacity with five counterparties Financing (outstanding balance) (a) In addition to $118.2 million of loan participations sold, includes $996 million of Non-Consolidated Senior Interests, which result
from non-recourse sales of senior loan interests in loans
BXMT originates. BXMT’s net investments in these loans are reflected in the form of mezzanine or other subordinate loans on BXMT’s balance sheet. (b) Represents (i) total outstanding secured debt agreements and convertible notes, less cash, to (ii) total equity
Credit Facilities
11 Credit Providers
Corporate Debt
Convertible Notes and Secured Facility
Corporate Obligations
Senior Loan
Interests
(a)
$6.0
$0.8
$1.1
$6.8
Securitized
Debt
$1.3
CLO and Single Asset Securitization
($ in billions)
2.3x
Debt-to-Equity Ratio
(b)
Senior Syndications |
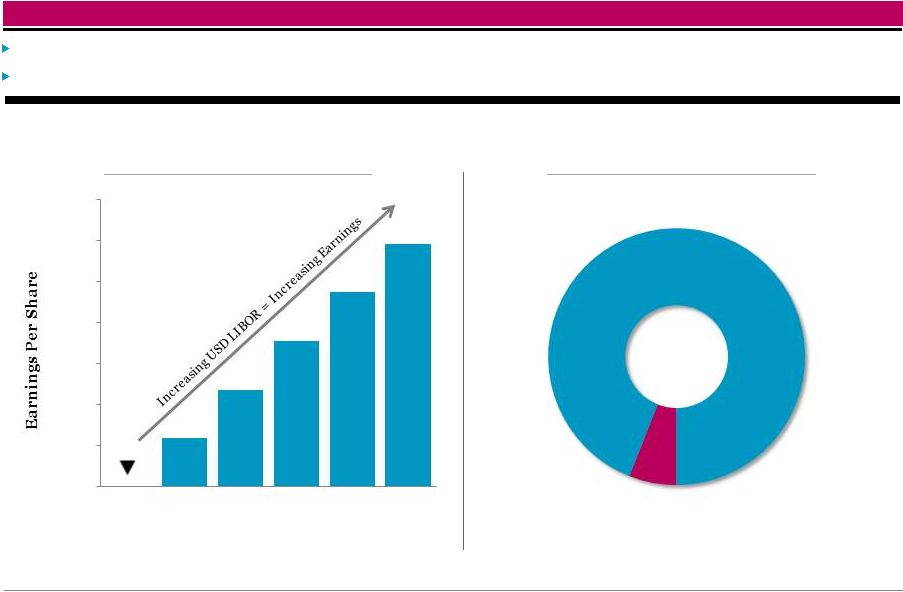 Blackstone Mortgage Trust 7 6% 94% Interest Rates Earnings are positively correlated to changes in USD LIBOR, the benchmark index for 82% of BXMT’s net loan equity A 1.0% increase in USD LIBOR would increase earnings per share by $0.24 per annum (a) (a) Changes in interest rates and credit spreads may affect our net interest income from loans and other investments. Reflects impact on net
income, net of incentive fees. See Appendix for important
disclosures. Earnings
Sensitivity
to
USD
LIBOR
(a)
(Annual Dollars of Earnings per Share)
USD LIBOR
Portfolio Fixed vs. Floating
(% of Total Loan Exposure)
Floating
Fixed
$0.00
$0.10
$0.20
$0.30
$0.40
$0.50
$0.60
$0.70
1.88%
2.38%
2.88%
3.38%
3.88%
4.38% |
 Appendix |
 Blackstone Mortgage Trust 9 4Q'17 Loans Outstanding Fundings Repayments 1Q'18 Loans Outstanding GAAP Net Income Adjustments Core Earnings Interest Income 155.4 $ - $ 155.4 $ Interest Expense (70.0) 0.5 (69.5)
Management and
Incentive Fees
(15.5)
—
(15.5)
G&A / Other
(1.7)
0.8
(0.9)
Non-Cash
Compensation
(7.0)
7.0
—
Net income attributable to
non-controlling interests
(0.2)
—
(0.2)
Total
61.0
$
8.3
$
69.3
$
Appendix – First Quarter 2018 Operating Results & Net Funding $1.0 billion (b) Net Fundings Net Funding ($ in billions) Operating Results ($ in millions) $11.1 $2.0 $(1.0) $12.1 (a) Includes $985 million and $996 million of Non-Consolidated Senior Interests as of December 31, 2017 and March 31, 2018, respectively;
see Appendix for definition (b)
Excludes the impact of changes in foreign currency rates and hedges for
non-USD loans and financings $0.64
Core Earnings per Share
$0.56
Net Income per Share
(a) (a) |
 Blackstone Mortgage Trust 10 (a) Date loan was originated or acquired by BXMT, and the LTV as of such date
(b) In certain instances, loans are financed through the non-recourse sale of a senior loan interest that is not included in the
consolidated financial statements. As of March 31, 2018, three
loans in the portfolio have been financed with an aggregate $996 million of Non-Consolidated Senior Interests, which are included in the table above. (c) Maximum maturity assumes all extension options are exercised; however, floating rate loans generally may be repaid prior to their final
maturity without penalty (d)
Consists of both floating and fixed rates. Coupon and all-in yield assume
applicable floating benchmark rates for weighted-average calculation. Loan Portfolio Details ($ in millions) Origination Total Principal Net Book Maximum Property Loan Per Origination Loan Type Date (a) Loan (b) Balance (b) Value Maturity (c) Location Type SQFT / Unit / Key LTV (a) Loan 1 Senior loan 3/22/2018 $ 1,230 $ 1,230 $ 1,220 L + 3.15 % L + 3.40 % 3/15/2023 Diversified - Spain Spanish Assets n/a 67 % Loan 2 Senior loan 5/11/2017 753 669 665 L + 3.40 % L + 3.60 % 6/10/2023 Northern Virginia Office 327 / sqft 62 % Loan 3 Senior loan (b) 5/15/2015 590 555 94 L + 4.25 % L + 4.58 % 5/15/2020 Miami Retail 704 / sqft 36 % Loan 4 Senior loan (b) 8/6/2015 518 518 94 4.49 % 5.81 % 10/29/2022 Diversified - EUR Other n/a 71 % Loan 5 Senior loan 1/7/2015 315 298 297 L + 3.50 % L + 3.71 % 1/9/2021 New York Office 255 / sqft 53 % Loan 6 Senior loan 5/1/2015 320 295 294 L + 3.45 % L + 3.83 % 5/1/2020 New York Office 375 / sqft 68 % Loan 7 Senior loan 2/13/2018 330 294 293 L + 3.42 % L + 3.54 % 3/9/2023 New York Multi 711,951 / unit 62 % Loan 8 Senior loan 3/31/2017 258 242 240 L + 4.15 % L + 4.54 % 4/9/2022 Maui Hotel 318,182 / key 75 % Loan 9 Senior loan 12/22/2017 225 225 223 L + 2.80 % L + 3.16 % 1/9/2023 Chicago Multi 326,087 / unit 65 % Loan 10 Senior loan 6/4/2015 223 223 225 L + 4.20 % L + 4.20 % 3/19/2021 Diversified - CAN Hotel 37,447 / key 54 % Loan 11 Senior loan 6/23/2015 222 215 215 L + 3.65 % L + 4.00 % 5/8/2022 Washington DC Office 241 / sqft 72 % Loan 12 Senior loan 8/3/2016 276 208 207 L + 4.66 % L + 5.23 % 8/9/2021 New York Office 286 / sqft 57 % Loan 13 Senior loan 2/25/2014 195 195 194 L + 4.01 % L + 4.46 % 3/9/2021 Diversified - US Hotel 102,470 / key 55 % Loan 14 Senior loan 8/19/2016 200 190 190 L + 3.64 % L + 4.10 % 9/9/2021 New York Office 580 / sqft 69 % Loan 15 Senior loan 4/15/2016 200 189 189 L + 4.25 % L + 4.86 % 5/9/2021 New York Office 176 / sqft 40 % Loans 16 - 106 Senior loans Various 7,787 6,593 6,441 5.68 % (d) 6.09 % (d) Various Various Various Various 62 % Total/Wtd. avg. $ 13,641 $ 12,137 $ 11,082 5.36 % 5.78 % 3.7 yrs 62 % Cash All-in Coupon Yield |
 Blackstone Mortgage Trust 11 Consolidated Balance Sheets ($ in thousands, except per share data) March 31, 2018 December 31, 2017 Assets Cash and cash equivalents 57,396 $
69,654
$
Restricted
Cash 17,082
32,864 Loans receivable, net 11,081,716 10,056,732 Other assets 55,096 99,575 Total assets 11,211,290 $
10,258,825 $
Liabilities and equity
Secured debt agreements, net
5,996,880 $
5,273,855 $
Loan participations sold, net
117,926 80,415 Securitized debt obligations, net 1,282,279 1,282,412 Convertible notes, net 778,070 563,911 Other liabilities 109,624 140,826 Total liabilities 8,284,779 7,341,419 Commitments and contingencies — — Equity Class A common stock, $0.01 par value 1,082 1,079 Additional paid-in capital 3,515,418 3,506,861 Accumulated other comprehensive loss (21,903) (29,706) Accumulated deficit (573,384) (567,168) Total Blackstone Mortgage Trust, Inc. stockholders’ equity 2,921,213 2,911,066 Non-controlling interests 5,298 6,340 Total equity 2,926,511 2,917,406 Total liabilities and equity 11,211,290 $
10,258,825 $ |
 Blackstone Mortgage Trust 12 Consolidated Statements of Operations ($ in thousands, except per share data) Three Months Ended March 31, 2018 2017 Income from loans and other investments Interest and related income 155,425 $ 118,517 $ Less: Interest and related expenses 69,989 46,674 Income from loans and other investments, net 85,436 71,843 Other expenses Management and incentive fees 15,492 12,921 General and administrative expenses 8,708 7,428 Total other expenses 24,200 20,349 Income before income taxes 61,236 51,494 Income tax provision 120 89 Net income 61,116 $
51,405 $
Net income attributable to non-controlling interests
(158) — Net income attributable to Blackstone Mortgage Trust, Inc. 60,958 $
51,405 $
Per share information (basic and diluted)
Weighted-average shares of common stock outstanding
108,397,598 94,993,386 Net income per share of common stock 0.56 $
0.54 $
|
 Blackstone Mortgage Trust 13 Per Share Calculations (a) Represents net income attributable to Blackstone Mortgage Trust, Inc. (b) Adjustment in respect of the deferral in Core Earnings of the accretion of a total $9.1 million of purchase discount attributable to a
certain pool of GE portfolio loans until repayment in full of the
remaining loans in the pool is substantially assured
Core Earnings
Reconciliation
Book Value
per Share
Earnings
per Share
March 31, 2018
December 31, 2017
Stockholders' equity
2,921,213 $
2,911,066 $
Shares Class A common stock 108,194 107,884 Deferred stock units
205 197
Total outstanding 108,399 108,081 Book value per share
26.95 $
26.93
$
(Amounts in thousands, except per share data) Three Months Ended March 31, 2018 December 31, 2017 Net income (a) 60,958 $
57,891 $
Weighted-average shares outstanding, basic and
diluted 108,398
98,811 Earnings per share, basic and diluted 0.56 $
0.59
$
Three Months Ended March 31, 2018 December 31, 2017 Net income (a) 60,958 $
57,891 $
Non-cash compensation expense
6,976 6,221 GE purchase discount accretion adjustment (b) (17) (483) Other items 1,388 874 Core Earnings 69,305 $
64,503 $
Weighted-average shares outstanding, basic and
diluted 108,398
98,811 Core Earnings per share, basic and diluted 0.64 $
0.65
$
|
 Blackstone Mortgage Trust 14 Reconciliation of Net Income to Core Earnings (a) Represents net income attributable to Blackstone Mortgage Trust, Inc. (b) Adjustment in respect of the deferral in Core Earnings of the accretion of a total $9.1 million of purchase discount attributable to a
certain pool of GE portfolio loans until repayment in full of the
remaining loans in the pool is substantially assured (Amounts in
thousands, except per share data) Mar 31,
2018 Dec 31, 2017 Sep 30, 2017 Jun 30, 2017 Net income (a) 60,958 $ 57,891 $ 57,722 $ 50,613 $ Non-cash compensation expense 6,976 6,221 5,944 5,959 GE purchase discount accretion adjustment (b) (17) (483) (138) (198) Other items 1,388 874 1,610 1,001 Core Earnings 69,305 $ 64,503 $ 65,138 $ 57,375 $ Weighted-average shares outstanding, basic and diluted 108,398 $ 98,811 $ 95,013 $ 95,006 $ Net income per share, basic and diluted 0.56 $ 0.59 $ 0.61 $ 0.53 $ Core Earnings per share, basic and diluted 0.64 $ 0.65 $ 0.69 $ 0.60 $ Three Months Ended |
 Blackstone Mortgage Trust 15 Definitions Core Earnings: Blackstone Mortgage Trust, Inc. (“BXMT”) discloses Core Earnings in this presentation. Core Earnings is a financial measure that is calculated and presented on the basis of methodologies other than in accordance with generally accepted accounting principles in the United States of America (“GAAP”). Core Earnings is an adjusted measure that helps BXMT evaluate its performance excluding the effects of certain transactions and GAAP adjustments that it believes are not necessarily indicative of its current loan origination portfolio and operations. Although according to its management agreement BXMT calculates the incentive and base management fees due to its Manager using Core Earnings before incentive fees expense, BXMT reports Core Earnings after incentive fees expense, as BXMT believes this is a more meaningful presentation of the economic performance of its class A common stock. Core Earnings is defined as GAAP net income (loss), including realized gains and losses not otherwise included in GAAP net income (loss), and excluding (i) net income (loss) attributable to the CT Legacy Portfolio, (ii) non-cash equity compensation expense, (iii) depreciation and amortization, (iv) unrealized gains (losses), and (v) certain non-cash items. Core Earnings may also be adjusted from time to time to exclude one-time events pursuant to changes in GAAP and certain other non-cash charges as determined by BXMT’s manager, subject to approval by a majority of its independent directors. Core Earnings does not represent net income or cash generated from operating activities and should not be considered as an alternative to GAAP net income, or an indication of BXMT’s GAAP cash flows from operations, a measure of BXMT’s liquidity, or an indication of funds available for its cash needs. In addition, BXMT’s methodology for calculating Core Earnings may differ from the methodologies employed by other companies to calculate the same or similar supplemental performance measures, and accordingly, its reported Core Earnings may not be comparable to the Core Earnings reported by other companies. Non-Consolidated Senior Interests: Senior interests in loans originated and syndicated to third parties. These non-recourse loan participations, which are excluded from the GAAP balance sheet, constitute additional financing capacity and are included in discussions of the loan portfolio. Earnings Sensitivity to LIBOR: Reflects the impact on net income, net of incentive fees, assuming no changes in credit spreads, portfolio composition, or asset performance. Assumes no change in general and administrative expenses, management fees, or other non-interest expenses relative to those incurred for the quarter ended March 31, 2018. |
 Blackstone Mortgage Trust 16 Forward-Looking Statements This presentation may contain forward-looking statements within the meaning of Section 27A of the Securities Act of 1933, as amended, and Section 21E of the Securities Exchange Act of 1934, as amended, which reflect BXMT’s current views with respect to, among other things, its operations and financial performance. You can identify these forward-looking statements by the use of words such as “outlook,” “indicator,” “believes,” “expects,” “potential,” “continues,” “may,” “will,” “should,” “seeks,” “predicts,” “intends,” “plans,” “estimates,” “anticipates” or the negative version of these words or other comparable words. Such forward- looking statements are subject to various risks and uncertainties. Accordingly, there are or will be important factors that could cause actual outcomes or results to differ materially from those indicated in these statements. BXMT believes these factors include but are not limited to those described under the section entitled “Risk Factors” in its Annual Report on Form 10-K for the fiscal year ended December 31, 2017, as such factors may be updated from time to time in its periodic filings with the Securities and Exchange Commission (“SEC”) which are accessible on the SEC’s website at www.sec.gov. These factors should not be construed as exhaustive and should be read in conjunction with the other cautionary statements that are included in this presentation and in the filings. BXMT assumes no obligation to update or supplement forward-looking statements that become untrue because of subsequent events or circumstances. |