Attached files
| file | filename |
|---|---|
| EX-99.1 - EXHIBIT 99.1 EARNINGS RELEASE - TEXAS CAPITAL BANCSHARES INC/TX | a04182018exhibit991.htm |
| 8-K - 8-K - TEXAS CAPITAL BANCSHARES INC/TX | a04182018-8k.htm |
TCBI Q1 2018
Earnings
April 18, 2018
Certain matters discussed within or in connection with these materials may contain “forward-looking statements” as defined in federal
securities laws, which are subject to risks and uncertainties and are based on Texas Capital’s current estimates or expectations of future
events or future results. These statements are not historical in nature and can generally be identified by such words as “believe,”
“expect,” “estimate,” “anticipate,” “plan,” “may,” “will,” “intend” and similar expressions. A number of factors, many of which are
beyond our control, could cause actual results to differ materially from future results expressed or implied by such forward-looking
statements. These risks and uncertainties include, but are not limited to, the credit quality of our loan portfolio, general economic
conditions in the United States and in our markets, including the continued impact on our customers from declines and volatility in oil
and gas prices, the financial impact of the Tax Cuts and Jobs Act on our results of operations, rates of default or loan losses, volatility in
the mortgage industry, the success or failure of our business strategies, future financial performance, future growth and earnings, the
appropriateness of our allowance for loan losses and provision for credit losses, the impact of increased regulatory requirements and
legislative changes on our business, increased competition, interest rate risk, the success or failure of new lines of business and new
product or service offerings and the impact of new technologies. These and other factors that could cause results to differ materially
from those described in the forward-looking statements, as well as a discussion of the risks and uncertainties that may affect our
business, can be found in our Annual Report on Form 10-K and in other filings we make with the Securities and Exchange Commission.
Forward-looking statements speak only as of the date of this presentation. Texas Capital is under no obligation, and expressly disclaims
any obligation, to update, alter or revise its forward-looking statements, whether as a result of new information, future events or
otherwise.
2
3
Opening Remarks & Financial Highlights
Core
Earnings
Power
Balanced
Growth
Credit
Quality
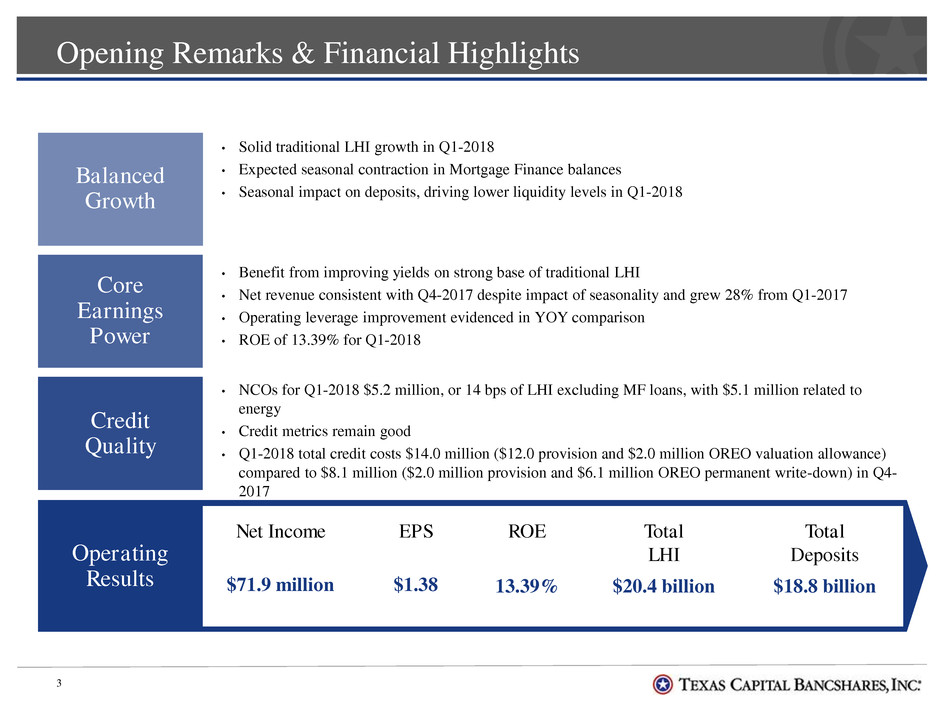
• Solid traditional LHI growth in Q1-2018
• Expected seasonal contraction in Mortgage Finance balances
• Seasonal impact on deposits, driving lower liquidity levels in Q1-2018
• Benefit from improving yields on strong base of traditional LHI
• Net revenue consistent with Q4-2017 despite impact of seasonality and grew 28% from Q1-2017
• Operating leverage improvement evidenced in YOY comparison
• ROE of 13.39% for Q1-2018
• NCOs for Q1-2018 $5.2 million, or 14 bps of LHI excluding MF loans, with $5.1 million related to
energy
• Credit metrics remain good
• Q1-2018 total credit costs $14.0 million ($12.0 provision and $2.0 million OREO valuation allowance)
compared to $8.1 million ($2.0 million provision and $6.1 million OREO permanent write-down) in Q4-
2017
Operating
Results
Net Income
$71.9 million
EPS
$1.38
ROE
CE
13.39%
Total
LHI
$20.4 billion
Total
Deposits
$18.8 billion
4
Energy and Retail Update
Energy Exposure
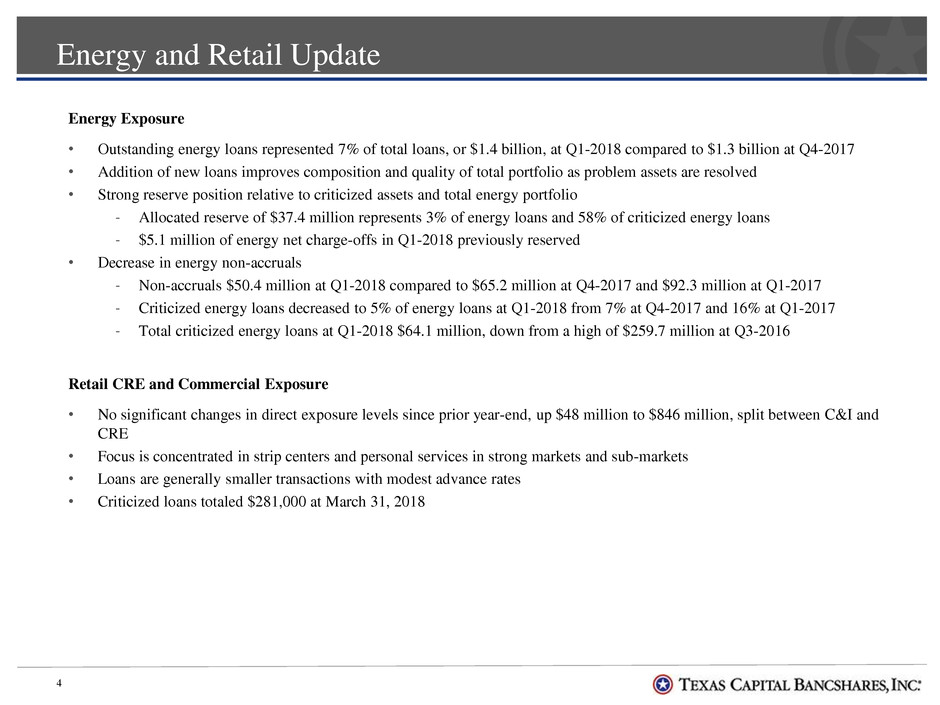
• Outstanding energy loans represented 7% of total loans, or $1.4 billion, at Q1-2018 compared to $1.3 billion at Q4-2017
• Addition of new loans improves composition and quality of total portfolio as problem assets are resolved
• Strong reserve position relative to criticized assets and total energy portfolio
‐ Allocated reserve of $37.4 million represents 3% of energy loans and 58% of criticized energy loans
‐ $5.1 million of energy net charge-offs in Q1-2018 previously reserved
• Decrease in energy non-accruals
‐ Non-accruals $50.4 million at Q1-2018 compared to $65.2 million at Q4-2017 and $92.3 million at Q1-2017
‐ Criticized energy loans decreased to 5% of energy loans at Q1-2018 from 7% at Q4-2017 and 16% at Q1-2017
‐ Total criticized energy loans at Q1-2018 $64.1 million, down from a high of $259.7 million at Q3-2016
Retail CRE and Commercial Exposure
• No significant changes in direct exposure levels since prior year-end, up $48 million to $846 million, split between C&I and
CRE
• Focus is concentrated in strip centers and personal services in strong markets and sub-markets
• Loans are generally smaller transactions with modest advance rates
• Criticized loans totaled $281,000 at March 31, 2018
9
,8
6
6
1
1
,6
5
4
6
,5
4
7
1
2
,2
1
8
-
2,000
4,000
6,000
8,000
10,000
12,000
14,000
Texas Regions National Businesses
$
M
il
li
o
n
s
Loans Deposits
5
Update on Geographic Diversification
Note: (1) Texas Regions loan balances include balances from the Energy business (2) Unemployment data through February 28, 2018
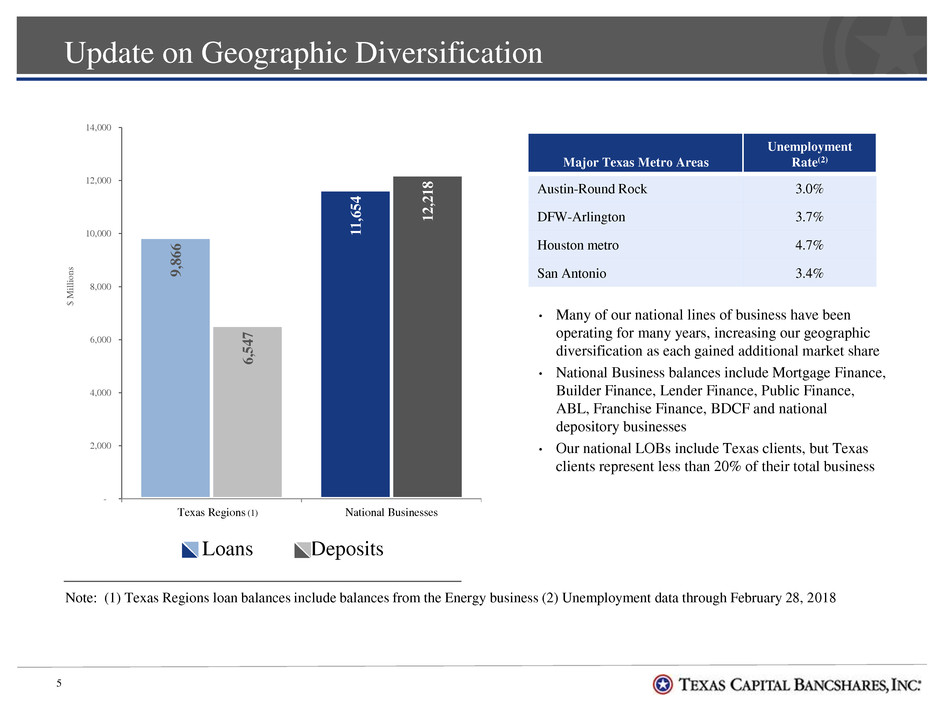
• Many of our national lines of business have been
operating for many years, increasing our geographic
diversification as each gained additional market share
• National Business balances include Mortgage Finance,
Builder Finance, Lender Finance, Public Finance,
ABL, Franchise Finance, BDCF and national
depository businesses
• Our national LOBs include Texas clients, but Texas
clients represent less than 20% of their total business
Major Texas Metro Areas
Unemployment
Rate(2)
Austin-Round Rock 3.0%
DFW-Arlington 3.7%
Houston metro 4.7%
San Antonio 3.4%
(1)
Net Interest Income & Margin
6
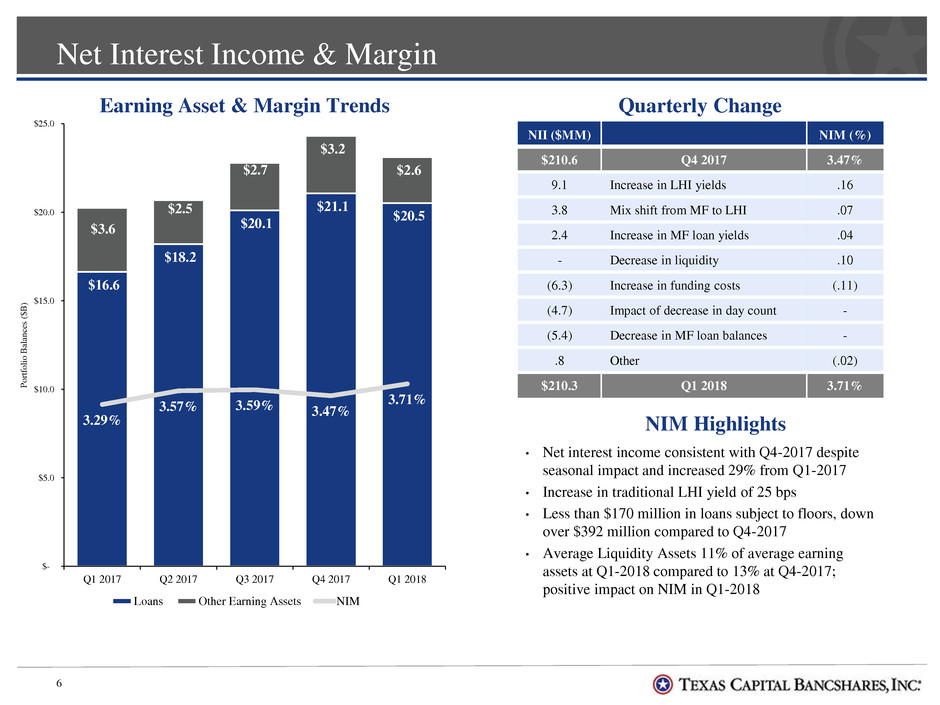
• Net interest income consistent with Q4-2017 despite
seasonal impact and increased 29% from Q1-2017
• Increase in traditional LHI yield of 25 bps
• Less than $170 million in loans subject to floors, down
over $392 million compared to Q4-2017
• Average Liquidity Assets 11% of average earning
assets at Q1-2018 compared to 13% at Q4-2017;
positive impact on NIM in Q1-2018
Quarterly Change
NII ($MM) NIM (%)
$210.6 Q4 2017 3.47%
9.1 Increase in LHI yields .16
3.8 Mix shift from MF to LHI .07
2.4 Increase in MF loan yields .04
- Decrease in liquidity .10
(6.3) Increase in funding costs (.11)
(4.7) Impact of decrease in day count -
(5.4) Decrease in MF loan balances -
.8 Other (.02)
$210.3 Q1 2018 3.71%
Earning Asset & Margin Trends
NIM Highlights
$16.6
$18.2
$20.1
$21.1
$20.5
$3.6
$2.5
$2.7
$3.2
$2.6
3.29%
3.57% 3.59% 3.47%
3.71%
0.00%
1.00%
2.00%
3.00%
4.00%
5.00%
6.00%
7.00%
8.00%
9.00%
$-
$5.0
$10.0
$15.0
$20.0
$25.0
Q1 2017 Q2 2017 Q3 2017 Q4 2017 Q1 2018
P
o
rt
fo
li
o
B
a
la
n
c
e
s
($
B
)
Loans Other Earning Assets NIM
Loan Growth
7
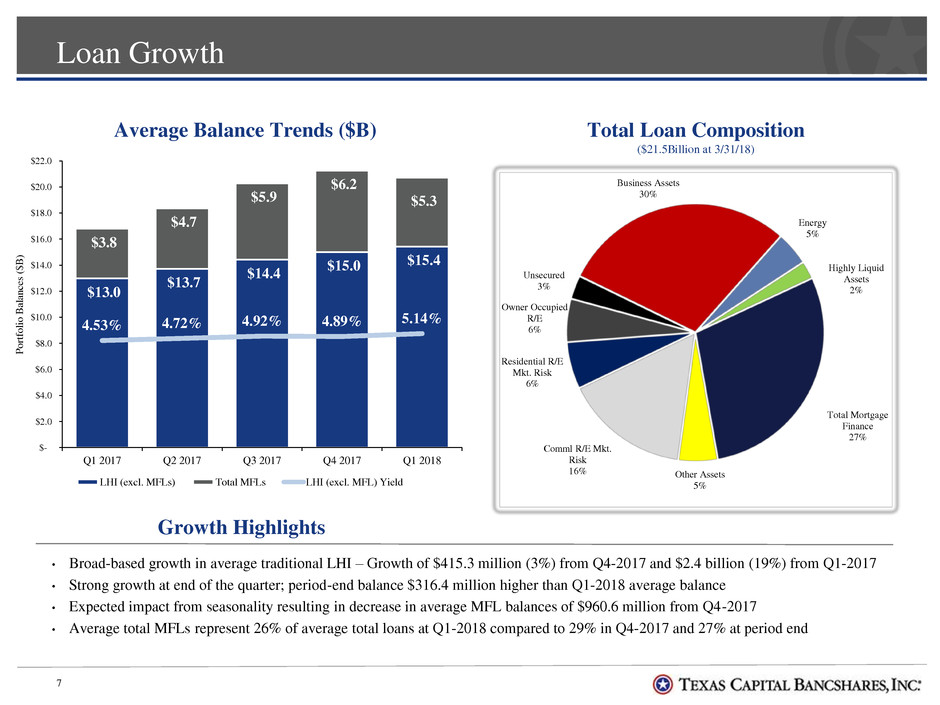
• Broad-based growth in average traditional LHI – Growth of $415.3 million (3%) from Q4-2017 and $2.4 billion (19%) from Q1-2017
• Strong growth at end of the quarter; period-end balance $316.4 million higher than Q1-2018 average balance
• Expected impact from seasonality resulting in decrease in average MFL balances of $960.6 million from Q4-2017
• Average total MFLs represent 26% of average total loans at Q1-2018 compared to 29% in Q4-2017 and 27% at period end
Growth Highlights
Average Balance Trends ($B) Total Loan Composition
($21.5Billion at 3/31/18)
Business Assets
30%
Energy
5%
Highly Liquid
Assets
2%
Total Mortgage
Finance
27%
Other Assets
5%
Comml R/E Mkt.
Risk
16%
Residential R/E
Mkt. Risk
6%
Owner Occupied
R/E
6%
Unsecured
3%
$13.0
$13.7
$14.4
$15.0 $15.4
$3.8
$4.7
$5.9
$6.2
$5.3
4.53% 4.72% 4.92% 4.89%
5.14%
-5.00%
0.00%
5.00%
10.00%
15.00%
20.00%
$-
$2.0
$4.0
$6.0
$8.0
$10.0
$12.0
$14.0
$16.0
$18.0
$20.0
$22.0
Q1 2017 Q2 2017 Q3 2017 Q4 2017 Q1 2018
Po
rtf
oli
o
B
ala
nc
es
($
B
)
LHI (excl. MFLs) Total MFLs LHI (excl. MFL) Yield

Deposit Growth
8
Average Balance Trends ($B) Funding Costs
• Deposit costs increased 13 bps from .53% at Q4-2017 to .66% at Q1-2018, and total funding costs increased 12 bps
• Continued focus on cost-effective deposit growth
‐ Seasonal decrease in linked quarter deposits resulting in more efficient use of liquidity
‐ Lower level of liquidity assets favorable to NIM in Q1-2018; some fluctuations may occur from quarter to quarter based on timing of
deposit growth relative to total loan growth
Growth Highlights
$9.4 $9.4
$10.3
$11.4 $11.3
$7.5 $7.9
$8.8
$9.1
$8.1
$-
$2.0
$4.0
$6.0
$8.0
$10.0
$12.0
$14.0
$16.0
$18.0
$20.0
$22.0
Q1 2017 Q2 2017 Q3 2017 Q4 2017 Q1 2018
D
ep
osit
B
ala
nc
es (
$B
)
Interest-Bearing Deposits DDAs
0.32%
0.38%
0.47%
0.53%
0.66%
0.40%
0.48%
0.56%
0.62%
0.74%
0.00%
0.20%
0.40%
0.60%
0.80%
1.00%
Q1 2017 Q2 2017 Q3 2017 Q4 2017
Avg Cost of Deposits Total Funding Costs

Non-interest Expense
9
Quarterly Change
Non-interest expense ($MM)
Increase/
(Decrease)
Q4 2017 $133.1
Salaries and employee benefits – FAS 123R
(includes stock price changes) (1.4)
Salaries and employee benefits – non-LTI
incentives and annual incentive pool (2.2)
Salaries and employee benefits – FICA and
seasonal payroll related items 5.5
Salaries and employee benefits – continued
build out .5
FDIC assessment (.6)
Legal and professional (1.2)
Servicing related expenses (3.4)
OREO related costs (4.0)
All other – includes occupancy, technology,
marketing .7
Q1 2018 $127.0
NIE - Efficiency
• Changes in Salaries & Benefits components of change
• Reduction of 123R expense
• Annual incentive accrual ramps throughout the
year and generally lower in Q1
• FICA and other payroll related items higher in
Q1
• Efficiency ratio (excluding OREO permanent write-
down) 54.3% for Q1-2018 compared to 55.2% for Q4-
2017; improvement despite Q1 seasonality impact
• Decrease in FAS 123R expense with stock price
changes; Q1-2018 expense of $5.6 million compared to
$7.0 million in Q4-2017 with $834,000 decrease
related to stock price
• Decrease in legal and professional expected as Q4-
2017 expense elevated related to some non-recurring
items not present in Q1-2018
• Decrease in OREO-related expenses
• $6.1 million permanent write-down recorded in
Q4-2017 compared to $2.0 million valuation
allowance recorded in Q1-2018; related to
single property
• Decrease in servicing related expenses
• $2.8 million MSR impairment related to
expected sale recorded in Q4-2017; no
impairment recorded in Q1-2018
Asset Quality
10
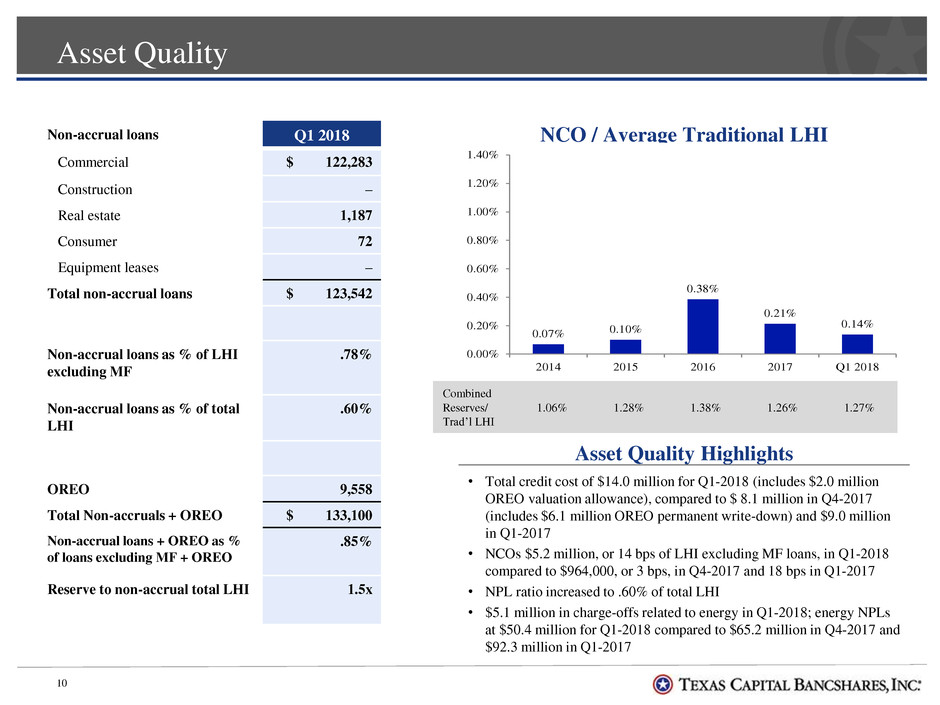
• Total credit cost of $14.0 million for Q1-2018 (includes $2.0 million
OREO valuation allowance), compared to $ 8.1 million in Q4-2017
(includes $6.1 million OREO permanent write-down) and $9.0 million
in Q1-2017
• NCOs $5.2 million, or 14 bps of LHI excluding MF loans, in Q1-2018
compared to $964,000, or 3 bps, in Q4-2017 and 18 bps in Q1-2017
• NPL ratio increased to .60% of total LHI
• $5.1 million in charge-offs related to energy in Q1-2018; energy NPLs
at $50.4 million for Q1-2018 compared to $65.2 million in Q4-2017 and
$92.3 million in Q1-2017
Asset Quality Highlights
Non-accrual loans Q1 2018
Commercial $ 122,283
Construction –
Real estate 1,187
Consumer 72
Equipment leases –
Total non-accrual loans $ 123,542
Non-accrual loans as % of LHI
excluding MF
.78%
Non-accrual loans as % of total
LHI
.60%
OREO 9,558
Total Non-accruals + OREO $ 133,100
Non-accrual loans + OREO as %
of loans excluding MF + OREO
.85%
Reserve to non-accrual total LHI 1.5x
NCO / Average Traditional LHI
Combined
Reserves/
Trad’l LHI
1.06% 1.28% 1.38% 1.26% 1.27%
0.07% 0.10%
0.38%
0.21%
0.14%
0.00%
0.20%
0.40%
0.60%
0.80%
1.00%
1.20%
1.40%
2014 2015 2016 2017 Q1 2018
Performance Summary - Quarterly
11
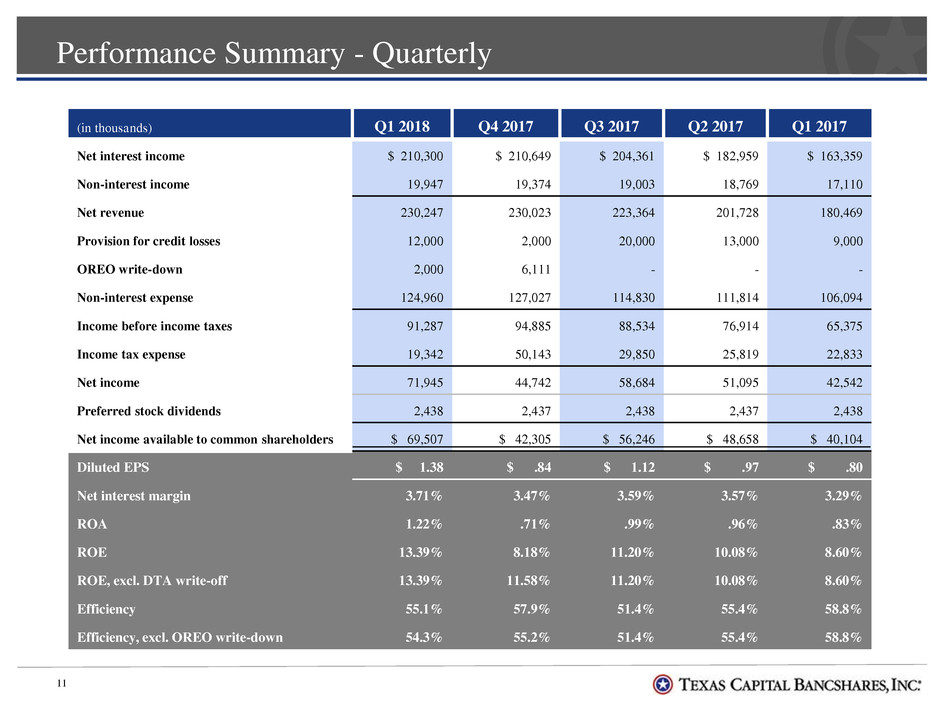
(in thousands) Q1 2018 Q4 2017 Q3 2017 Q2 2017 Q1 2017
Net interest income $ 210,300 $ 210,649 $ 204,361 $ 182,959 $ 163,359
Non-interest income 19,947 19,374 19,003 18,769 17,110
Net revenue 230,247 230,023 223,364 201,728 180,469
Provision for credit losses 12,000 2,000 20,000 13,000 9,000
OREO write-down 2,000 6,111 - - -
Non-interest expense 124,960 127,027 114,830 111,814 106,094
Income before income taxes 91,287 94,885 88,534 76,914 65,375
Income tax expense 19,342 50,143 29,850 25,819 22,833
Net income 71,945 44,742 58,684 51,095 42,542
Preferred stock dividends 2,438 2,437 2,438 2,437 2,438
Net income available to common shareholders $ 69,507 $ 42,305 $ 56,246 $ 48,658 $ 40,104
Diluted EPS $ 1.38 $ .84 $ 1.12 $ .97 $ .80
Net interest margin 3.71% 3.47% 3.59% 3.57% 3.29%
ROA 1.22% .71% .99% .96% .83%
ROE 13.39% 8.18% 11.20% 10.08% 8.60%
ROE, excl. DTA write-off 13.39% 11.58% 11.20% 10.08% 8.60%
Efficiency 55.1% 57.9% 51.4% 55.4% 58.8%
Efficiency, excl. OREO write-down 54.3% 55.2% 51.4% 55.4% 58.8%
2018 Outlook
12
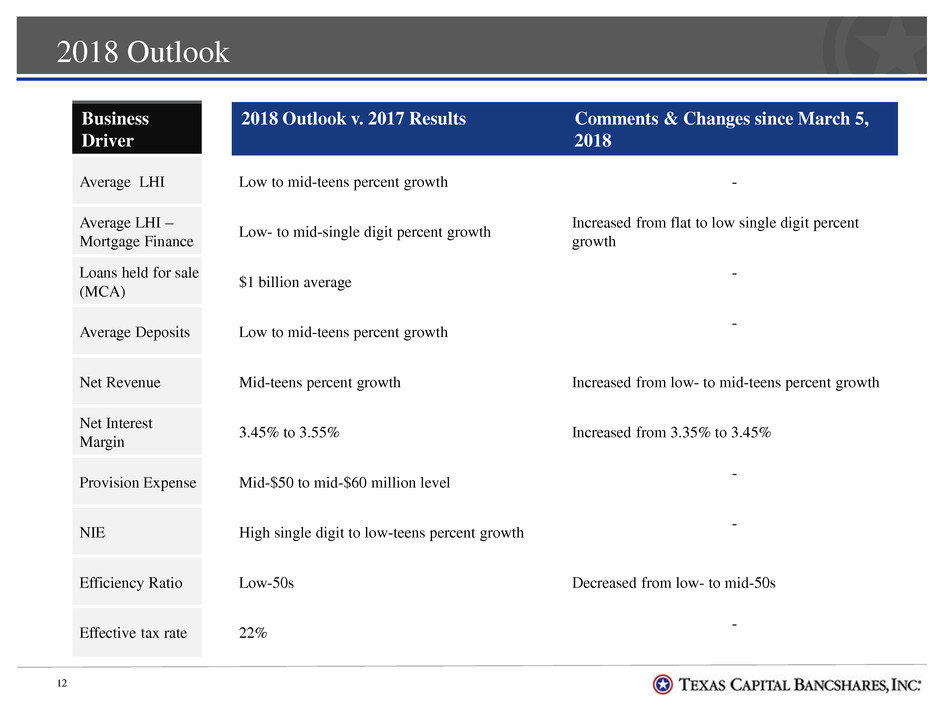
Business
Driver
2018 Outlook v. 2017 Results Comments & Changes since March 5,
2018
Average LHI Low to mid-teens percent growth -
Average LHI –
Mortgage Finance
Low- to mid-single digit percent growth
Increased from flat to low single digit percent
growth
Loans held for sale
(MCA)
$1 billion average
-
Average Deposits Low to mid-teens percent growth
-
Net Revenue Mid-teens percent growth Increased from low- to mid-teens percent growth
Net Interest
Margin
3.45% to 3.55% Increased from 3.35% to 3.45%
Provision Expense Mid-$50 to mid-$60 million level
-
NIE High single digit to low-teens percent growth
-
Efficiency Ratio Low-50s Decreased from low- to mid-50s
Effective tax rate 22%
-
Closing Comments
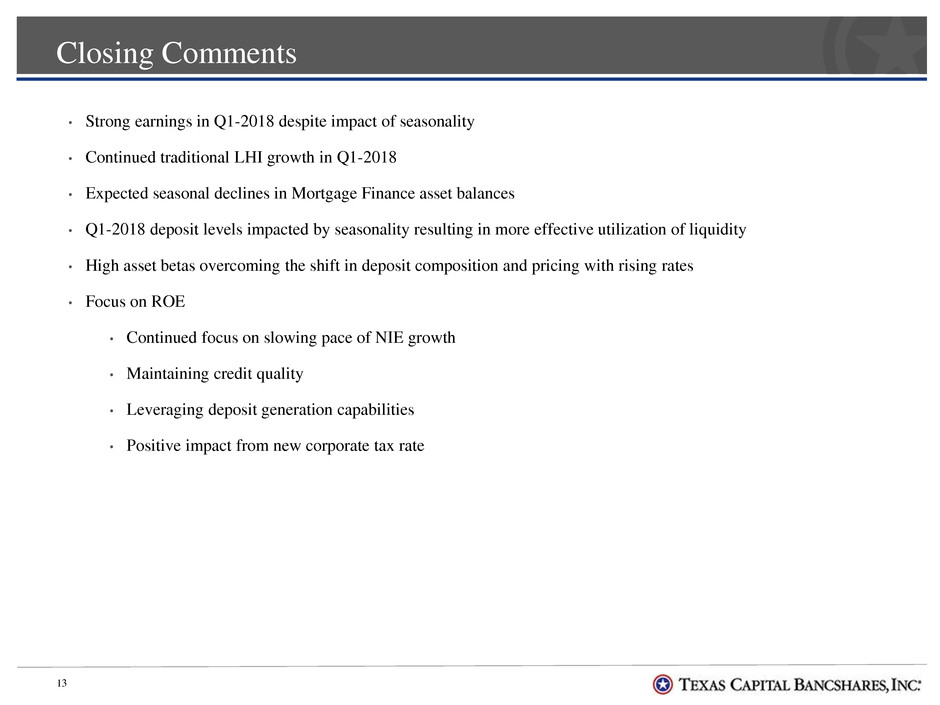
• Strong earnings in Q1-2018 despite impact of seasonality
• Continued traditional LHI growth in Q1-2018
• Expected seasonal declines in Mortgage Finance asset balances
• Q1-2018 deposit levels impacted by seasonality resulting in more effective utilization of liquidity
• High asset betas overcoming the shift in deposit composition and pricing with rising rates
• Focus on ROE
• Continued focus on slowing pace of NIE growth
• Maintaining credit quality
• Leveraging deposit generation capabilities
• Positive impact from new corporate tax rate
13

Q&A
14
Appendix
15

Average Balances, Yields & Rates - Quarterly
16
(in thousands) Q1 2018 Q4 2017 Q1 2017
Avg. Bal. Yield Rate Avg. Bal. Yield Rate Avg. Bal. Yield Rate
Assets
Securities $ 23,854 3.50% $ 23,678 3.57% $ 32,129 2.86%
Liquidity assets 2,564,579 1.55% 3,217,486 1.28% 3,589,166 .80%
Loans held for sale 1,187,594 4.28% 1,144,124 3.99% 1,064,322 3.63%
LHI, mortgage finance 4,097,995 3.70% 5,102,107 3.46% 2,757,566 3.40%
LHI 15,425,323 5.14% 15,010,041 4.89% 12,980,544 4.53%
Total LHI, net of reserve 19,339,080 4.88% 19,928,915 4.57% 15,568,792 4.38%
Total earning assets 23,115,107 4.48% 24,314,203 4.11% 20,254,409 3.70%
Total assets $23,912,613 $25,080,825 $20,861,171
Liabilities and Stockholders’ Equity
Total interest bearing deposits $11,281,585 1.14% $11,406,769 .96% $ 9,425,919 .57%
Other borrowings 1,721,914 1.57% 1,852,750 1.31% 1,333,685 .69%
Total long-term debt 394,843 5.36% 394,754 5.17% 394,482 5.16%
Total interest bearing liabilities 13,398,342 1.32% 13,654,273 1.13% 11,154,086 .75%
Demand deposits 8,147,721 9,085,819 7,547,338
Total deposits 19,429,306 .66% 20,492,588 .53% 16,973,257 .32%
Stockholders’ equity 2,255,852 2,202,683 2,041,870
Total liabilities and stockholders’ equity $23,912,613 .74% $25,080,825 .62% $20,861,171 .40%
Net interest margin 3.71% 3.47% 3.29%
Total deposits and borrowed funds $21,151,220 .74% $22,345,338 .60% $18,306,942 .34%

Average Balance Sheet - Quarterly
17
(in thousands) QTD Average
Q1/Q4 %
Change
YOY %
Change Q1 2018 Q4 2017 Q1 2017
Total assets $23,912,613 $25,080,825 $20,861,171 (5)% 15%
Loans held for sale 1,187,594 1,144,124 1,064,322 4% 12%
Loans held for investment 15,425,323 15,010,041 12,980,544 3% 19%
Loans held for investment, mortgage
finance
4,097,995 5,102,107 2,757,566
(20)%
49%
Total loans held for investment 19,523,318 20,112,148 15,738,110 (3)% 24%
Total loans 20,710,912 21,256,272 16,802,432 (3)% 23%
Liquidity assets 2,564,579 3,217,486 3,589,166 (20)% (29)%
Demand deposits 8,147,721 9,085,819 7,547,338 (10)% 8%
Total deposits 19,429,306 20,492,588 16,973,257 (5)% 14%
Stockholders’ equity 2,255,852 2,202,683 2,041,870 2% 10%
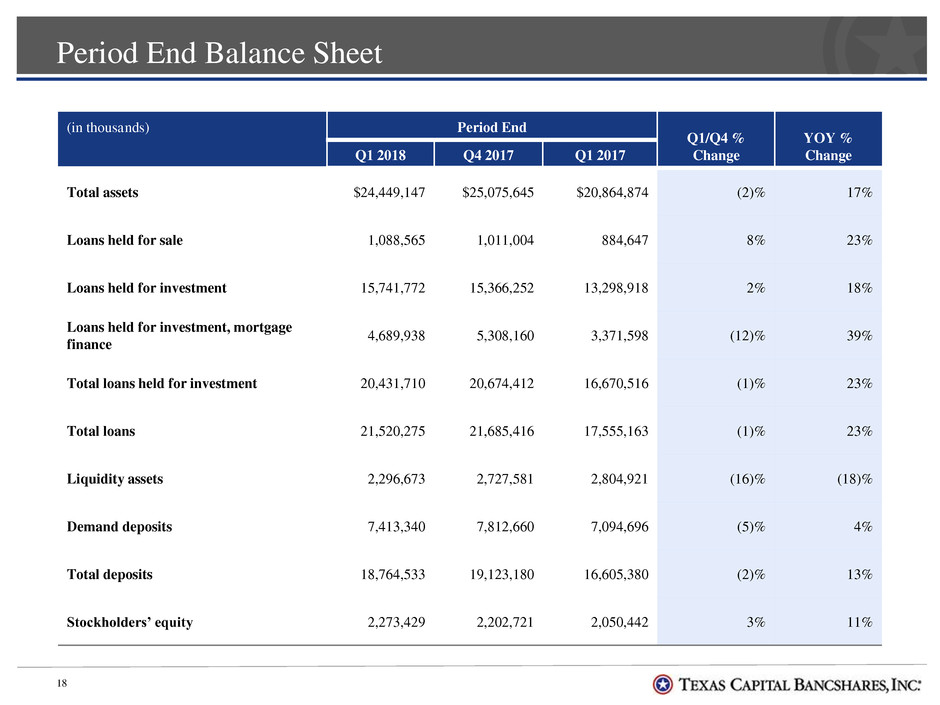
Period End Balance Sheet
18
(in thousands) Period End
Q1/Q4 %
Change
YOY %
Change Q1 2018 Q4 2017 Q1 2017
Total assets $24,449,147 $25,075,645 $20,864,874 (2)% 17%
Loans held for sale 1,088,565 1,011,004 884,647 8% 23%
Loans held for investment 15,741,772 15,366,252 13,298,918 2% 18%
Loans held for investment, mortgage
finance
4,689,938 5,308,160 3,371,598 (12)% 39%
Total loans held for investment 20,431,710 20,674,412 16,670,516 (1)% 23%
Total loans 21,520,275 21,685,416 17,555,163 (1)% 23%
Liquidity assets 2,296,673 2,727,581 2,804,921 (16)% (18)%
Demand deposits 7,413,340 7,812,660 7,094,696 (5)% 4%
Total deposits 18,764,533 19,123,180 16,605,380 (2)% 13%
Stockholders’ equity 2,273,429 2,202,721 2,050,442 3% 11%
