Attached files
| file | filename |
|---|---|
| EX-99.3 - EX-99.3 - WILLIAM LYON HOMES | d543931dex993.htm |
| EX-23.1 - EX-23.1 - WILLIAM LYON HOMES | d543931dex231.htm |
| EX-99.2 - EX-99.2 - WILLIAM LYON HOMES | d543931dex992.htm |
| 8-K - 8-K - WILLIAM LYON HOMES | d543931d8k.htm |
Exhibit 99.1
Forward-Looking Statements
This offering memorandum and the documents that we incorporate by reference herein may contain “forward-looking statements” within the meaning of the Private Securities Litigation Reform Act of 1995 (set forth in Section 27A of the Securities Act and Section 21E of the Securities Exchange Act of 1934, as amended (the “Exchange Act”). Also, documents we subsequently file with the SEC and incorporate by reference may contain forward-looking statements.
Statements which are predictive in nature, which depend upon or refer to future events or conditions, or which include words such as “expects”, “anticipates”, “intends”, “plans”, “believes”, “estimates”, “hopes”, and similar expressions constitute forward-looking statements. Such statements may include, but are not limited to, information related to: our proposed acquisition of RSI; anticipated financial and operating results; our ability to finance the RSI Acquisition and the sources and uses related thereto; our estimates with respect to the combined financial and operating results of us and RSI following the consummation of the RSI Acquisition; financial resources and condition; cash needs and liquidity; timing of project openings; leverage ratios and compliance with debt covenants; revenues and average selling prices of deliveries; global and domestic economic conditions; market and industry trends; cycle times; profitability and gross margins; debt maturities; business and operational strategies and the anticipated effects thereof; and anticipated debt paydowns. Forward-looking statements are based upon expectations and projections about future events and are subject to assumptions, risks and uncertainties about, among other things, the Company, economic and market factors and the homebuilding industry.
There is no guarantee that any of the events anticipated by the forward-looking statements in this offering memorandum or the documents incorporated herein by reference will occur, or if any of the events occur, what effect such events may have on our operations and financial condition. Our past performance, and past or present economic conditions in our housing markets, are not indicative of future performance or conditions. Investors are urged not to place undue reliance on forward-looking statements. In addition, we undertake no obligation to update or revise forward-looking statements to reflect changed assumptions, the occurrence of anticipated or unanticipated events or changes to projections over time unless required by federal securities laws. Actual events and results may differ materially from those expressed or forecasted in the forward-looking statements due to a number of factors. While it is impossible to identify all such factors, factors that could cause actual results to differ materially from those estimated by us include, but are not limited to:
| • | our ability to consummate the acquisition of RSI as described herein on time or at all, and to realize the anticipated benefits therefrom; |
| • | our ability to integrate successfully the RSI operations with our existing operations; |
| • | adverse weather conditions and impact from natural disasters, such as the recent fire activity in Northern California; |
| • | the availability and cost of skilled subcontractors, labor and homebuilding materials and increased construction cycle times; |
| • | our financial leverage and level of indebtedness and any inability to comply with financial and other covenants under our debt instruments; |
| • | continued volatility and worsening in general economic conditions either internationally, nationally or in regions in which we operate; |
| • | changes in governmental laws and regulations and increased costs, fees and delays associated therewith; |
| • | benefits associated with purchasing and owning a home, and the standards, fees and size limits applicable to the purchase or insuring of mortgage loans by government-sponsored enterprises and government agencies), the homebuilding industry or construction activities; |
1
| • | changes to the corporate and individual tax code at the federal, state and local level, including pursuant to the Tax Cuts and Jobs Act; |
| • | worsening in markets for residential housing; |
| • | the impact of construction defect, product liability and home warranty claims, including the adequacy of self-insurance accruals, and the applicability and sufficiency of our insurance coverage; |
| • | defects in manufactured products or other homebuilding materials; |
| • | decline in real estate values resulting in impairment of our real estate assets; |
| • | volatility in the banking industry, credit markets and capital markets; |
| • | the timing of receipt of regulatory approvals and the opening of projects; |
| • | the availability and cost of land for future development; terrorism or other hostilities involving the United States and other geopolitical risks; |
| • | building moratorium or “slow-growth” or “no-growth” initiatives that could be implemented in states in which we operate; |
| • | changes in mortgage and other interest rates; |
| • | conditions in the capital, credit and financial markets, including mortgage lending standards and the availability of mortgage financing; |
| • | changes in generally accepted accounting principles or interpretations of those principles; |
| • | changes in prices of homebuilding materials; |
| • | competition for home sales from other sellers of new and resale homes; |
| • | cancellations and our ability to convert our backlog into deliveries; |
| • | the occurrence of events such as landslides, soil subsidence and earthquakes that are uninsurable, not economically insurable or not subject to effective indemnification agreements; |
| • | increased outside broker costs; |
| • | limitations on our ability to utilize our tax attributes; |
| • | whether an ownership change occurred that could, under certain circumstances, have resulted in the limitation of our ability to offset prior years’ taxable income with net operating losses; and |
| • | other factors set forth under “Risk Factors” included herein, as well as those factors or conditions described under “Management’s Discussion and Analysis of Financial Condition and Results of Operations” and “Risk Factors,” in each case in our annual report on Form 10-K for the year ended December 31, 2017 and in subsequent filings with the SEC, incorporated by reference in this offering memorandum. |
2
Summary
This summary contains basic information about our business and this offering and highlights selected information contained elsewhere in this offering memorandum. This summary is not complete and does not contain all of the information that you should consider before deciding whether or not to invest in the notes. For a more complete understanding of our business and this offering, you should read this entire offering memorandum, especially the description of the terms and conditions of the notes discussed under “Description of the Notes” and the risks discussed under “Risk Factors” included in, or otherwise incorporated by reference in, this offering memorandum.
Our company
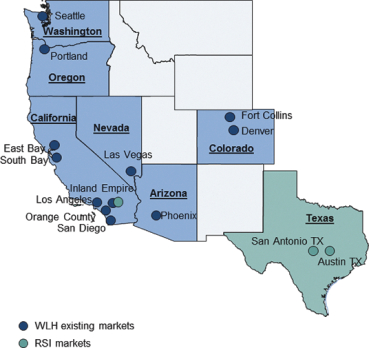
We are one of the largest Western U.S. regional homebuilders. Headquartered in Newport Beach, California, we are primarily engaged in the design, construction, marketing and sale of single-family detached and attached homes in California, Arizona, Nevada, Colorado, Oregon, and Washington. Our core markets currently include Orange County, Los Angeles, the Inland Empire, the San Francisco Bay Area, Phoenix, Las Vegas, Denver, Portland and Seattle. In addition, our proposed acquisition of RSI Communities LLC will mark an expansion of our presence in the Inland Empire and our entry into the Austin and San Antonio sub-markets of Texas.
We have a distinguished legacy of more than 60 years of homebuilding operations, over which time we have sold in excess of 102,000 homes. Our markets are characterized by attractive long-term housing fundamentals. We hold leading market share positions in most of our markets and have a significant land supply.
We have significant expertise in understanding the needs of our homebuyers and designing our product offerings to meet those needs. This allows us to maximize the return on our land investments by tailoring our home offerings to meet the buyer demands in each of our markets. We build and sell across a diverse range of product lines at a variety of price points with an emphasis on sales to entry-level and first-time move-up homebuyers and, to a lesser extent, second-time move-up homebuyers, as well as a signature luxury brand. In addition, we have an active-adult segment, which is marketed through our Ovation brand. We are committed to achieving the highest standards in design, quality and customer satisfaction and have received numerous industry awards and commendations throughout our operating history in recognition of our achievements.
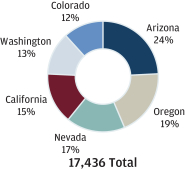
For the year ended December 31, 2017, we had revenues from homes sales of $1,795.1 million, a 28.0% increase from $1,402.2 million for the year ended December 31, 2016, which includes results from all reportable operating segments. We had net new home orders of 3,328 homes in the year ended December 31, 2017, a 19.9% increase from 2,775 in the year ended December 31, 2016. As of December 31, 2017, we had a total of 17,436 lots owned or controlled, and were selling homes out of an average of approximately 80 active selling communities during the fourth quarter of 2017. As of December 31, 2017, we had a consolidated backlog of 822 homes sold but not closed, with an associated sales value of $433.0 million, representing a 12.1% increase in units, and a 5.4% increase in dollar value, as compared to the backlog at December 31, 2016.
We believe that the attractive fundamentals in our markets, our leading market share positions, our long-standing relationships with land developers, our significant land supply and our focus on providing the best possible customer experience position us to capitalize on meaningful growth as the U.S. housing market continues to demonstrate strong fundamentals.
3
Acquisition of RSI
RSI acquisition
On February 20, 2018, we announced that we entered into definitive agreements to acquire RSI Communities LLC (“RSI”), a Southern California and Texas based homebuilder for a cash purchase price of approximately $423.0 million, and three additional related real estate assets (the “RSI Legacy Assets”) for a cash purchase price of approximately $37.3 million (the “RSI Acquisition”), subject to net asset value adjustments.
The RSI Acquisition enhances our position in the land-constrained Southern California market and marks our entry into Texas with immediate size and scale in Austin as a foothold in the attractive Texas region, as well as projects in San Antonio. As of December 31, 2017, RSI (including the RSI Legacy Assets) had 29 active selling communities and owned or controlled 11,128 lots, including 3,173 in the Inland Empire, California; 6,895 in Austin, Texas; and 1,060 in San Antonio, Texas. RSI’s owned inventory as of December 31, 2017 consisted of lots in various stages as follows: 31% are under construction, 33% are finished lots and 36% are land and land under development. RSI primarily targets the entry-level and first time buyer segments, with approximately 70% of RSI deliveries in 2017 at average selling prices falling below the FHA loan limits.
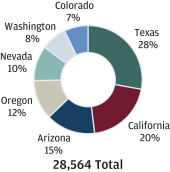
| High Growth Western U.S. Market Focus | William Lyon Homes Lot (Owned
and Controlled) Distribution by Market | |
|
|
William Lyon Homes (as of 12/31/17)
Pro Forma Lot Distribution of William Lyon Homes and RSI, including the (owned and controlled) RSI Legacy Assets (as of 12/31/17)
| |

4
RSI’s management team is comprised of recognized industry leaders and homebuilding veterans with significant experience in land acquisition, operational discipline and public company expertise. In addition, the team has deep relationships and local knowledge that we believe will allow us to achieve best-in-class results as we expand our operations to Texas and enhance our Southern California pipeline. In 2017, RSI’s operating teams delivered 461 new homes, and had total construction starts of 920. From January 1, 2018 through February 28, 2018, RSI (including the RSI Legacy Assets) recorded net new home orders of 167 homes sold and have backlog of 252 homes sold but not closed.
We intend to fund the RSI Acquisition with cash on hand, proceeds from this offering, and land banking proceeds. The transaction is subject to the satisfaction of customary closing conditions and regulatory approvals and is expected to close in March of 2018. This offering is not conditioned on the consummation of the RSI Acquisition.
Overall, we believe the RSI Acquisition will drive meaningful benefits from our increased operating scale, and expanded geographic footprint, building on our successful 2014 acquisition of Polygon Northwest. See “Where You Can Find More Information” and “Index to Financial Statements of RSI” in this offering memorandum for more information regarding the RSI Acquisition and RSI’s financial and other data.
Transactions related to the RSI acquisition
Bridge credit facility
In connection with the entry into the definitive agreements related to the RSI Acquisition, we received definitive financing commitments from affiliates of certain of the initial purchasers for a 364-day term loan credit facility in the amount of $250.0 million, available in a single draw (the “Bridge Credit Facility”). Loans under the Bridge Credit Facility, if any, would bear interest at an annual rate equal to a Eurodollar rate (subject to a minimum “floor” of 0.00%), plus a margin ranging from 2.50% to 3.00% based on certain leverage ratios. Assuming this offering is closed prior to or concurrently with the consummation of the RSI Acquisition, we will not borrow any amounts under the Bridge Credit Facility and will cancel the Bridge Credit Facility.
Land bank arrangements
We intend to enter into several separate land bank arrangements with respect to certain land parcels located in California and Texas that will be acquired as part of the RSI Acquisition, each of which is entitled and in various stages of development (collectively, the “Land Bank Arrangements”). Land bank arrangements are a method of acquiring land in staged takedowns, typically over a time period of 24 to 36 months, that we employ from time to time in the ordinary course of business to access parcels of land with minimal cash outlay. Under the Land Bank Arrangements, the land banker will purchase the underlying land assets that will be acquired as part of the RSI Acquisition and fund all horizontal land development costs, and provide us with an option to purchase back the finished lots on a rolling basis for a pre-determined purchase price. In consideration for the option to purchase, we anticipate that we will make a non-refundable deposit of approximately 15% of the total purchase price of the parcels at issue. We anticipate that the Land Bank Arrangements will close concurrently with, or immediately prior to, the closing of the RSI Acquisition, and we expect the aggregate proceeds to us from the Land Bank Arrangements to be approximately $200.0 million, net of deposits.
5
Amendment to revolving credit facility
In connection with the consummation of the RSI Acquisition, we expect to amend our existing $170.0 million revolving credit facility (our “Revolving Credit Facility”) prior to the closing of this offering to, among other things, temporarily increase the leverage ratios permitted thereunder such that the maximum leverage ratio will increase to 70% as of March 31, 2018 and through and including June 29, 2018, will decrease to 65% as of June 30, 2018 and through and including December 30, 2018, and will further decrease to 60% on the last day of the 2018 fiscal year and remain at 60% thereafter, and to permit the Company’s entering into the Bridge Credit Facility. See “Description of Other Indebtedness—Revolving Credit Facility” in this offering memorandum for an additional discussion of the terms of the Revolving Credit Facility.
General corporate information and history
Our principal executive offices are located at 4695 MacArthur Court, 8th Floor, Newport Beach, California 92660 and our telephone number is (949) 833-3600. Our website address is www.lyonhomes.com. Information contained on our website is not a part of this offering memorandum and the inclusion of the website address in this offering memorandum is an inactive textual reference only.
6
Summary Historical Financial Data
The following table sets forth certain of our historical financial and other data. The summary historical consolidated statement of operations data, other financial data and operating data for the years ended December 31, 2017 and 2016, and the balance sheet data as of December 31, 2017 and 2016, have been derived from our audited consolidated financial statements and the related notes incorporated by reference in this offering memorandum. The summary historical consolidated financial data set forth below are not necessarily indicative of the results of future operations.
For information regarding the historical financial data of RSI (excluding the RSI Legacy Assets), refer to the historical audited consolidated financial statements of RSI and the related notes included elsewhere in this offering memorandum. The historical audited financial data for RSI included elsewhere in this offering memorandum do not reflect the results of operations or financial condition of the RSI Legacy Assets. See “Where You Can Find More Information” and “Index to Financial Statements of RSI” in this offering memorandum.
| Year Ended December 31, | ||||||||
| 2017 | 2016 | |||||||
| (dollars in thousands) | ||||||||
| Statement of Operations Data Revenues |
||||||||
| Home sales |
$ | 1,795,074 | $ | 1,402,203 | ||||
| Construction services |
1,454 | 3,837 | ||||||
| Total revenues |
1,796,528 | 1,406,040 | ||||||
| Operating income |
137,956 | 93,968 | ||||||
| Income before extinguishment of debt and provision for income taxes |
142,512 | 102,817 | ||||||
| Income before provision for income taxes |
120,684 | 102,817 | ||||||
| Provision for income taxes |
(62,933 | ) | (34,850 | ) | ||||
| Net income |
57,751 | 67,967 | ||||||
| Net income available to common stockholders |
$ | 48,135 | $ | 59,696 | ||||
| Year ended December 31, | ||||||||
| (dollars in thousands) | 2017 | 2016 | ||||||
| Other Financial Data: |
||||||||
| Adjusted homebuilding gross margin(1) |
$ | 415,751 | $ | 320,577 | ||||
| Adjusted homebuilding gross margin percentage(1) |
23.2 | % | 22.9 | % | ||||
| Adjusted EBITDA(2) |
$ | 243,685 | $ | 188,121 | ||||
| Adjusted EBITDA margin percentage(3) |
13.6 | % | 13.4 | % | ||||
| Operating Data (including consolidated joint ventures) (unaudited): |
||||||||
| Number of net new home orders |
3,328 | 2,775 | ||||||
| Number of homes closed |
3,239 | 2,781 | ||||||
| Average sales price of homes closed |
$ | 554 | $ | 504 | ||||
| Cancellation rate |
15 | % | 16 | % | ||||
| Average number of sales locations |
84 | 74 | ||||||
| Backlog at end of period, number of homes(4) |
822 | 733 | ||||||
| Backlog at end of period, aggregate sales value(4) |
$ | 433,012 | $ | 410,675 | ||||
7
| December 31, 2017 | December 31, 2016 |
|||||||||||
| Actual | As adjusted for the offering(5) |
|||||||||||
| (unaudited) | ||||||||||||
| (dollars in thousands) | ||||||||||||
| Balance Sheet Data: |
||||||||||||
| Cash and cash equivalents |
$ | 182,710 | $ | 376,960 | $ | 42,612 | ||||||
| Real estate inventories |
1,699,850 | 1,699,850 | 1,771,998 | |||||||||
| Total assets |
2,061,104 | 2,255,354 | 2,011,280 | |||||||||
| Total debt |
1,030,184 | 1,225,072 | 1,080,650 | |||||||||
| Total William Lyon Homes stockholders’ equity |
780,472 | 779,834 | 697,086 | |||||||||
| Ratio of debt to total capital |
54.5 | % | 58.8 | % | 58.6 | % | ||||||
| Ratio of net debt to total net capital(6) |
49.6 | % | 49.7 | % | 57.6 | % | ||||||
| (1) | Adjusted homebuilding gross margin is a financial measure that is not prepared in accordance with GAAP. It is used by management in evaluating operating performance and in making strategic decisions regarding sales prices, construction and development pace, product mix and other operating decisions. We believe this information is meaningful as it isolates the impact that interest has on homebuilding gross margin and allows investors to make better comparisons with our competitors. A reconciliation of adjusted homebuilding gross margin to homebuilding gross margin is provided as follows: |
| Year ended December 31, | ||||||||
| (dollars in thousands) | 2017 | 2016 | ||||||
| Home sales revenue |
$ | 1,795,074 | $ | 1,402,203 | ||||
| Cost of home sales |
1,478,549 | 1,162,337 | ||||||
| Homebuilding gross margin |
316,525 | 239,866 | ||||||
| Add: Interest in cost of sales |
83,455 | 57,297 | ||||||
| Add: Purchase accounting adjustments |
15,771 | 23,414 | ||||||
|
|
|
|
|
|||||
| Adjusted homebuilding gross margin |
$ | 415,751 | $ | 320,577 | ||||
|
|
|
|
|
|||||
| Adjusted homebuilding gross margin percentage |
23.2 | % | 22.9 | % | ||||
8
| (2) | Adjusted EBITDA is a financial measure that is not prepared in accordance with GAAP. Adjusted EBITDA means net income attributable to common stockholders plus (i) provision for income taxes, (ii) interest expense, (iii) amortization of capitalized interest included in cost of sales, (iv) stock based compensation, (v) depreciation and amortization, (vi) non-cash purchase accounting adjustments, (vii) cash distributions of income from unconsolidated joint ventures, (viii) equity in income of unconsolidated joint ventures and (ix) loss on extinguishment of debt. Other companies may calculate Adjusted EBITDA differently. Adjusted EBITDA is presented herein because management believes the presentation of Adjusted EBITDA provides useful information to our investors regarding our financial condition and results of operations. Adjusted EBITDA is a widely utilized indicator of a company’s operating performance. Adjusted EBITDA should not be considered as an alternative for net income, cash flows from operating activities and other consolidated income or cash flow statement data prepared in accordance with GAAP or as a measure of profitability or liquidity. A reconciliation of net income attributable to common stockholders to Adjusted EBITDA is provided in the following table: |
| Year ended December 31, | ||||||||
| (dollars in thousands) | 2017 | 2016 | ||||||
| Net income available to common stockholders |
$ | 48,135 | $ | 59,696 | ||||
| Provision for income taxes |
62,933 | 34,850 | ||||||
| Interest expense |
||||||||
| Interest incurred |
73,729 | 83,218 | ||||||
| Interest capitalized |
(73,729 | ) | (83,218 | ) | ||||
| Amortization of interest included in cost of sales |
83,570 | 60,160 | ||||||
| Stock based compensation |
10,062 | 6,844 | ||||||
| Depreciation and amortization |
1,962 | 2,006 | ||||||
| Non-cash purchase accounting adjustments |
15,771 | 26,445 | ||||||
| Cash distributions of income from unconsolidated joint ventures |
3,085 | 3,726 | ||||||
| Equity in income of unconsolidated joint ventures |
(3,661 | ) | (5,606 | ) | ||||
| Loss on extinguishment of debt |
21,828 | — | ||||||
|
|
|
|
|
|||||
| Adjusted EBITDA |
$ | 243,685 | $ | 188,121 | ||||
| (3) | Adjusted EBITDA margin percentage is calculated as Adjusted EBITDA, as defined in (3) above, divided by total revenues during the period. |
| (4) | Backlog consists of homes sold under pending sales contracts that have not yet closed, some of which are subject to contingencies, including mortgage loan approval and the sale of existing homes by customers. We cannot assure you that homes sold under pending sales contracts will close. Of the total homes sold subject to pending sales contracts as of December 31, 2017 and December 31, 2016, 703 and 658, respectively, represent homes completed or under construction. |
| (5) | Gives effect to (i) the issuance and sale by us of $350.0 million in aggregate principal amount of notes in this offering, and (ii) the use of a portion of the proceeds of this offering to repay all $150.0 million of aggregate principal amount of 5.75% notes as described in “Use of Proceeds,” as if such transactions occurred on December 31, 2017. Total William Lyon Homes stockholders’ equity includes the loss from extinguishment of debt of approximately $0.6 million. |
| Pro forma financial statements as of and for the year ended December 31, 2017 of us and RSI that give effect to the consummation of the RSI Acquisition are not yet available. Set forth in the following paragraph are preliminary estimates of certain balance sheet data as of December 31, 2017 that give effect to the transactions described in the preceding paragraph and the use of the remaining proceeds of this offering, together with $200.0 million of cash generated from the Land Bank Arrangements and $69.5 million of cash on hand, to finance the RSI Acquisition (including the acquisition of the RSI Legacy Assets) and to pay related fees and expenses as described in “Use of Proceeds,” and the consummation of the RSI Acquisition, in each case as if such transactions occurred on December 31, 2017. These preliminary estimates are based upon available information and certain assumptions that we believe are reasonable. While we are currently unaware of any information that would require us to make adjustments to the preliminary estimates set forth below, it is possible that we may identify such information as we continue to assess the financial impact of the RSI Acquisition on us and our financial results, and any resulting changes could be material. Accordingly, undue reliance should not be placed on these preliminary estimates. In addition, our preliminary analysis of the accounting treatment of the Land Bank Arrangements is ongoing, and, for purposes of our preliminary estimates in the following paragraph, we have excluded such Land Bank Arrangements from the following pro forma balance sheet estimates. See also “Forward-Looking Statements” and “Risk Factors.” |
| As of December 31, 2017, after giving effect to the transactions described in the preceding paragraph, based on our preliminary assessments, we estimate that our cash and cash equivalents would have been approximately $113.2 million, our total assets would have been approximately $2,251.9 million, our real estate inventories would have been approximately $1,914.1 million, our ratio of debt to total capital would have been approximately 58.9%, and our ratio of net debt to total net capital (calculated in a manner similar to that described in footnote (6) below) would have been approximately 56.5%. |
9
| (6) | The ratio of net debt to total net capital is a non-GAAP financial measure, which is calculated by dividing notes payable and outstanding notes, net of cash and cash equivalents, by net book capital (notes payable and our outstanding notes, net of cash and cash equivalents, plus total equity). We believe this calculation is a relevant and useful financial measure to investors in understanding the leverage employed in its operations, and may be helpful in comparing us with other companies in the homebuilding industry to the extent they provide similar information. A reconciliation of the ratio of net debt to total net capital to the ratio of debt to total capital is provided in the following table: |
| December 31, 2017 | December 31, 2016 |
|||||||||||
| Actual | As adjusted for the offering |
|||||||||||
| (unaudited) | ||||||||||||
| (dollars in thousands) | ||||||||||||
| Notes payable and outstanding senior notes |
$ | 1,030,184 | $ | 1,225,072 | $ | 1,080,650 | ||||||
| Total equity |
860,630 | 859,992 | 763,429 | |||||||||
| Total capital |
$ | 1,890,814 | $ | 2,085,064 | $ | 1,844,079 | ||||||
| Ratio of debt to total capital |
54.5 | % | 58.8 | % | 58.6 | % | ||||||
| Notes payable and outstanding notes |
$ | 1,030,184 | $ | 1,225,072 | $ | 1,080,650 | ||||||
| Less: Cash and cash equivalents |
(182,710 | ) | (376,960 | ) | (42,612 | ) | ||||||
| Net debt |
847,474 | 848,112 | 1,038,038 | |||||||||
| Total equity |
860,630 | 859,992 | 763,429 | |||||||||
| Total capital (net of cash) |
$ | 1,708,104 | $ | 1,708,104 | $ | 1,801,467 | ||||||
| Ratio of net debt to total capital (net of cash) |
49.6 | % | 49.7 | % | 57.6 | % | ||||||
10