Attached files
| file | filename |
|---|---|
| 8-K - 8-K - ATLANTIC POWER CORP | a18-7477_18k.htm |
| EX-99.1 - EX-99.1 - ATLANTIC POWER CORP | a18-7477_1ex99d1.htm |

Cautionary Note Regarding Forward-Looking Statements 2 To the extent any statements made in this presentation contain information that is not historical, these statements are forward-looking statements or forward-looking information, as applicable, within the meaning of Section 27A of the U.S. Securities Act of 1933, as amended, and Section 21E of the U.S. Securities Exchange Act of 1934, as amended, and under Canadian securities law (collectively “forward-looking statements”). Forward-looking statements can generally be identified by the use of words such as “should,” “intend,” “may,” “expect,” “believe,” “anticipate,” “estimate,” “continue,” “plan,” “project,” “will,” “could,” “would,” “target,” “potential” and other similar expressions. In addition, any statements that refer to expectations, projections or other characterizations of future events or circumstances are forward-looking statements. Although Atlantic Power Corporation (“AT”, “Atlantic Power” or the “Company”) believes that the expectations reflected in such forward-looking statements are reasonable, such statements involve risks and uncertainties and should not be read as guarantees of future performance or results, and will not necessarily be accurate indications of whether or not or the times at or by which such performance or results will be achieved. Please refer to the factors discussed under “Risk Factors” and “Forward-Looking Information” in the Company’s periodic reports as filed with the Securities and Exchange Commission from time to time for a detailed discussion of the risks and uncertainties affecting the Company, including, without limitation, the outcome or impact of the Company’s business strategy to increase the intrinsic value of the Company on a per-share basis through disciplined management of its balance sheet and cost structure and investment of its discretionary cash in a combination of organic and external growth projects, acquisitions, and repurchases of debt and equity securities; the Company’s ability to enter into new PPAs on favorable terms or at all after the expiration of existing agreements, and the outcome or impact on the Company’s business of any such actions. Although the forward-looking statements contained in this news release are based upon what are believed to be reasonable assumptions, investors cannot be assured that actual results will be consistent with these forward-looking statements, and the differences may be material. These forward-looking statements are made as of the date of this news release and, except as expressly required by applicable law, the Company assumes no obligation to update or revise them to reflect new events or circumstances. The Company’s ability to achieve its longer-term goals, including those described in this news release, is based on significant assumptions relating to and including, among other things, the general conditions of the markets in which it operates, revenues, internal and external growth opportunities, its ability to sell assets at favorable prices or at all and general financial market and interest rate conditions. The Company’s actual results may differ, possibly materially and adversely, from these goals. Disclaimer – Non-GAAP Measures Project Adjusted EBITDA is not a measure recognized under GAAP and does not have a standardized meaning prescribed by GAAP, and is therefore unlikely to be comparable to similar measures presented by other companies. Investors are cautioned that the Company may calculate this non-GAAP measure in a manner that is different from other companies. The most directly comparable GAAP measure is Project income (loss). Project Adjusted EBITDA is defined as project income (loss) plus interest, taxes, depreciation and amortization (including non-cash impairment charges), and changes in the fair value of derivative instruments. Management uses Project Adjusted EBITDA at the project level to provide comparative information about project performance and believes such information is helpful to investors. A reconciliation of Project Adjusted EBITDA to Project income (loss) and to Net income (loss) by segment and on a consolidated basis is provided on slides 40 and 41. Cash Distributions from Projects is the amount of cash distributed by the projects to the Company out of available project cash flow after all project-level operating costs, interest payments, principal repayment, capital expenditures and working capital requirements. It is not a non-GAAP measure. Project Adjusted EBITDA, a non-GAAP measure, is the most comparable measure, but it is before debt service, capital expenditures and working capital requirements. The Company has provided a bridge of Project Adjusted EBITDA to Cash Distributions from Projects on slides 37 and 38. All amounts in this presentation are in US$ and approximate unless otherwise stated.
3 Q4 and Full Year 2017 2017 Highlights and 2018 Outlook Operations Review Commercial Review / PPAs Financial Results 2018 Guidance Liquidity and Balance Sheet Update Q&A Agenda
2017 Highlights and Recent Developments 4 Financial Results Costs Capital Allocation In current market environment, debt reduction and equity repurchases offer higher returns than acquisitions Elected to retain ownership of Piedmont and pay off debt early Also undertook modest repurchases of common and preferred shares Maintained overhead costs in line with 2016 level (down ~60% from 2013) Project Adjusted EBITDA exceeded Company’s 2017 guidance range Cash provided by operating activities also was better than the Company’s estimate Ended the year with $198 million of liquidity Balance Sheet Reduced risk by paying down $166 million of debt Significant reduction in leverage ratio to 3.3 times (though will increase in 2018) Improved debt maturity profile by redeeming Piedmont (2018 maturity) and most of 2019 convertible debenture maturities Reduced cash interest payments; reduced spread on revolver by 150 bp to 350 bp
2017 Highlights and Recent Developments (continued) 5 PPAs Despite challenging power market environment, executed new contracts for Nipigon, Williams Lake and three projects in San Diego Long-term Enhanced Dispatch Contract for Nipigon has favorable economics vs. PPA Short-term extension for Williams Lake; bridge to possible longer-term contract in 2019 Site control for the three San Diego projects remains the key hurdle; challenging path Launched initiative to repurpose mothballed Ontario sites if feasible (North Bay and Kapuskasing) Growth Most of our discretionary capital allocation in 2017 focused on debt repayment, equity repurchases and internal uses (better returns) Ongoing Combined Heat and Power (CHP) development strategy; long lead time Difficult market for acquisitions (poor risk/reward) Taking opportunistic approach to contracted assets where we have expertise Allocating more resources to this effort Operations Implementing best practices across fleet Estimated fuel cost savings of approximately $3 million in 2017 as a result of heat rate and equipment improvements Completed permit requirements for Tunis restart; targeting third quarter 2018
Outlook for 2018 and Beyond 6 Initiated 2018 Guidance Capital Allocation Balance Sheet and Credit Profile Still expect to repay approximately $100 million of debt in 2018, and a total of $450 million in 2018 through 2022 Higher leverage ratio in 2018 (lower EBITDA), but expected to decline in 2019 and beyond Stable liquidity Approximately $40 million of discretionary cash Continue disciplined, rational approach to capital allocation NCIB in place and other purchase options available to consider open market repurchases of securities, including common shares, convertible debentures and preferred shares Lower Project Adjusted EBITDA and operating cash flow - Mostly reflects impact of expiring PPAs (or extensions on lower terms) and non-recurrence of OEFC settlement Costs Remain focused on improvements where possible, at both corporate and operating levels Operations team has identified $2 million of recurring maintenance cost savings for 2018 Also eliminated another $2 million of planned maintenance spend from future periods Other modest cost reductions (rent)
Outlook for 2018 and Beyond (continued) 7 PPAs Average remaining PPA life of approximately seven years Most of the Project Adjusted EBITDA impact from PPA expirations through 2021 occurs in 2018 Approximately two-thirds of 2018 estimated Project Adjusted EBITDA is from projects under PPAs that expire after 2022 Even with declining EBITDA, PPAs provide significant cash flow available for capital allocation Expect to achieve net debt level of approximately zero by about 2025 Growth Patient and disciplined approach as markets remain fully valued Focused on earning in excess of our cost of capital without taking on undue risk Valuation Intrinsic value framework (NPV of future cash flows) Range of values depending on estimates of various outcomes (not a point forecast) Generally assume modest recovery in the level of power prices Believe hydro assets have strong value post-PPA Recontracting potential for some gas plants and option value on other plants Current share price represents a significant discount to our base case estimates of intrinsic value
Full Year 2017 Operational Performance: Lower generation primarily due to curtailment of the Ontario gas plants 8 FY 2017 FY 2016 East U.S. 88.8% 93.1% West U.S. 92.1% 92.1% Canada 92.8% 95.3% Total 90.3% 93.3% Aggregate Power Generation YTD 2017 vs. YTD 2016 (Net GWh) East U.S. West U.S. Canada Total 2% 6% (53%) (15%) Availability factor modestly lower: Generation is down: Kapuskasing / Nipigon / North Bay were not in operation for 2017 under the enhanced dispatch contracts with the IESO In 2016, these plants generated 929 GWh in the period Mamquam weir replacement and lower water flows Selkirk lower merchant dispatch; asset was sold in Q4 2017 Curtis Palmer higher water flows versus 2016 Morris planned maintenance in 2016 Frederickson and Kenilworth planned maintenance outages in 2017 Mamquam and Williams Lake forced outages in 2017 Morris planned maintenance in 2016 Safety: Total Recordable Incident Rate (1) 2014 BLS data, generation companies = 1.1 (2) 2015 BLS data, generation companies = 1.4 (3) 2016 BLS data, generation companies = 1.0 Industry avg (1) Availability (weighted average) Industry avg (2) Industry avg (3) 1.25 1.67 0.69 1.16 FY 2014 FY 2015 FY 2016 FY 2017 2,430 2,478 1,507 1,601 1,977 935 5,914 5,014 FY 2016 FY 2017 FY 2016 FY 2017 FY 2016 FY 2017 FY 2016 FY 2017
Q4 2017 Operational Performance: Lower generation primarily due to Ontario curtailments, but availability improved 9 Q4 2017 Q4 2016 East U.S. 95.7% 92.6% West U.S. 97.0% 91.2% Canada 95.8% 96.3% Total 96.1% 93.0% Aggregate Power Generation Q4 2017 vs. Q4 2016 (Net GWh) East U.S. West U.S. Canada Total 6% 58% (52%) (4%) Higher availability factor: Generation is down: Kapuskasing / Nipigon / North Bay were not in operation for 2017 under the enhanced dispatch contracts with the IESO In 2016, these plants generated 227 GWh in the comparable period + Frederickson significantly higher generation due to colder ambient temperatures Curtis Palmer higher water flows (vs dry Q4 2016) Morris higher PJM demand + Naval Training Center forced outage in prior period + Mamquam and Oxnard maintenance outages in prior period Safety: Total Recordable Incident Rate (1) 2014 BLS data, generation companies = 1.1 (2) 2015 BLS data, generation companies = 1.4 (3) 2016 BLS data, generation companies = 1.0 Industry avg (1) Availability (weighted average) Industry avg (2) Industry avg (3) 1.25 1.67 0.69 1.16 FY 2014 FY 2015 FY 2016 FY 2017 594 630 281 444 489 236 1,364 1,310 Q4 2016 Q4 2017 Q4 2016 Q4 2017 Q4 2016 Q4 2017 Q4 2016 Q4 2017
Operations Update 10 Analysis and Benchmarking for Cost Savings (ABCs) Maintenance summit in June focused on standardizing best practices Operations summit held in November; focus was on best operating practices for cost savings Internal benchmarking of plants completed; to commence external benchmarking in 2018 2018 project budgets complete Have implemented $2 million in non-fuel O&M permanent cost reductions for 2018 (optimization, staffing, other) Reduced expected one-time costs in 2018 by $1.6 million (primarily Tunis restart costs) Eliminated another $2 million of planned maintenance spending from future periods Deployed Predictive Analytic software at three sites in 2017; plan to deploy at three additional sites in 2018 to improve reliability and to enhance condition-based maintenance Tunis Planned Restart Targeting commercial operation in Q3 2018 Simple-cycle operation under 15-year PPA Restart maintenance is on track Gas turbine overhaul is complete Generator overhaul is underway Will be upgrading control system Estimated cost of $5 - $6 million; majority to be incurred and expensed in 2018 Significant 2018 Outages Manchief – GT11 overhaul (April-May) Kenilworth – Gas turbine overhaul (March-April)
Commercial Update: PPA Renewal Status 11 Currently under short-term Enhanced Dispatch Contract through October 2018 (not in operation) Entered into a Long-term Enhanced Dispatch Contract (LTEDC) with the IESO in December 2017 - Effective November 2018 through the original PPA expiration date of December 2022 - Original PPA will terminate effective October 31, 2018 Nipigon will return to service in November 2018 as a simple-cycle plant and will operate on a flexible basis - To receive capacity-type monthly payments - Will operate when needed/economic and earn energy revenues, but expected to have low capacity factor - New contract provides improved economic outcome for both ratepayers and the Company versus the original PPA Contract scheduled to expire April 1, 2018; agreed to amend and extend in December 2017 Short-term extension from April 2, 2018 to June 30, 2019 (or Sept. 30, 2019 at BC Hydro’s option); subject to regulatory approval Goal is to bridge operations through conclusion of BC Hydro’s Integrated Resource Planning process (Q2 or Q3 2019) Will not invest in new fuel shredder during short-term extension Currently expect de minimis Project Adjusted EBITDA contribution during short-term extension Written hearing regarding appeal of amended air permit (to burn alternative fuels) set for Q2 2018 Nipigon (Ontario) Williams Lake (British Columbia)
Commercial Update: PPA Renewal Status (continued) 12 Land use agreements with U.S. Navy expired; plant operations ceased Feb. 7, 2018 - Continue to discuss potential paths to site control with the Navy; the paths are challenging and outcome is uncertain - Beginning preparations to decommission the sites if necessary; in process of defining scope and timing of work On March 1, received approval from California Public Utilities Commission (CPUC) for: - New seven-year contracts with SDG&E for Naval Station and North Island (requires site control) - Resource adequacy contracts for all three projects for 2018 (requires site control) - Early termination of existing PPAs - CPUC approval is subject to 30-day appeal period Entered into seven-year PPA with Southern California Edison for NTC - Further operations dependent on site control and CPUC approval of PPA PPA with Merck is scheduled to expire Sept. 30, 2018 Contract provides for series of short-term extensions at Merck’s option Expect to enter into short-term extension with Merck; Merck considering longer-term options San Diego Projects Kenilworth (New Jersey)
2017 Financial Highlights and Recent Developments ($ millions) 13 Strong Increase in Project Adjusted EBITDA Improved Debt Maturity Profile Managing Interest Costs and Risk Q4 2017 $62.2 vs Q4 2016 $42.3 FY 2017 $288.8 vs FY 2017 $202.2 (exceeded guidance of $260 - $275) Key Drivers: - Enhanced Dispatch Contracts (Kapuskasing, North Bay, Nipigon) - OEFC Settlement (Kapuskasing, North Bay, Tunis) - Higher water flows (Curtis Palmer) Repaid $166 million of Debt in 2017 Extended maturity of $200 million revolver one year to 2022; ensures stable liquidity profile In January 2018, issued new Cdn$115 million 6.00% convertible debenture with 2025 maturity - Using proceeds to redeem most of 2019 convertible maturities (March 2018) 2019 maturities of Cdn$24.7 million remaining; no bullet maturities in 2020 or 2021 Amortized $100 million of term loan and $11.4 million of project debt Repaid $54.6 million Piedmont project debt in full, eliminating 2018 maturity - Now in a position to receive distributions from project Consolidated leverage ratio 3.3 times at 12/31/17 (though expected to increase in 2018) Liquidity of $198 million, including approximately $40 million of discretionary cash Reduced spread on term loan and revolver twice, to 350 bp (from 500 bp) Managing interest rate exposure on term loan; put on additional swaps in January 2018 - Remaining exposure ~ $0.6 million impact in 2018 per 100 bp change in rates
Q4 and Full Year 2017 Project Adjusted EBITDA (Bridge vs 2016) ($ millions) 14 $202 $289 FY2016 FY2017 $(2) Frederickson Major maintenance Ontario Enhanced Dispatch Contracts Kapuskasing, North Bay and Nipigon $42 OEFC Settlement Kapuskasing, North Bay and Tunis $29 Curtis Palmer Higher water flows $13 Orlando Lower fuel expense $5 $(3) Mamquam Lower water flows and forced outage Morris Major outage in prior period; Higher PJM prices in Q4 $4 $42 $62 Q4 2016 Q4 2017 Ontario Enhanced Dispatch Contracts and OEFC Settlement Kapuskasing, North Bay and Nipigon $16 Curtis Palmer Favorable water flows $3 Oxnard Hot gas path in prior period $2 Orlando Lower Fuel expense $2 Naval Station Lower steam flow $(1) Kenilworth Gas Settlement in prior period $(2) $(2) Calstock Lower waste heat
Twelve months ended December 31, Unaudited 2017 2016 Change Cash provided by operating activities $169.2 $112.3 $56.9 Significant uses of cash provided by operating activities: Term loan repayments (1) (99.9) (85.5) (14.5) Project debt amortization (2) (9.3) (10.9) 1.6 Capital expenditures (5.3) (7.2) 1.9 Preferred dividends (8.7) (8.5) (0.2) Three months ended December 31, Unaudited 2017 2016 Change Cash provided by operating activities $31.3 $20.4 $10.9 Significant uses of cash provided by operating activities: Term loan repayments (1) (22.7) (15.0) (7.7) Project debt amortization (2) (2.3) (3.0) 0.7 Capital expenditures 0.5 (0.7) 1.2 Preferred dividends (2.2) (2.1) (0.1) Q4 and FY2017 Cash Flow Results ($ millions) 15 Primary drivers: Morris major outage in 2016 +5.9 Oxnard timing of receipts +4.7 Higher water flows at Curtis Palmer +3.6 Kap/N.Bay/Nipigon revised contracts +2.5 Piedmont’s first cash distribution to APC +2.2 Higher cash interest payments (2.2) Kenilworth gas settlement in Q4 2016 (2.0) Tunis restart maintenance (1.5) Other changes, net (2.3) Includes 1% mandatory annual amortization and targeted debt repayments. Excludes Piedmont project debt repayment of $54.6 million which was funded out of cash on hand Primary drivers: Kap / N.Bay / Nipigon revised contracts +26.8 OEFC Settlement +26.6 Higher water flows at Curtis Palmer +13.0 Orlando lower fuel costs +4.4 Mamquam weir replacement and water flows (3.9) Frederickson major maintenance (2.8) Calstock lower waste heat (3.3) Changes in working capital and other (3.9)
Liquidity ($ millions) 16 Dec 31, 2017 Sep 30, 2017 Cash and cash equivalents, parent $49.7 $100.1 Cash and cash equivalents, projects 29.0 22.3 Total cash and cash equivalents 78.7 122.4 Revolving credit facility 200.0 200.0 Letters of credit outstanding (80.5) (72.6) Availability under revolving credit facility 119.5 127.4 Total Liquidity $198.2 $249.8 Excludes restricted cash of: 6.2 12.5 Consolidated debt (1) $845.7 $926.6 Leverage ratio (2) 3.3 3.8 (1) Before unamortized discount and unamortized deferred financing costs (2) Consolidated gross debt to trailing 12-month Adjusted EBITDA (after Corporate G&A)
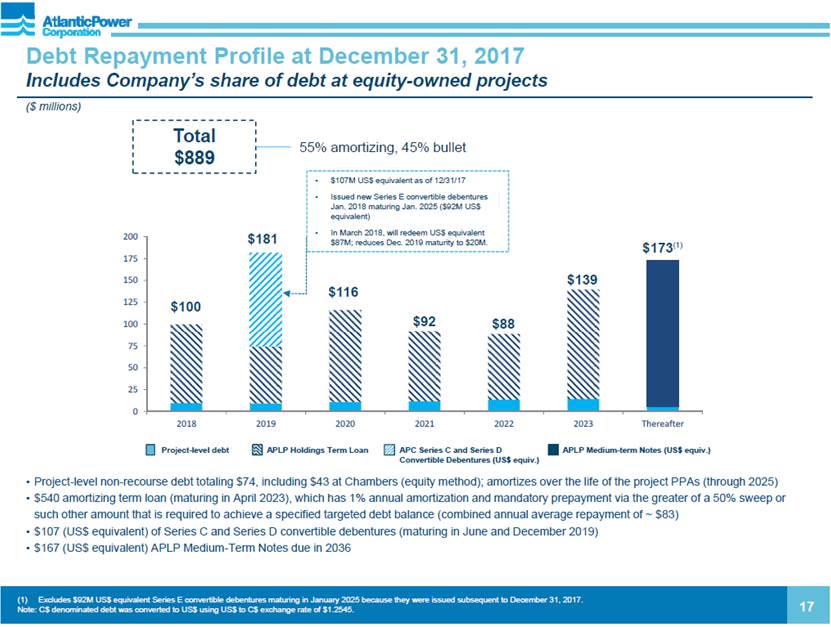
Debt Repayment Profile at December 31, 2017 Includes Company’s share of debt at equity-owned projects ($ millions) 17 Excludes $92M US$ equivalent Series E convertible debentures maturing in January 2025 because they were issued subsequent to December 31, 2017. Note: C$ denominated debt was converted to US$ using US$ to C$ exchange rate of $1.2545. Project-level non-recourse debt totaling $74, including $43 at Chambers (equity method); amortizes over the life of the project PPAs (through 2025) $540 amortizing term loan (maturing in April 2023), which has 1% annual amortization and mandatory prepayment via the greater of a 50% sweep or such other amount that is required to achieve a specified targeted debt balance (combined annual average repayment of ~ $83) $107 (US$ equivalent) of Series C and Series D convertible debentures (maturing in June and December 2019) $167 (US$ equivalent) APLP Medium-Term Notes due in 2036 Total $889 $100 $181 $116 $173(1) $92 APLP Holdings Term Loan Project-level debt APLP Medium-term Notes (US$ equiv.) APC Series C and Series D Convertible Debentures (US$ equiv.) 55% amortizing, 45% bullet $88 $139 $107M US$ equivalent as of 12/31/17 Issued new Series E convertible debentures Jan. 2018 maturing Jan. 2025 ($92M US$ equivalent) In March 2018, will redeem US$ equivalent $87M; reduces Dec. 2019 maturity to $20M. 0 25 50 75 100 125 150 175 200 2018 2019 2020 2021 2022 2023 Thereafter
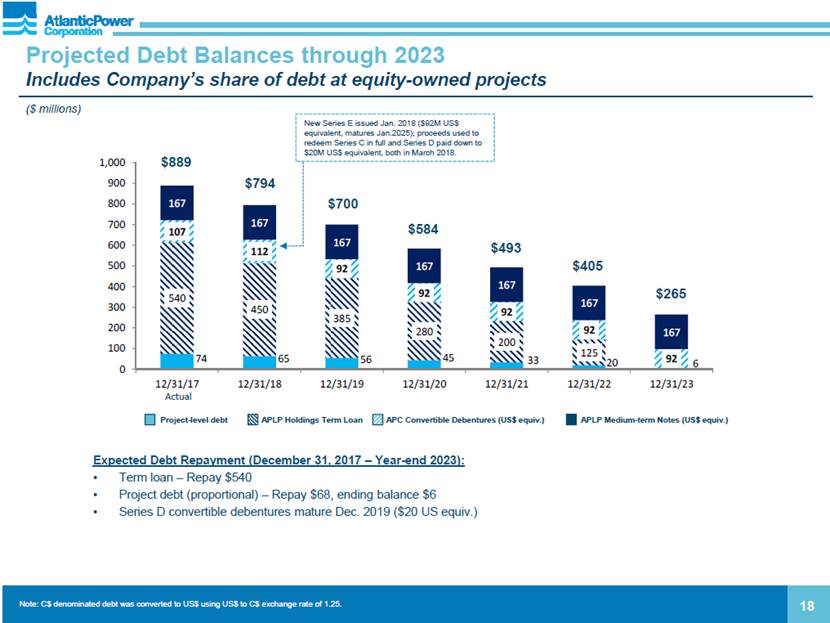
18 Expected Debt Repayment (December 31, 2017 – Year-end 2023): Term loan – Repay $540 Project debt (proportional) – Repay $68, ending balance $6 Series D convertible debentures mature Dec. 2019 ($20 US equiv.) Projected Debt Balances through 2023 Includes Company’s share of debt at equity-owned projects ($ millions) APLP Holdings Term Loan Project-level debt APLP Medium-term Notes (US$ equiv.) APC Convertible Debentures (US$ equiv.) Note: C$ denominated debt was converted to US$ using US$ to C$ exchange rate of 1.25. $889 $584 $493 $794 $700 $405 $265 New Series E issued Jan. 2018 ($92M US$ equivalent, matures Jan.2025); proceeds used to redeem Series C in full and Series D paid down to $20M US$ equivalent, both in March 2018. Actual 74 65 56 45 33 20 6 540 450 385 280 200 125 107 112 92 92 92 92 92 167 167 167 167 167 167 167 0 100 200 300 400 500 600 700 800 900 1,000 12/31/17 12/31/18 12/31/19 12/31/20 12/31/21 12/31/22 12/31/23
2018 Project Adjusted EBITDA Guidance (Bridge vs 2017) ($ millions) 19 19 The Company has not provided guidance for Project income or Net income because of the difficulty of making accurate forecasts and projections without unreasonable efforts with respect to certain highly variable components of these comparable GAAP metrics, including changes in the fair value of derivative instruments and foreign exchange gains or losses. These factors, which generally do not affect cash flow, are not included in Project Adjusted EBITDA. $289 FY 2017 Actual $185 $170 FY 2018 Guidance Morris CT upgrades are complete; lower maintenance expense and outage hours; higher PJM capacity prices $5 $(105) PPA Expirations Kapuskasing: EDC/cost savings(1) ($26) OEFC Settlement (11) North Bay: EDC/cost savings(1) (24) OEFC Settlement (11) San Diego (23) Williams Lake (10) Tunis Restart OEFC Settlement in 2017 ($7), GT overhaul and controls upgrade $(7) Manchief Maintenance GT11 major overhaul $(7) Curtis Palmer Assumes average water flows $(3) Other Frederickson Maintenance in 2017 (+3), Kenilworth GT overhaul in 2018 (-2); other projects, net $5 (1) Enhanced Dispatch Contract (EDC) and fuel, operations and maintenance cost savings
Bridge of 2018 Project Adjusted EBITDA Guidance to Cash Provided by Operating Activities ($ millions) 20 20 The Company has not provided guidance for Project income or Net income because of the difficulty of making accurate forecasts and projections without unreasonable efforts with respect to certain highly variable components of these comparable GAAP metrics, including changes in the fair value of derivative instruments and foreign exchange gains or losses. These factors, which generally do not affect cash flow, are not included in Project Adjusted EBITDA. 2018 Guidance (as of 3/1/18) 2017 Actual Project Adjusted EBITDA $170 - $185 $288.8 Adjustment for equity method projects (1) (2) (6.4) Corporate G&A expense (22) (23.6) Cash interest payments (47) (72.0) Cash taxes (4) (4.4) Other - (13.2) Cash provided by operating activities $95 - $110 $169.2 Note: For purposes of providing a reconciliation of Project Adjusted EBITDA guidance, impact on Cash provided by operating activities of changes in working capital is assumed to be nil. (1) Represents difference between Project Adjusted EBITDA and cash distribution from equity method projects 2018 Planned Uses of Cash Provided by Operating Activities: Debt repayments ~$100 Preferred dividends ~$8 Capital expenditures ~$1
Tax Update NOL Expiration by Year (As of 12/31/17 $ millions) 2027 $12.1 2028 60.3 2029 63.8 2030 25.8 2031 13.4 2032 25.3 2033 153.0 2034 167.8 2035 17.0 2036 37.6 2037 16.1 Total $592.2 As of December 31, 2017, the Company had U.S. and Canadian NOLs scheduled to expire per the schedule (right) that can be utilized to offset future taxable income in their respective tax jurisdictions. NOLs represent potential future tax savings of approximately $130.4 million in the U.S. under the revised U.S. Federal corporate tax rate of 21% and $27.3 million in Canada. Although these NOLs are expected to be available as a future benefit: Some of the NOLs are subject to limitations on their use. Pre-Tax Reform NOLs, as detailed in the chart, can be used to offset 100% of taxable income and retains a 2-year carryback and a 20-year carry forward period. Post-Tax Reform NOLs are limited to offset 80% of taxable income, have no carryback feature but have an unlimited carry forward period. Net Operating Losses Other Impacts of Recent U.S. Tax Legislation The Company will save cash taxes with Alternative Minimum Tax “AMT” having been repealed. The Company has a de minimis amount of AMT credits which are 50% refundable in 2018-2021 and any remaining credits are fully refundable in 2022. Business Interest Expense Limitation Net business interest deductions in excess of 30% EBITDA (EBIT after 2021) will be disallowed. However, disallowed interest deductions will be carried forward indefinitely to be used at a future date. The Company estimates interest expense of approximately $16 million and $1 million will be disallowed in 2018 and 2019, respectively. The disallowed expense will be carried forward and utilized in 2019 and 2020. The Company does not anticipate paying any Federal cash taxes in either the U.S. or Canada in 2018 or 2019. 21
Appendix 22 TABLE OF CONTENTS Page 2017 Impairments 23 Power Projects and PPA Expiration Dates 24 Capital Structure Information 25-29 Project Information – Earnings/Cash Flow Diversification and PPA Life 30-31 Supplemental Financial Information OEFC Settlement 32 Q4 and FY 2017 Results Summary 33 G&A and Development Expenses 34 Project Income by Project 35 Project Adjusted EBITDA by Project 36 Cash Distributions by Segment 37-38 Non-GAAP Disclosures 39-41
2017 Impairments 23 Q4 2017: Frederickson (50.15% equity-owned project) Reduction in long-term power price forecast (beyond PPA term) Continue to see value beyond PPA expiration based on planned coal retirements and strong population growth in region $28.3 million impairment of equity investment (included in earnings from unconsolidated affiliates) Consolidated projects – Curtis Palmer and Williams Lake $14.7 million impairment of goodwill at Curtis Palmer, based on decline in long-term power price forecast - Continue to see significant value post-PPA $29.1 million impairment of PP&E and intangible assets at Williams Lake, based on assessment of cash flows under short-term contract extension and probability-weighted evaluation of cash flows under long-term extension Earlier in the year: Q3 2017 impairment of PP&E assets at the three San Diego projects totaling $57.3 million; based on assumption of no operation after February 7, 2018 Q2 2017 impairments at Selkirk ($10.6 million full impairment) and Chambers ($47.1 million partial impairment); both included in earnings from unconsolidated affiliates - Sold Selkirk in November 2017 and recorded $1.0 million gain Total impairment expense for the year was $187.1 million, including $85.9 million included in earnings from unconsolidated affiliates Impairments do not affect cash flow and are not included in Project Adjusted EBITDA, but are included in GAAP net income or loss
Year Project Location Type Economic Interest Net MW Contract Expiry 2018 Naval Station California Nat. Gas 100% 47 (1) Naval Training (NTC) California Nat. Gas 100% 25 (1) North Island California Nat. Gas 100% 40 (1) Kenilworth New Jersey Nat. Gas 100% 29 9/2018 2019 Williams Lake B.C. Biomass 100% 66 6/2019 (2) 2020 Oxnard California Nat. Gas 100% 49 4/2020 Calstock Ontario Biomass 100% 35 6/2020 2021 none expiring 2022 Manchief Colorado Nat. Gas 100% 300 4/2022 (3) Moresby Lake B.C. Hydro 100% 6 8/2022 Frederickson Washington Nat. Gas 50.15% 125 8/2022 Nipigon Ontario Nat. Gas 100% 40 12/2022 2023 Orlando Florida Nat. Gas 50% 65 12/2023 2024 Chambers New Jersey Coal 40% 105 3/2024 2025 and beyond Mamquam B.C. Hydro 100% 50 9/2027 (4) Curtis Palmer New York Hydro 100% 60 12/2027 (5) Cadillac Michigan Biomass 100% 40 6/2028 Piedmont Georgia Biomass 100% 55 9/2032 Tunis Ontario Nat. Gas 100% 40 (6) Morris Illinois Nat. Gas 100% 177 12/2034 Koma Kulshan Washington Hydro 49.8% 6 12/2037 Power Projects and PPA Expiration Dates 24 (1) Contracts expiring 11/2019 were terminated on March 1, 2018. New contracts for Naval Station and North Island are subject to the Company obtaining the right to use the Navy sites on which the projects are located (“site control”). (2) May be extended to Sept. 2019 at BC Hydro’s option (3) Public Service Co. of Colorado has option to purchase Manchief in either May 2020 or May 2021. (4) BC Hydro has an option to purchase Mamquam in Nov. 2021 and every five years thereafter. (5) Expires at the earlier of Dec. 2027 or the provision of 10,000 GWh of generation. Based on cumulative generation to date, we expect the PPA to expire prior to Dec. 2027. (6) 15-year contract commences before June 2019.
Capitalization ($ millions) 25 Dec. 31, 2017 Dec. 31, 2016 Long-term debt, incl. current portion (1) APLP Medium-Term Notes (2) $167.4 $156.4 Revolving credit facility - - Term Loan 540.0 639.9 Project-level debt (non-recourse) 31.2 97.1 Convertible debentures (2) 107.0 102.9 Total long-term debt, incl. current portion $845.5 79% $996.3 78% Preferred shares (3) 215.2 18% 221.3 18% Common equity (4) (18.4) 2% 64.6 5% Total shareholders equity $196.8 21% $285.9 22% Total capitalization $1,042.2 100% $1,228.2 100% Debt balances are shown before unamortized discount and unamortized deferred financing costs Period-over-period change due to F/X impacts Par value of preferred shares was approximately $175 million and $168 million at December 31, 2017 and December 31, 2016, respectively. Common equity includes other comprehensive income and retained deficit Note: Table is presented on a consolidated basis and excludes equity method projects
Capital Summary at December 31, 2017 ($ millions) (1) Includes impact of interest rate swaps. (2) Set on Sept 1, 2017 for December 29, 2017 dividend payment. Will be reset quarterly based on sum of the Canadian Government 90-day Treasury Bill yield (using the three-month average result plus 4.18%). Note: C$ denominated debt was converted to US$ using US$ to C$ exchange rate of $1.2545. 26 Atlantic Power Corporation Maturity Amount Interest Rate Convertible Debentures (ATP.DB.U) 6/2019 $42.5 5.75% Convertible Debentures (ATP.DB.D) 12/2019 $64.5 (C$81.0) 6.00% APLP Holdings Limited Partnership Maturity Amount Interest Rate Revolving Credit Facility 4/2022 $0 LIBOR + 3.50% Term Loan 4/2023 $540.0 4.60%-4.90% (1) Atlantic Power Limited Partnership Maturity Amount Interest Rate Medium-term Notes 6/2036 $167.4 (C$210) 5.95% Preferred shares (AZP.PR.A) N/A $95.2 (C$118.8) 4.85% Preferred shares (AZP.PR.B) N/A $46.9 (C$58.5) 5.57% Preferred shares (AZP.PR.C) N/A $33.3 (C$41.5) 4.86% (2) Atlantic Power Transmission & Atlantic Power Generation Maturity Amount Interest Project-level Debt (consolidated) Various $31.2 4.45%-6.18% Project-level Debt (equity method) Various $42.9 4.50%-5.00% Pro Forma – Q1 2018 Maturity Expected Outstanding by end of Q1 ’18 Interest Rate Convertible Debentures (ATP.DB.U) 6/2019 ~$0 5.75% Convertible Debentures (ATP.DB.D) 12/2019 ~$20 (C$24.7) 6.00% Convertible Debentures (ATP.DB.E) 1/2025 $92.0 (C$115.0) 6.00%
Progress on Debt Reduction and Leverage ($ millions, unaudited) 27 Total net reduction in consolidated debt of approximately $1.0 billion since YE 2013; in addition, debt at equity-owned projects has been reduced by approximately $76 million. Leverage ratio (1) 12/31/2013 consolidated debt $1,876 9.5x 12/31/2014 consolidated debt 1,755 6.9x 12/31/2015 consolidated debt 1,019 5.7x 12/31/2016 consolidated debt 997 5.6x Changes Q1-Q4 2017: Amortization of new term loan (100) Amortization of project debt (11) Repayment of Piedmont project debt in full (55) Incremental F/X impact (unrealized loss) 15 12/31/17 consolidated debt 846 3.3x Note: Consolidated debt excludes unamortized discounts and unamortized deferred financing costs (1) Consolidated gross debt to trailing 12-month Adjusted EBITDA (after Corporate G&A)
APLP Holdings Term Loan Cash Sweep Calculation 28 APLP Holdings Adjusted EBITDA (note: excludes Piedmont; is after majority of Atlantic Power G&A expense) Less: Capital expenditures Cash taxes = Cash flow available for debt service Less: APLP Holdings consolidated cash interest (revolver, term loan, MTNs, EPP, Cadillac) = Cash flow available for cash sweep Calculate 50% of cash flow available for sweep Compare 50% cash flow sweep to amount required to achieve targeted debt balance Must repay greater of 50% or the amount required to achieve targeted debt balance for that quarter If targeted debt balance is > 50% of cash flow sweep: Repay amount required to achieve target, up to 100% of cash flow available from sweep Remaining amount, if any, to Company If targeted debt balance is < 50% of cash flow sweep: Repay 50% minimum Remaining 50% to Company Expect cash sweep to average 65% to 70% over the life of the loan, though higher in early years, and with considerable variability from year to year Expect > 80% of principal to be repaid by maturity through mandatory and targeted repayments Notes: The cash sweep calculation occurs at each quarter-end. Targeted debt balances are specified in the credit agreement for each quarter through maturity.
APLP Holdings Credit Facilities – Financial Covenants 29 Leverage ratio: Consolidated debt to Adjusted EBITDA, calculated for the trailing four quarters. Consolidated debt includes both long-term debt and the current portion of long-term debt at APLP Holdings, specifically the amount outstanding under the term loan and the amount borrowed under the revolver, if any, the Medium Term Notes, and consolidated project debt (Epsilon Power Partners and Cadillac). Adjusted EBITDA is calculated as the Consolidated Net Income of APLP Holdings plus the sum of consolidated interest expense, tax expense, depreciation and amortization expense, and other non-cash charges, minus non-cash gains. The Consolidated Net Income includes an allocation of the majority of Atlantic Power G&A expense. It also excludes earnings attributable to equity-owned projects but includes cash distributions received from those projects. Interest Coverage ratio: Adjusted EBITDA to consolidated cash interest payments, calculated for the trailing four quarters. Adjusted EBITDA is defined above. Consolidated cash interest payments include interest payments on the debt included in the Consolidated debt ratio defined above. Note, the project debt, Project Adjusted EBITDA and cash interest expense for Piedmont are not included in the calculation of these ratios because the project is not included in the collateral package for the credit facilities. Fiscal Quarter Leverage Ratio Interest Coverage Ratio 12/31/2017 5.50:1.00 3.00:1.00 3/31/2018 5.50:1.00 3.00:1.00 6/30/2018 5.00:1.00 3.00:1.00 9/30/2018 5.00:1.00 3.00:1.00 12/31/2018 5.00:1.00 3.00:1.00 3/31/2019 5.00:1.00 3.00:1.00 6/30/2019 5.00:1.00 3.25:1.00 9/30/2019 5.00:1.00 3.25:1.00 12/31/2019 5.00:1.00 3.25:1.00 3/31/2020 5.00:1.00 3.25:1.00 6/30/2020 4.25:1.00 3.50:1.00 9/30/2020 4.25:1.00 3.50:1.00 12/31/2020 4.25:1.00 3.50:1.00 3/31/2021 4.25:1.00 3.50:1.00 6/30/2021 4.25:1.00 3.75:1.00 9/30/2021 4.25:1.00 3.75:1.00 12/31/2021 4.25:1.00 3.75:1.00 3/31/2022 4.25:1.00 3.75:1.00 6/30/2022 4.25:1.00 4.00:1.00 9/30/2022 4.25:1.00 4.00:1.00 12/31/2022 4.25:1.00 4.00:1.00 3/31/2023 4.25:1.00 4.00:1.00
No single project contributed more than 14% to Project Adjusted EBITDA for the twelve months ended December 31, 2017 (1) 30 Earnings and Cash Flow Diversification by Project (1) Based on $288.8 million in Project Adjusted EBITDA for the twelve months ended December 31, 2017. Un-allocated corporate segment is included in “Other” category for project percentage allocation and allocated equally among segments for twelve months ended December 31, 2017 Project Adjusted EBITDA by Segment. (2) Based on $242.8 million in Cash Distributions from Projects for the twelve months ended December 31, 2017. Twelve months ended December 31, 2017 Cash Distributions from Projects by Segment (2) Twelve months ended December 31, 2017 Project Adjusted EBITDA by Segment (1) Generation by Segment (MWh): East U.S.: 49% West U.S.: 32% Canada: 19% (7 projects) East U.S. 36% West U.S. 19% Canada 45% East U.S. 39% West U.S. 17% Canada 44% Other 6% Curtis Palmer 14% Kapuskasing 13% North Bay 12% Orlando 10% Nipigon 7% Williams Lake 6% Chambers 5% Manchief 5% Piedmont 3% Naval Station 3% Frederickson 3% North Island 3% Tunis 2% Cadillac 3% Morris 4% Calstock 2%
PPA Length (years) (1) 31 (1) Weighted by FY 2018 Project Adjusted EBITDA. Assumes PPA’s for San Diego assets terminate in February 2018. (2) Primarily merchant revenues at Morris Pro Forma Offtaker Credit Rating (1) Approximately two-thirds of 2018 Project Adjusted EBITDA generated from PPAs that expire after 2022 Majority of Cash Flows Covered by Contracts with More Than 5 Years Remaining Contracted projects have an average remaining PPA life of 7.0 years (1) (2) Merchant / Market Pricing 4% A - to A+ 50% AA - to AA 17% AAA 9% BBB - to BBB+ 20% BB 1% NR 3% 1 to 5 31% 6 to 10 49% 11 to 15 15% 15+ 2%
OEFC Settlement Amounts in Cdn$ millions, unless otherwise indicated 32 Q1 2017 Q2 2017 Q3 2017 Q4 2017 Total FY 2017 Q1 2018 Payments related to: 2013 – 2015 0.0 20.3 0.0 0.0 20.3 2016 8.7 0.0 0.0 0.0 8.7 2017 (EDCs) 2.3 1.4 1.2 3.8 8.7 Total 11.0 21.8 1.2 3.8 37.8 Cash received (Cdn$) 11.0 21.8 1.2 1.3 35.2 2.6 Cash received (US$) 8.2 16.4 1.0 1.0 26.6 2.0 Recorded in revenues (Cdn$) 0.0 32.8 1.2 3.8 37.8 Recorded in revenues (US$) 0.0 24.7 1.0 3.0 28.6
33 Summary of Financial and Operating Results Segment Results Results Summary, Q4/FY2017 vs Q4/FY2016 ($ millions, unaudited) Three months ended December 31, Twelve months ended December 31, 2017 2016 2017 2016 Financial Results Project revenue $100.0 $93.4 $431.0 $399.2 Project (loss) income (39.7) 13.3 (47.4) 10.1 Net loss attributable to Atlantic Power Corp. (41.1) (6.6) (98.6) (122.4) Cash provided by operating activities 31.3 20.4 169.2 112.3 Project Adjusted EBITDA 62.2 42.3 288.8 202.2 Operating Results Aggregate power generation (net GWh) 1,310.1 1,364.2 5,014.7 5,914.0 Weighted average availability 96.1% 93.0% 90.3% 93.3% Three months ended December 31, Twelve months ended December 31, 2017 2016 2017 2016 Project (loss) income East U.S. ($0.7) $14.3 ($17.0) $31.2 West U.S. (25.8) (2.0) (72.0) 11.8 Canada (12.7) (2.6) 38.8 (35.7) Un-allocated Corporate (0.5) 3.7 2.8 2.8 Total (39.7) 13.3 (47.4) 10.1 Project Adjusted EBITDA East U.S. $24.7 $21.9 $112.5 $92.4 West U.S. 7.6 7.8 49.1 51.2 Canada 28.5 12.6 125.8 58.8 Un-allocated Corporate 1.4 - 1.4 (0.2) Total 62.2 42.3 288.8 202.2
2013 Actual 2014 Actual 2015 Actual 2016 Actual 2017 Actual Development (1) $7.2 $3.7 $1.1 n/a (1) n/a (1) Project G&A and Other 11.4 3.8 1.5 $0.2 ($1.4) Corporate G&A (2) 35.2 37.9 29.4 22.6 23.6 Total Overhead $53.8 $45.4 $31.9 $22.8 $22.2 G&A and Development Expenses ($ millions) 34 2017 level represents a ~60% reduction from 2013; 2018 expected to be in line with 2017 Includes approximately $3 million annual contractual obligation related to Ridgeline acquisition that terminated in the first quarter of 2015. For 2016 and beyond, all Development spend will be recorded in Corporate G&A. Includes $6 severance in 2014; approximately $4 severance and $2 restructuring in 2015 Project G&A and other: Operations & Asset Management Environmental, Health & Safety Project Accounting Corporate G&A: Executive & Financial Management Treasury, Tax, Legal, HR, IT, Commercial activities Corporate Accounting Office & administrative costs Public company costs One-time costs (mostly severance) Included in Project Adj. EBITDA “Administration” expense on Income Statement; not included in Project Adj. EBITDA
Project Income (Loss) by Project ($ millions) 35 Project sold in November 2017 Three months ended Twelve months ended December 31 December 31 2017 2016 2017 2016 East U.S. Accounting Cadillac Consolidated $0.7 $0.4 $3.1 $2.9 Curtis Palmer Consolidated (9.8) 1.9 9.4 (4.4) Kenilworth Consolidated 0.1 0.6 (0.1) (0.1) Morris Consolidated 2.5 0.4 4.8 (5.0) Piedmont Consolidated (3.3) 1.9 (5.0) 1.2 Chambers Equity method (0.2) 0.3 (43.0) 4.9 Orlando Equity method 8.2 9.1 24.6 32.1 Selkirk (1) Equity method 1.0 (0.3) (10.7) (0.4) Total (0.7) 14.3 (17.0) 31.2 West U.S. Manchief Consolidated 0.6 0.3 2.7 1.9 Naval Station Consolidated 0.2 - (19.2) 3.5 Naval Training Center Consolidated 1.6 0.4 (10.3) 4.0 North Island Consolidated 0.7 (0.1) (17.0) 1.7 Oxnard Consolidated (1.9) (3.6) (1.1) (2.2) Frederickson Equity method (27.1) 0.8 (27.9) 2.2 Koma Kulshan Equity method 0.1 0.2 0.8 0.7 Total (25.8) (2.0) (72.0) 11.8 Canada Calstock Consolidated 1.0 0.5 3.5 5.2 Kapuskasing Consolidated 5.7 (4.2) 20.1 (4.8) Mamquam Consolidated 1.1 1.7 4.6 (42.4) Nipigon Consolidated 2.7 4.6 5.8 9.1 North Bay Consolidated 6.4 (3.4) 20.8 (5.8) Williams Lake Consolidated (28.7) 0.1 (21.4) 5.7 Other Consolidated (1.0) (1.9) 5.4 (2.7) Total (12.7) (2.6) 38.8 (35.7) Totals Consolidated projects (21.2) (0.4) 6.0 (32.2) Equity method projects (17.9) 10.1 (56.2) 39.5 Un-allocated corporate (0.5) 3.6 2.8 2.8 Total Project (Loss) Income ($39.7) $13.3 ($47.4) $10.1
36 Project Adjusted EBITDA by Project ($ millions) Projects sold in November 2017 Includes Tunis and Moresby Lake Three months Twelve months ended December 31 ended December 31 2017 2016 2017 2016 Other income, net ($58.8) $0.2 ($1.2) ($0.3) Interest expense, net 11.2 2.7 19.2 10.9 Depreciation and amortization 27.6 42.7 133.2 133.5 Impairment 129.8 1.2 187.1 85.9 Change in fair value of derivative instruments (7.9) (17.8) (2.1) (37.9) Project (loss) income ($39.7) $13.3 ($47.4) $10.1 Other expense, net (0.4) - (0.4) (3.9) Foreign exchange (gain) loss (1.4) (5.1) 16.3 13.9 Interest expense, net 14.7 18.1 64.2 106.0 Administration 6.0 5.0 23.6 22.6 Loss from operations before income taxes (58.6) (4.8) (151.1) (128.5) Income tax benefit (19.7) (0.4) (58.1) (14.6) Net loss ($38.9) ($4.4) ($93.0) ($113.9) 2.2 2.2 5.6 8.5 ($41.1) ($6.6) ($98.6) ($122.4) Net loss attributable to Atlantic Power Corporation Net income attributable to preferred share dividends of a subsidiary company Three months Twelve months ended December 31 ended December 31 2017 2016 2017 2016 East U.S. Accounting Cadillac Consolidated $2.1 $1.9 $8.4 $8.5 Curtis Palmer Consolidated 8.3 5.8 39.1 26.5 Kenilworth Consolidated 0.7 2.7 2.5 3.8 Morris Consolidated 4.0 2.5 10.4 6.4 Piedmont Consolidated 0.0 0.2 9.5 7.5 Chambers Equity method 2.6 3.0 15.1 16.0 Orlando Equity method 6.9 6.1 28.6 24.0 Selkirk (1) Equity method 0.0 (0.2) (1.0) (0.3) Total 24.7 21.9 112.5 92.4 West U.S. Manchief Consolidated 3.3 3.2 13.7 13.0 Naval Station Consolidated 0.4 1.4 8.5 9.7 Naval Training Center Consolidated 0.3 0.7 4.6 4.8 North Island Consolidated 0.9 1.5 8.0 8.3 Oxnard Consolidated (0.8) (2.6) 3.2 2.0 Frederickson Equity method 3.4 3.3 10.0 12.1 Koma Kulshan Equity method 0.2 0.4 1.0 1.1 Total 7.6 7.8 49.1 51.2 Canada Calstock Consolidated 1.5 1.2 5.6 7.3 Kapuskasing Consolidated 8.6 0.8 36.4 5.0 Mamquam Consolidated 1.5 2.2 6.2 9.4 Nipigon Consolidated 6.8 5.0 21.0 18.2 North Bay Consolidated 8.6 1.5 34.4 5.2 Williams Lake Consolidated 2.6 2.3 16.4 14.2 Other (2) Consolidated (0.9) (0.5) 5.9 (0.6) Total 28.5 12.6 125.8 58.8 Totals Consolidated projects 47.7 29.8 233.6 149.5 Equity method projects 13.1 12.6 53.7 52.9 Un-allocated corporate 1.4 - 1.4 (0.2) Total Project Adjusted EBITDA $62.2 $42.3 $288.8 $202.2
37 Cash Distributions from Projects, Q4 2017 vs Q4 2016 ($ millions), Unaudited Three months ended December 31, 2017 Project Adjusted EBITDA Repayment of long-term debt Interest expense, net Capital expenditures Other, including changes in working capital Cash Distributions from Projects Segment East U.S. Consolidated $15.2 ($56.9) ($10.0) ($0.4) $67.4 $15.4 Equity method 9.5 - (0.4) (0.0) 2.0 11.1 Total 24.7 (56.9) (10.4) (0.4) 69.4 26.4 West U.S. Consolidated 4.1 - - - 11.1 15.2 Equity method 3.6 - - (0.0) (0.5) 3.1 Total 7.6 - - (0.0) 10.7 18.3 Canada Consolidated 28.5 (0.0) (0.0) (0.3) (9.9) 18.2 Equity method - - - - - - Total 28.5 (0.0) (0.0) (0.3) (9.9) 18.2 Total consolidated 47.7 (56.9) (10.0) (0.6) 68.7 48.8 Total equity method 13.1 - (0.4) (0.1) 1.5 14.1 Un-allocated corporate 1.4 - - - (1.4) 0.0 Total $62.2 ($56.9) ($10.4) ($0.7) $68.8 $62.9 Three months ended December 31, 2016 Project Adjusted EBITDA Repayment of long-term debt Interest expense, net Capital expenditures Other, including changes in working capital Cash Distributions from Projects Segment East U.S. Consolidated $13.0 ($3.0) ($2.1) ($1.3) $0.8 $7.4 Equity method 8.9 - (0.4) (0.1) 1.2 9.7 Total 21.9 (3.0) (2.5) (1.4) 2.0 17.1 West U.S. Consolidated 4.2 - - - 6.5 10.7 Equity method 3.6 - - (0.0) (0.0) 3.6 Total 7.8 - - (0.0) 6.5 14.3 Canada Consolidated 12.6 (0.0) (0.0) (0.2) 2.2 14.6 Equity method - - - - - - Total 12.6 (0.0) (0.0) (0.2) 2.2 14.6 Total consolidated 29.8 (3.0) (2.1) (1.5) 9.5 32.7 Total equity method 12.6 - (0.4) (0.1) 1.2 13.3 Un-allocated corporate - - - - (0.1) (0.1) Total $42.3 ($3.0) ($2.5) ($1.6) $10.6 $45.9
38 Cash Distributions from Projects, FY 2017 vs FY 2016 ($ millions), Unaudited Twelve months ended December 31, 2017 Project Adjusted EBITDA Repayment of long-term debt Interest expense, net Capital expenditures Other, including changes in working capital Cash Distributions from Projects Segment East U.S. Consolidated $69.8 ($65.9) ($15.8) ($4.6) $62.2 $45.8 Equity method 42.6 - (1.6) (0.1) 0.2 41.1 Total 112.5 (65.9) (17.4) (4.7) 62.4 86.9 West U.S. Consolidated 38.0 - - (0.0) (2.4) 35.5 Equity method 11.1 - - (0.0) 0.2 11.3 Total 49.1 - - (0.0) (2.2) 46.8 Canada Consolidated 125.8 (0.2) (0.0) (0.9) (15.7) 109.1 Equity method - - - - - - Total 125.8 (0.2) (0.0) (0.9) (15.7) 109.1 Total consolidated 233.6 (66.1) (15.8) (5.5) 44.1 190.4 Total equity method 53.7 - (1.6) (0.1) 0.4 52.4 Un-allocated corporate 1.4 - - (0.1) (1.3) 0.0 Total $288.8 ($66.1) ($17.4) ($5.7) $43.2 $242.9 Twelve months ended December 31, 2016 Project Adjusted EBITDA Repayment of long-term debt Interest expense, net Capital expenditures Other, including changes in working capital Cash Distributions from Projects Segment East U.S. Consolidated $52.7 ($10.9) ($7.5) ($2.0) $2.6 $35.0 Equity method 39.7 - (1.6) (0.3) (0.7) 37.1 Total 92.4 (10.9) (9.1) (2.3) 1.9 72.1 West U.S. Consolidated 37.9 - - 0.0 2.7 40.6 Equity method 13.2 - - 0.0 1.3 14.6 Total 51.2 - - 0.0 4.0 55.2 Canada Consolidated 58.8 (0.2) (0.0) (0.9) 2.6 60.3 Equity method - - - - - - Total 58.8 (0.2) (0.0) (0.9) 2.6 60.3 Total consolidated 149.5 (11.0) (7.5) (3.0) 7.9 135.8 Total equity method 52.9 - (1.6) (0.2) 0.6 51.7 Un-allocated corporate (0.2) - - 0.3 (0.2) (0.1) Total $202.2 ($11.0) ($9.1) ($2.9) $8.3 $187.5
Non-GAAP Disclosures Project Adjusted EBITDA is not a measure recognized under GAAP and does not have a standardized meaning prescribed by GAAP, and is therefore unlikely to be comparable to similar measures presented by other companies. Investors are cautioned that the Company may calculate this non-GAAP measure in a manner that is different from other companies. The most directly comparable GAAP measure is Project income (loss). Project Adjusted EBITDA is defined as project income (loss) plus interest, taxes, depreciation and amortization (including non-cash impairment charges) and changes in the fair value of derivative instruments. Management uses Project Adjusted EBITDA at the project level to provide comparative information about project performance and believes such information is helpful to investors. A reconciliation of Project Adjusted EBITDA to Project income (loss) and to Net income (loss) by segment and on a consolidated basis is provided on slides 40 and 41. Cash Distributions from Projects is the amount of cash distributed by the projects to the Company out of available project cash flow after all project-level operating costs, interest payments, principal repayment, capital expenditures and working capital requirements. It is not a non-GAAP measure. Project Adjusted EBITDA, a non-GAAP measure, is the most comparable measure, but it is before debt service, capital expenditures and working capital requirements. The Company has provided a bridge of Project Adjusted EBITDA to Cash Distributions from Projects on slides 37 and 38. Investors are cautioned that the Company may calculate these measures in a manner that is different from other companies. 39 $ millions, unaudited Three months ended December 31, Twelve months ended December 31, 2017 2016 2017 2016 Net loss attributable to Atlantic Power Corporation ($41.1) ($6.6) ($98.6) ($122.4) Net income attributable to preferred share dividends of a subsidiary company 2.2 2.2 5.6 8.5 Net loss ($38.9) ($4.4) ($93.0) ($113.9) Income tax benefit (19.7) (0.4) (58.1) (14.6) Loss from operations before income taxes (58.6) (4.8) (151.1) (128.5) Administration 6.0 5.0 23.6 22.6 Interest expense, net 14.7 18.1 64.2 106.0 Foreign exchange (gain) loss (1.4) (5.1) 16.3 13.9 Other income, net (0.4) - (0.4) (3.9) Project (loss) income ($39.7) $13.3 ($47.4) $10.1 Reconciliation to Project Adjusted EBITDA Depreciation and amortization $27.6 $42.7 $133.2 $133.5 Interest expense, net 11.2 2.7 19.2 10.9 Change in the fair value of derivative instruments (7.9) (17.8) (2.1) (37.9) Other income, net (58.8) 0.2 (1.2) (0.3) Impairment 129.8 1.2 187.1 85.9 Project Adjusted EBITDA $62.2 $42.3 $288.8 $202.2
40 Reconciliation of Net (Loss) Income to Project Adjusted EBITDA by Segment, Q4 2017 vs Q4 2016 ($ millions) Three months ended December 31, 2017 East U.S. West U.S. Canada Un-allocated Corporate Consolidated Net (loss) income attributable to Atlantic Power Corporation ($0.7) ($25.8) ($12.7) ($1.9) ($41.1) Net income attributable to preferred share dividends of a subsidiary company - - - 2.2 2.2 Net (loss) (0.7) (25.8) (12.7) 0.3 (38.9) Income tax benefit - - - (19.7) (19.7) Loss from continuing operations before income taxes (0.7) (25.8) (12.7) (19.4) (58.6) Administration - - - 6.0 6.0 Interest expense, net - - - 14.7 14.7 Foreign exchange gain - - - (1.4) (1.4) Other income, net - - - (0.4) (0.4) Project loss (0.7) (25.8) (12.7) (0.5) (39.7) Change in fair value of derivative instruments (9.6) - 0.7 1.0 (7.9) Depreciation and amortization 11.0 4.9 11.5 0.2 27.6 Interest, net 11.2 - - - 11.2 Other project income (58.7) - - (0.1) (58.8) Impairment 72.4 28.3 29.1 - 129.8 Project Adjusted EBITDA $25.6 $7.4 $28.6 $0.6 $62.2 Three months ended December 31, 2016 East U.S. West U.S. Canada Un-allocated Corporate Consolidated Net income (loss) attributable to Atlantic Power Corporation $14.3 ($2.0) ($2.6) ($16.2) ($6.6) Net income attributable to preferred share dividends of a subsidiary company - - - 2.2 2.2 Net income (loss) 14.3 (2.0) (2.6) (14.0) (4.4) Income tax expense - - - (0.4) (0.4) Income (loss) from continuing operations before income taxes 14.3 (2.0) (2.6) (14.4) (4.8) Administration - - - 5.0 5.0 Interest expense, net - - - 18.1 18.1 Foreign exchange gain - - - (5.1) (5.1) Other income, net - - - - - Project income (loss) 14.3 (2.0) (2.6) 3.6 13.3 Change in fair value of derivative instruments (6.2) - (7.8) (3.8) (17.8) Depreciation and amortization 11.1 9.8 21.8 - 42.7 Interest, net 2.7 - - - 2.7 Other project income - - - 0.2 0.2 Impairment - - 1.2 - 1.2 Project Adjusted EBITDA $21.9 $7.8 $12.6 $0.0 $42.3
41 Reconciliation of Net (Loss) Income to Project Adjusted EBITDA by Segment, FY 2017 vs FY 2016 ($ millions) Twelve months ended December 31, 2017 East U.S. West U.S. Canada Un-allocated Corporate Consolidated Net (loss) income attributable to Atlantic Power Corporation ($17.0) ($72.0) $38.8 ($48.4) ($98.6) Net income attributable to preferred share dividends of a subsidiary company - - - 5.6 5.6 Net (loss) income (17.0) (72.0) 38.8 (42.8) (93.0) Income tax benefit - - - (58.1) (58.1) (Loss) income from operations before income taxes (17.0) (72.0) 38.8 (100.9) (151.1) Administration - - - 23.6 23.6 Interest expense, net - - - 64.2 64.2 Foreign exchange loss - - - 16.3 16.3 Other income, net - - - (0.4) (0.4) Project (loss) income (17.0) (72.0) 38.8 2.8 (47.4) Change in fair value of derivative instruments (6.3) - 6.1 (1.9) (2.1) Depreciation and amortization 45.2 35.5 51.9 0.6 133.2 Interest, net 19.2 - - - 19.2 Other project income (1.0) - (0.1) (0.1) (1.2) Impairment 72.4 85.6 29.1 - 187.1 Project Adjusted EBITDA $112.5 $49.1 $125.8 $1.4 $288.8 Twelve months ended December 31, 2016 East U.S. West U.S. Canada Un-allocated Corporate Consolidated Net income (loss) attributable to Atlantic Power Corporation $31.2 $11.8 ($35.7) ($129.7) ($122.4) Net income attributable to preferred share dividends of a subsidiary company - - - 8.5 8.5 Net income (loss) 31.2 11.8 (35.7) (121.2) (113.9) Income tax benefit - - - (14.6) (14.6) Income (loss) from operations before income taxes 31.2 11.8 (35.7) (135.8) (128.5) Administration - - - 22.6 22.6 Interest expense, net - - - 106.0 106.0 Foreign exchange loss - - - 13.9 13.9 Other income, net - - - (3.9) (3.9) Project income (loss) 31.2 11.8 (35.7) 2.8 10.1 Change in fair value of derivative instruments (9.2) - (25.5) (3.2) (37.9) Depreciation and amortization 44.1 39.4 49.5 0.5 133.5 Interest, net 10.9 - - - 10.9 Other project income - - - (0.3) (0.3) Impairment 15.4 - 70.5 - 85.9 Project Adjusted EBITDA $92.4 $51.2 $58.8 ($0.2) $202.2