Attached files
| file | filename |
|---|---|
| 10-K - 10-K - UFP INDUSTRIES INC | ufpi-20171230x10k.htm |
| EX-23 - EX-23 - UFP INDUSTRIES INC | ufpi-20171230xex23.htm |
| EX-21 - EX-21 - UFP INDUSTRIES INC | ufpi-20171230ex218a6ffd1.htm |
| EX-31.(B) - EX-31.(B) - UFP INDUSTRIES INC | ufpi-20171230xex31b.htm |
| EX-32.(B) - EX-32.(B) - UFP INDUSTRIES INC | ufpi-20171230xex32b.htm |
| EX-32.(A) - EX-32.(A) - UFP INDUSTRIES INC | ufpi-20171230xex32a.htm |
| EX-31.(A) - EX-31.(A) - UFP INDUSTRIES INC | ufpi-20171230xex31a.htm |
Exhibit 13
UNIVERSAL FOREST PRODUCTS, INC.
FINANCIAL INFORMATION
(In thousands, except per share and statistics data)
|
|
|
2017 |
|
2016 |
|
2015 |
|
2014 |
|
2013 |
|
|||||
|
Consolidated Statement of Earnings Data |
|
|
|
|
|
|
|
|
|
|
|
|
|
|
|
|
|
Net sales |
|
$ |
3,941,182 |
|
$ |
3,240,493 |
|
$ |
2,887,071 |
|
$ |
2,660,329 |
|
$ |
2,470,448 |
|
|
Gross profit |
|
|
542,826 |
|
|
474,590 |
|
|
399,904 |
|
|
325,342 |
|
|
280,552 |
|
|
Earnings before income taxes |
|
|
176,007 |
|
|
160,671 |
|
|
131,002 |
|
|
95,713 |
|
|
70,258 |
|
|
Net earnings attributable to controlling interest |
|
$ |
119,512 |
|
$ |
101,179 |
|
$ |
80,595 |
|
|
57,551 |
|
|
43,082 |
|
|
Diluted earnings per share |
|
$ |
1.94 |
|
$ |
1.65 |
|
$ |
1.33 |
|
$ |
0.95 |
|
$ |
0.72 |
|
|
Dividends per share |
|
$ |
0.320 |
|
$ |
0.290 |
|
$ |
0.273 |
|
$ |
0.203 |
|
$ |
0.137 |
|
|
Consolidated Balance Sheet Data |
|
|
|
|
|
|
|
|
|
|
|
|
|
|
|
|
|
Working capital(1) |
|
$ |
560,241 |
|
$ |
484,661 |
|
$ |
444,057 |
|
$ |
397,546 |
|
$ |
357,299 |
|
|
Total assets |
|
|
1,464,677 |
|
|
1,292,058 |
|
|
1,107,679 |
|
|
1,023,800 |
|
|
916,987 |
|
|
Total debt |
|
|
146,003 |
|
|
111,693 |
|
|
85,895 |
|
|
98,645 |
|
|
84,700 |
|
|
Shareholders’ equity |
|
|
974,023 |
|
|
860,466 |
|
|
766,409 |
|
|
699,560 |
|
|
649,734 |
|
|
Statistics |
|
|
|
|
|
|
|
|
|
|
|
|
|
|
|
|
|
Gross profit as a percentage of net sales |
|
|
13.8 |
% |
|
14.6 |
% |
|
13.9 |
% |
|
12.2 |
% |
|
11.4 |
% |
|
Net earnings attributable to controlling interest as a percentage of net sales |
|
|
3.0 |
% |
|
3.1 |
% |
|
2.8 |
% |
|
2.2 |
% |
|
1.7 |
% |
|
Return on beginning equity(2) |
|
|
13.9 |
% |
|
13.2 |
% |
|
11.5 |
% |
|
8.8 |
% |
|
7.1 |
% |
|
Current ratio(4) |
|
|
2.85 |
|
|
2.78 |
|
|
3.17 |
|
|
3.27 |
|
|
3.59 |
|
|
Debt to equity ratio(5) |
|
|
0.15 |
|
|
0.13 |
|
|
0.11 |
|
|
0.14 |
|
|
0.13 |
|
|
Book value per common share(3) |
|
$ |
15.92 |
|
$ |
14.10 |
|
$ |
12.68 |
|
$ |
11.67 |
|
$ |
10.86 |
|
(1)Current assets less current liabilities.
(2)Net earnings attributable to controlling interest divided by beginning shareholders’ equity.
(3)Shareholders’ equity divided by common stock outstanding.
(4)Current assets divided by current liabilities.
(5)Total debt divided by shareholders’ equity.
Acquisition growth is the primary contributing factor to material increases over the period from 2013 to 2017. Refer to Note C under the“Notes to the Consolidated Financial Statements” for further discussion on the Company’s business combinations and impact on financials.
2
UNIVERSAL FOREST PRODUCTS, INC.
MANAGEMENT’S DISCUSSION AND ANALYSIS OF
FINANCIAL CONDITION AND RESULTS OF OPERATIONS
Universal Forest Products, Inc. is a holding company with subsidiaries throughout North America, Europe, Asia, and in Australia that supply wood, wood composite and other products to three robust markets: retail, industrial, and construction. The Company is headquartered in Grand Rapids, Mich. For more information about Universal Forest Products, Inc., or its affiliated operations, go to www.ufpi.com.
This report contains forward-looking statements within the meaning of Section 21E of the Securities Exchange Act, as amended, that are based on management’s beliefs, assumptions, current expectations, estimates and projections about the markets we serve, the economy and the Company itself. Words like “anticipates,” “believes,” “confident,” “estimates,” “expects,” “forecasts,” “likely,” “plans,” “projects,” “should,” variations of such words, and similar expressions identify such forward-looking statements. These statements do not guarantee future performance and involve certain risks, uncertainties and assumptions that are difficult to predict with regard to timing, extent, likelihood and degree of occurrence. The Company does not undertake to update forward-looking statements to reflect facts, circumstances, events, or assumptions that occur after the date the forward-looking statements are made. Actual results could differ materially from those included in such forward-looking statements. Investors are cautioned that all forward-looking statements involve risks and uncertainty. Among the factors that could cause actual results to differ materially from forward-looking statements are the following: fluctuations in the price of lumber; adverse or unusual weather conditions; adverse economic conditions in the markets we serve; government regulations, particularly involving environmental and safety regulations; and our ability to make successful business acquisitions. Certain of these risk factors as well as other risk factors and additional information are included in the Company’s reports on Form 10‑K and 10‑Q on file with the Securities and Exchange Commission. We are pleased to present this overview of 2017.
OVERVIEW
Our results for 2017 were impacted by the following:
|
· |
Our sales increased almost 22% in 2017 due to a 15% increase in our unit sales and a 7% increase in overall selling prices (see “Historical Lumber Prices”). Our unit sales increased in all three of our markets - retail, industrial, and construction - and were driven by a combination of acquisition and organic growth. Overall, businesses we acquired contributed 11% to our unit sales growth in 2017 (see Note C of the Notes to Consolidated Financial Statements) and we achieved 4% organic unit sales growth. In 2016, we had 53 weeks in our fiscal year which contributed an additional $60 million of sales compared to 2017, which was a 52 week year (See Note A of the Notes to Consolidated Financial Statements). |
|
· |
The Home Improvement Research Institute reported a 5% increase in home improvement sales in 2017. Comparatively, our unit sales to the retail market increased 10% in 2017, including approximately 7% contributed from acquired businesses. |
|
· |
Our sales to the industrial market increased 35% in 2017. Businesses we acquired contributed 25% to unit sales growth. Comparatively, the Federal Reserve’s Industrial Production noted that national industrial production increased less than 1% in 2017. |
|
· |
National housing starts increased approximately 4% in the period from December 2016 through November 2017, compared to the same period of the prior year (our sales trail housing starts by about a month). Comparatively, our unit sales to residential construction customers increased 7% in 2017. |
|
· |
Production of HUD code manufactured homes were up 16% in the period from January through November 2017, compared to the same period of the prior year. Comparatively, our unit sales to the manufactured housing market increased 9% in 2017. |
3
UNIVERSAL FOREST PRODUCTS, INC.
MANAGEMENT’S DISCUSSION AND ANALYSIS OF
FINANCIAL CONDITION AND RESULTS OF OPERATIONS
|
· |
Our earnings from operations increased 10.4% to $181.5 million in 2017 from $164.4 million in 2016. Acquired businesses contributed $6.7 million to our increase, which was below our expectations primarily due to idX. The remaining $10.4 million, or 6.3%, increase was primarily driven by our organic unit sales growth and a decline in our incentive bonus expense due to a decrease in our return on investment which is a key performance metric for determining incentive bonus payments. |
|
· |
Finally, the Tax Act, as defined in Note K to our 2017 Annual Financial Statements, resulted in a $6.4 million decrease to our net deferred tax liability and income taxes in 2017. Excluding the impact of the Tax Act, our net earnings attributable to controlling interest was $113.1 million, compared to $101.2 million in 2016, an 11.8% increase. |
|
· |
Our cash flow from operating activities decreased to $137 million due to an increase in our investment in working capital resulting from higher year over year lumber prices in the fourth quarter of 2017 compared with the fourth quarter of 2016 as presented in the tables below. |
HISTORICAL LUMBER PRICES
The following table presents the Random Lengths framing lumber composite price.
|
|
|
Random Lengths Composite |
|
|||||||
|
|
|
Average $/MBF |
|
|||||||
|
|
|
2017 |
|
2016 |
|
2015 |
|
|||
|
January |
|
$ |
356 |
|
$ |
316 |
|
$ |
379 |
|
|
February |
|
|
393 |
|
|
310 |
|
|
361 |
|
|
March |
|
|
401 |
|
|
321 |
|
|
339 |
|
|
April |
|
|
424 |
|
|
345 |
|
|
334 |
|
|
May |
|
|
416 |
|
|
356 |
|
|
315 |
|
|
June |
|
|
399 |
|
|
353 |
|
|
328 |
|
|
July |
|
|
411 |
|
|
351 |
|
|
346 |
|
|
August |
|
|
417 |
|
|
367 |
|
|
327 |
|
|
September |
|
|
416 |
|
|
354 |
|
|
300 |
|
|
October |
|
|
437 |
|
|
356 |
|
|
308 |
|
|
November |
|
|
436 |
|
|
346 |
|
|
326 |
|
|
December |
|
|
433 |
|
|
357 |
|
|
314 |
|
|
|
|
|
|
|
|
|
|
|
|
|
|
Annual average |
|
$ |
412 |
|
$ |
344 |
|
$ |
331 |
|
|
Annual percentage change |
|
|
19.8 |
% |
|
3.9 |
% |
|
|
|
|
|
|
|
|
|
|
|
|
|
|
|
4
UNIVERSAL FOREST PRODUCTS, INC.
MANAGEMENT’S DISCUSSION AND ANALYSIS OF
FINANCIAL CONDITION AND RESULTS OF OPERATIONS
In addition, a Southern Yellow Pine (“SYP”) composite price, which we prepare and use, is presented below. Our purchases of this species comprises approximately 44% and 43% of total lumber purchases for 2017 and 2016, respectively.
|
|
|
Southern Yellow Pine |
|||||||
|
|
|
Average $/MBF |
|||||||
|
|
|
2017 |
|
2016 |
|
2015 |
|||
|
January |
|
$ |
397 |
|
$ |
358 |
|
$ |
411 |
|
February |
|
|
420 |
|
|
357 |
|
|
399 |
|
March |
|
|
433 |
|
|
366 |
|
|
393 |
|
April |
|
|
438 |
|
|
389 |
|
|
400 |
|
May |
|
|
416 |
|
|
397 |
|
|
368 |
|
June |
|
|
399 |
|
|
382 |
|
|
354 |
|
July |
|
|
381 |
|
|
380 |
|
|
344 |
|
August |
|
|
383 |
|
|
391 |
|
|
321 |
|
September |
|
|
387 |
|
|
375 |
|
|
290 |
|
October |
|
|
417 |
|
|
385 |
|
|
318 |
|
November |
|
|
412 |
|
|
387 |
|
|
348 |
|
December |
|
|
418 |
|
|
400 |
|
|
347 |
|
|
|
|
|
|
|
|
|
|
|
|
Annual average |
|
$ |
408 |
|
$ |
381 |
|
$ |
358 |
|
Annual percentage change |
|
|
7.1 |
% |
|
6.4 |
% |
|
|
|
|
|
|
|
|
|
|
|
|
|
The significant increases in lumber prices from 2016 to 2017 can primarily be attributed to the following factors:
|
· |
Duties on imported lumber from Canada - The U.S. Department of Commerce has preliminarily determined that subsidies are being provided to producers and exporters of certain softwood lumber products (softwood lumber) from Canada and duties are being assessed ranging from 7% to 23%. |
|
· |
Canadian Wildfires - In 2017, British Columbia experienced its worst wildfire season in history which impacted the producers and exporters of lumber products. |
|
· |
Hurricanes Irma and Harvey - Caused catastrophic damage in parts of the U.S. and the Caribbean. The necessity for lumber to prevent and repair hurricane damage resulted in a surge in lumber demand during the third and fourth quarters of 2017. |
IMPACT OF THE LUMBER MARKET ON OUR OPERATING RESULTS
We experience significant fluctuations in the cost of commodity lumber products from primary producers ("Lumber Market"). We generally price our products to pass lumber costs through to our customers so that our profitability is based on the value-added manufacturing, distribution, engineering, and other services we provide. As a result, our sales levels (and working capital requirements) are impacted by the lumber costs of our products. Lumber costs were 49.1%, 48.4%, and 48.9% of our gross sales in 2017, 2016, and 2015, respectively.
Our gross margins are impacted by (1) the relative level of the Lumber Market (i.e. whether prices are higher or lower from comparative periods), and (2) the trend in the market price of lumber (i.e. whether the price of lumber is increasing or decreasing within a period or from period to period). Moreover, as explained below, our products are priced differently. Some of our products have fixed selling prices, while the selling prices of other products are indexed to the reported
5
UNIVERSAL FOREST PRODUCTS, INC.
MANAGEMENT’S DISCUSSION AND ANALYSIS OF
FINANCIAL CONDITION AND RESULTS OF OPERATIONS
Lumber Market with a fixed dollar adder to cover conversion costs and profits. Consequently, the level and trend of the Lumber Market impact our products differently.
Below is a general description of the primary ways in which our products are priced.
|
· |
Products with fixed selling prices. These products include value-added products such as decking and fencing sold to retail building materials customers, as well as trusses, wall panels and other components sold to the residential construction market, and most industrial packaging products. Prices for these products are generally fixed at the time of the sales quotation for a specified period of time or are based upon a specific quantity. In order to maintain margins and reduce any exposure to adverse trends in the price of component lumber products, we attempt to lock in costs with our suppliers for these sales commitments. Also, the time period and quantity limitations generally allow us to eventually re-price our products for changes in lumber costs from our suppliers. |
|
· |
Products with selling prices indexed to the reported Lumber Market with a fixed dollar "adder" to cover conversion costs and profits. These products primarily include treated lumber, remanufactured lumber, and trusses sold to the manufactured housing industry. For these products, we estimate the customers’ needs and we carry anticipated levels of inventory. Because lumber costs are incurred in advance of final sale prices, subsequent increases or decreases in the market price of lumber impact our gross margins. For these products, our margins are exposed to changes in the trend of lumber prices. |
The greatest risk associated with changes in the trend of lumber prices is on the following products:
|
· |
Products with significant inventory levels with low turnover rates, whose selling prices are indexed to the Lumber Market. In other words, the longer the period of time these products remain in inventory, the greater the exposure to changes in the price of lumber. This would include treated lumber, which comprises approximately 19% of our total sales. This exposure is less significant with remanufactured lumber, trusses sold to the manufactured housing market, and other similar products, due to our higher rate of inventory turnover of these products. We attempt to mitigate the risk associated with treated lumber through vendor consignment inventory programs. (Please refer to the “Risk Factors” section of our annual report on form 10‑K, filed with the United States Securities and Exchange Commission.) |
|
· |
Products with fixed selling prices sold under long-term supply arrangements, particularly those involving multi-family construction projects. We attempt to mitigate this risk through our purchasing practices by locking in costs or including re-pricing triggers if lumber prices change in excess of an agreed upon percentage. |
In addition to the impact of the Lumber Market trends on gross margins, changes in the level of the market cause fluctuations in gross margins when comparing operating results from period to period. This is explained in the following example, which assumes the price of lumber has increased from period one to period two, with no changes in the trend within each period.
|
|
|
Period 1 |
|
Period 2 |
|
||
|
Lumber cost |
|
$ |
300 |
|
$ |
400 |
|
|
Conversion cost |
|
|
50 |
|
|
50 |
|
|
= Product cost |
|
|
350 |
|
|
450 |
|
|
Adder |
|
|
50 |
|
|
50 |
|
|
= Sell price |
|
$ |
400 |
|
$ |
500 |
|
|
Gross margin |
|
|
12.5 |
% |
|
10.0 |
% |
6
UNIVERSAL FOREST PRODUCTS, INC.
MANAGEMENT’S DISCUSSION AND ANALYSIS OF
FINANCIAL CONDITION AND RESULTS OF OPERATIONS
As is apparent from the preceding example, the level of lumber prices does not impact our overall profits but does impact our margins. Gross margins and operating margins are negatively impacted during periods of high lumber prices; conversely, we experience margin improvement when lumber prices are relatively low. As a result of this factor, we believe it is useful to compare our change in units shipped with our change in gross profits, operating profits, and selling, general, and administrative expenses as a method of evaluating our profitability and efficiency.
BUSINESS COMBINATIONS AND ASSET PURCHASES
We completed four business acquisitions during 2017 and six during 2016. The annual historical sales attributable to acquisitions in 2017 and 2016 were approximately $127 million and $362 million, respectively. These business combinations were not significant to our operating results individually or in aggregate, and thus pro forma results for 2017 and 2016 are not presented.
See Notes to Consolidated Financial Statements, Note C, "Business Combinations" for additional information.
RESULTS OF OPERATIONS
The following table presents, for the periods indicated, the components of our Consolidated Statements of Earnings as a percentage of net sales.
|
|
|
Year Ended |
|
||||
|
|
|
December 30, |
|
December 31, |
|
December 26, |
|
|
|
|
2017 |
|
2016 |
|
2015 |
|
|
Net sales |
|
100.0 |
% |
100.0 |
% |
100.0 |
% |
|
Cost of goods sold |
|
86.2 |
|
85.4 |
|
86.1 |
|
|
Gross profit |
|
13.8 |
|
14.6 |
|
13.9 |
|
|
Selling, general, and administrative expenses |
|
9.1 |
|
9.6 |
|
9.2 |
|
|
Earnings from operations |
|
4.6 |
|
5.1 |
|
4.7 |
|
|
Other expense (income), net |
|
0.1 |
|
0.1 |
|
0.2 |
|
|
Earnings before income taxes |
|
4.5 |
|
5.0 |
|
4.5 |
|
|
Income taxes |
|
1.3 |
|
1.7 |
|
1.6 |
|
|
Net earnings |
|
3.1 |
|
3.3 |
|
2.9 |
|
|
Less net earnings attributable to noncontrolling interest |
|
(0.1) |
|
(0.1) |
|
(0.2) |
|
|
Net earnings attributable to controlling interest |
|
3.0 |
% |
3.1 |
% |
2.8 |
% |
Note: Actual percentages are calculated and may not sum to total due to rounding.
GROSS SALES
We design, manufacture and market wood and wood-alternative products for national home centers and other retailers, structural lumber and other products for the manufactured housing industry, engineered wood components for residential and commercial construction, specialty wood packaging, components and packing materials for various industries, and customized interior fixtures used in a variety of retail stores, commercial and other structures. Our strategic long-term sales objectives include:
|
· |
Maximizing unit sales growth while achieving return on investment goals |
7
UNIVERSAL FOREST PRODUCTS, INC.
MANAGEMENT’S DISCUSSION AND ANALYSIS OF
FINANCIAL CONDITION AND RESULTS OF OPERATIONS
|
· |
Diversifying our end market sales mix by increasing sales of specialty wood packaging to industrial users, increasing our penetration of the concrete forming market, increasing our sales of engineered wood components for custom home, multi-family, military and light commercial construction, increasing our market share with independent retailers, and increasing our sales of customized interior fixtures used in a variety of markets. |
|
· |
Expanding geographically in our core businesses, domestically and internationally. |
|
· |
Increasing sales of "value-added" products, which primarily consist of fencing, decking, lattice, and other specialty products sold to the retail market, specialty wood packaging, engineered wood components, customized interior fixtures, and "wood alternative" products. Engineered wood components include roof trusses, wall panels, and floor systems. Wood alternative products consist primarily of composite wood and plastics. Although we consider the treatment of dimensional lumber with certain chemical preservatives a value-added process, treated lumber is not presently included in the value-added sales. |
|
· |
Developing new products and expanding our product offering for existing customers. New product sales were $418.4 million in 2017, $338.6 million in 2016, and $298.0 million in 2015 and are presented by market in the table below (in thousands). |
|
|
|
New Product Sales by Market |
|||||||
|
|
|
Twelve Months Ended |
|||||||
|
|
|
December 30, |
|
December 31, |
|
December 26, |
|||
|
Market Classification |
|
2017 |
|
2016 |
|
2015 |
|||
|
Retail |
|
$ |
241,009 |
|
$ |
191,619 |
|
$ |
167,938 |
|
Industrial |
|
|
109,892 |
|
|
97,718 |
|
|
77,723 |
|
Construction |
|
|
67,536 |
|
|
49,290 |
|
|
52,378 |
|
Total New Product Sales |
|
|
418,437 |
|
|
338,627 |
|
|
298,039 |
Note: Certain prior year product reclassifications resulted in a decrease and increase in new product sales in 2016 and 2015, respectively.
The following table presents, for the periods indicated, our gross sales (in thousands) and percentage change in gross sales by market classification.
|
|
Year Ended |
|||||||||||
|
|
December 30, |
|
% |
|
December 31, |
|
% |
|
December 26, |
|||
|
Market Classification |
2017 |
|
Change |
|
2016 |
|
Change |
|
2015 |
|||
|
Retail |
$ |
1,493,366 |
|
15.4 |
|
$ |
1,294,273 |
|
13.8 |
|
$ |
1,137,109 |
|
Industrial |
|
1,334,082 |
|
35.4 |
|
|
984,968 |
|
10.6 |
|
|
890,179 |
|
Construction |
|
1,178,755 |
|
15.8 |
|
|
1,018,136 |
|
12.5 |
|
|
905,193 |
|
Total Gross Sales |
|
4,006,203 |
|
21.5 |
|
|
3,297,377 |
|
12.4 |
|
|
2,932,481 |
|
Sales Allowances |
|
(65,021) |
|
14.3 |
|
|
(56,884) |
|
25.3 |
|
|
(45,410) |
|
Total Net Sales |
$ |
3,941,182 |
|
21.6 |
|
$ |
3,240,493 |
|
12.2 |
|
$ |
2,887,071 |
Note: During 2017, certain customers were reclassified to a different market. Prior year information has been restated to reflect these changes.
8
UNIVERSAL FOREST PRODUCTS, INC.
MANAGEMENT’S DISCUSSION AND ANALYSIS OF
FINANCIAL CONDITION AND RESULTS OF OPERATIONS
The following table presents estimates, for the periods indicated, of our percentage change in gross sales which were attributable to changes in overall selling prices versus changes in units shipped.
|
|
|
% Change |
|
||||
|
|
|
in Sales |
|
in Selling Prices |
|
in Units |
|
|
2017 versus 2016 |
|
21.5 |
% |
6.6 |
% |
14.9 |
% |
|
2016 versus 2015 |
|
12.4 |
% |
1.2 |
% |
11.2 |
% |
|
2015 versus 2014 |
|
8.5 |
% |
(3.0) |
% |
11.5 |
% |
Retail:
Gross sales to the retail market increased over 15% in 2017 compared to 2016 due to a 10% increase in unit sales and a 5% increase in selling prices. Within this market, sales to our big box customers increased 16% while our sales to other retailers increased 14%. Businesses we acquired contributed 7% to our growth, while new products contributed to our 3% organic unit sales growth. Comparatively, our large retail customers reported year over year same store sales growth of approximately 8% during the first nine months of 2017, the latest information available to us.
Gross sales to the retail market increased almost 14% in 2016 compared to 2015 due to a 10% increase in unit sales and a 4% increase in selling prices. Within this market, sales to our big box customers increased 17% while our sales to other retailers increased 10%. Our increase in unit sales primarily consisted of organic growth achieved through a combination of share gains in existing product lines with certain retailers, an improvement in consumer demand, and growth in our new product sales. Our large retail customers reported year over year same store sales growth of approximately 6% during 2016.
See Notes to Consolidated Financial Statements, Note C, "Business Combinations" for additional information concerning acquired businesses.
Industrial:
Gross sales to the industrial market increased 35% in 2017 compared to 2016, resulting from a 29% increase in overall unit sales and a 6% increase in selling prices. Businesses we acquired contributed 25% to our growth in unit sales. Our organic unit sales growth of 4% was primarily achieved through share gains including adding 390 new customers during the year and increasing the number of locations we serve of existing customers by 142 new stores.
Gross sales to the industrial market increased 11% in 2016 compared to 2015, resulting from a 13% increase in overall unit sales, offset by a 2% decrease in selling prices. Businesses we acquired contributed 10% to our growth in unit sales. Our organic growth in unit sales was 3% as a result of share gains achieved by adding 191 new customers during the year and increasing the number of locations we serve certain large customers. We believe overall market demand decreased in 2016 due, in part, to the strong U.S. dollar which impacted our customers with export sales.
See Notes to Consolidated Financial Statements, Note C, "Business Combinations" for additional information concerning acquired businesses.
Construction:
Gross sales to the construction market increased almost 16% in 2017 compared to 2016, due to a unit sales increase of 7% and a 9% increase in selling prices. Unit sales increased due to a 7% increase in units shipped to residential construction customers and a 9% increase in shipments to manufactured housing customers while unit sales to commercial construction customers remained flat. Businesses we acquired in 2017 contributed 1% to unit sales growth. Comparatively, the
9
UNIVERSAL FOREST PRODUCTS, INC.
MANAGEMENT’S DISCUSSION AND ANALYSIS OF
FINANCIAL CONDITION AND RESULTS OF OPERATIONS
Mortgage Bankers Association of America reported year over year national housing starts increased 4%, the commercial construction market increased 3% and the National Association of Home Builders reported industry production of HUD-code homes increased over 15%.
Gross sales to the construction market increased over 12% in 2016 compared to 2015, due to a unit sales increase of 11% and a 1% increase in selling prices. Unit sales increased due to a 17% increase in units shipped to residential construction customers, a 10% increase in shipments to commercial construction customers, and a 5% increase in shipments to manufactured housing customers. Businesses we acquired in 2016 contributed 2% in unit sales growth to manufactured housing customers. Comparatively, the Mortgage Bankers Association of America reported year over year national housing starts increased 5%, the commercial construction market increased 5%, the National Association of Home Builders reported industry production of HUD-code homes increased 14%, and modular home starts decreased 1% in 2016 (the last period reported). The increases in our sales to residential and commercial construction above nationally recognized market data are primarily due to a combination of increased demand and market share in certain areas of our geographic footprint. Our growth in the manufactured housing market was less than the national average, which was primarily due to a reduction in market share resulting from the loss of certain customers.
Value-Added and Commodity-Based Sales:
The following table presents, for the periods indicated, our percentage of value-added and commodity-based sales to total sales. Value-added products generally carry higher gross margins than our commodity-based products.
|
|
|
Value-Added |
|
Commodity-Based |
|
||
|
2017 |
|
|
63.3 |
% |
|
36.7 |
% |
|
2016 |
|
|
62.6 |
% |
|
37.4 |
% |
|
2015 |
|
|
59.8 |
% |
|
40.2 |
% |
COST OF GOODS SOLD AND GROSS PROFIT
Our gross profit percentage decreased from 14.6% in 2016 to 13.8% in 2017 due, in part, to the high level of lumber prices. This is evident when comparing our increase in gross profits with our increase in units shipped. Our gross profit dollars increased by over $68 million, or 14%, which is slightly below our 15% increase in unit sales. Our profitability in 2017 was impacted by the following factors:
|
· |
Approximately $8 million, a 5% increase in our gross profit in the retail market, was attributable to our growth in unit sales to that market. Businesses we acquired in 2017 contributed $1.6 million of this increase. Our increase in gross profit was less than our increase in unit sales as a result of (1) Lumber Market volatility, particularly in the second quarter which is our primary selling season, and (2) the acquisition of Robbins in the first quarter of 2017, which primarily sells lower margin treated lumber products. |
|
· |
Our growth in unit sales to the industrial market resulted in a $34 million, or 20%, increase in our gross profit, which was due primarily to businesses we acquired in 2017 and 2016. Our increase in gross profit was less than our increase in unit sales primarily due to the impact of higher lumber prices on our products sold with fixed selling prices. |
|
· |
Almost $13 million, or 9%, of our gross profit improvement was due to growth in sales to the residential construction and manufactured housing markets. Our gross profit increase exceeded our increase in unit sales |
10
UNIVERSAL FOREST PRODUCTS, INC.
MANAGEMENT’S DISCUSSION AND ANALYSIS OF
FINANCIAL CONDITION AND RESULTS OF OPERATIONS
primarily due to leveraging our fixed manufacturing costs, which helped offset the impact of Lumber Market volatility and higher labor rates and benefit costs. |
|
· |
The remaining $13 million increase in our gross profit was due to a variety of factors including favorable labor and overhead cost variances, increases in vendor rebates, and a decrease in customer rebates compared to 2017. |
Our gross profit percentage increased from 13.9% in 2015 to 14.6% in 2016. Additionally, our gross profit dollars increased by over $75 million, or 19%, which exceeded our 11% increase in unit sales. The improvement in our profitability in 2016 is attributable to the following factors:
|
· |
Approximately $38 million of the increase was attributable to our growth in unit sales to the retail market and an improvement in margin on those sales. New product sales, effective inventory positioning leading to lower lumber costs, and the favorable impact of selling into a rising lumber market on variable priced products contributed to our margin improvement. |
|
· |
Our growth in unit sales to the industrial market and margin improvement on those sales for most of the year resulted in a $22 million improvement in our gross profit. Businesses we acquired in 2016 contributed $16 million to this increase. The gross margin improvement was attributable to a favorable improvement in our product sales mix of more value-added products. |
|
· |
Almost $16 million of our gross profit improvement was due to growth in sales to the residential construction, commercial construction, and manufactured housing markets as our gross margins remained relatively flat. |
SELLING, GENERAL, AND ADMINISTRATIVE EXPENSES
Selling, general and administrative ("SG&A") expenses increased by approximately $52.1 million, or 16.7%, in 2017 compared to 2016, while we reported a 15% increase in unit sales. Acquired businesses contributed $41.0 million to our increase. The remaining increase in SG&A was primarily due to a $11.1 million increase in compensation and related costs resulting from annual raises, greater benefit costs, and hiring additional personnel to support sales growth. Our annual incentive bonus expense was almost $44 million compared to $45 million last year. This decrease, in spite of an increase in profits, was due to a decline in our return on investment, a key performance metric for determining incentive compensation bonus payments.
Selling, general and administrative ("SG&A") expenses increased by approximately $45.9 million, or 17%, in 2016 compared to 2015, while we reported an 11% increase in unit sales. Acquired businesses contributed $17 million to this increase. The remaining increase in SG&A was primarily due to an $11 million increase in compensation and benefit costs resulting from annual raises, other cost increases, and hiring additional personnel to support sales growth, and a $14 million increase in incentive compensation expense tied to our return on investment.
INTEREST, NET
Net interest costs were higher in 2017 compared to 2016, due to a higher outstanding balance on our revolving line of credit throughout 2017 as well as an increase in the borrowing rate on our revolving credit facility which is tied to LIBOR.
Net interest costs were lower in 2016 compared to 2015, due to a lower outstanding balance on our revolving line of credit throughout 2016.
11
UNIVERSAL FOREST PRODUCTS, INC.
MANAGEMENT’S DISCUSSION AND ANALYSIS OF
FINANCIAL CONDITION AND RESULTS OF OPERATIONS
INCOME TAXES
Effective tax rates differ from statutory federal income tax rates, primarily due to provisions for state and local income taxes, permanent tax differences, and the impact of the Tax Act in the U.S. Our effective tax rate decreased to 29.5% in 2017 compared to 34.3% in 2016. The decrease in the 2017 tax rate is primarily due to the impact of the Tax Act, which resulted in a $6.4 million reduction in our net deferred tax liability at the end of December 2017. The remaining decrease was due to increases in tax credits and permanent tax differences.
Our effective tax rate decreased to 34.3% in 2016 compared to 35.0% in 2015. The decrease in the 2016 tax rate is primarily due to a reduction in our estimated state tax rate.
SEGMENT REPORTING
The following tables present, for the periods indicated, our net sales and earnings from operations by reportable segment (in thousands).
|
|
|
Net Sales |
|
|||||||||||
|
|
|
December 30, |
|
December 31, |
|
December 26, |
|
|
|
|
|
|||
|
|
|
2017 |
|
2016 |
|
2015 |
|
2017 vs 2016 |
|
2016 vs 2015 |
|
|||
|
North |
|
$ |
1,133,656 |
|
$ |
1,000,426 |
|
$ |
922,092 |
|
13.3 |
% |
8.5 |
% |
|
South |
|
|
837,370 |
|
|
711,862 |
|
|
656,550 |
|
17.6 |
|
8.4 |
|
|
West |
|
|
1,417,924 |
|
|
1,251,093 |
|
|
1,133,398 |
|
13.3 |
|
10.4 |
|
|
All Other |
|
|
552,232 |
|
|
277,112 |
|
|
175,031 |
|
99.3 |
|
58.3 |
|
|
Total |
|
$ |
3,941,182 |
|
$ |
3,240,493 |
|
$ |
2,887,071 |
|
21.6 |
% |
12.2 |
% |
|
|
|
Earnings from Operations |
|
|||||||||||
|
|
|
December 30, |
|
December 31, |
|
December 26, |
|
|
|
|
|
|||
|
|
|
2017 |
|
2016 |
|
2015 |
|
2017 vs 2016 |
|
2016 vs 2015 |
|
|||
|
North |
|
$ |
61,326 |
|
$ |
59,408 |
|
$ |
53,879 |
|
3.2 |
% |
10.3 |
% |
|
South |
|
|
46,646 |
|
|
47,146 |
|
|
30,740 |
|
(1.1) |
|
53.4 |
|
|
West |
|
|
82,465 |
|
|
76,875 |
|
|
70,220 |
|
7.3 |
|
9.5 |
|
|
All Other |
|
|
17,296 |
|
|
16,639 |
|
|
3,038 |
|
3.9 |
|
447.7 |
|
|
Corporate1 |
|
|
(26,264) |
|
|
(35,630) |
|
|
(22,410) |
|
26.3 |
|
(59.0) |
|
|
Total |
|
$ |
181,469 |
|
$ |
164,438 |
|
$ |
135,467 |
|
10.4 |
|
21.4 |
% |
|
1. |
Corporate primarily represents over (under) allocated administrative costs and certain incentive compensation expense. |
North
|
|
|
|
|||||||||||
|
|
|
Net Sales of North Segment by Market |
|||||||||||
|
|
|
Twelve Months Ended |
|||||||||||
|
|
|
December 30, |
|
December 31, |
|
December 26, |
|
% Change |
|
% Change |
|||
|
Market Classification |
|
2017 |
|
2016 |
|
2015 |
|
2017 vs 2016 |
|
2016 vs 2015 |
|||
|
Retail |
|
$ |
488,871 |
|
$ |
467,619 |
|
$ |
416,635 |
|
4.5 |
|
12.2 |
|
Industrial |
|
|
157,365 |
|
|
115,889 |
|
|
118,315 |
|
35.8 |
|
(2.1) |
|
Construction |
|
|
510,810 |
|
|
436,928 |
|
|
403,183 |
|
16.9 |
|
8.4 |
|
Total Gross Sales |
|
|
1,157,046 |
|
|
1,020,436 |
|
|
938,133 |
|
13.4 |
|
8.8 |
|
Sales Allowances |
|
|
(23,390) |
|
|
(20,010) |
|
|
(16,041) |
|
16.9 |
|
24.7 |
|
Total Net Sales |
|
$ |
1,133,656 |
|
$ |
1,000,426 |
|
$ |
922,092 |
|
13.3 |
|
8.5 |
12
UNIVERSAL FOREST PRODUCTS, INC.
MANAGEMENT’S DISCUSSION AND ANALYSIS OF
FINANCIAL CONDITION AND RESULTS OF OPERATIONS
Net sales attributable to the North reportable segment increased by $133 million, or 13.3%, in 2017, due primarily to the following factors:
|
· |
Acquired operations contributed over $29 million to our growth in sales to the industrial market. |
|
· |
Higher lumber prices resulted in an increase in our selling prices. |
|
· |
Organic unit sales growth to the industrial and construction markets was offset slightly by a decrease in unit sales to the retail market due to a reduction in demand from certain customers. |
Earnings from operations for the North reportable segment increased in 2017 by $1.9 million, or 3.2%, due to an increase in gross profit of $9.2 million, offset by a $7.3 million increase in SG&A expenses compared to last year. Acquired operations contributed $1.5 million to our operating profits in 2017. Gross profits and SG&A were impacted by the same factors discussed under “Cost of Goods Sold and Gross Profit” and “Selling, General, and Administrative Expenses.”
Net sales attributable to the North reportable segment increased by 8.5% in 2016, due to increases in sales to our retail and residential construction markets, offset by a decrease in sales to our industrial customers as a result of the same factors discussed under "Gross Sales".
Earnings from operations for the North reportable segment increased in 2016 by $5.5 million, or 10.3%, due to an increase in gross profit of $13.6 million, offset by an $8.1 million increase in SG&A expenses compared to the prior year. Additionally, margin improvements were achieved on sales to the retail and industrial markets due to a more favorable product sales mix focused on value-added products.
South
|
|
|
|
|||||||||||
|
|
|
Net Sales of South Segment by Market |
|||||||||||
|
|
|
Twelve Months Ended |
|||||||||||
|
|
|
December 30, |
|
December 31, |
|
December 26, |
|
% Change |
|
% Change |
|||
|
Market Classification |
|
2017 |
|
2016 |
|
2015 |
|
2017 vs 2016 |
|
2016 vs 2015 |
|||
|
Retail |
|
$ |
388,784 |
|
$ |
317,242 |
|
$ |
288,442 |
|
22.6 |
|
10.0 |
|
Industrial |
|
|
271,005 |
|
|
246,849 |
|
|
244,380 |
|
9.8 |
|
1.0 |
|
Construction |
|
|
196,471 |
|
|
161,999 |
|
|
135,512 |
|
21.3 |
|
19.5 |
|
Total Gross Sales |
|
|
856,260 |
|
|
726,090 |
|
|
668,334 |
|
17.9 |
|
8.6 |
|
Sales Allowances |
|
|
(18,890) |
|
|
(14,228) |
|
|
(11,784) |
|
32.8 |
|
20.7 |
|
Total Net Sales |
|
$ |
837,370 |
|
$ |
711,862 |
|
$ |
656,550 |
|
17.6 |
|
8.4 |
Net sales attributable to the South reportable segment increased by $125 million, or 17.6%, in 2017, primarily due to the following factors:
|
· |
Acquired operations contributed $88.4 million, $5.0 million, and $6.1 million to our retail, industrial, and construction markets, respectively. |
|
· |
Higher lumber prices increased our selling prices. |
13
UNIVERSAL FOREST PRODUCTS, INC.
MANAGEMENT’S DISCUSSION AND ANALYSIS OF
FINANCIAL CONDITION AND RESULTS OF OPERATIONS
|
· |
Organic unit sales growth to the construction and industrial markets was offset by a decline in unit sales to the retail market as a result of transferring our import and export business to our International segment and management team. Our International segment was formed, among other reasons, to gain efficiencies by consolidating our international business into one unit. |
Earnings from operations for the South reportable segment decreased in 2017 by $0.5 million, or 1.1%, as the increase in gross profit of $3.9 million was more than offset by a $4.4 million increase in SG&A expenses compared to last year. Acquired operations contributed $3.5 million to our operating profits in 2017. Our decline in profitability was due to customer attrition in our East Central and Southeast regions.
Net sales attributable to the South reportable segment increased by 8.4% in 2016, primarily due to an increase in sales to our retail and manufactured housing customers, as a result of the same factors discussed under "Gross Sales".
Earnings from operations for the South reportable segment increased in 2016 by $16.4 million, or 53.4%, due to an increase in gross profit of $17.9 million, offset by a $1.5 million increase in SG&A expenses compared to the prior year. Additionally, we achieved margin improvements primarily due to improvements in our sales mix of more value-added products and the closure of certain under-performing operations.
West
|
|
|
|
|||||||||||
|
|
|
Net Sales of West Segment by Market |
|||||||||||
|
|
|
Twelve Months Ended |
|||||||||||
|
|
|
December 30, |
|
December 31, |
|
December 26, |
|
% Change |
|
% Change |
|||
|
Market Classification |
|
2017 |
|
2016 |
|
2015 |
|
2017 vs 2016 |
|
2016 vs 2015 |
|||
|
Retail |
|
$ |
439,667 |
|
$ |
382,117 |
|
$ |
322,215 |
|
15.1 |
|
18.6 |
|
Industrial |
|
|
524,819 |
|
|
466,209 |
|
|
458,202 |
|
12.6 |
|
1.7 |
|
Construction |
|
|
470,773 |
|
|
419,205 |
|
|
366,483 |
|
12.3 |
|
14.4 |
|
Total Gross Sales |
|
|
1,435,259 |
|
|
1,267,531 |
|
|
1,146,900 |
|
13.2 |
|
10.5 |
|
Sales Allowances |
|
|
(17,335) |
|
|
(16,438) |
|
|
(13,502) |
|
5.5 |
|
21.7 |
|
Total Net Sales |
|
$ |
1,417,924 |
|
$ |
1,251,093 |
|
$ |
1,133,398 |
|
13.3 |
|
10.4 |
Net sales of the West reportable segment increased by $167 million, or 13.3%, in 2017, primarily due to the following factors:
|
· |
Acquired operations contributed $4.9 million, $3.2 million, and $6.8 million to our retail, industrial, and construction markets, respectively. |
|
· |
Higher lumber prices increased our selling prices. |
|
· |
Organic unit sales growth in each of our markets due to the factors discussed under “Gross Sales”. |
Earnings from operations for the West reportable segment increased in 2017 by $5.6 million, or 7.3%, due to an increase in gross profit of $12.1 million, offset by a $6.5 million increase in SG&A expenses compared to last year due to the same factors discussed under “Cost of Goods Sold and Gross Profit” and “Selling, General, and Administrative Expenses.”
14
UNIVERSAL FOREST PRODUCTS, INC.
MANAGEMENT’S DISCUSSION AND ANALYSIS OF
FINANCIAL CONDITION AND RESULTS OF OPERATIONS
Net sales of the West reportable segment increased by 10.4% in 2016, primarily due to an increase in sales to the retail and construction markets, as a result of the same factors discussed under "Gross Sales". Additionally, newly acquired businesses contributed $11.3 million in gross sales to the retail and construction markets in 2016.
Earnings from operations for the West reportable segment increased in 2016 by $6.7 million, or 9.5%, due to an increase in gross profit of $15.1 million, offset by a $8.4 million increase in SG&A expenses compared to the prior year. Our margins increased due to an improvement in our sales mix of value-added products.
All Other
|
|
|
|
|||||||||||
|
|
|
Net Sales of All Other Segment by Market |
|||||||||||
|
|
|
Twelve Months Ended |
|||||||||||
|
|
|
December 30, |
|
December 31, |
|
December 26, |
|
% Change |
|
% Change |
|||
|
Market Classification |
|
2017 |
|
2016 |
|
2015 |
|
2017 vs 2016 |
|
2016 vs 2015 |
|||
|
Retail |
|
$ |
176,043 |
|
$ |
127,294 |
|
$ |
109,818 |
|
38.3 |
|
15.9 |
|
Industrial |
|
|
380,892 |
|
|
156,022 |
|
|
69,282 |
|
144.1 |
|
125.2 |
|
Construction |
|
|
289 |
|
|
3 |
|
|
12 |
|
9,533.3 |
|
(75.0) |
|
Total Gross Sales |
|
|
557,224 |
|
|
283,319 |
|
|
179,112 |
|
96.7 |
|
58.2 |
|
Sales Allowances |
|
|
(4,992) |
|
|
(6,207) |
|
|
(4,081) |
|
(19.6) |
|
52.1 |
|
Total Net Sales |
|
$ |
552,232 |
|
$ |
277,112 |
|
$ |
175,031 |
|
99.3 |
|
58.3 |
Note that prior years have been restated to reflect the reclassification of captive insurance external revenue from the sales allowances line item into the industrial market. We believe these amounts to be immaterial to the financial statements.
Our All Other reportable segment consists of our Alternative Materials, International, idX, and certain other segments which are not significant.
Net sales of all other segments increased $275.1 million, or 99.3%, in 2017 primarily due to:
|
· |
Acquired operations, including idX, contributed $196 million to our sales growth to the industrial market. Additionally, the Mexico reporting unit of our international segment increased its sales to the industrial market. |
|
· |
Our increase in sales to the retail market was due to the transfer of our import and export business into our international segment. |
Earnings from operations for the All Other reportable segment increased in 2017 by $0.7 million, or 3.9%, due to an increase in gross profit of $46.5 million, offset by a $45.8 million increase in SG&A expenses compared to last year. Acquired operations increased earnings from operations by $1.7 million in 2017.
Net sales of all other segments increased $102.1 million, or 58.3%, in 2016 primarily due to:
|
· |
The idX acquisition on September 16, 2016, which contributed $87.0 million in sales to the industrial market. |
|
· |
An increase in sales by our Alternative Materials operations, primarily due to an increase in market share with certain Big Box retailers. |
Earnings from operations for the All Other reportable segment increased in 2016 by $13.6 million, or 448%, due to an increase in gross profit of $23.9 million, offset by a $10.3 million increase in SG&A expenses compared to the prior year.
15
UNIVERSAL FOREST PRODUCTS, INC.
MANAGEMENT’S DISCUSSION AND ANALYSIS OF
FINANCIAL CONDITION AND RESULTS OF OPERATIONS
The increase was primarily due to the idX acquisition’s contribution during the fourth quarter of 2016 and sales growth and operational improvements of our Alternative Materials operations and to a lesser extent the performance of our captive insurance subsidiary, Ardellis.
OFF-BALANCE SHEET COMMITMENTS AND CONTRACTUAL OBLIGATIONS
We have no significant off-balance sheet commitments other than operating leases. The following table summarizes our contractual obligations as of December 30, 2017 (in thousands).
|
|
|
Payments Due by Period |
|||||||||||||
|
|
|
Less than |
|
1 – 3 |
|
3 – 5 |
|
After |
|
|
|
||||
|
Contractual Obligation |
|
1 Year |
|
Years |
|
Years |
|
5 Years |
|
Total |
|||||
|
Long-term debt and capital lease obligations |
|
$ |
1,290 |
|
$ |
62,575 |
|
$ |
38,878 |
|
$ |
43,260 |
|
$ |
146,003 |
|
Estimated interest on long-term debt and capital lease obligations |
|
|
5,239 |
|
|
8,161 |
|
|
6,174 |
|
|
3,393 |
|
|
22,967 |
|
Operating leases |
|
|
19,405 |
|
|
23,154 |
|
|
13,725 |
|
|
17,640 |
|
|
73,924 |
|
Capital project purchase obligations |
|
|
7,743 |
|
|
— |
|
|
— |
|
|
— |
|
|
7,743 |
|
Total |
|
$ |
33,677 |
|
$ |
93,890 |
|
$ |
58,777 |
|
$ |
64,293 |
|
$ |
250,637 |
As of December 30, 2017, we also had $26.5 million in outstanding letters of credit issued during the normal course of business, as required by some vendor contracts.
LIQUIDITY AND CAPITAL RESOURCES
The table below presents, for the periods indicated, a summary of our cash flow statement (in thousands):
|
|
|
December 30, |
|
December 31, |
|
December 26, |
|||
|
|
|
2017 |
|
2016 |
|
2015 |
|||
|
Cash from operating activities |
|
|
136,583 |
|
|
172,520 |
|
|
168,796 |
|
Cash used in investing activities |
|
|
(137,659) |
|
|
(227,657) |
|
|
(46,636) |
|
Cash from (used in) financing activities |
|
|
(5,247) |
|
|
3,211 |
|
|
(33,002) |
|
Effect of exchange rate changes on cash |
|
|
650 |
|
|
(1,927) |
|
|
(1,221) |
|
Net change in cash and cash equivalents |
|
|
(5,673) |
|
|
(53,853) |
|
|
87,937 |
|
Cash, cash equivalents, and restricted cash, beginning of year |
|
|
34,489 |
|
|
88,342 |
|
|
405 |
|
Cash, cash equivalents, and restricted cash, end of year |
|
$ |
28,816 |
|
$ |
34,489 |
|
$ |
88,342 |
In general, we financed our growth in the past through a combination of operating cash flows, our revolving credit facility, industrial development bonds (when circumstances permit), and issuance of long-term notes payable at times when interest rates are favorable. We have not issued equity to finance growth except in the case of a large acquisition. We manage our capital structure by attempting to maintain a targeted ratio of debt to equity and debt to earnings before interest, taxes, depreciation and amortization. We believe these financial ratios are among many other important factors to maintaining a strong credit profile, which in turn helps ensure timely access to capital when needed.
Seasonality has a significant impact on our working capital due to our primary selling season which occurs during the period from March to August. Consequently, our working capital increases during our first and second quarter resulting in negative or modest cash flows from operations during those periods. Conversely, we experience a substantial decrease in working capital once we move beyond our peak selling season which typically results in significant cash flows from operations in our third and fourth quarters.
16
UNIVERSAL FOREST PRODUCTS, INC.
MANAGEMENT’S DISCUSSION AND ANALYSIS OF
FINANCIAL CONDITION AND RESULTS OF OPERATIONS
Due to the seasonality of our business and the effects of the Lumber Market, we believe our cash cycle (days of sales outstanding plus days supply of inventory less days payables outstanding) is a good indicator of our working capital management. As indicated in the table below, our cash cycle increased to 52 days in 2017 from 48 days in 2016.
|
|
|
Twelve Months Ended |
|||||||
|
|
|
December 30, |
|
December 31, |
|
December 26, |
|||
|
|
|
2017 |
|
2016 |
|
2015 |
|||
|
Days of sales outstanding |
|
|
31 |
|
|
31 |
|
|
31 |
|
Days supply of inventory |
|
|
41 |
|
|
38 |
|
|
43 |
|
Days payables outstanding |
|
|
(20) |
|
|
(21) |
|
|
(21) |
|
Days in cash cycle |
|
|
52 |
|
|
48 |
|
|
53 |
The increase in our days’ supply of inventory was due to idX as its business requires a higher investment in inventory due to the long project lead time of its customers.
Our cash flows from operating activities in 2017 was $136.6 million, which was comprised of net earnings of $124.0 million and $47.7 million of non-cash expenses, offset by a $35.1 million increase in working capital since the end of December 2016. Comparatively, cash generated from operating activities was approximately $172.5 million in 2016, which was comprised of net earnings of $105.5 million, $48.2 million of non-cash expenses, and an $18.8 million decrease in working capital since the end of 2015.
Our cash used in investing activities during 2017 was $137.7 million, which was comprised primarily of purchases of property, plant, and equipment totaling $71.1 million and business acquisitions totaling $60.6 million. The increase in our capital expenditures in 2017 is primarily due to the additional requirements of our recently acquired operations and an increase in our “expansionary and efficiency” capital expenditures tied to initiatives including new products, value-added product capacity expansion, and automation. Outstanding purchase commitments on existing capital projects totaled approximately $7.7 million on December 30, 2017. The sale and purchase of investments totaling $5.1 million and $13.5 million, respectively, are due to investment activity in our captive insurance subsidiary.
In 2016, investments in business acquisitions comprised most of our cash used in investing activities and totaled $172.9 million (which includes $92.8 million paid to retire all of idX's debt and certain other obligations on the acquisition date). Purchases of property, plant, and equipment totaled $53.8 million. Outstanding purchase commitments on existing capital projects totaled approximately $10.1 million on December 31, 2016.
Cash flows from financing activities primarily consisted of net borrowings under our revolving credit facility of approximately $35.6 million, offset by $19.6 million in dividend payments. We paid a dividend in June at $0.15 per share and December at $0.17 per share after considering the impact of our 3 for 1 stock split on November 14, 2017. Additionally, we had approximately $13.0 million in stock repurchases. Comparatively in 2016, cash flows from financing activities primarily consisted of net borrowings under our revolving credit facility of approximately $23.7 million, offset by $17.7 million in dividend payments.
On December 30, 2017, we had $59.4 million outstanding on our $295 million revolving credit facility. The revolving credit facility also supports letters of credit totaling approximately $9.8 million on December 30, 2017. As a result, we have approximately $226 million in remaining availability on our revolver. Additionally, we have $150 million in availability under a "shelf agreement" for long term debt with a current lender. Financial covenants on the unsecured revolving credit facility and unsecured notes include minimum interest tests and a maximum leverage ratio. The agreements also restrict the amount of additional indebtedness we may incur and the amount of assets which may be sold. We were in compliance with all our covenant requirements on December 30, 2017.
17
UNIVERSAL FOREST PRODUCTS, INC.
MANAGEMENT’S DISCUSSION AND ANALYSIS OF
FINANCIAL CONDITION AND RESULTS OF OPERATIONS
ENVIRONMENTAL CONSIDERATIONS AND REGULATIONS
See Notes to Consolidated Financial Statements, Note M, “Commitments, Contingencies, and Guarantees”.
CRITICAL ACCOUNTING POLICIES
In preparing our consolidated financial statements, we follow accounting principles generally accepted in the United States. These principles require us to make certain estimates and apply judgments that affect our financial position and results of operations. We continually review our accounting policies and financial information disclosures. Following is a summary of our more significant accounting policies that require the use of estimates and judgments in preparing the financial statements.
ACCOUNTS RECEIVABLE ALLOWANCES
We record provisions against gross revenues for estimated returns and cash discounts in the period when the related revenue is recorded. These estimates are based on factors that include, but are not limited to, historical discounts taken, analysis of credit memorandums activity, and customer demand. We also evaluate the allowance for uncollectible accounts receivable and discounts based on historical collection experience and specific identification of other potential problems, including the economic climate. Actual collections can differ, requiring adjustments to the allowances.
LONG-LIVED ASSETS AND GOODWILL
We evaluate long-lived assets for indicators of impairment when events or circumstances indicate that this risk may be present. Our judgments regarding the existence of impairment are based on market conditions, operational performance and estimated future cash flows. As a result of favorable factors in each of these areas combined with substantial excess equity value over carrying value from the prior year analysis, management has determined that the carryforward method is appropriate to use with the exception of the idX and Australian reporting units where a more in-depth analysis was completed. The discounted cash flow analysis, from prior years, uses the following assumption: a business is worth today what it can generate in future cash flows; cash received today is worth more than an equal amount of cash received in the future; and future cash flows can be reasonably estimated. The discounted cash flow analysis is based on the present value of projected cash flows and residual values.
As our annual testing date of October 1, 2017, based on the carryforward method and the analysis, the fair values would exceed the carrying values for each of the Company’s reporting units.
If the carrying value of a long-lived asset is considered impaired, a level two analysis will be conducted and an impairment charge is recorded to adjust the asset to its fair value. Changes in forecasted operations and changes in discount rates can materially affect these estimates. In addition, we test goodwill annually for impairment or more frequently if changes in circumstances or the occurrence of other events suggest impairments exist. The test for impairment requires us to make several estimates about fair value, most of which are based on projected future cash flows and market valuation multiples. Changes in these estimates may result in the recognition of an impairment loss.
INSURANCE RESERVES
We are primarily self-insured for certain employee health benefits, and have self-funded retentions for general liability, automobile liability, property and workers’ compensation. We are fully self-insured for environmental liabilities. The general liability, automobile liability, property, workers’ compensation, and certain environmental liabilities are managed
18
UNIVERSAL FOREST PRODUCTS, INC.
MANAGEMENT’S DISCUSSION AND ANALYSIS OF
FINANCIAL CONDITION AND RESULTS OF OPERATIONS
through a wholly-owned insurance company; the related assets and liabilities of which are included in the consolidated financial statements as of December 30, 2017. Our accounting policies with respect to the reserves are as follows:
|
· |
General liability, automobile, and workers’ compensation reserves are accrued based on third party actuarial valuations of the expected future liabilities. |
|
· |
Health benefits are self-insured up to our pre-determined stop loss limits. These reserves, including incurred but not reported claims, are based on internal computations. These computations consider our historical claims experience, independent statistics, and trends. |
|
· |
The environmental reserve is based on known remediation activities at certain wood preservation facilities and the potential for undetected environmental matters at other sites. The reserve for known activities is based on expected future costs and is computed by in-house experts responsible for managing our monitoring and remediation activities. |
In addition to providing coverage for the Company, our wholly-owned insurance company provides Excess Loss Insurance (primarily medical and prescription drug) to certain third parties. As of December 30, 2017, there were 30 such contracts in place. Reserves associated with these contracts were $3.4 million at December 30, 2017 and $2.5 million at December 31, 2016, and are accrued based on third party actuarial valuations of the expected future liabilities.
On April 14, 2017 the U.S. Branch of Ardellis Insurance Ltd. was granted its Certificate of Authority to transact property and casualty insurance lines as an admitted carrier in the State of Michigan.
INCOME TAXES
Deferred income tax assets and liabilities are computed for differences between the financial statement and tax basis of assets and liabilities that will result in taxable or deductible amounts in the future. Such deferred income tax asset and liability computations are based on enacted tax laws and rates. Valuation allowances are established when necessary to reduce deferred income tax assets to the amounts expected to be realized. Income tax expense is the tax payable or refundable for the period plus or minus the change during the period in deferred income tax assets and liabilities.
Tax laws are complex and subject to different interpretations by taxpayers and respective government taxing authorities, which results in judgment in determining our tax expense and in evaluating our tax positions. Our tax positions are reviewed quarterly and adjusted as new information becomes available.
REVENUE RECOGNITION
Revenue for product sales is recognized at the time the product is shipped to the customer. Generally, title passes at the time of shipment. In certain circumstances, the customer takes title when the shipment arrives at the destination. However, our shipping process is typically completed the same day.
Performance on construction contracts is reflected in operations using percentage-of-completion accounting, under either the cost to cost or units of delivery methods, depending on the nature of the business at individual operations. Under percentage-of-completion using the cost to cost method, revenues and related earnings on construction contracts are measured by the relationships of actual costs incurred related to the total estimated costs. Under percentage-of-completion using the units of delivery method, revenues and related earnings on construction contracts are measured by the relationships of actual units produced related to the total number of units per the contract. Revisions in earnings estimates on the construction contracts are recorded in the accounting period in which the basis for such revisions becomes
19
UNIVERSAL FOREST PRODUCTS, INC.
MANAGEMENT’S DISCUSSION AND ANALYSIS OF
FINANCIAL CONDITION AND RESULTS OF OPERATIONS
known. Projected losses on individual contracts are charged to operations in their entirety when such losses become apparent.
Our construction contracts are generally entered into with a fixed price and completion of the projects can range from 6 to 18 months in duration. Therefore, our operating results are impacted by, among many other things, labor rates and commodity costs. During the year, we update our estimated costs to complete our projects using current labor and commodity costs and recognize losses to the extent that they exist.
FORWARD OUTLOOK
GOALS
The Company’s goal is to achieve long-term sales growth that exceeds positive U.S. GDP growth by 4 percent to 6 percent.
Our general long-term objectives also include:
|
· |
Achieving sales growth primarily through new product introduction, international business expansion, and gaining additional market share, particularly in our core retail, industrial and commercial construction markets; |
|
· |
Identifying new growth opportunities in businesses with adjacencies to our core businesses, primarily through strategic business acquisitions; |
|
· |
Increasing our profitability through cost reductions, productivity improvements as volume improves, and a more favorable mix of value-added products; and |
|
· |
Earning a return on invested capital in excess of our weighted average cost of capital. |
RETAIL MARKET
The Home Improvement Research Institute (“HIRI”) anticipates growth in home improvement spending and has forecasted a 3.7% compounded annual growth rate through 2020.
We continue to compete for market share for certain retail customers and face intense pricing pressure from other suppliers to this market.
Our long-term goal is to achieve sales growth by:
|
· |
Increasing our market share of value-added and preservative-treated products, particularly with independent retail customers. |
|
· |
Developing new, value-added products, such as our Eovations product line. |
|
· |
Adding new products and customers through strategic business acquisitions or alliances. |
|
· |
Increasing our emphasis on product innovation and product differentiation in order to counter commoditization trends and influences. |
20
UNIVERSAL FOREST PRODUCTS, INC.
MANAGEMENT’S DISCUSSION AND ANALYSIS OF
FINANCIAL CONDITION AND RESULTS OF OPERATIONS
INDUSTRIAL MARKET
Our goal is to increase our sales of wood and alternative packaging products to a wide variety of industrial and OEM users. We believe the vast amount of hardwood and softwood lumber consumed for industrial applications, combined with the highly fragmented nature of this market, provides us with growth opportunities as a result of our competitive advantages in manufacturing, purchasing, and material utilization. We plan to continue to obtain market share by expanding our manufacturing capacity capabilities and product offerings and increasing the size of our dedicated industrial design and sales personnel. We also plan to pursue strategic acquisition opportunities.
On September 16, 2016, we acquired idX. See Footnote C "Business Combinations" in the Notes to Consolidated Financial Statements. We plan to pursue opportunities to grow this business in the future including strategic acquisition opportunities.
CONSTRUCTION MARKET
The National Association of Home Builders forecasts a 2% increase in manufactured home shipments in 2018 followed by a 6% increase in 2019. We currently supply approximately 40% of the trusses used in manufactured housing and we will strive to maintain our market share of trusses produced for this market.
The Mortgage Bankers Association of America forecasts a 7% increase in national housing starts to an estimated 1.4 million starts in 2018. The National Association of Home Builders forecasts starts of 1.2 million, a 3% increase from 2017. We believe we are well-positioned to capture our share of any increase that may occur in housing starts in the regions we operate. However, due to our conservative approach to adding capacity to serve this market and focus on managing potential channel conflicts with certain customers, our growth may trail the market in future years.
GROSS PROFIT
We believe the following factors may impact our gross profits and margins in the future:
|
· |
End market demand. |
|
· |
Our ability to maintain market share and gross margins on products sold to our largest customers. We believe our level of service, geographic diversity, and quality of products provides an added value to our customers. However, if our customers are unwilling to pay for these advantages, our sales and gross margins may be reduced. Excess capacity exists for suppliers in certain of our markets. As a result, we may experience pricing pressure in the future. |
|
· |
Sales mix of value-added and commodity products. |
|
· |
Fluctuations in the relative level of the Lumber Market and the trend in the market place of lumber. (See "Impact of the Lumber Market on our Operating Results.") |
|
· |
Fuel and transportation costs. |
|
· |
Rising labor and benefit costs. |
|
· |
Our ability to continue to achieve productivity improvements as our unit sales increase and planned cost reductions through our continuous improvement, automation, and other initiatives. |
21
UNIVERSAL FOREST PRODUCTS, INC.
MANAGEMENT’S DISCUSSION AND ANALYSIS OF
FINANCIAL CONDITION AND RESULTS OF OPERATIONS
SELLING, GENERAL, AND ADMINISTRATIVE EXPENSES
In recent years, selling, general and administrative (SG&A) expenses have increased as we have added personnel needed to take advantage of growth opportunities and execute our initiatives designed to increase our sales of new products and improve our sales mix of value-added products. We anticipate our trend of increases in these costs will continue in 2018; however, our objective to reduce these costs as a percentage of sales (assuming lumber prices remain stable) as we grow as a result of fixed costs and through the improved productivity of our people. In addition, bonus and other incentive expenses for all salaried and sales employees is based on our profitability and the effective management of our assets and will continue to fluctuate based on our results.
On a long-term basis, we expect that our SG&A expenses will primarily be impacted by:
|
· |
Our growth in sales to the industrial market and the construction market. Our sales to these markets require a higher ratio of SG&A costs due, in part, to product design and engineering requirements. |
|
· |
Sales of new products which generally require higher development, marketing, advertising, and other selling costs. |
|
· |
Our incentive compensation programs which is tied to gross profits, pre-bonus earnings from operations and return on investment. |
|
· |
Our growth and success in achieving continuous improvement objectives designed to improve our productivity and leveraging our fixed costs. |
INCOME TAXES
We anticipate an additional 4.5% in our overall effective tax rate in 2018 from 2017 to approximately 25%, which is driven primarily by a reduction in the U.S. corporate federal tax rate from 35% to 21% as a result of the Tax Act.
LIQUIDITY AND CAPITAL RESOURCES
Our cash cycle will continue to be impacted in the future by our mix of sales by market. Sales to the residential and commercial construction and industrial markets require a greater investment in working capital (inventory and accounts receivable) than our sales to the retail and manufactured housing markets. Additionally, our investment in trade receivables and inventory will continue to be impacted by the level of lumber prices.
In January 2018, we sold real estate in Medley, Florida, and received $36 million of pretax proceeds and recognized a $7 million pretax gain. We are currently evaluating purchases of other real estate, including replacement capacity of our Medley plant, which will qualify as a like-kind exchange for U.S. tax purposes and allow us to defer the $25 million tax gain from the sale.
Additionally, management expects to spend approximately $85 million on capital expenditures, incur depreciation of approximately $50 million, and incur amortization and other non-cash expenses of approximately $8 million in 2018.
On December 30, 2017, we had outstanding purchase commitments on capital projects of approximately $8 million. We intend to fund capital expenditures and purchase commitments through our operating cash flows and availability under our revolving credit facility which is considered sufficient to meet these commitments and working capital needs.
22
UNIVERSAL FOREST PRODUCTS, INC.
MANAGEMENT’S DISCUSSION AND ANALYSIS OF
FINANCIAL CONDITION AND RESULTS OF OPERATIONS
We have no present plan to change our dividend policy, which was recently increased by 13% to a semi-annual rate of $0.17 per share. Our dividend rates are reviewed and approved at our April and October board meetings and payments are made in June and December of each year.
We have a share repurchase program approved by our Board of Directors, and as of December 30, 2017, we have authorization to buy back approximately 2.7 million shares. In the past, we have repurchased shares in order to offset the effect of issuances resulting from our employee benefit plans and at opportune times when our stock price falls to predetermined levels.
23
Management’s Annual Report on Internal Control Over Financial Reporting
The management of Universal Forest Products, Inc. is responsible for establishing and maintaining adequate internal control over financial reporting. Our internal control system was designed to provide reasonable assurance to us and the Board of Directors regarding the preparation and fair presentation of published financial statements.
All internal control systems, no matter how well designed, have inherent limitations. Therefore, even those systems determined to be effective can provide only reasonable assurance with respect to financial statement preparation and presentation.
We assessed the effectiveness of our internal control over financial reporting as of December 30, 2017, based on the framework in Internal Control-Integrated Framework issued by the Committee of Sponsoring Organizations of the Treadway Commission (2013 Framework) (“COSO”). Based on that evaluation, management has concluded that as of December 30, 2017, our internal control over financial reporting was effective.
The effectiveness of the Company’s internal control over financial reporting has been audited by Deloitte & Touche LLP, an independent registered public accounting firm, as stated in their report, which follows our report.
Universal Forest Products, Inc.
February 28, 2018
24
REPORT OF INDEPENDENT REGISTERED PUBLIC ACCOUNTING FIRM
To the shareholders and the Board of Directors of Universal Forest Products, Inc.
Opinion on Internal Control over Financial Reporting
We have audited the internal control over financial reporting of Universal Forest Products, Inc. and subsidiaries (the “Company”) as of December 30, 2017, based on criteria established in Internal Control — Integrated Framework (2013) issued by the Committee of Sponsoring Organizations of the Treadway Commission (COSO). In our opinion, the Company maintained, in all material respects, effective internal control over financial reporting as of December 30, 2017, based on criteria established in Internal Control — Integrated Framework (2013) issued by COSO.
We have also audited, in accordance with the standards of the Public Company Accounting Oversight Board (United States) (PCAOB), the consolidated financial statements as of and for the year ended December 30, 2017, of the Company and our report dated February 28, 2018, expressed an unqualified opinion on those financial statements.
Basis for Opinion
The Company’s management is responsible for maintaining effective internal control over financial reporting and for its assessment of the effectiveness of internal control over financial reporting, included in the accompanying Management’s Annual Report on Internal Control Over Financial Reporting. Our responsibility is to express an opinion on the Company’s internal control over financial reporting based on our audit. We are a public accounting firm registered with the PCAOB and are required to be independent with respect to the Company in accordance with the U.S. federal securities laws and the applicable rules and regulations of the Securities and Exchange Commission and the PCAOB.
We conducted our audit in accordance with the standards of the PCAOB. Those standards require that we plan and perform the audit to obtain reasonable assurance about whether effective internal control over financial reporting was maintained in all material respects. Our audit included obtaining an understanding of internal control over financial reporting, assessing the risk that a material weakness exists, testing and evaluating the design and operating effectiveness of internal control based on the assessed risk, and performing such other procedures as we considered necessary in the circumstances. We believe that our audit provides a reasonable basis for our opinion.
Definition and Limitations of Internal Control over Financial Reporting
A company’s internal control over financial reporting is a process designed to provide reasonable assurance regarding the reliability of financial reporting and the preparation of financial statements for external purposes in accordance with generally accepted accounting principles. A company’s internal control over financial reporting includes those policies and procedures that (1) pertain to the maintenance of records that, in reasonable detail, accurately and fairly reflect the transactions and dispositions of the assets of the company; (2) provide reasonable assurance that transactions are recorded as necessary to permit preparation of financial statements in accordance with generally accepted accounting principles, and that receipts and expenditures of the company are being made only in accordance with authorizations of management and directors of the company; and (3) provide reasonable assurance regarding prevention or timely detection of unauthorized acquisition, use, or disposition of the company’s assets that could have a material effect on the financial statements.
Because of its inherent limitations, internal control over financial reporting may not prevent or detect misstatements. Also, projections of any evaluation of effectiveness to future periods are subject to the risk that controls may become inadequate because of changes in conditions, or that the degree of compliance with the policies or procedures may deteriorate.
/s/ Deloitte & Touche LLP
Grand Rapids, Michigan
February 28, 2018
25
REPORT OF INDEPENDENT REGISTERED PUBLIC ACCOUNTING FIRM
To the shareholders and the Board of Directors of Universal Forest Products, Inc.
Opinion on the Financial Statements
We have audited the accompanying consolidated balance sheets of Universal Forest Products, Inc. and subsidiaries (the "Company") as of December 30, 2017 and December 31, 2016, the related consolidated statements of earnings and comprehensive income, shareholders' equity, and cash flows, for each of the three years in the period ended December 30, 2017, and the related notes (collectively referred to as the "financial statements"). In our opinion, the financial statements present fairly, in all material respects, the financial position of the Company as of December 30, 2017 and December 31, 2016, and the results of its operations and its cash flows for each of the three years in the period ended December 30, 2017, in conformity with accounting principles generally accepted in the United States of America.
We have also audited, in accordance with the standards of the Public Company Accounting Oversight Board (United States) (PCAOB), the Company's internal control over financial reporting as of December 30, 2017, based on criteria established in Internal Control — Integrated Framework (2013) issued by the Committee of Sponsoring Organizations of the Treadway Commission and our report dated February 28, 2018, expressed an unqualified opinion on the Company's internal control over financial reporting.
Basis for Opinion
These financial statements are the responsibility of the Company's management. Our responsibility is to express an opinion on the Company's financial statements based on our audits. We are a public accounting firm registered with the PCAOB and are required to be independent with respect to the Company in accordance with the U.S. federal securities laws and the applicable rules and regulations of the Securities and Exchange Commission and the PCAOB.
We conducted our audits in accordance with the standards of the PCAOB. Those standards require that we plan and perform the audit to obtain reasonable assurance about whether the financial statements are free of material misstatement, whether due to error or fraud. Our audits included performing procedures to assess the risks of material misstatement of the financial statements, whether due to error or fraud, and performing procedures that respond to those risks. Such procedures included examining, on a test basis, evidence regarding the amounts and disclosures in the financial statements. Our audits also included evaluating the accounting principles used and significant estimates made by management, as well as evaluating the overall presentation of the financial statements. We believe that our audits provide a reasonable basis for our opinion.
/s/ Deloitte & Touche LLP
Grand Rapids, Michigan
February 28, 2018
We have served as the Company's auditor since 2014.
26
UNIVERSAL FOREST PRODUCTS, INC.
|
(in thousands, except share data) |
|
|
|
|
|
||
|
|
|
|
December 30, |
|
December 31, |
||
|
|
|
|
2017 |
|
2016 |
||
|
ASSETS |
|
|
|
|
|
|
|
|
CURRENT ASSETS: |
|
|
|
|
|
|
|
|
Cash and cash equivalents |
|
|
$ |
28,339 |
|
$ |
34,091 |
|
Investments |
|
|
|
11,269 |
|
|
10,348 |
|
Restricted cash |
|
|
|
477 |
|
|
398 |
|
Accounts receivable, net |
|
|
|
327,751 |
|
|
282,253 |
|
Inventories: |
|
|
|
|
|
|
|
|
Raw materials |
|
|
|
234,354 |
|
|
198,954 |
|
Finished goods |
|
|
|
225,954 |
|
|
198,273 |
|
Total inventories |
|
|
|
460,308 |
|
|
397,227 |
|
Refundable income taxes |
|
|
|
7,228 |
|
|
11,459 |
|
Other current assets |
|
|
|
28,115 |
|
|
20,662 |
|
TOTAL CURRENT ASSETS |
|
|
|
863,487 |
|
|
756,438 |
|
DEFERRED INCOME TAXES |
|
|
|
1,865 |
|
|
1,546 |
|
RESTRICTED INVESTMENTS |
|
|
|
8,359 |
|
|
— |
|
OTHER ASSETS |
|
|
|
7,368 |
|
|
8,617 |
|
GOODWILL |
|
|
|
212,644 |
|
|
198,535 |
|
INDEFINITE-LIVED INTANGIBLE ASSETS |
|
|
|
7,415 |
|
|
2,340 |
|
OTHER INTANGIBLE ASSETS, NET |
|
|
|
34,910 |
|
|
26,731 |
|
PROPERTY, PLANT AND EQUIPMENT: |
|
|
|
|
|
|
|
|
Land and improvements |
|
|
|
134,916 |
|
|
124,316 |
|
Building and improvements |
|
|
|
213,384 |
|
|
204,586 |
|
Machinery and equipment |
|
|
|
372,628 |
|
|
332,397 |
|
Furniture and fixtures |
|
|
|
25,251 |
|
|
22,570 |
|
Construction in progress |
|
|
|
16,922 |
|
|
15,593 |
|
PROPERTY, PLANT AND EQUIPMENT,GROSS |
|
|
|
763,101 |
|
|
699,462 |
|
Less accumulated depreciation and amortization |
|
|
|
(434,472) |
|
|
(401,611) |
|
PROPERTY, PLANT AND EQUIPMENT, NET |
|
|
|
328,629 |
|
|
297,851 |
|
TOTAL ASSETS |
|
|
$ |
1,464,677 |
|
$ |
1,292,058 |
|
LIABILITIES AND SHAREHOLDERS’ EQUITY |
|
|
|
|
|
|
|
|
CURRENT LIABILITIES: |
|
|
|
|
|
|
|
|
Cash overdraft |
|
|
$ |
25,851 |
|
$ |
19,761 |
|
Accounts payable |
|
|
|
140,106 |
|
|
124,660 |
|
Accrued liabilities: |
|
|
|
|
|
|
|
|
Compensation and benefits |
|
|
|
97,556 |
|
|
92,441 |
|
Other |
|
|
|
38,404 |
|
|
32,281 |
|
Current portion of long-term debt |
|
|
|
1,329 |
|
|
2,634 |
|
TOTAL CURRENT LIABILITIES |
|
|
|
303,246 |
|
|
271,777 |
|
LONG-TERM DEBT |
|
|
|
144,674 |
|
|
109,059 |
|
DEFERRED INCOME TAXES |
|
|
|
14,079 |
|
|
20,817 |
|
OTHER LIABILITIES |
|
|
|
28,655 |
|
|
29,939 |
|
TOTAL LIABILITIES |
|
|
|
490,654 |
|
|
431,592 |
|
SHAREHOLDERS’ EQUITY: |
|
|
|
|
|
|
|
|
Controlling interest shareholders’ equity: |
|
|
|
|
|
|
|
|
Preferred stock, no par value; shares authorized 1,000,000; issued and outstanding, none |
|
|
$ |
— |
|
$ |
— |
|
Common stock, $1 par value; shares authorized 80,000,000; issued and outstanding, 61,191,888 and 61,026,207 |
|
|
|
61,192 |
|
|
61,026 |
|
Additional paid-in capital |
|
|
|
161,928 |
|
|
144,649 |
|
Retained earnings |
|
|
|
736,212 |
|
|
649,135 |
|
Accumulated other comprehensive income |
|
|
|
144 |
|
|
(5,630) |
|
Total controlling interest shareholders’ equity |
|
|
|
959,476 |
|
|
849,180 |
|
Noncontrolling interest |
|
|
|
14,547 |
|
|
11,286 |
|
TOTAL SHAREHOLDERS’ EQUITY |
|
|
|
974,023 |
|
|
860,466 |
|
TOTAL LIABILITIES AND SHAREHOLDERS’ EQUITY |
|
|
$ |
1,464,677 |
|
$ |
1,292,058 |
See notes to consolidated financial statements.
27
UNIVERSAL FOREST PRODUCTS, INC.
CONSOLIDATED STATEMENTS OF EARNINGS AND COMPREHENSIVE INCOME
|
(in thousands, except per share data) |
|
|
|
|
|
|
|||
|
|
|
Year Ended |
|||||||
|
|
|
December 30, |
|
December 31, |
|
December 26, |
|||
|
|
|
2017 |
|
2016 |
|
2015 |
|||
|
NET SALES |
|
$ |
3,941,182 |
|
$ |
3,240,493 |
|
$ |
2,887,071 |
|
COST OF GOODS SOLD |
|
|
3,398,356 |
|
|
2,765,903 |
|
|
2,487,167 |
|
GROSS PROFIT |
|
|
542,826 |
|
|
474,590 |
|
|
399,904 |
|
SELLING, GENERAL AND ADMINISTRATIVE EXPENSES |
|
|
362,220 |
|
|
310,152 |
|
|
264,265 |
|
NET (GAIN) LOSS ON DISPOSITION OF ASSETS |
|
|
(863) |
|
|
— |
|
|
172 |
|
EARNINGS FROM OPERATIONS |
|
|
181,469 |
|
|
164,438 |
|
|
135,467 |
|
INTEREST EXPENSE |
|
|
6,218 |
|
|
4,575 |
|
|
5,133 |
|
INTEREST INCOME |
|
|
(731) |
|
|
(541) |
|
|
(294) |
|
EQUITY IN EARNINGS OF INVESTEE |
|
|
(25) |
|
|
(267) |
|
|
(374) |
|
|
|
|
5,462 |
|
|
3,767 |
|
|
4,465 |
|
EARNINGS BEFORE INCOME TAXES |
|
|
176,007 |
|
|
160,671 |
|
|
131,002 |
|
INCOME TAXES |
|
|
51,967 |
|
|
55,174 |
|
|
45,870 |
|
NET EARNINGS |
|
|
124,040 |
|
|
105,497 |
|
|
85,132 |
|
LESS NET EARNINGS ATTRIBUTABLE TO NONCONTROLLING INTEREST |
|
|
(4,528) |
|
|
(4,318) |
|
|
(4,537) |
|
NET EARNINGS ATTRIBUTABLE TO CONTROLLING INTEREST |
|
$ |
119,512 |
|
$ |
101,179 |
|
$ |
80,595 |
|
|
|
|
|
|
|
|
|
|
|
|
EARNINGS PER SHARE - BASIC |
|
$ |
1.95 |
|
$ |
1.66 |
|
$ |
1.33 |
|
EARNINGS PER SHARE - DILUTED |
|
$ |
1.94 |
|
$ |
1.65 |
|
$ |
1.33 |
|
|
|
|
|
|
|
|
|
|
|
|
OTHER COMPREHENSIVE INCOME: |
|
|
|
|
|
|
|
|
|
|
OTHER COMPREHENSIVE GAIN (LOSS) |
|
|
6,130 |
|
|
(2,703) |
|
|
(7,257) |
|
COMPREHENSIVE INCOME |
|
|
130,170 |
|
|
102,794 |
|
|
77,875 |
|
LESS COMPREHENSIVE INCOME ATTRIBUTABLE TO NONCONTROLLING INTEREST |
|
|
(4,884) |
|
|
(2,660) |
|
|
(3,213) |
|
COMPREHENSIVE INCOME ATTRIBUTABLE TO CONTROLLING INTEREST |
|
$ |
125,286 |
|
$ |
100,134 |
|
$ |
74,662 |
See notes to consolidated financial statements.
28
UNIVERSAL FOREST PRODUCTS, INC.
CONSOLIDATED STATEMENTS OF SHAREHOLDERS’ EQUITY
|
(in thousands, except share and per share data) |
|
|
|
|
|
|
|
|
|
|
|
|
|
|
|
|
|
|
|
|
|
|
|
|
Controlling Interest Shareholders’ Equity |
|||||||||||||||||||
|
|
|
|
|
|
|
|
|
|
|
|
Accumulated |
|
|
|
|
|
|
|
|
|
|
|
|
|
|
|
|
Additional |
|
|
|
|
Other |
|
|
Employees |
|
|
|
|
|
|
||
|
|
|
Common |
|
Paid-In |
|
Retained |
|
Comprehensive |
|
Stock Notes |
|
Noncontrolling |
|
|
|
||||||
|
|
|
Stock |
|
Capital |
|
Earnings |
|
Earnings |
|
Receivable |
|
Interest |
|
Total |
|||||||
|
Balance at December 27, 2014 |
|
$ |
59,952 |
|
$ |
122,515 |
|
$ |
502,334 |
|
$ |
1,348 |
|
$ |
(455) |
|
$ |
13,866 |
|
$ |
699,560 |
|
Net earnings |
|
|
|
|
|
|
|
|
80,595 |
|
|
|
|
|
|
|
|
4,537 |
|
|
85,132 |
|
Foreign currency translation adjustment |
|
|
|
|
|
|
|
|
|
|
|
(5,892) |
|
|
|
|
|
(1,324) |
|
|
(7,216) |
|
Unrealized gain (loss) on investment |
|
|
|
|
|
|
|
|
|
|
|
(41) |
|
|
|
|
|
|
|
|
(41) |
|
Noncontrolling interest associated with business acquisitions |
|
|
|
|
|
|
|
|
|
|
|
|
|
|
|
|
|
1,019 |
|
|
1,019 |
|
Distributions to noncontrolling interest |
|
|
|
|
|
|
|
|
|
|
|
|
|
|
|
|
|
(3,188) |
|
|
(3,188) |
|
Purchases of noncontrolling interest |
|
|
|
|
|
|
|
|
|
|
|
|
|
|
— |
|
|
(1,256) |
|
|
(1,256) |
|
Cash dividends - $0.133 & $0.140 per share - semiannually |
|
|
|
|
|
|
|
|
(16,507) |
|
|
|
|
|
|
|
|
|
|
|
(16,507) |
|
Issuance of 90,639 shares under employee stock plans |
|
|
91 |
|
|
984 |
|
|
|
|
|
|
|
|
|
|
|
|
|
|
1,075 |
|
Issuance of 226,812 shares under stock grant programs |
|
|
227 |
|
|
1,685 |
|
|
|
|
|
|
|
|
|
|
|
|
|
|
1,912 |
|
Issuance of 195,162 shares under deferred compensation plans |
|
|
195 |
|
|
(195) |
|
|
|
|
|
|
|
|
|
|
|
|
|
|
— |
|
Repurchase of 40,839 shares |
|
|
(40) |
|
|
26 |
|
|
(786) |
|
|
|
|
|
304 |
|
|
|
|
|
(496) |
|
Tax benefits from non-qualified stock options exercised |
|
|
|
|
|
370 |
|
|
|
|
|
|
|
|
|
|
|
|
|
|
370 |
|
Expense associated with share-based compensation arrangements |
|
|
|
|
|
1,846 |
|
|
|
|
|
|
|
|
|
|
|
|
|
|
1,846 |
|
Accrued expense under deferred compensation plans |
|
|
|
|
|
4,048 |
|
|
|
|
|
|
|
|
|
|
|
|
|
|
4,048 |
|
Payments received on employee stock notes receivable |
|
|
|
|
|
|
|
|
|
|
|
|
|
|
151 |
|
|
|
|
|
151 |
|
Balance at December 26, 2015 |
|
$ |
60,425 |
|
$ |
131,279 |
|
$ |
565,636 |
|
$ |
(4,585) |
|
$ |
— |
|
$ |
13,654 |
|
$ |
766,409 |
|
Net earnings |
|
|
|
|
|
|
|
|
101,179 |
|
|
|
|
|
|
|
|
4,318 |
|
|
105,497 |
|
Foreign currency translation adjustment |
|
|
|
|
|
|
|
|
|
|
|
(1,316) |
|
|
|
|
|
(1,658) |
|
|
(2,974) |
|
Unrealized gain (loss) on investment |
|
|
|
|
|
|
|
|
|
|
|
271 |
|
|
|
|
|
|
|
|
271 |
|
Noncontrolling interest associated with business acquisitions |
|
|
|
|
|
|
|
|
|
|
|
|
|
|
|
|
|
— |
|
|
— |
|
Distributions to noncontrolling interest |
|
|
|
|
|
|
|
|
|
|
|
|
|
|
|
|
|
(3,280) |
|
|
(3,280) |
|
Net purchase and dissolution of noncontrolling interest |
|
|
|
|
|
856 |
|
|
|
|
|
|
|
|
|
|
|
(1,748) |
|
|
(892) |
|
Cash dividends - $0.140 & $0.150 per share - semiannually |
|
|
|
|
|
|
|
|
(17,680) |
|
|
|
|
|
|
|
|
|
|
|
(17,680) |
|
Issuance of 20,439 shares under employee stock plans |
|
|
21 |
|
|
515 |
|
|
|
|
|
|
|
|
|
|
|
|
|
|
536 |
|
Issuance of 407,271 shares under stock grant programs |
|
|
407 |
|
|
4,890 |
|
|
|
|
|
|
|
|
|
|
|
|
|
|
5,297 |
|
Issuance of 173,370 shares under deferred compensation plans |
|
|
173 |
|
|
(173) |
|
|
|
|
|
|
|
|
|
|
|
|
|
|
— |
|
Expense associated with share-based compensation arrangements |
|
|
|
|
|
2,208 |
|
|
|
|
|
|
|
|
|
|
|
|
|
|
2,208 |
|
Accrued expense under deferred compensation plans |
|
|
|
|
|
5,074 |
|
|
|
|
|
|
|
|
|
|
|
|
|
|
5,074 |
|
Balance at December 31, 2016 |
|
$ |
61,026 |
|
$ |
144,649 |
|
$ |
649,135 |
|
$ |
(5,630) |
|
$ |
— |
|
$ |
11,286 |
|
$ |
860,466 |
|
Net earnings |
|
|
|
|
|
|
|
|
119,512 |
|
|
|
|
|
|
|
|
4,528 |
|
|
124,040 |
|
Foreign currency translation adjustment |
|
|
|
|
|
|
|
|
|
|
|
5,070 |
|
|
|
|
|
356 |
|
|
5,426 |
|
Unrealized gain (loss) on investment & foreign currency |
|
|
|
|
|
|
|
|
|
|
|
704 |
|
|
|
|
|
|
|
|
704 |
|
Distributions to noncontrolling interest |
|
|
|
|
|
|
|
|
|
|
|
|
|
|
|
|
|
(4,032) |
|
|
(4,032) |
|
Additional purchases of noncontrolling interest |
|
|
|
|
|
|
|
|
|
|
|
|
|
|
|
|
|
2,409 |
|
|
2,409 |
|
Net purchase and dissolution of noncontrolling interest |
|
|
|
|
|
|
|
|
|
|
|
|
|
|
|
|
|
— |
|
|
— |
|
Cash dividends - $0.150 & $0.170 per share - semiannually |
|
|
|
|
|
|
|
|
(19,607) |
|
|
|
|
|
|
|
|
|
|
|
(19,607) |
|
Issuance of 23,691 shares under employee stock plans |
|
|
24 |
|
|
637 |
|
|
|
|
|
|
|
|
|
|
|
|
|
|
661 |
|
Issuance of 428,622 shares under stock grant programs |
|
|
429 |
|
|
5,769 |
|
|
|
|
|
|
|
|
|
|
|
|
|
|
6,198 |
|
Issuance of 159,108 shares under deferred compensation plans |
|
|
159 |
|
|
(159) |
|
|
|
|
|
|
|
|
|
|
|
|
|
|
— |
|
Repurchase of 445,740 shares |
|
|
(446) |
|
|
297 |
|
|
(12,828) |
|
|
|
|
|
|
|
|
|
|
|
(12,977) |
|
Expense associated with share-based compensation arrangements |
|
|
|
|
|
3,618 |
|
|
|
|
|
|
|
|
|
|
|
|
|
|
3,618 |
|
Accrued expense under deferred compensation plans |
|
|
|
|
|
7,117 |
|
|
|
|
|
|
|
|
|
|
|
|
|
|
7,117 |
|
Balance at December 30, 2017 |
|
$ |
61,192 |
|
$ |
161,928 |
|
$ |
736,212 |
|
$ |
144 |
|
$ |
— |
|
$ |
14,547 |
|
$ |
974,023 |
See notes to consolidated financial statements
29
UNIVERSAL FOREST PRODUCTS, INC.
CONSOLIDATED STATEMENTS OF CASH FLOWS
|
(in thousands) |
|
Year Ended |
|||||||
|
|
|
December 30, |
|
December 31, |
|
December 26, |
|||
|
|
|
2017 |
|
2016 |
|
2015 |
|||
|
CASH FLOWS FROM OPERATING ACTIVITIES: |
|
|
|
|
|
|
|
|
|
|
Net earnings |
|
$ |
124,040 |
|
$ |
105,497 |
|
$ |
85,132 |
|
Adjustments to reconcile net earnings to net cash from operating activities: |
|
|
|
|
|
|
|
|
|
|
Depreciation |
|
|
48,536 |
|
|
40,823 |
|
|
37,710 |
|
Amortization of intangibles |
|
|
4,860 |
|
|
2,795 |
|
|
3,531 |
|
Expense associated with share-based and grant compensation arrangements |
|
|
3,805 |
|
|
2,335 |
|
|
1,955 |
|
Expense tax benefits from share-based compensation arrangements |
|
|
— |
|
|
— |
|
|
(33) |
|
Deferred income taxes (credits) |
|
|
(8,629) |
|
|
2,464 |
|
|
(1,369) |
|
Equity in earnings of investee |
|
|
(25) |
|
|
(267) |
|
|
(374) |
|
Net (gain) loss on disposition of assets |
|
|
(863) |
|
|
— |
|
|
172 |
|
Changes in: |
|
|
|
|
|
|
|
|
|
|
Accounts receivable |
|
|
(30,787) |
|
|
(5,119) |
|
|
(26,007) |
|
Inventories |
|
|
(49,262) |
|
|
(3,245) |
|
|
34,139 |
|
Accounts payable and cash overdraft |
|
|
21,159 |
|
|
11,259 |
|
|
4,798 |
|
Accrued liabilities and other |
|
|
23,749 |
|
|
15,978 |
|
|
29,142 |
|
NET CASH FROM OPERATING ACTIVITIES |
|
|
136,583 |
|
|
172,520 |
|
|
168,796 |
|
CASH FLOWS FROM INVESTING ACTIVITIES: |
|
|
|
|
|
|
|
|
|
|
Purchases of property, plant and equipment |
|
|
(71,116) |
|
|
(53,762) |
|
|
(43,522) |
|
Proceeds from sale of property, plant and equipment |
|
|
2,919 |
|
|
3,126 |
|
|
2,843 |
|
Acquisitions, net of cash received |
|
|
(60,587) |
|
|
(80,077) |
|
|
(2,505) |
|
Repayments of debt of acquiree |
|
|
— |
|
|
(92,830) |
|
|
— |
|
Purchase and dissolution of remaining noncontrolling interest in subsidiary |
|
|
— |
|
|
(892) |
|
|
(1,256) |
|
Advances of notes receivable |
|
|
(234) |
|
|
(6,012) |
|
|
(6,994) |
|
Collections on notes receivable |
|
|
1,509 |
|
|
7,899 |
|
|
11,446 |
|
Purchases of investments |
|
|
(13,518) |
|
|
(5,666) |
|
|
(7,858) |
|
Proceeds from sale of investments |
|
|
5,103 |
|
|
2,568 |
|
|
1,115 |
|
Other |
|
|
(1,735) |
|
|
(2,011) |
|
|
95 |
|
NET CASH USED IN INVESTING ACTIVITIES |
|
|
(137,659) |
|
|
(227,657) |
|
|
(46,636) |
|
CASH FLOWS FROM FINANCING ACTIVITIES: |
|
|
|
|
|
|
|
|
|
|
Borrowings under revolving credit facilities |
|
|
758,287 |
|
|
131,002 |
|
|
297,711 |
|
Repayments under revolving credit facilities |
|
|
(722,725) |
|
|
(107,294) |
|
|
(311,271) |
|
Borrowings of debt |
|
|
8,525 |
|
|
— |
|
|
— |
|
Repayment of debt |
|
|
(13,347) |
|
|
— |
|
|
— |
|
Proceeds from issuance of common stock |
|
|
660 |
|
|
536 |
|
|
1,074 |
|
Dividends paid to shareholders |
|
|
(19,607) |
|
|
(17,680) |
|
|
(16,507) |
|
Distributions to noncontrolling interest |
|
|
(4,032) |
|
|
(3,280) |
|
|
(3,188) |
|
Repurchase of common stock |
|
|
(12,977) |
|
|
— |
|
|
(800) |
|
Other |
|
|
(31) |
|
|
(73) |
|
|
(21) |
|
NET CASH FROM (USED IN) FINANCING ACTIVITIES |
|
|
(5,247) |
|
|
3,211 |
|
|
(33,002) |
|
Effect of exchange rate changes on cash |
|
|
650 |
|
|
(1,927) |
|
|
(1,221) |
|
NET CHANGE IN CASH AND CASH EQUIVALENTS |
|
|
(5,673) |
|
|
(53,853) |
|
|
87,937 |
|
CASH, CASH EQUIVALENTS, AND RESTRICTED CASH, BEGINNING OF YEAR |
|
|
34,489 |
|
|
88,342 |
|
|
405 |
|
CASH, CASH EQUIVALENTS, AND RESTRICTED CASH, END OF PERIOD |
|
$ |
28,816 |
|
$ |
34,489 |
|
$ |
88,342 |
|
|
|
|
|
|
|
|
|
|
|
|
RECONCILIATION OF CASH AND CASH EQUIVALENTS AND RESTRICTED CASH: |
|
|
|
|
|
|
|
|
|
|
Cash and cash equivalents, beginning of period |
|
$ |
34,091 |
|
$ |
87,756 |
|
$ |
- |
|
Restricted cash, beginning of period |
|
|
398 |
|
|
586 |
|
|
405 |
|
Cash, cash equivalents, and restricted cash, beginning of period |
|
$ |
34,489 |
|
$ |
88,342 |
|
$ |
405 |
|
|
|
|
|
|
|
|
|
|
|
|
Cash and cash equivalents, end of period |
|
$ |
28,339 |
|
$ |
34,091 |
|
$ |
87,756 |
|
Restricted cash, end of period |
|
|
477 |
|
|
398 |
|
|
586 |
|
Cash, cash equivalents, and restricted cash, end of period |
|
$ |
28,816 |
|
$ |
34,489 |
|
$ |
88,342 |
|
|
|
|
|
|
|
|
|
|
|
|
SUPPLEMENTAL INFORMATION: |
|
|
|
|
|
|
|
|
|
|
Interest paid |
|
$ |
6,020 |
|
$ |
4,550 |
|
$ |
5,118 |
|
Income taxes paid |
|
|
56,663 |
|
|
57,311 |
|
|
42,767 |
|
NON-CASH INVESTING ACTIVITIES |
|
|
|
|
|
|
|
|
|
|
Notes receivable exchanged for property |
|
|
— |
|
|
— |
|
|
389 |
|
NON-CASH FINANCING ACTIVITIES: |
|
|
|
|
|
|
|
|
|
|
Common stock issued under deferred compensation plans |
|
$ |
5,116 |
|
$ |
4,353 |
|
$ |
3,461 |
|
Property exchanged for notes receivable |
|
|
— |
|
|
— |
|
|
300 |
|
Acquisition earnout and noncompete adjustment prior to final purchase accounting |
|
|
— |
|
|
— |
|
|
14,195 |
See notes to consolidated financial statements
30
UNIVERSAL FOREST PRODUCTS, INC.
NOTES TO CONSOLIDATED FINANCIAL STATEMENTS
A.SUMMARY OF SIGNIFICANT ACCOUNTING POLICIES
OPERATIONS
We design, manufacture and market wood and wood-alternative products for large home centers and other retailers; structural lumber, engineered wood components, framing services, and other products for the construction market; specialty wood packaging, components, packing materials, and other wood-based products for various industries; and design, manufacture, and install customized interior fixtures used in retail and commercial structures for various markets.
PRINCIPLES OF CONSOLIDATION
The consolidated financial statements include our accounts and those of our wholly-owned and majority-owned subsidiaries and partnerships. In addition, we consolidate any entity which we own 50% or more and exercise control. Intercompany transactions and balances have been eliminated.
NONCONTROLLING INTEREST IN SUBSIDIARIES
Noncontrolling interest in results of operations of consolidated subsidiaries represents the noncontrolling shareholders’ share of the income or loss of various consolidated subsidiaries. The noncontrolling interest reflects the original investment by these noncontrolling shareholders combined with their proportional share of the earnings or losses of these subsidiaries, net of distributions paid.
FISCAL YEAR
Our fiscal year is a 52 or 53 week period, ending on the last Saturday of December. Unless otherwise stated, references to 2017, 2016, and 2015 relate to the fiscal years ended December 30, 2017, December 31, 2016, and December 26, 2015, respectively. Fiscal year 2016 was comprised of 53 weeks, which contributed an additional $60 million in sales in 2016 compared to fiscal years 2017 and 2015, which were comprised of 52 weeks.
FAIR VALUE DISCLOSURES OF FINANCIAL INSTRUMENTS
We follow ASC Topic 820, Fair Value Measurements and Disclosures, which provides a consistent definition of fair value, focuses on exit price, prioritizes the use of market-based inputs over entity-specific inputs for measuring fair value and establishes a three-tier hierarchy for fair value measurements. This topic requires fair value measurements to be classified and disclosed in one of the following three categories:
|
· |
Level 1 — Financial instruments with unadjusted, quoted prices listed on active market exchanges. |
|
· |
Level 2 — Financial instruments lacking unadjusted, quoted prices from active market exchanges, including over-the-counter traded financial instruments. Financial instrument values are determined using prices for recently traded financial instruments with similar underlying terms and direct or indirect observational inputs, such as interest rates and yield curves at commonly quoted intervals. |
|
· |
Level 3 — Financial instruments not actively traded on a market exchange and there is little, if any, market activity. Values are determined using significant unobservable inputs or valuation techniques. |
31
CASH AND CASH EQUIVALENTS
Cash and cash equivalents consist of cash and highly-liquid investments purchased with an original maturity of three months or less.
Restricted cash consists of amounts required to be held for loss funding totaling $0.5 million and $0.4 million as of December 30, 2017 and December 31, 2016, respectively.
In November 2016, the Financial Accounting Standards Board (FASB) issued Accounting Standard Update (ASU) No. 2016-18, “Statement of Cash Flows (Topic 230)” (ASU 2016-18). Under ASU 2016-18, an entity will be required to explain changes in the statement of cash flows during the period in the total of cash, cash equivalents, and amounts generally described as restricted cash or restricted cash equivalents. Therefore, amounts generally described as restricted cash and restricted cash equivalents should be included with cash and cash equivalents when reconciling the beginning-of-period and end-of-period total amounts shown on the statement of cash flows. The amendments in this update should be applied using retrospective transition method to each period presented. Companies are required to adopt the new standard for fiscal years beginning after December 15, 2017. Early adoption of ASU 2016-18 is permitted, including adoption in an interim period. The Company has early adopted this standard during the first quarter of 2017.
INVESTMENTS
Investments are deemed to be "available for sale" and are, accordingly, carried at fair value being the quoted market value. Unrealized investment gains or losses, net of deferred taxes, are reported as a separate component of comprehensive income or loss until sold.
ACCOUNTS RECEIVABLE AND ALLOWANCES
We perform periodic credit evaluations of our customers and generally do not require collateral. Accounts receivable are due under a range of terms we offer to our customers. Discounts are offered, in most instances, as an incentive for early payment.
We base our allowances related to receivables on historical credit and collections experience, and the specific identification of other potential problems, including the general economic climate. Actual collections can differ, requiring adjustments to the allowances. Individual accounts receivable balances are evaluated on a monthly basis, and those balances considered uncollectible are charged to the allowance.
The following table presents the activity in our accounts receivable allowances (in thousands):
|
|
|
|
|
|
Additions |
|
|
|
|
|
|
|
|
|
|
|
|
|
Charged to |
|
|
|
|
|
|
|
|
|
|
Beginning |
|
Costs and |
|
|
|
Ending |
||||
|
|
|
Balance |
|
Expenses |
|
Deductions* |
|
Balance |
||||
|
Year Ended December 30,2017: |
|
|
|
|
|
|
|
|
|
|
|
|
|
Allowance for possible losses on accounts receivable |
|
$ |
2,845 |
|
$ |
28,102 |
|
$ |
(28,523) |
|
$ |
2,424 |
|
Year Ended December 31, 2016: |
|
|
|
|
|
|
|
|
|
|
|
|
|
Allowance for possible losses on accounts receivable |
|
$ |
2,672 |
|
$ |
28,405 |
|
$ |
(28,232) |
|
$ |
2,845 |
|
Year Ended December 26, 2015: |
|
|
|
|
|
|
|
|
|
|
|
|
|
Allowance for possible losses on accounts receivable |
|
$ |
2,390 |
|
$ |
20,538 |
|
$ |
(20,256) |
|
$ |
2,672 |
*Includes accounts charged off, discounts given to customers and actual customer returns and allowances.
We record estimated sales returns, discounts, and other applicable adjustments as a reduction of net sales in the same period revenue is recognized.
32
Accounts receivable retainage amounts related to long term construction contracts totaled $4.8 million and $6.0 million as of December 30, 2017 and December 31, 2016, respectively. All amounts are expected to be collected within 18 months. Concentration of accounts receivable related to our largest customer totaled $55.9 million and $34.0 million as of December 30, 2017 and December 31, 2016, respectively.
INVENTORIES
Inventories are stated at the lower of cost or market. The cost of inventories includes raw materials, direct labor, and manufacturing overhead. Cost is determined on a weighted average basis. Raw materials consist primarily of unfinished wood products expected to be manufactured or treated prior to sale, while finished goods represent various manufactured and treated wood products ready for sale. We have inventory on consignment at customer locations valued at $14.8 million as of December 30, 2017 and $12.2 million as of December 31, 2016.
PROPERTY, PLANT, AND EQUIPMENT
Property, plant, and equipment are stated at cost. Expenditures for renewals and betterments are capitalized, and maintenance and repairs are expensed as incurred. Amortization of assets held under capital leases is included in depreciation and amortized over the shorter of the estimated useful life of the asset or the lease term. Depreciation is computed principally by the straight-line method over the estimated useful lives of the assets as follows:
|
Land improvements |
|
5 to 15 years |
|
Buildings and improvements |
|
10 to 32 years |
|
Machinery, equipment and office furniture |
|
2 to 8 years |
LONG-LIVED ASSETS
In accordance with ASC 360, Property, Plant, and Equipment (“ASC 360”), when an indicator of potential impairment exists, we evaluate the recoverability of our long-lived assets by determining whether unamortized balances could be recovered through undiscounted future operating cash flows over the remaining lives of the assets. If the sum of the expected future cash flows was less than the carrying value of the assets, an impairment loss would be recognized for the excess of the carrying value over the fair value.
LEASES
In February 2016, the Financial Accounting Standards Board (FASB) issued Accounting Standard Update (ASU) No. 2016‑02, “Leases (Topic 842)” (ASU 2016‑02). Under ASU 2016‑02, an entity will be required to recognize assets and liabilities for the rights and obligations created by leases on the entity’s balance sheet for both finance and operating leases. For leases with a term of 12 months or less, an entity can elect to not recognize lease assets and lease liabilities and expense the lease over a straight-line basis for the term of the lease. ASU 2016‑02 will require new disclosures that depict the amount, timing, and uncertainty of cash flows pertaining to an entity’s leases. Companies are required to adopt the new standard for annual and interim periods beginning after December 15, 2018. Early adoption of ASU 2016‑02 is permitted. The FASB has tentatively decided to amend certain aspects of its new leasing standard in an attempt to provide a relief from implementation costs. Specifically, entities may elect not to restate their comparative periods in the period of adoption when transitioning to the new standard. The Company plans to continue to evaluate the effect of the new leasing guidance in 2018; therefore, the quantitative impact has not yet been determined however the Company anticipates only a balance sheet impact.
GOODWILL
Our annual testing date for evaluating goodwill and indefinite-lived intangible asset impairment is the first day of the Company’s fourth fiscal quarter for all reporting units. Additionally, the Company reviews various triggering events throughout the year to ensure that a mid-year impairment analysis is not required.
33
FOREIGN CURRENCY
Our foreign operations use the local currency as their functional currency. Accordingly, assets and liabilities are translated at exchange rates as of the balance sheet date and revenues and expenses are translated using weighted average rates, with translation adjustments included as a separate component of shareholders’ equity. Gains and losses arising from re-measuring foreign currency transactions are included in earnings.
INSURANCE RESERVES
Our wholly-owned insurance company, Ardellis Insurance Ltd.(“Ardellis”), was incorporated on April 21, 2001 under the laws of Bermuda and is licensed as a Class 3A insurer under the Insurance Act 1978 of Bermuda. On April 14, 2017 the U.S. Branch of Ardellis Insurance Ltd. was granted its Certificate of Authority to transact property and casualty insurance lines as an admitted carrier in the State of Michigan.
We are primarily self-insured for certain employee health benefits, and have self-funded retentions for general liability, automobile liability, property and workers’ compensation. We are fully self-insured for environmental liabilities. The general liability, automobile liability, property, workers’ compensation, and certain environmental liabilities are managed through Ardellis; the related assets and liabilities of which are included in the consolidated financial statements as of December 30, 2017 and December 31, 2016. Our policy is to accrue amounts equal to actuarially determined or internally computed liabilities. The actuarial and internal valuations are based on historical information along with certain assumptions about future events. Changes in assumptions for such matters as legal actions, medical cost trends, and changes in claims experience could cause these estimates to change in the future.
In addition to providing coverage for the Company, Ardellis provides Excess Loss Insurance (primarily medical and prescription drug) to certain third parties. As of December 30, 2017, Ardellis had 30 such contracts in place. Reserves associated with these contracts were $3.4 million at December 30, 2017 and $2.5 million at December 31, 2016, and are accrued based on third party actuarial valuations of the expected future liabilities.
INCOME TAXES
Deferred income tax assets and liabilities are computed for differences between the financial statement and tax basis of assets and liabilities that will result in taxable or deductible amounts in the future. Such deferred income tax asset and liability computations are based on enacted tax laws and rates. Valuation allowances are established when necessary to reduce deferred income tax assets to the amounts expected to be realized. Income tax expense is the tax payable or refundable for the period plus or minus the change during the period in deferred income tax assets and liabilities.
REVENUE RECOGNITION
On May 28, 2014, the FASB issued ASU No. 2014‑09 (Accounting Standard Codification 606), Revenue from Contracts with Customers, which will replace most existing revenue recognition guidance in U.S. GAAP. The core principle of the ASU is that an entity should recognize revenue for the transfer of goods or services equal to the amount that it expects to be entitled to receive for those goods or services. The ASU requires additional disclosure about the nature, amount, timing and uncertainty of revenue and cash flows arising from customer contracts, including significant judgments and changes in judgments. The Company is currently finalizing its evaluation of the impact of adopting this new guidance, which is not expected to materially impact the Company's financial condition or results of operations. The five-step model has been applied to existing contracts with customers, and based upon this review, the Company does not expect the adoption of ASU 2014-09 to have a material quantitative impact on its consolidated financial statements, as the timing of revenue recognition for product sales will continue to occur at the point of shipment. Other types of revenue, such as installation and framing, which are immaterial to our total revenue, will continue to be recognized over the appropriate period of time. As required by the standard, the Company expects to make additional disclosures related to the nature, timing and uncertainty of revenue and cash flows arising from contracts with customers. The Company will adopt this standard in the first quarter of fiscal year 2018 using the modified retrospective.
34
Revenue is recognized at the time the product is shipped to the customer. Generally, title passes at the time of shipment. In certain circumstances, the customer takes title when the shipment arrives at the destination. However, our shipping process is typically completed the same day.
Earnings on construction contracts are reflected in operations using percentage-of-completion accounting, under either the cost to cost or units of delivery methods, depending on the nature of the business at individual operations. Under percentage-of-completion using the cost to cost method, revenues and related earnings on construction contracts are measured by the relationships of actual costs incurred related to the total estimated costs. Under percentage-of-completion using the units of delivery method, revenues and related earnings on construction contracts are measured by the relationships of actual units produced related to the total number of units. Revisions in earnings estimates on the construction contracts are recorded in the accounting period in which the basis for such revisions becomes known. Projected losses on individual contracts are charged to operations in their entirety when such losses become apparent.
Our construction contracts are generally entered into with a fixed price and completion of the projects can range from 6 to 18 months in duration. Therefore, our operating results are impacted by, among many other things, labor rates and commodity costs. During the year, we update our estimated costs to complete our projects using current labor and commodity costs and recognized losses to the extent that they exist.
The following table presents the balances of percentage-of-completion accounts on December 30, 2017 and December 31, 2016 which are included in other current assets and other accrued liabilities, respectively (in thousands):
|
|
|
December 30, |
|
December 31, |
||
|
|
|
2017 |
|
2016 |
||
|
Cost and Earnings in Excess of Billings |
|
$ |
5,005 |
|
$ |
2,573 |
|
Billings in Excess of Cost and Earnings |
|
|
4,435 |
|
|
4,748 |
SHIPPING AND HANDLING OF PRODUCT
Shipping and handling costs that are charged to and reimbursed by the customer are recognized as revenue. Costs incurred related to the shipment and handling of products are classified in cost of goods sold.
EARNINGS PER SHARE
The computation of earnings per share (“EPS”) is as follows (in thousands), which incorporate the retroactive effect of the Company’s 3 for 1 stock split:
|
|
|
|
|
|
|
|
|
|
|
|
|
|
December 30, |
|
December 31, |
|
December 26, |
|||
|
|
|
2017 |
|
2016 |
|
2015 |
|||
|
Numerator: |
|
|
|
|
|
|
|
|
|
|
Net earnings attributable to controlling interest |
|
$ |
119,512 |
|
$ |
101,179 |
|
$ |
80,595 |
|
Adjustment for earnings allocated to non-vested restricted common stock |
|
|
(2,225) |
|
|
(1,595) |
|
|
(1,059) |
|
Net earnings for calculating EPS |
|
$ |
117,287 |
|
$ |
99,584 |
|
$ |
79,536 |
|
Denominator: |
|
|
|
|
|
|
|
|
|
|
Weighted average shares outstanding |
|
|
61,416 |
|
|
61,089 |
|
|
60,552 |
|
Adjustment for non-vested restricted common stock |
|
|
(1,143) |
|
|
(963) |
|
|
(795) |
|
Shares for calculating basic EPS |
|
|
60,273 |
|
|
60,126 |
|
|
59,757 |
|
Effect of dilutive stock options |
|
|
90 |
|
|
99 |
|
|
108 |
|
Shares for calculating diluted EPS |
|
|
60,363 |
|
|
60,225 |
|
|
59,865 |
|
Net earnings per share: |
|
|
|
|
|
|
|
|
|
|
Basic |
|
$ |
1.95 |
|
$ |
1.66 |
|
$ |
1.33 |
|
Diluted |
|
$ |
1.94 |
|
$ |
1.65 |
|
$ |
1.33 |
35
No options were excluded from the computation of diluted EPS for 2017, 2016, or 2015.
USE OF ACCOUNTING ESTIMATES
The preparation of financial statements in conformity with accounting principles generally accepted in the United States requires us to make estimates and assumptions that affect the reported amounts of assets and liabilities and disclosure of contingent assets and liabilities at the date of the financial statements as well as the reported amounts of revenues and expenses during the reporting period. We believe our estimates to be reasonable; however, actual results could differ from these estimates.
B.FAIR VALUE
We apply the provisions of ASC 820, Fair Value Measurements and Disclosures, to assets and liabilities measured at fair value. Assets and liabilities measured at fair value are as follows:
|
|
|
December 30, 2017 |
|
December 31, 2016 |
||||||||||||||
|
|
|
Quoted |
|
Prices with |
|
|
|
|
Quoted |
|
Prices with |
|
|
|
||||
|
|
|
Prices in |
|
Other |
|
|
|
|
Prices in |
|
Other |
|
|
|
||||
|
|
|
Active |
|
Observable |
|
|
|
|
Active |
|
Observable |
|
|
|
||||
|
|
|
Markets |
|
Inputs |
|
|
|
|
Markets |
|
Inputs |
|
|
|
||||
|
(in thousands) |
|
(Level 1) |
|
(Level 2) |
|
Total |
|
(Level 1) |
|
(Level 2) |
|
Total |
||||||
|
Money market funds |
|
$ |
64 |
|
$ |
3,071 |
|
$ |
3,135 |
|
$ |
64 |
|
$ |
178 |
|
$ |
242 |
|
Fixed income funds |
|
|
1,182 |
|
|
6,974 |
|
|
8,156 |
|
|
1,676 |
|
|
2,592 |
|
|
4,268 |
|
Equity securities |
|
|
10,710 |
|
|
— |
|
|
10,710 |
|
|
5,609 |
|
|
— |
|
|
5,609 |
|
Mutual funds: |
|
|
|
|
|
|
|
|
|
|
|
|
|
|
|
|
|
|
|
Domestic stock funds |
|
|
367 |
|
|
— |
|
|
367 |
|
|
760 |
|
|
— |
|
|
760 |
|
International stock funds |
|
|
91 |
|
|
— |
|
|
91 |
|
|
72 |
|
|
— |
|
|
72 |
|
Target funds |
|
|
270 |
|
|
— |
|
|
270 |
|
|
235 |
|
|
— |
|
|
235 |
|
Bond funds |
|
|
209 |
|
|
— |
|
|
209 |
|
|
201 |
|
|
— |
|
|
201 |
|
Total mutual funds |
|
|
937 |
|
|
— |
|
|
937 |
|
|
1,268 |
|
|
— |
|
|
1,268 |
|
Total |
|
$ |
12,893 |
|
$ |
10,045 |
|
$ |
22,938 |
|
$ |
8,617 |
|
$ |
2,770 |
|
$ |
11,387 |
|
Assets at fair value |
|
$ |
12,893 |
|
$ |
10,045 |
|
$ |
22,938 |
|
$ |
8,617 |
|
$ |
2,770 |
|
$ |
11,387 |
We maintain money market, mutual funds, bonds, and/or stocks in our non-qualified deferred compensation plan and our wholly owned licensed captive insurance company. These funds are valued at prices quoted in an active exchange market and are included in "Cash and Cash Equivalents", "Investments", and "Other Assets". We have elected not to apply the fair value option under ASC 825, Financial Instruments, to any of our financial instruments except for those expressly required by U.S. GAAP.
The valuations of the Level 2 assets or liabilities rely on quoted prices in markets that are not active or observable inputs over the full term of the asset or liability.
We do not maintain any Level 3 assets or liabilities that would be based on significant unobservable inputs.
During 2017, our wholly-owned captive, Ardellis Insurance Ltd. (“Ardellis”) transferred $4.1 million in fixed income securities from its Investment Account and purchased an additional $4.1 million in fixed income securities which are held in a newly formed collateral trust account in line with regulatory requirements in the State of Michigan to allow Ardellis to act as an admitted carrier in the State. These funds are intended to safeguard the insureds of the Michigan Branch of Ardellis. The funds are classified as “Restricted Investments”.
36
In accordance with our investment policy, our wholly-owned company, Ardellis Insurance Ltd. ("Ardellis"), maintains an investment portfolio, totaling $18.9 million as of December 30, 2017, consisting of mutual funds, domestic and international stocks, and fixed income bonds.
Ardellis’ available for sale investment portfolio consists of the following:
|
|
|
December 30,2017 |
|
December 31,2016 |
||||||||||||||
|
|
|
|
|
|
Unrealized |
|
|
|
|
|
|
|
Unrealized |
|
|
|
||
|
|
|
Cost |
|
Gain/(Loss) |
|
Fair Value |
|
Cost |
|
Gain/(Loss) |
|
Fair Value |
||||||
|
Fixed Income |
|
$ |
8,170 |
|
$ |
(14) |
|
$ |
8,156 |
|
$ |
4,310 |
|
$ |
(43) |
|
$ |
4,267 |
|
Equity |
|
|
9,185 |
|
|
1,524 |
|
|
10,709 |
|
|
5,181 |
|
|
428 |
|
|
5,609 |
|
Mutual Funds |
|
|
— |
|
|
— |
|
|
— |
|
|
481 |
|
|
(9) |
|
|
472 |
|
Total |
|
$ |
17,355 |
|
$ |
1,510 |
|
$ |
18,865 |
|
$ |
9,972 |
|
$ |
376 |
|
$ |
10,348 |
Our Fixed Income investments consist of short, intermediate, and long term bonds, as well as fixed blend bonds. Within the fixed income investments, we maintain a specific mixture of US treasury notes, US agency mortgage backed securities, private label mortgage backed securities, and various corporate securities. Our equity investments consist of small, mid, and large cap growth and value funds, as well as international equity. The net pre-tax unrealized gain was $1.5 million. Carrying amounts above are recorded in the investments and restricted investments line items within the balance sheet as of December 30, 2017. During 2017, Ardellis reported a net realized gain of $256 thousand which was recorded in interest income on the statement of earnings.
C.BUSINESS COMBINATIONS
We completed the following business combinations in fiscal 2017 and 2016, which were accounted for using the purchase method (in thousands).
|
|
|
|
|
|
Net |
|
|
|
Company |
Acquisition |
|
Intangible |
Tangible |
Operating |
||
|
Name |
Date |
Purchase Price |
Assets |
Assets |
Segment |
||
|
|
October 16, 2017 |
$931 |
$ |
909 |
$ |
22 |
All Other |
|
Silverwater Box |
A manufacturer and distributor of total packaging solutions in timber, plastic, steel, fiberglass, and cardboard. Silverwater Box has annual sales of approximately $2.8 million. The acquisition of Silverwater Box allows us to make progress on our goal of becoming a global provider of packaging solutions. |
||||||
|
|
May 26, 2017 |
$5,042 |
$ |
4,880 |
$ |
162 |
South |
|
Go Boy Pallets, LLC ("Go Boy") |
A manufacturer and distributor of industrial pallets and packaging in Georgia and North Carolina. Go Boy has annual sales of approximately $8 million. The acquisition of Go Boy enabled us to expand our industrial packaging product offering and lumber sourcing in this region. |
||||||
|
|
March 6, 2017 |
$31,818 |
$ |
7,653 |
$ |
24,165 |
South |
|
Robbins Manufacturing Co. ("Robbins") |
A manufacturer of treated wood products with facilities in Florida, Georgia, and North Carolina. Robbins has annual sales of approximately $86 million. The acquisition of Robbins allowed us to expand our presence in this region and serve customers more cost effectively. |
||||||
|
|
|
|
|
|
|
|
|
|
|
|
|
|
|
|
|
|
|
|
|
|
|
|
|
|
|
|
|
|
|
|
|
|
|
|
|
|
|
|
|
|
|
|
|
|
|
|
|
|
|
|
|
|
37
|
|
|
|
|
|
Net |
|
|
|
Company |
Acquisition |
|
Intangible |
Tangible |
Operating |
||
|
Name |
Date |
Purchase Price |
Assets |
Assets |
Segment |
||
|
|
March 6, 2017 |
$22,789 |
$ |
14,341 |
$ |
8,448 |
North |
|
Quality Hardwood Sales, LLC ("Quality") |
A manufacturer and supplier of hardwood products, including components of cabinets used in homes and recreational vehicles. Quality has annual sales of approximately $30 million. The acquisition of Quality enabled us to expand our product offering to include hardwood-based products. |
||||||
|
|
November 29, 2016 |
$9,449 |
$ |
8,553 |
$ |
896 |
All Other |
|
The UBEECO Group Pty. Ltd. ("Ubeeco") |
A manufacturer and distributor of a variety of wood packaging and alternative material products, including boxes, crates, pallets, skids, protective packaging, packaging accessories and loose lumber. Ubeeco has annual sales of approximately $20 million. The acquisition of Ubeeco allows us to make progress on our goal of becoming a global provider of packaging solutions. |
||||||
|
|
September 16, 2016 |
$66,691 |
$ |
17,455 |
$ |
49,236 |
All Other |
|
idX Holdings, Inc. ("idX") |
A designer, manufacturer, and installer of customized interior fixtures and related products used in a variety of commercial structures. idX had annual sales of $300 million. The acquisition of idX enables us to enhance our design, product and service offering to become a tier 1 supplier of interior fixtures to retail customers, and continue to use idX's capabilities to continue to develop new markets for growth. Our goal is to achieve long-term synergies, including: |
||||||
|
|
a. |
Eliminating redundant administrative support costs. |
|||||
|
|
b. |
Using the scale advantage of the Company to reduce material costs of common raw materials. |
|||||
|
|
c. |
Utilizing manufacturing capacity of certain existing locations to supply idX. |
|||||
|
|
d. |
Utilizing idX’s international footprint to identify sourcing opportunities for certain products. |
|||||
|
|
e. |
Cross selling one another’s products and services with our respective customers. |
|||||
|
|
f. |
Collaborating on new product development. |
|||||
|
|
July 29, 2016 |
$1,246 |
$ |
405 |
$ |
841 |
North |
|
Seven D Truss, L.P. |
A manufacturer and distributor of roof and floor trusses. 7D had annual sales of approximately $4.0 million. The acquisition of 7D gave us the opportunity to consolidate operations with our Gordon, Pennsylvania location. |
||||||
|
|
June 30, 2016 |
$10,787 |
$ |
6,817 |
$ |
4,248 |
West |
|
Idaho Western, Inc. ("IWI") |
A supplier of products ranging from lumber and plywood to siding and doors. IWI had annual sales of approximately $21 million. The acquisition of IWI allowed us to expand our presence in Boise, Idaho and consolidate with our Rapid Wood operations. |
||||||
|
|
|
|
|
|
|
|
|
|
|
|
|
|
|
|
|
|
|
|
|
|
|
|
|
|
|
38
|
|
|
|
|
|
Net |
|
|
|
Company |
Acquisition |
|
Intangible |
Tangible |
Operating |
||
|
Name |
Date |
Purchase Price |
Assets |
Assets |
Segment |
||
|
|
November 24, 2014 |
$7,506 |
$ |
7,885 |
$ |
1,498 |
West |
|
Packnet Ltd ("Packnet") |
A supplier of industrial packaging and services based in Eagan, MN. Packnet had annual sales of $9.6 million. The acquisition of Packnet gave us the opportunity to expand our presence in the region. |
||||||
|
|
April 15, 2016 |
$1,682 |
$ |
— |
$ |
1,887 |
North |
|
Capital Components & Millwork, Inc. |
|
||||||
The intangible assets for each acquisition were finalized and allocated to their respective identifiable intangible asset and goodwill accounts during 2017, excluding Silverwater Box.
At December 30, 2017, the amounts assigned to major intangible classes for the business combinations mentioned above are as follows (in thousands):
|
|
|
Non- |
|
|
|
|
|
|
|
|
|
|
Goodwill - |
||
|
|
|
Compete |
|
Customer |
|
|
|
|
|
|
Tax |
||||
|
|
|
Agreements |
|
Relationships |
|
Tradename |
|
Goodwill |
|
Deductible |
|||||
|
Silverwater Box |
|
$ |
— |
|
$ |
— |
|
$ |
— |
|
$ |
909 |
|
$ |
— |
|
Go Boy |
|
|
225 |
|
|
4,655 |
|
|
— |
|
|
— |
|
|
4,880 |
|
Robbins |
|
|
560 |
|
|
3,530 |
|
|
450 |
|
|
3,113 |
|
|
7,653 |
|
Quality |
|
|
830 |
|
|
5,720 |
|
|
400 |
|
|
7,391 |
|
|
14,341 |
|
Ubeeco |
|
|
183 |
|
|
3,847 |
|
|
575 |
|
|
3,948 |
|
|
— |
|
idX |
|
|
2,630 |
|
|
— |
|
|
4,500 |
|
|
10,325 |
|
|
— |
|
7D |
|
|
405 |
|
|
— |
|
|
— |
|
|
— |
|
|
405 |
|
IWI |
|
|
— |
|
|
2,570 |
|
|
1,070 |
|
|
3,177 |
|
|
— |
The business combinations mentioned above were not significant to our operating results individually or in aggregate, and thus pro forma results for 2017 and 2016 are not presented.
E.GOODWILL AND OTHER INTANGIBLE ASSETS
Goodwill represents the excess of the purchase price over the fair value of net tangible and identifiable intangible assets of acquired businesses. Goodwill and intangible assets deemed to have indefinite lives are not amortized, but are subject to impairment tests at least annually in accordance with ASC 350, Intangibles-Goodwill and Other. We review the carrying amounts of goodwill and other non-amortizable intangibles by reporting unit to determine if such assets may be
39
impaired. As the carrying amount of these assets are recoverable based upon a discounted cash flow and market approach analysis, no impairment was recognized.
The changes in the net carrying amount of goodwill by reporting segment for the years ended December 30, 2017 and December 31, 2016, are as follows (in thousands):
|
|
|
North |
|
South |
|
West |
|
All Other |
|
Total |
|||||
|
Balance as of December 26, 2015 |
|
|
43,253 |
|
|
43,625 |
|
|
84,553 |
|
|
9,559 |
|
|
180,990 |
|
2016 Acquisitions |
|
|
— |
|
|
— |
|
|
3,177 |
|
|
14,329 |
|
|
17,506 |
|
Foreign Exchange, Net |
|
|
133 |
|
|
— |
|
|
— |
|
|
(94) |
|
|
39 |
|
Balance as of December 31, 2016 |
|
|
43,386 |
|
|
43,625 |
|
|
87,730 |
|
|
23,794 |
|
|
198,535 |
|
2017 Acquisitions |
|
|
7,391 |
|
|
3,113 |
|
|
— |
|
|
909 |
|
|
11,413 |
|
Foreign Exchange, Net |
|
|
350 |
|
|
— |
|
|
— |
|
|
2,346 |
|
|
2,696 |
|
Balance as of December 30, 2017 |
|
$ |
51,127 |
|
$ |
46,738 |
|
$ |
87,730 |
|
$ |
27,049 |
|
$ |
212,644 |
Indefinite-lived intangible assets totaled $7.4 million and $2.3 million as of December 30, 2017 and December 31, 2016 related to the idX, International, and Consumer Products reporting units which is included in the All Other reportable segment.
The following amounts were included in other amortizable intangible assets, net as of December 30, 2017 and December 31, 2016 (in thousands):
|
|
|
2017 |
|
2016 |
||||||||
|
|
|
|
|
|
Accumulated |
|
|
|
|
Accumulated |
||
|
|
|
Assets |
|
Amortization |
|
Assets |
|
Amortization |
||||
|
Non-compete agreements |
|
$ |
9,841 |
|
$ |
(4,208) |
|
$ |
5,411 |
|
$ |
(1,954) |
|
Customer relationships |
|
|
31,630 |
|
|
(5,986) |
|
|
25,503 |
|
|
(4,351) |
|
Licensing agreements |
|
|
4,589 |
|
|
(3,450) |
|
|
4,589 |
|
|
(2,991) |
|
Patents |
|
|
792 |
|
|
(254) |
|
|
704 |
|
|
(180) |
|
Tradename |
|
|
2,420 |
|
|
(464) |
|
|
— |
|
|
— |
|
Total |
|
$ |
49,272 |
|
$ |
(14,362) |
|
$ |
36,207 |
|
$ |
(9,476) |
Amortization is computed principally by the straight-line method over the estimated useful lives of the intangible assets as follows:
|
|
|
|
|
Weighted Average |
|
Intangible Asset Type |
|
Estimated Useful Life |
|
Amortization Period |
|
Non-compete agreements |
|
5 to 15 years |
|
7.1 years |
|
Customer relationship |
|
5 to 15 years |
|
13.5 years |
|
Licensing agreements |
|
10 years |
|
10 years |
|
Tradename (amortizable) |
|
5 to 15 years |
|
12.9 years |
Amortization expense of intangibles totaled $4.9 million, $2.8 million and $3.5 million in 2017, 2016 and 2015, respectively. The estimated amortization expense for intangibles for each of the five succeeding fiscal years is as follows (in thousands):
|
2018 |
|
$ |
4,879 |
|
2019 |
|
|
4,264 |
|
2020 |
|
|
3,234 |
|
2021 |
|
|
2,979 |
|
2022 |
|
|
2,676 |
|
Thereafter |
|
|
16,878 |
|
Total |
|
$ |
34,910 |
40
F.DEBT
On December 17, 2012, we entered into an unsecured Note Purchase Agreement (the "Agreement") under which we issued our 3.89% Series 2012 A Senior Notes, due December 17, 2022, in the aggregate principal amount of $35 million and our 3.98% Series 2012 B Senior Notes, due December 17, 2024, in the aggregate principal amount of $40 million. Proceeds from the sale of the Series A Senior Notes and Series B Senior Notes were used to repay amounts due on our existing Series 2002‑A Senior Notes, Tranche B totaling $40 million and our revolving credit facility.
On November 3, 2014, the Company entered into a five-year, $295 million unsecured revolving credit facility with a syndicate of U.S. banks led by JPMorgan Chase Bank, N.A., as administrative agent and Wells Fargo Bank, N.A., as syndication agent. The facilities include up to $45 million which may be advanced in the form of letters of credit, and up to $100 million (U.S. dollar equivalent) which may be advanced in Canadian dollars, Australian dollars, pounds Sterling, Euros and such other foreign currencies as may subsequently be agreed upon among the parties. This facility replaced our $265 million unsecured revolving credit facility. Cash borrowings are charged interest based upon an index selected by the Company, plus a margin that is determined based upon the index selected and upon the financial performance of the Company and certain of its subsidiaries. The Company is charged a facility fee on the entire amount of the lending commitment, at a per annum rate ranging from 15 to 32.5 basis points, also determined based upon the Company’s performance. The facility fee is payable quarterly in arrears.
Outstanding letters of credit extended on our behalf on December 30, 2017 and December 31, 2016 aggregated $26.5 million and $25.5 million; respectively, which includes approximately $9.8 million related to industrial development revenue bonds. The Company had an outstanding balance of $59.4 million and 23.9 million on its revolver at December 30, 2017, and December 31, 2016, respectively. After considering letters of credit, the Company had $225.7 million and $261.3 million in remaining availability on its revolver on December 30, 2017, and December 31, 2016, respectively. Additionally, we have $150 million in availability under a "shelf agreement" for long term debt with a current lender. Letters of credit have one year terms and include an automatic renewal clause. The letters of credit related to industrial development revenue bonds are charged an annual interest rate of 110 basis points, based upon our financial performance. The letters of credit related to workers’ compensation are charged an annual interest rate of 75 basis points.
41
Long-term debt obligations are summarized as follows on December 30, 2017 and December 31, 2016 (amounts in thousands):
|
|
|
2017 |
|
2016 |
||
|
Series 2012 Senior Notes Tranche A, due on December 17, 2022, interest payable semi-annually at 3.89% |
|
$ |
35,000 |
|
$ |
35,000 |
|
Series 2012 Senior Notes Tranche B, due on December 17, 2024, interest payable semi-annually at 3.98% |
|
|
40,000 |
|
|
40,000 |
|
Revolving credit facility totaling $295 million due on November 3, 2019, interest payable monthly at a floating rate (2.41% on December 30, 2017 and 1.67% on December 31, 2016) |
|
|
59,422 |
|
|
23,860 |
|
Series 1999 Industrial Development Revenue Bonds, due on August 1, 2029, interest payable monthly at a floating rate (1.08% on December 30, 2017 and 0.52% on December 31, 2016) |
|
|
3,300 |
|
|
3,300 |
|
Series 2000 Industrial Development Revenue Bonds, due on October 1, 2020, interest payable monthly at a floating rate (1.14% on December 30, 2017 and 0.59% on December 31, 2016) |
|
|
2,700 |
|
|
2,700 |
|
Series 2002 Industrial Development Revenue Bonds, due on December 1, 2022, interest payable monthly at a floating rate (1.13% on December 30, 2017 and 0.57% on December 31, 2016) |
|
|
3,700 |
|
|
3,700 |
|
Capital leases and foreign affiliate debt |
|
|
2,058 |
|
|
3,336 |
|
|
|
|
146,180 |
|
|
111,896 |
|
Less current portion |
|
|
(1,329) |
|
|
(2,634) |
|
Less debt issuance costs |
|
|
(177) |
|
|
(203) |
|
Long-term portion |
|
$ |
144,674 |
|
$ |
109,059 |
Financial covenants on the unsecured revolving credit facility and unsecured notes include minimum interest coverage tests and a maximum leverage ratio. The agreements also restrict the amount of additional indebtedness we may incur and the amount of assets which may be sold among other industry standard covenants. We were within all of our lending requirements on December 30, 2017 and December 31, 2016.
On December 30, 2017, the principal maturities of long-term debt and capital lease obligations are as follows (in thousands):
|
2018 |
|
$ |
1,329 |
|
2019 |
|
|
59,737 |
|
2020 |
|
|
2,891 |
|
2021 |
|
|
135 |
|
2022 |
|
|
38,788 |
|
Thereafter |
|
|
43,300 |
|
Total |
|
$ |
146,180 |
On December 30, 2017, the estimated fair value of our long-term debt, including the current portion, was $148.0 million, which was $1.8 million more than the carrying value. The estimated fair value is based on rates anticipated to be available to us for debt with similar terms and maturities. We consider the valuations of our long-term debt, including the current portion, to be Level 2 liabilities which rely on quoted prices in markets that are not active or observable inputs over the full term of the liability.
G.LEASES
We lease certain real estate under operating lease agreements with original terms ranging from one to ten years. We are required to pay real estate taxes and other occupancy costs under these leases. Certain leases carry renewal options of five to fifteen years. We also lease motor vehicles, equipment, and an aircraft under operating lease agreements for
42
periods of one to ten years. Future minimum payments under non-cancelable operating leases on December 30, 2017 are as follows (in thousands):
|
|
|
Operating |
|
|
|
|
Leases |
|
|
2018 |
|
$ |
19,405 |
|
2019 |
|
|
13,187 |
|
2020 |
|
|
9,967 |
|
2021 |
|
|
7,778 |
|
2022 |
|
|
5,947 |
|
Thereafter |
|
|
17,640 |
|
Total minimum lease payments |
|
$ |
73,924 |
Rent expense was approximately $22.3 million, $10.5 million, and $6.3 million in 2017, 2016, and 2015, respectively.
H.DEFERRED COMPENSATION
We have a program whereby certain executives irrevocably elected to defer receipt of certain compensation in 1985 through 1988. Deferred compensation payments to these executives will commence upon their retirement. We purchased life insurance on these executives, payable to us in amounts which, if assumptions made as to mortality experience, policy dividends, and other factors are realized, will accumulate cash values adequate to reimburse us for all payments for insurance and deferred compensation obligations. In the event cash values are not sufficient to fund such obligations, the program allows us to reduce benefit payments to such amounts as may be funded by accumulated cash values. The deferred compensation liabilities and related cash surrender value of life insurance policies totaled $2.0 million and $2.4 million on December 30, 2017 and December 31, 2016, respectively, and are included "Other Liabilities" and "Other Assets," respectively.
We also maintain a non-qualified deferred compensation plan (the "Plan") for the benefit of senior management employees who may elect to defer a portion of their annual bonus payments and salaries. The Plan provides investment options similar to our 401(k) plan, including our stock. The investment in our stock is funded by the issuance of shares to a Rabbi trust, and may only be distributed in kind. Assets held by the Plan totaled approximately $1.0 million and $0.9 million on December 30, 2017 and December 31, 2016 respectively, and are included in "Other Assets." Related liabilities totaled $22.6 million and $17.4 million on December 30, 2017 and December 31, 2016, respectively, and are included in "Other Liabilities" and "Shareholders’ Equity." Assets associated with the Plan are recorded at fair market value. The related liabilities are recorded at fair market value, with the exception of obligations associated with investments in our stock which are recorded at the market value on the date of deferral.
I.COMMON STOCK
In April 2002, our shareholders approved the 2002 Employee Stock Purchase Plan ("Stock Purchase Plan") to succeed the Employee Stock Purchase Plan originally approved in 1994. In April 2008, our shareholders authorized additional shares to be allocated to the Stock Purchase Plan and extended the term of the Stock Purchase Plan to 2018. The plan allows eligible employees to purchase shares of our stock at a share price equal to 85% of fair market value on the purchase date. We have expensed the fair value of the compensation associated with these awards, which approximates the discount. The amount of expense is nominal.
In April 1994, our shareholders approved the Directors’ Retainer Stock Plan ("Stock Retainer Plan"). In April 2007, our shareholders authorized additional shares to be issued pursuant to this plan. The Stock Retainer Plan allows eligible members of the Board of Directors to defer the cash portion of their retainer and committee fees and receive shares of our stock at the time of or following their retirement, disability or death. The number of shares to be received is equal to the amount of the cash portion of their retainer and committee fees deferred multiplied by 110%, divided by the fair market value of a share of our stock at the time of deferral. The number of shares is increased by the amount of dividends paid on the Company’s common stock. We recognized expense for this plan of $1.7 million in 2017, $0.7 million in 2016,
43
and $0.6 million in 2015. Effective January 1, 2017, this plan was amended to allow directors to defer payment of the annual retainer paid in the form of our common stock.
On April 15, 2010, our shareholders approved an amended and restated Long Term Stock Incentive Plan (the "LTSIP”). The LTSIP reserves 1,000,000 shares, plus a balance of unused shares from prior plans of approximately 1.6 million shares, plus an annual increase of no more than 200,000 shares per year which may be added on the dates of our annual shareholder meetings. The LTSIP provides for the grant of stock options, stock appreciation rights, restricted stock, performance shares and other stock-based awards.
On October 18, 2017, the Board of Directors approved a three-for-one split of the Company's outstanding shares of common stock effected as a stock dividend. On November 14, 2017, shareholders of record as of October 31, 2017, received two additional shares for each share held on the record date.
There is no unrecognized compensation expense remaining for stock options in 2017, 2016, and 2015.
A summary of the nonvested restricted stock awards granted under the LTSIP is as follows:
|
|
|
|
|
|
|
|
|
|
|
Weighted- |
|
|
|
|
|
|
|
|
Unrecognized |
|
Average |
|
|
|
|
|
|
Weighted- |
|
Compensation |
|
Period to |
||
|
|
|
Restricted |
|
Average Grant |
|
Expense |
|
Recognize |
||
|
|
|
Awards |
|
Date Fair Value |
|
(in millions) |
|
Expense |
||
|
Nonvested at December 27, 2014 |
|
771,258 |
|
|
12.13 |
|
|
1.7 |
|
1.81 years |
|
Granted |
|
228,963 |
|
|
18.00 |
|
|
|
|
|
|
Vested |
|
(364,926) |
|
|
12.87 |
|
|
|
|
|
|
Forfeited |
|
(11,547) |
|
|
16.28 |
|
|
|
|
|
|
Nonvested at December 26, 2015 |
|
623,748 |
|
|
13.66 |
|
|
5.2 |
|
2.53 years |
|
Granted |
|
350,892 |
|
|
23.96 |
|
|
|
|
|
|
Vested |
|
(180,465) |
|
|
15.66 |
|
|
|
|
|
|
Forfeited |
|
(2,643) |
|
|
21.45 |
|
|
|
|
|
|
Nonvested at December 31, 2016 |
|
791,532 |
|
|
19.32 |
|
|
4.8 |
|
1.51 years |
|
Granted |
|
388,248 |
|
|
32.03 |
|
|
|
|
|
|
Vested |
|
(141,111) |
|
|
12.71 |
|
|
|
|
|
|
Forfeited |
|
(5,043) |
|
|
30.14 |
|
|
|
|
|
|
Nonvested at December 30, 2017 |
|
1,033,626 |
|
$ |
24.24 |
|
$ |
7.1 |
|
1.31 years |
Under the Stock Purchase Plan and LTSIP, we recognized share-based compensation expense of $3.6 million, $2.2 million, and $1.8 million and the related total income tax benefits of $1.0 million, $1.1 million, and $0.9 million in 2017, 2016 and 2015, respectively.
In 2017, 2016 and 2015, cash received from option exercises and share issuances under our plans was $0.7 million, $0.5 million and $1.1 million, respectively. The actual tax benefit realized in 2017, 2016 and 2015 for the tax deductions from option exercises totaled $0.0 million, $0.0 million and $0.4 million, respectively.
On November 14, 2001, the Board of Directors approved a share repurchase program (which succeeded a previous program) allowing us to repurchase up to 2.5 million shares of our common stock. On October 14, 2010, our Board authorized an additional 2 million shares to be repurchased under our share repurchase program. We repurchased 445,740 and 0 shares under this program in 2017 and 2016, respectively. As of December 30, 2017, the cumulative total authorized shares available for repurchase is approximately 2.7 million shares.
J.RETIREMENT PLANS
We have a profit sharing and 401(k) plan for the benefit of substantially all of our employees, excluding the employees of certain wholly-owned subsidiaries. Amounts contributed to the plan are made at the discretion of the Board
44
of Directors. We matched 25% of employee contributions in 2017, 2016, and 2015, on a discretionary basis, totaling $4.8 million, $4.4 million, and $2.4 million respectively. The basis for matching contributions may not exceed the lesser of 6% of the employee’s annual compensation or the IRS limitation.
On July 14, 2011, the compensation committee of the board of directors approved a retirement plan for certain officers of the Company (who have at least 20 years of service with the Company and at least 10 years of service as an officer) whereby we will pay, upon retirement, benefits totaling 150% of the officer’s highest base salary in the three years immediately preceding separation from service plus health care benefits for a specified period of time if certain eligibility requirements are met. Approximately $7.8 million and $6.5 million are accrued in “Other Liabilities” for this plan at December 30, 2017 and December 31, 2016, respectively.
K.INCOME TAXES
Income tax provisions for the years ended December 30, 2017, December 31, 2016, and December 26, 2015 are summarized as follows (in thousands):
|
|
|
2017 |
|
2016 |
|
2015 |
|||
|
Currently Payable: |
|
|
|
|
|
|
|
|
|
|
Federal |
|
$ |
44,413 |
|
$ |
42,397 |
|
$ |
34,672 |
|
State and local |
|
|
8,579 |
|
|
6,341 |
|
|
6,643 |
|
Foreign |
|
|
6,240 |
|
|
6,143 |
|
|
5,599 |
|
|
|
|
59,232 |
|
|
54,881 |
|
|
46,914 |
|
Net Deferred: |
|
|
|
|
|
|
|
|
|
|
Federal |
|
|
(7,681) |
|
|
(455) |
|
|
(1,104) |
|
State and local |
|
|
(864) |
|
|
438 |
|
|
96 |
|
Foreign |
|
|
1,280 |
|
|
310 |
|
|
(36) |
|
|
|
|
(7,265) |
|
|
293 |
|
|
(1,044) |
|
|
|
$ |
51,967 |
|
$ |
55,174 |
|
$ |
45,870 |
The components of earnings before income taxes consist of the following:
|
|
|
2017 |
|
2016 |
|
2015 |
|||
|
U.S. |
|
$ |
151,395 |
|
$ |
140,106 |
|
$ |
115,231 |
|
Foreign |
|
|
24,612 |
|
|
20,565 |
|
|
15,771 |
|
Total |
|
$ |
176,007 |
|
$ |
160,671 |
|
$ |
131,002 |
The effective income tax rates are different from the statutory federal income tax rates for the following reasons:
|
|
|
2017 |
|
2016 |
|
2015 |
|
|
Statutory federal income tax rate |
|
35 |
% |
35 |
% |
35 |
% |
|
State and local taxes (net of federal benefits) |
|
3.0 |
|
3.1 |
|
3.6 |
|
|
Effect of noncontrolling owned interest in earnings of partnerships |
|
(0.2) |
|
(0.2) |
|
(0.3) |
|
|
Manufacturing deduction |
|
(2.5) |
|
(2.4) |
|
(2.4) |
|
|
Tax credits, including foreign tax credit |
|
(2.0) |
|
(1.4) |
|
(1.6) |
|
|
Change in uncertain tax positions reserve |
|
0.4 |
|
0.4 |
|
0.3 |
|
|
Other permanent differences |
|
(0.1) |
|
0.1 |
|
0.7 |
|
|
Other, net |
|
(0.6) |
|
(0.3) |
|
(0.3) |
|
|
Impact of Tax Act and reduction of corporate tax rate |
|
(3.5) |
|
— |
|
— |
|
|
Effective income tax rate |
|
29.5 |
% |
34.3 |
% |
35.0 |
% |
45
Temporary differences which give rise to deferred income tax assets and (liabilities) on December 30, 2017 and December 31, 2016 are as follows (in thousands):
|
|
|
2017 |
|
2016 |
||
|
Employee benefits |
|
$ |
17,048 |
|
$ |
13,375 |
|
Net operating loss carryforwards |
|
|
8,592 |
|
|
13,605 |
|
Foreign subsidiary capital loss carryforward |
|
|
546 |
|
|
509 |
|
Other tax credits |
|
|
709 |
|
|
1,196 |
|
Inventory |
|
|
358 |
|
|
2 |
|
Reserves on receivables |
|
|
714 |
|
|
1,208 |
|
Accrued expenses |
|
|
2,060 |
|
|
8,931 |
|
Other, net |
|
|
1,879 |
|
|
2,323 |
|
Gross deferred income tax assets |
|
|
31,906 |
|
|
41,149 |
|
Valuation allowance |
|
|
(4,706) |
|
|
(5,371) |
|
Deferred income tax assets |
|
|
27,200 |
|
|
35,778 |
|
Depreciation |
|
|
(19,992) |
|
|
(29,971) |
|
Intangibles |
|
|
(19,422) |
|
|
(25,078) |
|
Other, net |
|
|
— |
|
|
— |
|
Deferred income tax liabilities |
|
|
(39,414) |
|
|
(55,049) |
|
Net deferred income tax liability |
|
$ |
(12,214) |
|
$ |
(19,271) |
As of December 30, 2017, the company had federal, state and foreign net operating loss carryforwards of $8.6 million and state tax credit carryforwards of $0.5 million, which will expire at various dates. The Company also has a $0.2 million federal alternative minimum tax credit which it expects to be refunded.
The NOL and credit carryforwards expire as follows:
|
|
|
Net Operating Losses |
|
Tax Credits |
|||||||||||
|
|
|
U.S. |
|
State |
|
Foreign |
|
U.S. |
|
State |
|||||
|
2017 – 2021 |
|
$ |
— |
|
$ |
356 |
|
$ |
2,106 |
|
$ |
— |
|
$ |
270 |
|
2022 - 2026 |
|
|
— |
|
|
391 |
|
|
243 |
|
|
— |
|
|
233 |
|
2027 - 2031 |
|
|
— |
|
|
605 |
|
|
156 |
|
|
— |
|
|
— |
|
2032 - 2036 |
|
|
3,431 |
|
|
804 |
|
|
— |
|
|
— |
|
|
— |
|
Thereafter |
|
|
— |
|
|
419 |
|
|
81 |
|
|
— |
|
|
— |
|
Total |
|
$ |
3,431 |
|
$ |
2,575 |
|
$ |
2,586 |
|
$ |
— |
|
$ |
503 |
As of December 30, 2017, we believe that it is more likely than not that the benefit from certain state and foreign NOL carryforwards as well as certain state tax credit carryforwards will not be realized. In recognition of this risk, we have provided a valuation allowance against various NOL and tax credit carryforwards. Furthermore, there is a valuation allowance of $0.5 million against a capital loss carryforward we have for a wholly-owned subsidiary, UFP Canada, Inc. Based upon the business activity and the nature of the assets of this subsidiary, our ability to realize a future benefit from this carryforward is doubtful. The capital loss has an unlimited carryforward and therefore will not expire unless there is a change in control of the subsidiary.
On December 22, 2017, the U.S. government enacted comprehensive tax legislation commonly referred to as the Tax Cuts and Jobs Act (the ”Tax Act”). The Tax Act makes broad and complex changes to the U.S. tax code that will affect 2017, including, but not limited to, (1) requiring a one-time transition tax on certain unrepatriated earnings of foreign subsidiaries that is payable over eight years and (2) bonus depreciation that will allow for full expensing of qualified property.
The Tax Act also established new tax laws that will affect 2018, including, but not limited to, (1) reduction of the U.S. federal corporate tax rate; (2) elimination of the corporate alternative minimum tax (AMT); (3) the creation of the base erosion anti-abuse tax (BEAT), a new minimum tax: (4) a general elimination of U.S. federal income taxes on dividends from foreign subsidiaries; (5) a new provision designed to tax global intangible low-taxed income (GILTI), which allows for the possibility of using foreign tax credits (FTCs) and a deduction of up to 50 percent to offset the income tax liability
46
(subject to some limitations); (6) a new limitation on deductible interest expense; (7) the repeal of the domestic production activity deduction; (8) limitations on the deductibility of certain executive compensation; (9) limitations on the use of FTCs to reduce the U.S. income tax liability; and (10) limitations on net operating losses (NOLs) generated after December 31, 2017, to 80 percent of taxable income.
The SEC staff issued SAB 118, which provides guidance on accounting for the tax effects of the Tax Act. SAB 118 provides a measurement period that should not extend beyond one year from the Tax Act enactment date for companies to complete the accounting under ASC 740. In accordance with SAB 118, a company must reflect the income tax effects of those aspects of the Act for which the accounting under ASC 740 is complete. To the extent that a company’s accounting for certain income tax effects of the Tax Act is incomplete but it is able to determine a reasonable estimate, it must record a provisional estimate in the financial statements. If a company cannot determine a provisional estimate to be included in the financial statements, it should continue to apply ASC 740 on the basis of the provisions of the tax laws that were in effect immediately before the enactment of the Tax Act.
In connection with our initial analysis of the impact of the Tax Act, we have recorded a discrete net tax benefit of $6.1 million in the period ending December 30, 2017. This net benefit primarily consists of (1) a net benefit for the corporate rate reduction of $8.2 million; (2) a net expense for the write-down of deferred tax assets for stock based compensation that will no longer be deductible for $1.9 million; and (3) a net expense for the transition tax of $0.2 million. For various reasons that are discussed more fully below, we have not completed our accounting for the income tax effects of certain elements of the Tax Act. If we were able to make reasonable estimates of the effects of elements for which our analysis is not yet complete, we recorded provisional adjustments. If we were not yet able to make reasonable estimates of the impact of certain elements, we have not recorded any adjustments related to those elements and have continued accounting for them in accordance with ASC 740 on the basis of the tax laws in effect before the Tax Act.
Our accounting for the following elements of the Tax Act is incomplete. However, we were able to make reasonable estimates of certain effects and, therefore, recorded provisional adjustments as follows:
Reduction of U.S. federal corporate tax rate: The Tax Act reduces the corporate tax rate to 21 percent, effective January 1, 2018. For certain of our DTAs and DTLs, we have recorded a provisional decrease of $13.6 million and $21.8 million, respectively, with a corresponding net adjustment of deferred income tax benefit of $8.2 million for the year ended December 30, 2017. While we are able to make a reasonable estimate of the impact of the reduction in corporate rate, it may be affected by other analysis related to the Tax Act, including, but not limited to, our calculation of deemed repatriation of deferred foreign income and the state tax effect of adjustments made to federal temporary differences.
Deemed Repatriation Transition Tax: The Deemed Repatriation Transition Tax (Transition Tax) is a tax on previously untaxed accumulated and current earnings and profits (E&P) of certain of our foreign subsidiaries. To determine the amount of the Transition Tax, we must determine, in addition to other factors, the amount of post-1986 E&P of the relevant subsidiaries, as well as the amount of non-U.S. income taxes paid on such earnings. We are able to make a reasonable estimate of the Transition Tax and recorded a provisional Transition Tax obligation comprised of $6.3 million tax on foreign earnings and offset by FTCs of $6.1 million. However, we are continuing to gather additional information to more precisely compute the amount of the Transition Tax for any potential state tax effects and we are still evaluating the remaining outside basis differences not closed by the imposition of the transition tax. Tentatively, no changes were made to our ASC 740-30 assertion.
Cost recovery: While we have not yet completed all of the computations necessary or completed an inventory of our 2017 expenditures that qualify for immediate expensing, we have recorded a provisional benefit of $0.1 million based on our current intent to fully expense all qualifying expenditures. This resulted in a decrease of approximately $0.3 million to our current income tax payable and a corresponding increase in our DTLs of approximately $0.2 million (after considering the effects of the reduction in income tax rates).
Our accounting for the following elements of the Tax Act is incomplete, and we were not yet able to make reasonable estimates of the effects. Therefore, no provisional adjustments were recorded.
47
Global intangible low taxed income (GILTI): The Tax Act creates a new requirement that certain income (i.e., GILTI) earned by controlled foreign corporations (CFCs) must be included currently in the gross income of the CFCs’ U.S. shareholder. GILTI is the excess of the shareholder’s “net CFC tested income” over the net deemed tangible income return, which is currently defined as the excess of (1) 10 percent of the aggregate of the U.S. shareholder’s pro rata share of the qualified business asset investment of each CFC with respect to which it is a U.S. shareholder over (2) the amount of certain interest expense taken into account in the determination of net CFC-tested income.
Because of the complexity of the new GILTI tax rules, we are continuing to evaluate this provision of the Tax Act and the application of ASC 740. Under U.S. GAAP, we are allowed to make an accounting policy choice of either (1) treating taxes due on future U.S. inclusions in taxable income related to GILTI as a current-period expense when incurred (the “period cost method”) or (2) factoring such amounts into a company’s measurement of its deferred taxes (the “deferred method”). Our selection of an accounting policy with respect to the new GILTI tax rules will depend, in part, on analyzing our global income to determine whether we expect to have future U.S. inclusions in taxable income related to GILTI and, if so, what the impact is expected to be. Because whether we expect to have future U.S. inclusions in taxable income related to GILTI depends on not only our current structure and estimated future results of global operations but also our intent and ability to modify our structure and/or our business, we are not yet able to reasonably estimate the effect of the provision of the Tax Act. Therefore, we have not made any adjustments related to potential GILTI tax in our financial statements and have not made a policy decision regarding whether to record deferred taxes on GILTI.
Valuation allowances: The company must assess whether valuation allowances assessments are affected by various aspects of the Tax Act (e.g., deemed repatriation of deferred foreign income and the effects on state NOLs, GILTI inclusions, new categories of FTCs). Since, as discussed herein, the company has recorded no amounts related to certain portions of the Tax Act, any corresponding determination of the need for or change in a valuation allowance has not be completed and no changes to valuation allowances as a result of the Tax Act have been recorded.
The remaining provisions of the Tax Act, as listed above, became effective on January 1, 2018 and did not require accounting treatment for the year-ended December 30, 2017. We are currently analyzing the impact of these provisions.
L.ACCOUNTING FOR UNCERTAINTY IN INCOME TAXES
ASC 740, Income Taxes (“ASC 740”) clarifies the accounting for income taxes by prescribing the minimum recognition threshold a tax position is required to meet before being recognized in the financial statements. ASC 740 also provides guidance on derecognition, measurement, classification, interest and penalties, and disclosure requirements.
A reconciliation of the beginning and ending amount of unrecognized tax benefits is as follows (in thousands):
|
|
|
2017 |
|
2016 |
|
2015 |
|||
|
Gross unrecognized tax benefits beginning of year |
|
$ |
3,381 |
|
$ |
2,209 |
|
$ |
1,793 |
|
Increase in tax positions for prior years |
|
|
4 |
|
|
243 |
|
|
— |
|
Increase in tax positions due to acquisitions |
|
|
— |
|
|
362 |
|
|
— |
|
Increase in tax positions for current year |
|
|
1,107 |
|
|
905 |
|
|
754 |
|
Settlements with taxing authorities |
|
|
(2) |
|
|
(32) |
|
|
— |
|
Lapse in statute of limitations |
|
|
(490) |
|
|
(306) |
|
|
(338) |
|
Gross unrecognized tax benefits end of year |
|
$ |
4,000 |
|
$ |
3,381 |
|
$ |
2,209 |
Our effective tax rate would have been affected by the unrecognized tax benefits had this amount been recognized as a reduction to income tax expense.
We recognized interest and penalties for unrecognized tax benefits in our provision for income taxes. The liability for unrecognized tax benefits included accrued interest and penalties of $0.7 million, $0.6 million, and $0.2 million at December 30, 2017, December 31, 2016, and December 26, 2015, respectively.
We file income tax returns in the United States and in various state, local and foreign jurisdictions. The federal and a majority of state and foreign jurisdictions are no longer subject to income tax examinations for years before 2014.
48
A number of routine state and local examinations are currently ongoing. Due to the potential for resolution of state examinations, and the expiration of various statutes of limitation, and new positions that may be taken, it is reasonably possible that the amounts of unrecognized tax benefits could change in the next twelve months is $0.7 million.
M.COMMITMENTS, CONTINGENCIES, AND GUARANTEES
We are self-insured for environmental impairment liability, including certain liabilities which are insured through a wholly owned subsidiary, Ardellis Insurance Ltd., a licensed captive insurance company.
We own and operate a number of facilities throughout the United States that chemically treat lumber products. In connection with the ownership and operation of these and other real properties, and the disposal or treatment of hazardous or toxic substances, we may, under various federal, state, and local environmental laws, ordinances, and regulations, be potentially liable for removal and remediation costs, as well as other potential costs, damages, and expenses. Environmental reserves, calculated with no discount rate, have been established to cover remediation activities at wood preservation facilities in Stockertown, PA; Elizabeth City, NC; Auburndale, FL; and Medley, FL. In addition, a reserve was established for our facility in Thornton, CA to remove certain lead containing materials which existed on the property at the time of purchase.
On a consolidated basis, we have reserved approximately $3.0 million and $3.6 million on December 30, 2017 and December 31, 2016, respectively, representing the estimated costs to complete future remediation efforts. These amounts have not been reduced by an insurance receivable.
Many of our wood treating operations utilize “Subpart W” drip pads, defined as hazardous waste management units by the Environmental Protection Agency. The rules regulating drip pads require that a pad be “closed” at the point that it is no longer intended to be used for wood treating operations or to manage hazardous waste. Closure involves identification and disposal of contaminants which are required to be removed from the facility. The cost of closure is dependent upon a number of factors including, but not limited to, identification and removal of contaminants, cleanup standards that vary from state to state, and the time period over which the cleanup would be completed. Based on our present knowledge of existing circumstances, it is considered probable that these costs will approximate $0.2 million. As a result, this amount is recorded in other long-term liabilities on December 30, 2017.
In February 2014, one of our operations was served with a federal grand jury subpoena from the Southern District of New York. The subpoena was issued in connection with an investigation being conducted by the US Attorney’s Office for the Southern District of New York. The subpoena requested documents relating to a developer and construction projects for which our operation had provided materials and labor. Following receipt of the subpoena, the Audit Committee of the Company’s Board of Directors retained outside counsel to conduct an internal investigation and respond to the subpoena. The Company cooperated in all respects with the US Attorney’s Office, complied with this subpoena and voluntarily provided additional information. As a result of the internal investigation, in 2014, two Company employees were terminated for violating the Company’s Code of Business Conduct and Ethics. In May 2015, those ex-employees were indicted by the grand jury. In April 2016, one of the two former employees pled guilty to four of the charges included in the indictment. In May 2016, the other former employee was found guilty by a jury on four of the charges included in the indictment. The Company has not been named as a target and continues to cooperate with the US Attorney’s Office in this matter. Based upon prior communications with the US Attorney’s Office, we do not believe that the resolution of this matter will have a material adverse impact on our financial condition or the results of our operations.
In addition, on December 30, 2017, we were parties either as plaintiff or defendant to a number of lawsuits and claims arising through the normal course of our business. In the opinion of management, our consolidated financial statements will not be materially affected by the outcome of these contingencies and claims.
On December 30, 2017, we had outstanding purchase commitments on commenced capital projects of approximately $7.7 million.
We provide a variety of warranties for products we manufacture. Historically, warranty claims have not been material. We distribute products manufactured by other companies, some of which are no longer in business. While we do
49
not warrant these products, we have received claims as a distributor of these products when the manufacturer no longer exists or has the ability to pay. Historically, these costs have not had a material affect on our consolidated financial statements.
As part of our operations, we supply building materials and labor to site-built construction projects or we jointly bid on contracts with framing companies for such projects. In some instances we are required to post payment and performance bonds to insure the project owner that the products and installation services are completed in accordance with our contractual obligations. We have agreed to indemnify the surety for claims made against the bonds. As of December 30, 2017, we had approximately $1.4 million in outstanding payment and performance bonds for open projects. We had approximately $7.6 million in payment and performance bonds outstanding for completed projects which are still under warranty.
On December 30, 2017 we had outstanding letters of credit totaling $26.5 million, primarily related to certain insurance contracts and industrial development revenue bonds described further below.
In lieu of cash deposits, we provide irrevocable letters of credit in favor of our insurers to guarantee our performance under certain insurance contracts. We currently have irrevocable letters of credit outstanding totaling approximately $16.7 million for these types of insurance arrangements. We have reserves recorded on our balance sheet, in accrued liabilities, that reflect our expected future liabilities under these insurance arrangements.
We are required to provide irrevocable letters of credit in favor of the bond trustees for all industrial development revenue bonds that have been issued. These letters of credit guarantee principal and interest payments to the bondholders. We currently have irrevocable letters of credit outstanding totaling approximately $9.8 million related to our outstanding industrial development revenue bonds. These letters of credit have varying terms but may be renewed at the option of the issuing banks.
Certain wholly owned domestic subsidiaries have guaranteed the indebtedness of Universal Forest Products, Inc. in certain debt agreements, including the Series 2012 Senior Notes and our revolving credit facility. The maximum exposure of these guarantees is limited to the indebtedness outstanding under these debt arrangements and this exposure will expire concurrent with the expiration of the debt agreements.
We did not enter into any new guarantee arrangements during 2017 which would require us to recognize a liability on our balance sheet.
N.SEGMENT REPORTING
ASC 280, Segment Reporting (“ASC 280”), defines operating segments as components of an enterprise about which separate financial information is available that is evaluated regularly by the chief operating decision maker in deciding how to allocate resources and in assessing performance.
The Company operates manufacturing, treating and distribution facilities throughout North America, Europe, Asia and Australia, but primarily in the United States. The Company manages the operations of its individual locations primarily through a geographic reporting structure under which each location is included in a region and regions are included in our North, South, West, and International divisions. The exceptions to this geographic reporting and management structure are (a) the Company’s Alternative Materials Division, which offers a portfolio of non-wood products and distributes those products nation-wide and is accounted for as a reporting unit within the All Other segment, (b) the Company’s distribution unit (referred to as UFPD) which distributes a variety of products to the manufactured housing industry and is accounted for as a reporting unit within the North segment, and (c) idX division, which designs, manufactures, and installs customized interior fixtures and is accounted for within the All Other segment.
With respect to the facilities in the north, south, and west segments, these facilities generally supply the three markets the Company serves nationally - Retail, Industrial, and Construction. Also, substantially all of our facilities support customers in the immediate geographical region surrounding the facility.
50
Our Alternative Materials, International, and idX divisions have been included in the “All Other” column of the table below. The “Corporate” column includes unallocated administrative costs and certain incentive compensation expense.
|
|
|
2017 |
|
|
|
||||||||||||||||
|
|
|
|
|
|
|
|
|
|
|
|
All |
|
|
|
|
|
|
|
|
|
|
|
|
|
North |
|
South |
|
West |
|
Other |
|
Corporate |
|
Total |
|
|
|
||||||
|
Net sales to outside customers |
|
$ |
1,133,656 |
|
$ |
837,370 |
|
$ |
1,417,924 |
|
$ |
552,232 |
|
$ |
— |
|
$ |
3,941,182 |
|
|
|
|
Intersegment net sales |
|
|
67,161 |
|
|
74,566 |
|
|
83,245 |
|
|
167,568 |
|
|
— |
|
|
392,540 |
|
|
|
|
Interest expense (income) |
|
|
4 |
|
|
160 |
|
|
293 |
|
|
(473) |
|
|
6,234 |
|
|
6,218 |
|
|
|
|
Amortization expense |
|
|
559 |
|
|
607 |
|
|
1,723 |
|
|
1,971 |
|
|
— |
|
|
4,860 |
|
|
|
|
Depreciation expense |
|
|
10,511 |
|
|
6,880 |
|
|
14,116 |
|
|
8,586 |
|
|
8,443 |
|
|
48,536 |
|
|
|
|
Segment earnings from operations |
|
|
61,326 |
|
|
46,646 |
|
|
82,465 |
|
|
17,296 |
|
|
(26,264) |
|
|
181,469 |
|
|
|
|
Segment assets |
|
|
351,270 |
|
|
240,661 |
|
|
462,311 |
|
|
356,264 |
|
|
54,171 |
|
|
1,464,677 |
|
|
|
|
Capital expenditures |
|
|
23,026 |
|
|
12,286 |
|
|
23,212 |
|
|
9,865 |
|
|
2,727 |
|
|
71,116 |
|
|
|
|
|
|
2016 |
||||||||||||||||
|
|
|
|
|
|
|
|
|
|
|
|
All |
|
|
|
|
|
|
|
|
|
|
North |
|
South |
|
West |
|
Other |
|
Corporate |
|
Total |
||||||
|
Net sales to outside customers |
|
$ |
1,000,426 |
|
$ |
711,862 |
|
$ |
1,251,093 |
|
$ |
277,112 |
|
$ |
— |
|
$ |
3,240,493 |
|
Intersegment net sales |
|
|
57,770 |
|
|
38,641 |
|
|
88,311 |
|
|
19,322 |
|
|
— |
|
|
204,044 |
|
Interest expense |
|
|
1 |
|
|
307 |
|
|
387 |
|
|
143 |
|
|
3,737 |
|
|
4,575 |
|
Amortization expense |
|
|
115 |
|
|
— |
|
|
1,858 |
|
|
822 |
|
|
— |
|
|
2,795 |
|
Depreciation expense |
|
|
8,948 |
|
|
6,190 |
|
|
13,326 |
|
|
4,531 |
|
|
7,828 |
|
|
40,823 |
|
Segment earnings from operations |
|
|
59,408 |
|
|
47,146 |
|
|
76,875 |
|
|
16,639 |
|
|
(35,630) |
|
|
164,438 |
|
Segment assets |
|
|
302,009 |
|
|
192,085 |
|
|
438,674 |
|
|
313,304 |
|
|
45,986 |
|
|
1,292,058 |
|
Capital expenditures |
|
|
10,902 |
|
|
5,571 |
|
|
19,648 |
|
|
6,037 |
|
|
11,604 |
|
|
53,762 |
|
|
|
2015 |
||||||||||||||||
|
|
|
|
|
|
|
|
|
|
|
|
All |
|
|
|
|
|
|
|
|
|
|
North |
|
South |
|
West |
|
Other |
|
Corporate |
|
Total |
||||||
|
Net sales to outside customers |
|
$ |
922,092 |
|
$ |
656,550 |
|
$ |
1,133,398 |
|
$ |
175,031 |
|
$ |
— |
|
$ |
2,887,071 |
|
Intersegment net sales |
|
|
51,796 |
|
|
29,940 |
|
|
58,412 |
|
|
13,673 |
|
|
— |
|
|
153,821 |
|
Interest expense |
|
|
— |
|
|
296 |
|
|
516 |
|
|
52 |
|
|
4,269 |
|
|
5,133 |
|
Amortization expense |
|
|
267 |
|
|
9 |
|
|
2,467 |
|
|
788 |
|
|
— |
|
|
3,531 |
|
Depreciation expense |
|
|
7,901 |
|
|
6,255 |
|
|
13,033 |
|
|
3,707 |
|
|
6,814 |
|
|
37,710 |
|
Segment earnings from operations |
|
|
53,879 |
|
|
30,740 |
|
|
70,220 |
|
|
3,038 |
|
|
(22,410) |
|
|
135,467 |
|
Segment assets |
|
|
279,664 |
|
|
192,756 |
|
|
382,251 |
|
|
152,527 |
|
|
100,481 |
|
|
1,107,679 |
|
Capital expenditures |
|
|
9,622 |
|
|
6,138 |
|
|
13,356 |
|
|
6,698 |
|
|
7,708 |
|
|
43,522 |
Information regarding principal geographic areas was as follows (in thousands):
|
|
|
2017 |
|
2016 |
|
2015 |
||||||||||||
|
|
|
|
|
|
Long-Lived |
|
|
|
|
Long-Lived |
|
|
|
|
Long-Lived |
|||
|
|
|
|
|
|
Tangible |
|
|
|
|
Tangible |
|
|
|
|
Tangible |
|||
|
|
|
Net Sales |
|
Assets |
|
Net Sales |
|
Assets |
|
Net Sales |
|
Assets |
||||||
|
United States |
|
$ |
3,821,366 |
|
$ |
313,976 |
|
$ |
3,162,331 |
|
$ |
280,362 |
|
$ |
2,811,359 |
|
$ |
244,040 |
|
Foreign |
|
|
119,816 |
|
|
30,380 |
|
|
78,162 |
|
|
26,106 |
|
|
75,712 |
|
|
15,408 |
|
Total |
|
$ |
3,941,182 |
|
$ |
344,356 |
|
$ |
3,240,493 |
|
$ |
306,468 |
|
$ |
2,887,071 |
|
$ |
259,448 |
Sales generated in Canada and Mexico are primarily to customers in the United States of America.
51
The following table presents, for the periods indicated, our percentage of value-added and commodity-based sales to total sales.
|
|
|
|
|
Commodity-Based |
|
||
|
2017 |
|
|
63.3 |
% |
|
36.7 |
% |
|
2016 |
|
|
62.6 |
% |
|
37.4 |
% |
|
2015 |
|
|
59.8 |
% |
|
40.2 |
% |
Value-added product sales consist of fencing, decking, lattice, and other specialty products sold to the retail building materials market, specialty wood packaging, engineered wood components, in-store fixtures, and wood-alternative products. Engineered wood components include roof trusses, wall panels, and floor systems. Wood-alternative products consist primarily of composite wood and plastics. Although we consider the treatment of dimensional lumber with certain chemical preservatives a value-added process, treated lumber is not presently included in the value-added sales totals. Commodity-based product sales consist primarily of remanufactured lumber and preservative treated lumber.
52
The following table presents, for the periods indicated, our gross sales (in thousands) by major product classification.
|
|
|
Year Ended |
|||||||
|
|
|
December 30, |
|
December 31, |
|
December 26, |
|||
|
|
|
2017 |
|
2016 |
|
2015 |
|||
|
Value-Added Sales |
|
|
|
|
|
|
|
|
|
|
Trusses – residential, modular and manufactured housing |
|
$ |
368,591 |
|
$ |
334,956 |
|
$ |
299,111 |
|
Fencing |
|
|
187,905 |
|
|
176,668 |
|
|
149,526 |
|
Decking and railing – composite, wood and other |
|
|
244,910 |
|
|
200,004 |
|
|
177,787 |
|
Turn-key framing and installed sales |
|
|
149,520 |
|
|
141,474 |
|
|
129,803 |
|
Industrial packaging and components |
|
|
471,262 |
|
|
391,610 |
|
|
374,030 |
|
Engineered wood products (eg. LVL; i-joist) |
|
|
76,507 |
|
|
76,503 |
|
|
67,804 |
|
In-store fixtures |
|
|
260,174 |
|
|
87,262 |
|
|
— |
|
Manufactured brite and other lumber |
|
|
78,638 |
|
|
68,517 |
|
|
59,804 |
|
Wall panels |
|
|
61,226 |
|
|
53,279 |
|
|
46,496 |
|
Outdoor DIY products (eg. stakes; landscape ties) |
|
|
110,327 |
|
|
106,284 |
|
|
56,846 |
|
Construction and building materials (eg. door packages; drywall) |
|
|
265,048 |
|
|
204,732 |
|
|
200,901 |
|
Lattice – plastic and wood |
|
|
48,736 |
|
|
50,556 |
|
|
47,392 |
|
Manufactured brite and other panels |
|
|
75,742 |
|
|
60,753 |
|
|
57,999 |
|
Siding, trim and moulding |
|
|
85,016 |
|
|
66,048 |
|
|
45,215 |
|
Hardware |
|
|
21,218 |
|
|
20,713 |
|
|
17,123 |
|
Manufactured treated lumber |
|
|
17,584 |
|
|
17,412 |
|
|
13,611 |
|
Manufactured treated panels |
|
|
3,329 |
|
|
3,449 |
|
|
5,353 |
|
Other |
|
|
9,275 |
|
|
7,518 |
|
|
5,668 |
|
Total Value-Added Sales |
|
$ |
2,535,008 |
|
$ |
2,067,738 |
|
$ |
1,754,469 |
|
|
|
|
|
|
|
|
|
|
|
|
Commodity-Based Sales |
|
|
|
|
|
|
|
|
|
|
Non-manufactured brite and other lumber |
|
|
576,374 |
|
|
469,042 |
|
|
458,023 |
|
Non-manufactured treated lumber |
|
|
575,505 |
|
|
479,333 |
|
|
423,543 |
|
Non-manufactured brite and other panels |
|
|
271,310 |
|
|
238,806 |
|
|
253,678 |
|
Non-manufactured treated panels |
|
|
34,970 |
|
|
30,374 |
|
|
31,789 |
|
Other |
|
|
13,036 |
|
|
12,084 |
|
|
10,978 |
|
Total Commodity-Based Sales |
|
$ |
1,471,195 |
|
$ |
1,229,639 |
|
$ |
1,178,011 |
|
Total Gross Sales |
|
$ |
4,006,203 |
|
$ |
3,297,377 |
|
$ |
2,932,480 |
|
Sales allowances |
|
|
(65,021) |
|
|
(56,884) |
|
|
(45,409) |
|
Total Net Sales |
|
$ |
3,941,182 |
|
$ |
3,240,493 |
|
$ |
2,887,071 |
53
O.QUARTERLY FINANCIAL INFORMATION (UNAUDITED)
The following table sets forth selected financial information for all of the quarters, consisting of 13 and 14 weeks during the years ended December 30, 2017 and December 31, 2016, respectively, (in thousands, except per share data):
|
|
|
First |
|
Second |
|
Third |
|
Fourth |
||||||||||||||||
|
|
|
2017 |
|
2016 |
|
2017 |
|
2016 |
|
2017 |
|
2016 |
|
2017 |
|
2016 |
||||||||
|
Net sales |
|
$ |
846,130 |
|
$ |
682,151 |
|
$ |
1,072,375 |
|
$ |
872,093 |
|
$ |
1,056,586 |
|
$ |
826,665 |
|
$ |
966,091 |
|
$ |
859,584 |
|
Gross profit |
|
|
120,740 |
|
|
102,739 |
|
|
148,240 |
|
|
131,487 |
|
|
144,687 |
|
|
118,054 |
|
|
129,159 |
|
|
122,310 |
|
Net earnings |
|
|
21,634 |
|
|
20,255 |
|
|
34,574 |
|
|
34,237 |
|
|
34,669 |
|
|
28,764 |
|
|
33,162 |
|
|
22,241 |
|
Net earnings attributable to controlling interest |
|
|
21,062 |
|
|
19,212 |
|
|
33,642 |
|
|
33,398 |
|
|
33,693 |
|
|
27,819 |
|
|
31,115 |
|
|
20,750 |
|
Basic earnings per share |
|
|
0.34 |
|
|
0.32 |
|
|
0.55 |
|
|
0.55 |
|
|
0.55 |
|
|
0.45 |
|
|
0.51 |
|
|
0.34 |
|
Diluted earnings per share |
|
|
0.34 |
|
|
0.32 |
|
|
0.55 |
|
|
0.55 |
|
|
0.55 |
|
|
0.45 |
|
|
0.51 |
|
|
0.34 |
Subsequent to December 30, 2017, the Company completed a sale and lease-back transaction with a property in Medley, Florida. The sale price for the property was approximately $36 million and created a $7 million pre-tax gain. The transaction is part of a strategy to create efficiencies and advantages not possible with the current facility by optimizing the capacity of its other three Florida operations, including two it acquired from Robbins Manufacturing in 2017, and adding a state-of-the-art facility in South Florida. The Company will lease back the Medley, Florida, facility for two years as it executes its long-term plan for Florida and the Southeast region.
54
PRICE RANGE OF COMMON STOCK AND DIVIDENDS
Our common stock trades on The Nasdaq Stock Market (“NASDAQ”) under the symbol UFPI. The following table sets forth the range of high and low sales prices, which incorporate the retroactive effect of the Company’s 3 for 1 stock split, as reported by NASDAQ.
|
Fiscal 2017 |
|
High |
|
Low |
|
Fiscal 2016 |
|
High |
|
Low |
|
Fourth Quarter |
|
39.16 |
|
32.50 |
|
Fourth Quarter |
|
35.70 |
|
27.80 |
|
Third Quarter |
|
32.72 |
|
26.28 |
|
Third Quarter |
|
36.66 |
|
28.26 |
|
Second Quarter |
|
32.80 |
|
28.43 |
|
Second Quarter |
|
30.50 |
|
25.55 |
|
First Quarter |
|
35.70 |
|
31.34 |
|
First Quarter |
|
27.86 |
|
20.35 |
There were approximately 1,450 shareholders of record as of February 23, 2018.
We paid dividends on our common stock of $0.15 and $0.17 per share in June and December 2017, respectively. In June and December 2016, we paid dividends of $0.14 and $0.15 per share, respectively. We intend to continue with our current semi-annual dividend policy for the foreseeable future.
55
The following graph depicts the cumulative total return on our common stock compared to the cumulative total return on the indices for The Nasdaq Stock Market (all U.S. companies) and an industry peer group we selected. The graph assumes an investment of $100 on December 29, 2012, and reinvestment of dividends in all cases.
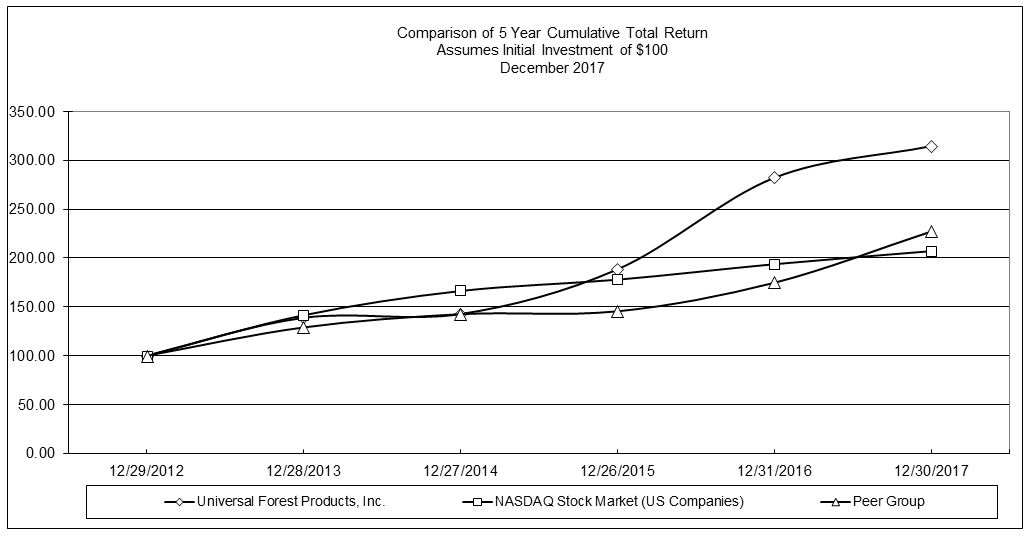
The companies included in our self-determined industry peer group are as follows:
|
American Woodmark Corporation |
Louisiana-Pacific Corporation |
|
Bemis Company, Inc. |
Masco Corporation |
|
BlueLinx Holdings, Inc. |
NCI Building Systems, Inc. |
|
BMC Stock Holdings, Inc. |
Simpson Manufacturing Company,Inc. |
|
Boise Cascade, LLC |
Sonoco Products Company |
|
Builders FirstSource, Inc. |
Trex Company, Inc. |
|
Gibraltar Industries, Inc. |
Westrock Company |
|
Greif Bros. Corporation |
The returns of each company included in the self-determined peer group are weighted according to each respective company’s stock market capitalization at the beginning of each period presented in the graph above. In determining the members of our peer group, we considered companies who selected UFPI as a member of their peer group, and looked for similarly sized companies or companies that are a good fit with the markets we serve.
56
Directors and Executive Officers
|
BOARD OF DIRECTORS |
EXECUTIVE OFFICERS |
|
|
|
|
William G. Currie Chairman of the Board Universal Forest Products, Inc. |
Matthew J. Missad Chief Executive Officer
|
|
|
|
|
Matthew J. Missad Chief Executive Officer Universal Forest Products, Inc. |
Patrick M. Webster President and Chief Operating Officer |
|
|
|
|
John M. Engler Interim President Michigan State University |
Michael R. Cole Chief Financial Officer and Treasurer |
|
|
|
|
Gary F. Goode, CPA Chairman Titan Sales & Consulting, LLC |
Allen T. Peters President UFP Western Division |
|
|
|
|
Thomas W. Rhodes President and Chief Executive Officer TWR Enterprises, Inc. |
Patrick Benton President UFP Northern Division |
|
|
|
|
Bruce A. Merino |
Jonathan West President UFP Southern Division |
|
|
|
|
Mary E. Tuuk Chief Compliance Officer Meijer, Inc. |
Robert D. Coleman Executive Vice President Manufacturing |
|
|
|
|
Brian C. Walker Chief Executive Officer Herman Miller, Inc. |
C. Scott Greene Executive Vice President Marketing |
|
|
|
|
Michael G. Wooldridge Partner Varnum, LLP |
Donald L. James Executive Vice President National Sales |
|
|
|
|
|
Michael F. Mordell Executive Vice President International Operations |
|
|
|
|
|
Chad C. Uhlig Eastin Executive Vice President Purchasing |
57
ANNUAL MEETING
The annual meeting of Universal Forest Products, Inc. will be held at 8:30 a.m. on April 18, 2018, at 2880 East Beltline Lane NE, Grand Rapids, MI 49525.
SHAREHOLDER INFORMATION
Shares of the Company’s stock are traded under the symbol UFPI on the NASDAQ Stock Market. The Company’s 10‑K report, filed with the Securities and Exchange Commission, will be provided free of charge to any shareholder upon written request. For more information contact:
Investor Relations Department
Universal Forest Products, Inc.
2801 East Beltline NE
Grand Rapids, MI 49525
Telephone: (616) 364‑6161
Web: www.ufpi.com
SECURITIES COUNSEL
Varnum, LLP
Grand Rapids, MI
INDEPENDENT REGISTERED PUBLIC ACCOUNTING FIRM
Deloitte & Touche LLP
Grand Rapids, MI
TRANSFER AGENT/SHAREHOLDER INQUIRIES
American Stock Transfer & Trust Company serves as the transfer agent for the Corporation. Inquiries relating to stock transfers, changes of ownership, lost or stolen stock certificates, changes of address, and dividend payments should be addressed to:
American Stock Transfer & Trust Co.
6201 15th Ave
Brooklyn, NY 11219
Telephone: (800) 937‑5449
UNIVERSAL FOREST PRODUCTS®, INC., CORPORATE HEADQUARTERS
2801 East Beltline NE
Grand Rapids, MI 49525
Telephone: (616) 364‑6161
Facsimile: (616) 364‑5558
58
UNIVERSAL FOREST PRODUCTS®, INC., AND ITS AFFILIATES
Locations:
|
Ashburn, GA |
Hillsboro, TX |
Schertz, TX |
|
Athena, OR |
Hudson, NY |
Selma, AL |
|
Auburn, NY |
Huntsville, TX |
Shanghai, China |
|
Auburndale, FL |
Janesville, WI |
Shawnee, OK |
|
Aurora, CO |
Jefferson, GA |
Shibuya-ku, Tokyo, Japan |
|
Bangalore, India |
Jeffersonville, IN |
Sidney, NY |
|
Barnesville, GA |
Kansas City, MO |
Snohomish, WA |
|
Belchertown, MA |
Kearneysville, WV |
Spring Lake, MI |
|
Berlin, NJ |
Kyle, TX |
Stanfield, NC |
|
Biscoe, NC |
Lacolle, Quebec, Canada |
Stockertown, PA |
|
Blanchester, OH |
Lafayette, CO |
Swindon, Wiltshire, United Kingdom |
|
Bomaderry, NSW, Australia |
Liberty, NC |
Tacoma, WA |
|
Bridgeton, MO |
Lockhart, FL |
Thomaston, GA |
|
Burlington, NC |
Locust, NC |
Thornton, CA |
|
Cedar Hill, TX |
Magna, UT |
Union City, GA |
|
Chaffee, NY |
McMinnville, OR |
Warrens, WI |
|
Chandler, AZ |
Medley, FL |
Washington, NC |
|
Chesapeake, VA |
Merciditas, Puerto Rico |
Wenatchee, WA |
|
Chicago, IL |
Mexico City, Mexico |
White Bear Lake, MN |
|
Chino, CA |
Minneota, MN |
White Pigeon, MI |
|
Church Hill, TN |
Morristown, TN |
Windsor, CO |
|
Clinton, NC |
Moultrie, GA |
Woodburn, OR |
|
Columbia, MD |
Muscle Shoals, AL |
Wujiang City, China |
|
Concord, Ontario, Canada |
Nampa, ID |
Yakima, WA |
|
Conway, SC |
Nappanee, IN |
Yeerongpilly, QLD, Australia |
|
Cordele, GA |
Naugatuck, CT |
|
|
Dallas, TX |
New Delhi, India |
|
|
Dayton, OH |
New Hartford, NY |
|
|
Durango, Mexico |
New London, NC |
|
|
Eagan, MN |
New Waverly, TX |
|
|
Earth City, MO |
New Windsor, MD |
|
|
Eatonton, GA |
New York, NY |
|
|
Elizabeth City, NC |
Ontario, CA |
|
|
Elkhart, IN |
Ooltewah, TN |
|
|
Elkwood, VA |
Parker, PA |
|
|
Embalaje, Mexico |
Pearisburg, VA |
|
|
Erskine Park, NSW, Australia |
Peru, IL |
|
|
Folkston, GA |
Plainville, MA |
|
|
Franklinton, NC |
Poulsbo, WA |
|
|
Fredericksburg, VA |
Prairie du Chien, WI |
|
|
Gainesville, GA |
Puyallup, WA |
|
|
Gilmer, TX |
Ranson, WV |
|
|
Gordon, PA |
Riverside, CA |
|
|
Grand Rapids, MI |
Rockwell, NC |
|
|
Grandview, TX |
Saginaw, MI |
|
|
Granger, IN |
Saginaw, TX |
|
|
Greene, ME |
Salina, KS |
|
|
Haleyville, AL |
Salisbury, NC |
|
|
Hamilton, OH |
San Antonio, TX |
|
|
Harrisonville, MO |
Sauk Rapids, MN |
|
59