Attached files
| file | filename |
|---|---|
| 8-K - FORM 8-K - PUBLIC SERVICE ENTERPRISE GROUP INC | d532537d8k.htm |
| EX-99 - EX-99 - PUBLIC SERVICE ENTERPRISE GROUP INC | d532537dex99.htm |
 PSEG
Earnings Conference Call 4
Quarter & Full Year 2017 February 23, 2018 Public Service Enterprise Group EXHIBIT 99.1 th |
| Forward-Looking Statements
Certain of the matters discussed in this presentation about our
and our subsidiaries’ future performance, including, without limitation, future revenues, earnings, strategies, prospects, consequences and all other statements that are not purely historical constitute “forward-looking statements”
within the meaning of the Private Securities Litigation Reform Act of 1995. Such forward-looking statements are subject to risks and uncertainties, which could cause actual results to differ
materially from those anticipated. Such statements are based on management’s beliefs as well as assumptions made by and information currently available to management. When used herein, the words
“anticipate,” “intend,” “estimate,” “believe,” “expect,” “plan,” “should,” “hypothetical,” “potential,” “forecast,” “project,” variations of such words and
similar expressions are intended to identify forward-looking statements. Factors that may cause actual results to differ are often presented with the forward-looking statements themselves. Other factors that could cause actual results to
differ materially from those contemplated in any forward-looking statements made by us herein are discussed in filings we make with the United States Securities and Exchange Commission (SEC) including our Annual Report on Form 10-K and subsequent reports on Form 10-Q and Form 8-K. These factors include, but are not limited to:
• fluctuations in wholesale power
and natural gas markets, including the potential impacts on the economic viability of our generation units; • our ability to obtain adequate fuel supply;
• any inability to manage our
energy obligations with available supply;
• increases in competition in
wholesale energy and capacity markets;
• changes in technology related to
energy generation, distribution and consumption and customer usage patterns; • economic downturns; • third party credit risk relating to our sale of generation output and purchase of
fuel; • adverse
performance of our decommissioning and defined benefit plan trust fund investments and changes in funding requirements; • changes in state and federal legislation and regulations;
• the impact of pending rate case
proceedings; •
regulatory, financial, environmental, health and safety risks associated with our ownership and operation of nuclear facilities; • adverse changes in energy industry laws, policies and regulations, including market
structures and transmission planning;
• changes in federal and state
environmental regulations and enforcement;
• delays in receipt of, or an
inability to receive, necessary licenses and permits;
• adverse outcomes of any legal,
regulatory or other proceeding, settlement, investigation or claim applicable to us and/or the energy industry; • changes in tax laws and regulations;
• the impact of our holding company
structure on our ability to meet our corporate funding needs, service debt and pay dividends; • lack of growth or slower growth in the number of customers or changes in customer
demand; • any
inability of Power to meet its commitments under forward sale obligations; • reliance on transmission facilities that we do not own or control and the impact on our
ability to maintain adequate transmission capacity;
• any inability to successfully
develop or construct generation, transmission and distribution projects; • any equipment failures, accidents, severe weather events or other incidents that impact our ability to provide safe and reliable service to our customers; • our inability to exercise control over the operations of generation facilities in which we
do not maintain a controlling interest;
• any inability to recover the
carrying amount of our long-lived assets and leveraged leases; • any inability to maintain sufficient liquidity;
• any inability to realize
anticipated tax benefits or retain tax credits;
• challenges associated with
recruitment and/or retention of key executives and a qualified workforce; • the impact of our covenants in our debt instruments on our operations; and
• the impact of acts of terrorism,
cybersecurity attacks or intrusions. All of the
forward-looking statements made in this presentation are qualified by these cautionary statements and we cannot assure you that the results or developments anticipated by management
will be realized or even if realized, will have the expected
consequences to, or effects on, us or our business, prospects, financial condition, results of operations or cash flows. Readers are cautioned not to place undue reliance on these forward-looking statements in making any investment decision.
Forward-looking statements made in this presentation apply only as of the date of this presentation. While we may elect to update forward-looking statements from time to time, we specifically disclaim
any obligation to do so, even in light of new information or future events, unless otherwise required by applicable securities laws.
The forward-looking statements contained in this
presentation are intended to qualify for the safe harbor provisions of Section 27A of the Securities Act of 1933, as amended, and Section 21E of the Securities Exchange Act of 1934, as amended. 1 |
 GAAP
Disclaimer PSEG presents Operating Earnings and Adjusted Earnings Before
Interest, Taxes, Depreciation and Amortization (EBITDA) in addition to its
Net Income reported in accordance with accounting principles generally accepted in the United States (GAAP). Operating Earnings and Adjusted EBITDA are non-GAAP financial measures that differ from Net Income. Non-GAAP Operating
Earnings exclude the impact of returns (losses) associated with the Nuclear
Decommissioning Trust (NDT), Mark-to-Market (MTM) accounting and
material one-time items. Non-GAAP Adjusted EBITDA excludes the same items as our non-GAAP Operating Earnings measure as well as income tax expense, interest expense and depreciation and amortization. The last three slides in this
presentation (Slides A, B and C) include a list of items excluded from Net
Income/(Loss) to reconcile to non-GAAP Operating Earnings and
non-GAAP Adjusted EBITDA with a reference to those slides included on each of the slides where the non-GAAP information appears. Management uses non-GAAP Operating Earnings in its internal analysis, and in communications with investors and analysts, as a
consistent measure for comparing PSEG’s financial performance to previous
financial results. Management believes non-GAAP Adjusted EBITDA is
useful to investors and other users of our financial statements in evaluating operating performance because it provides them with an additional tool to compare business performance across companies and across periods. Management also
believes that non-GAAP Adjusted EBITDA is widely used by investors to measure
operating performance without regard to items such as income tax expense,
interest expense and depreciation and amortization, which can vary substantially from company to company depending upon, among other things, the book value of assets, capital structure and whether assets were constructed or
acquired. Non-GAAP Adjusted EBITDA also allows investors and other users to assess
the underlying financial performance of our fleet before
management’s decision to deploy capital. The presentation of non-GAAP Operating Earnings and non-GAAP Adjusted EBITDA is intended to complement, and should not be considered an alternative to, the presentation of Net Income, which is an
indicator of financial performance determined in accordance with GAAP. In addition,
non-GAAP Operating Earnings and non-GAAP Adjusted EBITDA as
presented in this release may not be comparable to similarly titled measures used by other companies. Due to the forward looking nature of non-GAAP Operating Earnings and non-GAAP Adjusted EBITDA guidance, PSEG is unable to
reconcile these non-GAAP financial measures to the most directly comparable GAAP
financial measure. Management is unable to project certain
reconciling items, in particular MTM and NDT gains (losses), for future periods due to market volatility. These materials and other financial releases can be found on the PSEG website at www.pseg.com,
under the Investors tab. From time to time, PSEG, PSE&G and PSEG Power release important information via postings on their corporate website at http://investor.pseg.com.
Investors and other interested parties are encouraged to visit the corporate website to review new postings. The “email alerts” link at http://investor.pseg.com may be used to enroll to receive automatic email alerts and/or really simple syndication (RSS) feeds regarding new postings at http://investor.pseg.com/rss.
2 |
 PSEG
2017 Q4 and Full Year Review
Ralph Izzo Chairman, President and Chief Executive Officer |
 PSEG
– Exceeded mid-point of guidance in 2017,
well positioned for 2018 * See Slides A, B and C for Items excluded from Net Income (Loss) to reconcile to Operating Earnings (non-GAAP).
4 Highlights Net Income of $1.88 vs. Net Loss of $(0.19) per share in Q4 2016; Net Income of $3.10 in 2017
vs. $1.75 per share in 2016 – Tax reform and early retirement of Hudson & Mercer influenced results Non-GAAP Operating Earnings* results of $0.57 vs. $0.54 per share in Q4 2016; Full-year, non-GAAP
Operating Earnings* of $2.93 vs. $2.90 per share in 2016 and 2017 guidance of $2.80 to
$3.00 per share PSE&G non-GAAP results up 8.6%, benefiting from
increased investment in electric and gas T&D PSEG Power results were
at the top end of 2017 guidance, aided by cost control and improved
nuclear performance Operational Excellence Nuclear fleet capacity factor improved to 94%; Hope Creek attained 100% capacity factor & record output
PSE&G named most reliable Utility in the Mid-Atlantic region for the 16th year
in a row Disciplined Capital Investment
PSE&G’s investment program to upgrade transmission, replace cast-iron pipe
and improve the resilience of electric distribution system totaled $3.1
billion in 2017; PSEG Power invested ~$1 billion constructing three new,
highly efficient gas-fired CCGTs; Keys and Sewaren expected to be in-service mid-2018 Regulatory & Policy Focus Filed PSE&G NJ distribution base rate review seeking a modest 1% increase in revenue
PSE&G to return expected benefits of ~$275 million to customers related to lower
tax rates plus returning excess deferred taxes
PSEG Power continues to work with key stakeholders in New Jersey on legislation
supporting continued operation of nuclear capacity as part of a broader
bill that aligns with the state’s energy policy goals |
 PSEG Q4
Results Summary – Solid quarterly results
Quarter ended December 31
*See Slide A for Items excluded from Net Income (Loss) to reconcile to Operating
Earnings (non-GAAP). $ millions (except EPS)
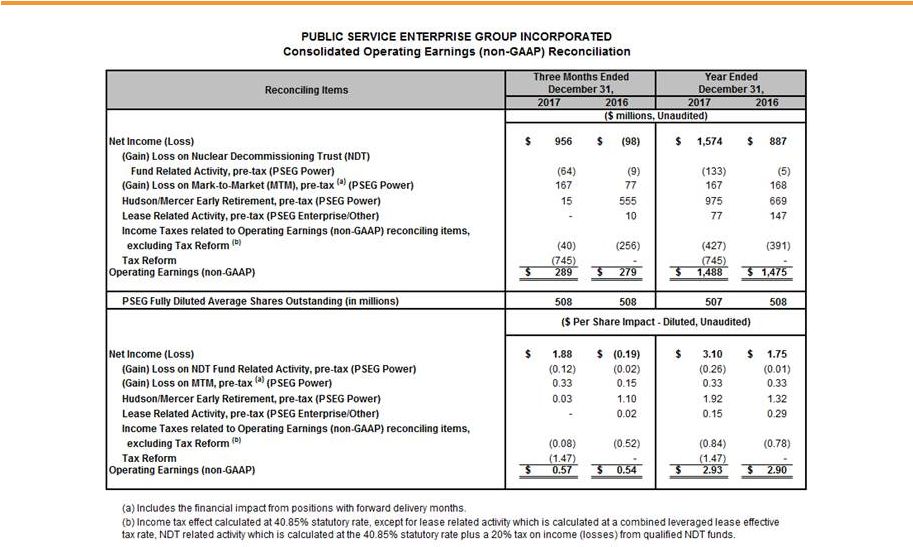
2017 2016 Change Net Income/(Loss) $ 956 $ (98) $ 1,054 Reconciling Items (667) 377 (1,044) Operating Earnings (non-GAAP)* $ 289 $ 279 $ 10 $ 1.88 $ (0.19) $ 2.07 $ 0.57 $ 0.54 $ 0.03 5 EPS from Net Income/(Loss) EPS from Operating Earnings (non-GAAP)* |
 Full Year
Results – Exceeded midpoint of guidance
Twelve Months ended December 31
*See Slide A for Items excluded from Net Income to reconcile to Operating
Earnings (non-GAAP). $ millions (except EPS)
2017 2016 Change Net Income $ 1,574 $ 887 $ 687 Reconciling Items (86) 588 (674) Operating Earnings (non-GAAP)* $ 1,488 $ 1,475 $ 13 EPS from Net Income $ 3.10 $ 1.75 $ 1.35 EPS from Operating Earnings (non-GAAP)* $ 2.93 $ 2.90 $ 0.03 6 |
 PSEG 2017
- Executing on Regulatory and Policy Initiatives
NJ Distribution Base Rate Proceeding Filed NJ base rate review January 12, 2018 Long-Term Infrastructure Investment Platform In July, PSE&G filed for a 5-year, $2.7 billion extension of the Gas System Modernization
Program (GSMP II) In October, the BPU approved $69 million of PSE&G’s request to extend its investment
in Energy Efficiency (EE)
In December, the BPU finalized its rule on the Infrastructure Investment Program (IIP)
providing for 5-year investment programs
PSE&G preparing a multi-year filing for the extension of Energy
Strong PSE&G developing a large, multi-year EE investment program
to bring benefits to a broader group of customers
Preserving the Value of Nuclear Supply Advocating for legislative strategy to recognize the value of nuclear energy under terms
and conditions that provide proper incentives for long-term operation
Ensuring Federal Regulatory and Policy Framework PJM continuing reform of Price Formation on several issues FERC focus on electric system resiliency ongoing through continuing dialogue with RTOs
7 |
 Tax
reform and growth in utility infrastructure investment drives increase in
earnings PSEG –
2018 Non-GAAP Earnings Guidance +6% over 2017
Non-GAAP Operating Earnings* Contribution by Subsidiary (%) 2017 Actual and 2018 Guidance * See Slides A, B and C for Items excluded from Net Income (Loss) to reconcile to Operating Earnings (non-GAAP).
** Based on the mid-point of 2018 non-GAAP Operating Earnings guidance of $3.00 - $3.20 per share. E = Estimate.
8
2017 2018E** $2.93 $3.00 - $3.20E PSE&G represents approximately two-thirds of 2018 Operating Earnings Guidance |
 PSEG
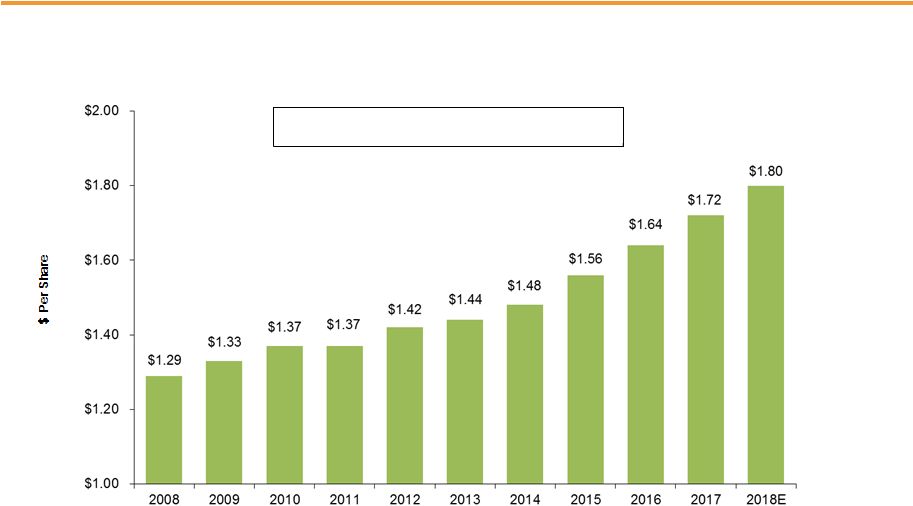
Annual Dividend – Increased 4.7% to $1.80 per share
*INDICATIVE ANNUAL 2018 PSEG COMMON DIVIDEND RATE PER SHARE. E=ESTIMATE.
**2018E PAYOUT RATIO REFLECTS THE INDICATIVE ANNUAL DIVIDEND RATE DIVIDED BY THE MID-POINT OF 2018 NON-GAAP OPERATING EARNINGS GUIDANCE OF $3.00 - $3.20 PER SHARE. 9 Payout Ratio 44% 43% 44% 50% 58% 56% 54% 54% 57% 59% 58%** Building on a 111-year history of returning cash to our shareholders PSEG Annual Dividend Rate 5 year rate of growth: 4.6% 10 year rate of growth: 3.4% |
 PSEG
2017 Q4 Operating Company Review
Dan Cregg EVP and Chief Financial Officer |
 PSEG
– Q4 Results by Subsidiary
GAAP Net Income/(Loss) 2017 2016 Change PSE&G $ 0.43 $ 0.38 $ 0.05 PSEG Power $ 1.20 $ (0.59) $ 1.79 PSEG Enterprise/Other $ 0.25 $ 0.02 $ 0.23 Total PSEG $ 1.88 $ (0.19) $ 2.07 Non-GAAP Operating Earnings* 2017 2016 Change PSE&G $ 0.41 $ 0.38 $ 0.03 PSEG Power $ 0.20 $ 0.13 $ 0.07 PSEG Enterprise/Other $ (0.04) $ 0.03 $ (0.07) Total PSEG* $ 0.57 $ 0.54 $ 0.03 *See Slides A, B and C for Items excluded from Net Income/(Loss) to reconcile to Operating Earnings (non-GAAP) for PSEG, PSE&G, PSEG
Power and PSEG Enterprise/Other.
PSEG Q4 EPS Summary –
Quarter ended December 31
11 |
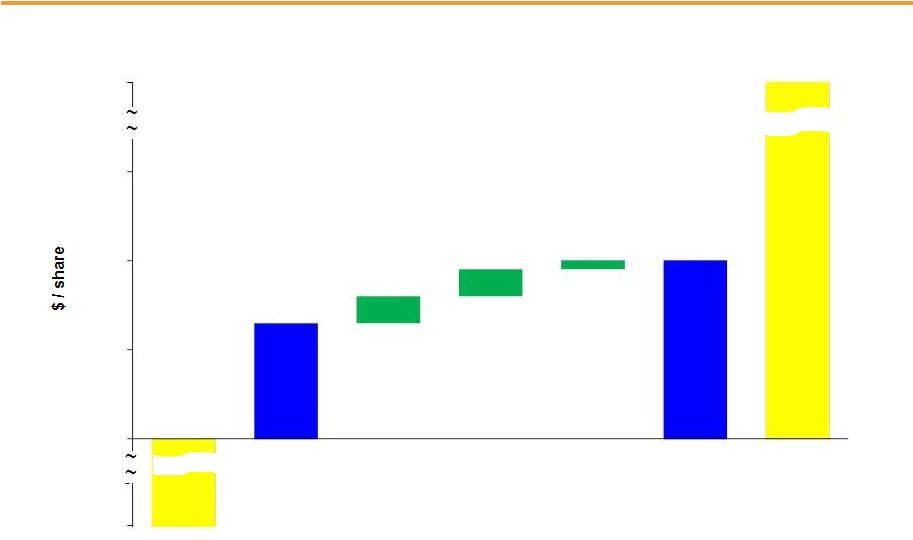
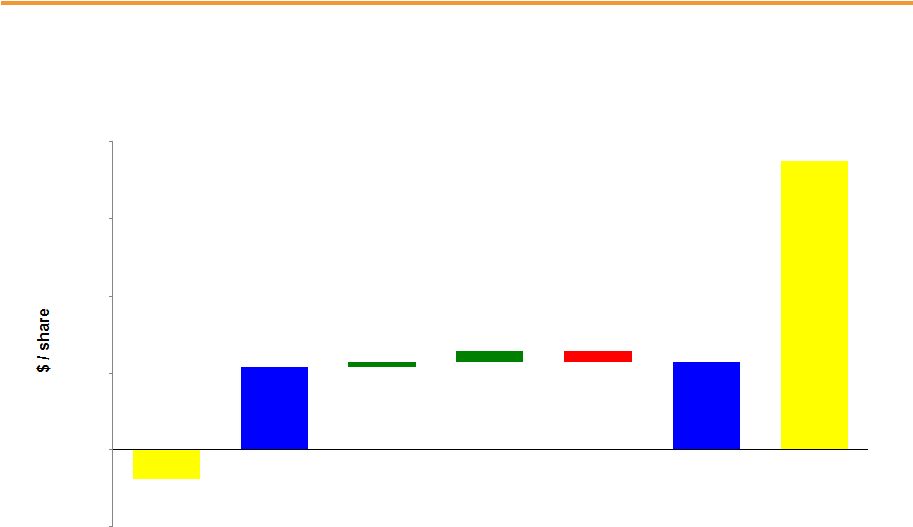 $0.54 0.03 0.07 $0.57 $1.88 ($0.19) -$0.50 $0.00 $0.50 $1.00 $1.50 $2.00 (0.07) PSEG EPS Reconciliation – Q4 2017 versus Q4 2016 * See Slide A for Items excluded from Net Income (Loss) to reconcile to Operating Earnings (non-GAAP).
Q4 2017 Net Income Q4 2016 Net (Loss) PSEG Power PSE&G Enterprise/ Other Q4 2016 Operating Earnings (non-GAAP)* Q4 2017 Operating Earnings (non-GAAP)* Ongoing utility investment, cost control at Power and strong operations contributed to Q4 results Capacity 0.02 Volume 0.01 Gas Send-out 0.01 Re-contracting (0.01) O&M 0.03 Interest, Taxes and Other 0.01 Transmission 0.03 Energy Strong & GSMP recovery 0.01 Weather 0.01 O&M (0.02) PSEG Foundation Contribution (0.03) Tax Items (0.02) Interest and Other (0.02) 12 |
 PSEG
– Year-to-Date Results by Subsidiary
GAAP Net Income/(Loss) 2017 2016 Change PSE&G $ 1.92 $ 1.75 $ 0.17 PSEG Power $ 0.94 $ 0.04 $ 0.90 PSEG Enterprise/Other $ 0.24 $ (0.04) $ 0.28 Total PSEG $ 3.10 $ 1.75 $ 1.35 Non-GAAP Operating Earnings* 2017 2016 Change PSE&G $ 1.90 $ 1.75 $ 0.15 PSEG Power $ 1.00 $ 1.01 $ (0.01) PSEG Enterprise/Other $ 0.03 $ 0.14 $ (0.11) Total PSEG* $ 2.93 $ 2.90 $ 0.03 *See Slides A, B and C for Items excluded from Net Income/(Loss) to reconcile to Operating Earnings (non-GAAP) for PSEG, PSE&G, PSEG
Power and PSEG Enterprise/Other.
PSEG YTD EPS Summary –
Twelve Months ended December 31
13 |
 PSEG EPS
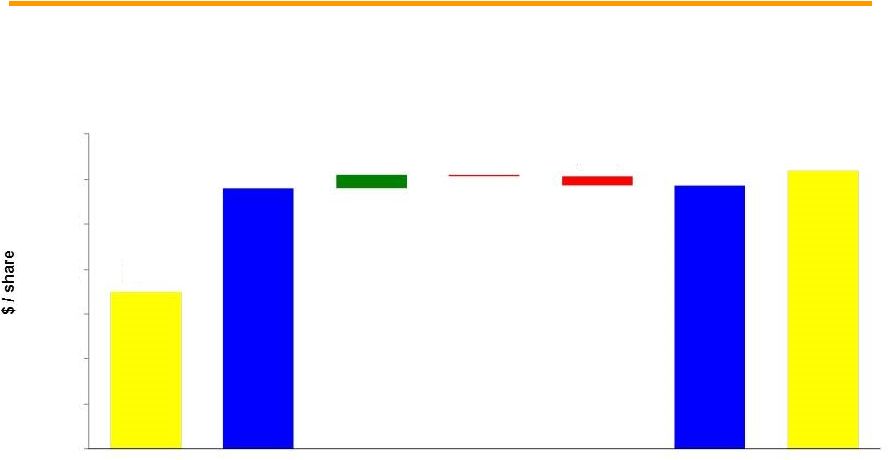
Reconciliation – YTD 2017 versus YTD 2016
* See Slide A for Items excluded from Net Income to reconcile to Operating Earnings (non-GAAP).Year-to-date columns **Prior quarter results may not add to year-to-date totals due to rounding.
Capacity 0.05 Gas Send-out 0.02 Volume (0.01) Re-contracting (0.19) O&M 0.10 Interest 0.04 Taxes and Other (0.02) Transmission 0.14 Energy Strong & GSMP recovery 0.06 Weather (0.02) Distribution O&M 0.01 Distribution D&A (0.03) Taxes and Other (0.01) YTD 2017 Net Income YTD 2016 Net Income PSEG** Power PSE&G** Enterprise/ Other** YTD 2016 Operating Earnings (non-GAAP)* YTD 2017 Operating Earnings (non-GAAP)* Taxes and Other (0.05) Interest Expense (0.03) PSEG Foundation Contribution (0.03) Utility investment and cost control drove full year 2017 results (0.01) 0.15 (0.11) 14 (0.01) 0.15 (0.11) $1.75 $2.90 $2.93 $3.10 $0.00 $0.50 $1.00 $1.50 $2.00 $2.50 $3.00 $3.50 |
 PSE&G 2017 Q4 Review |
 PSE&G
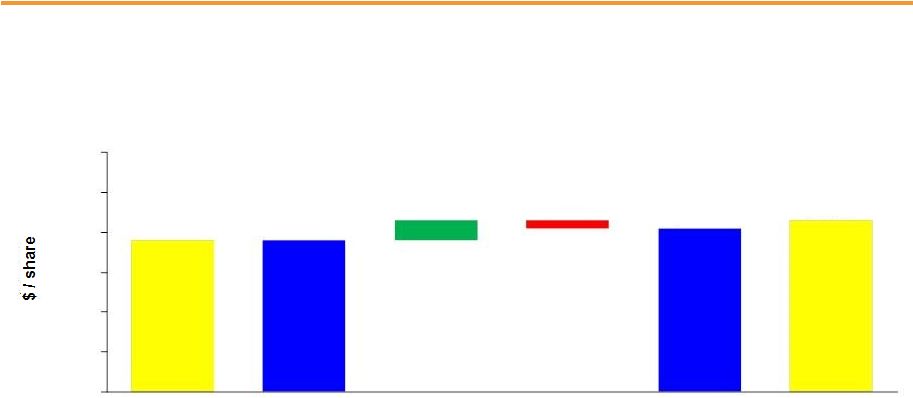
EPS Reconciliation – Q4 2017
versus Q4 2016 * See Slide B for Items excluded from Net Income to reconcile to non-GAAP Operating Earnings for PSE&G.
Continued investment in reliability and resiliency offset higher O&M
16 Transmission 0.03 Energy Strong & GSMP recovery 0.01 Weather 0.01 O&M $0.38 $0.38 0.05 $0.41 $0.43 (0.02) 0.00 0.10 0.20 0.30 0.40 0.50 0.60 Q4 2016 Operating Earnings* (non-GAAP) Q4 2017 Operating Earnings* (non-GAAP) Q4 2017 Net Income Q4 2016 Net Income |
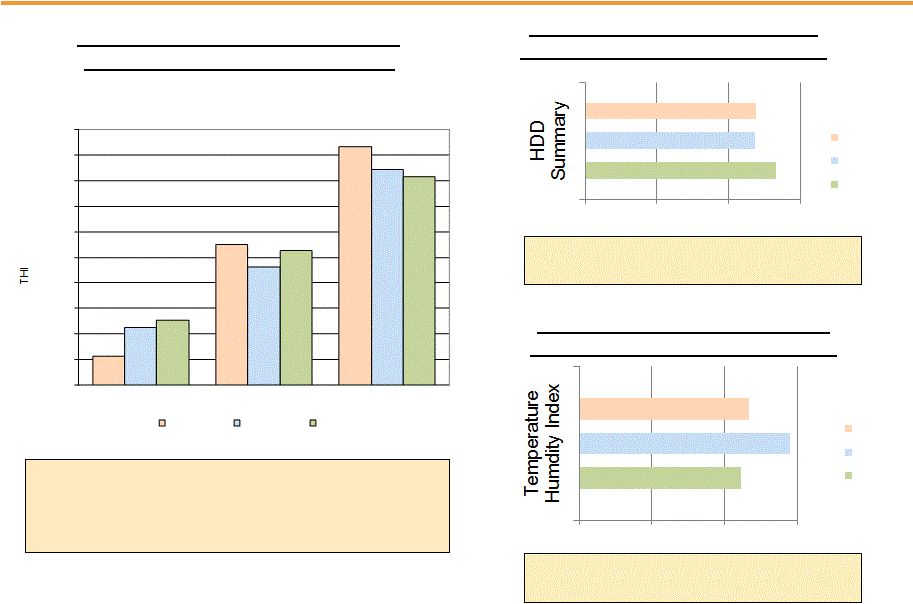 Q4 2017 vs. Q4 2016 vs. Q4 Normal Monthly Heating Degree Days (HDD) October November December Q4 2017 winter weather, as defined by heating degree days, was ~5% colder than Q4 2016 and on par with a Normal Q4 FY 2017 Summer weather was ~14% cooler than 2016 and 3% warmer than Normal 17 Winter Weather Summary (HHD) FY 2017 vs. FY 2016 vs. FY Normal Summer Weather Summary (THI) FY 2017 vs. FY 2016 vs. FY Normal FY 2017 Winter weather was similar to 2016 and ~6% warmer than Normal. 110 552 934 223 460 844 252 526 815 0 100 200 300 400 500 600 700 800 900 1,000 2017 2016 Normal 4,670 4,365 4,385 2,000 3,000 4,000 5,000 2017 2016 Normal 16,126 19,453 16,644 5,000 10,000 15,000 20,000 2017 2016 Normal PSE&G – Q4 & Full Year Weather Summary |
| PSE&G
2018 Distribution Rate Case Filing Summary 18
• Dockets ER 18010029 (Electric) and GR 18010030 (Gas) • Filed January 12, 2018; Anticipate
new rates Fourth Quarter 2018 •
Test year – July 1, 2017 through June 30, 2018 (with certain pro forma adjustments) • Rate base of $9.6B ($5.6B E; $4B G)
as of December 31, 2018 •
ROE request of 10.3%;
Capitalization structure with 54% equity • Requested Increase: ~1% relative to overall revenue • O&M and Sales are roughly flat to
last rate case eight years ago •
Capital recovery beyond clauses and $125M increase in Depreciation rate • Decoupling of revenues from sales volumes • Taxes
– lower tax rate and flow back of deferred taxes to offset storm costs and reduce impact on customer bills • Pending updates: • Taxes - BPU order to lower rates effective April 1 will accelerate savings planned in rate case; update for other tax impacts such as loss of bonus depreciation • 9x3 update to be filed in May
Overall bill for the typical PSE&G residential customer, even
after consideration of the ~1% request, would remain >15% lower than
bills after last base rate case |
 PSE&G
– Q4 Highlights
PSE&G filed its distribution base rate case in mid-January
BPU finalized rules related to the Infrastructure Investment Program (IIP) in December
2018 FERC transmission formula rates placed into effect January 1 were adjusted lower by $148 million to reflect benefits of tax reform; PSE&G anticipates returning $130 million to distribution customers resulting in
a total of ~$275 million to be returned to customers related to tax reform
Residential gas customers receiving BGSS bill credits totaling ~$100
million during Winter 2017-18 Anticipate filing an Energy Strong
extension and a sizable Clean Energy program during 2018
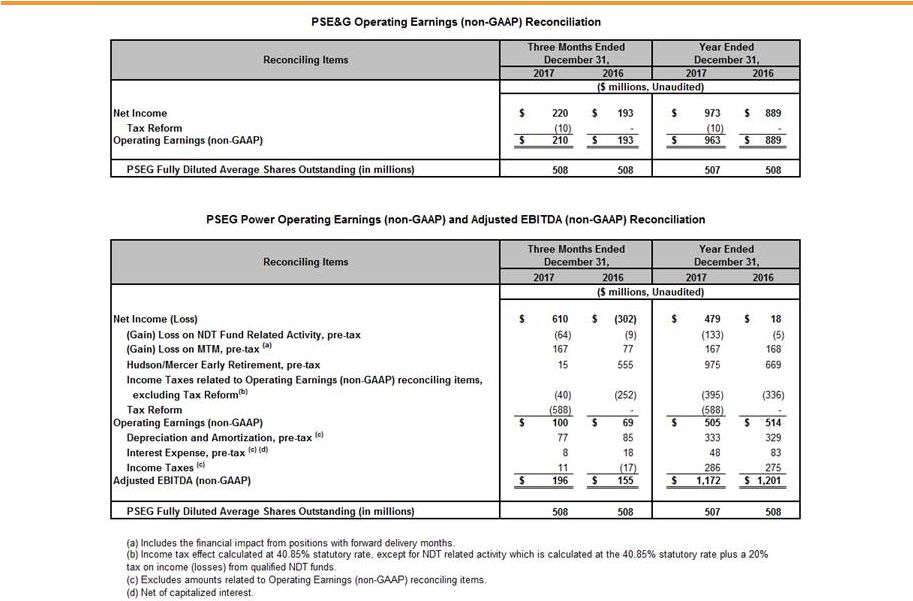
PSE&G 2018 non-GAAP Operating Earnings guidance range is $1,000 - $1,030 million, a 5% increase over 2017 results of $963 million PSE&G invested $3.1 billion in 2017 capital expenditures to upgrade, expand and enhance the reliability
and resiliency of the electric and gas T&D system
Consolidated rate base grew by 12.5% to $17 billion
PSE&G named “Most Reliable Utility” in the Mid-Atlantic region by ReliabilityOne for 16 year in a row On a weather normalized basis, total electric sales were down (0.4%) for the year, as declines in Residential
and Industrial sales more than offset growth in the Commercial segment
Gas sales, adjusted for weather, were up 1.2%, led by the Commercial and
Industrial segments 19
Operations Regulatory and Market Environment Financial th |
 PSEG
Power 2017 Q4 Review |
 21 Capacity 0.02 Volume 0.01 Gas Send-out 0.01 Re-contracting (0.01) PSEG Power EPS Reconciliation – Q4 2017 versus Q4 2016 O&M * See Slide B for Items excluded from Net Income (Loss) to reconcile to Operating Earnings (non-GAAP) for PSEG Power.
Interest, Taxes and Other Q4 2017 Net Income Q4 2016 Net (Loss) Q4 2016 Operating Earnings (non-GAAP)* Q4 2017 Operating Earnings (non-GAAP)* 1.20 0.00 0.30 0.20 0.10 -0.60 ($0.59) Late Q4 weather, fewer outage-related days and stringent cost control drove results $1.20 $0.13 0.03 0.03 0.01 $0.20 |
 Total
Nuclear Total Coal**
Natural Gas * Excludes solar and Kalaeloa. ** Includes figures for Pumped Storage.
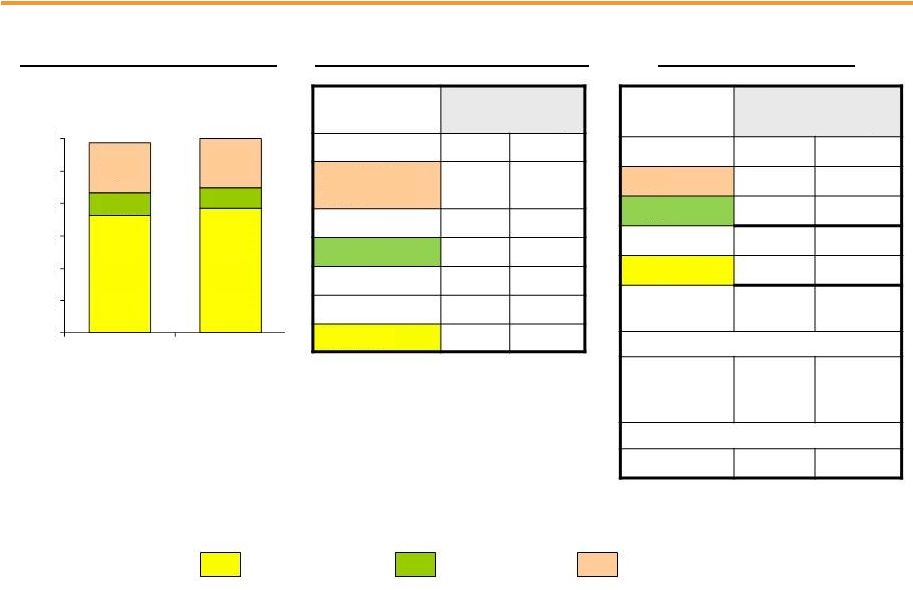
PSEG Power – Generation (GWh)* 11,755 11,999 PSEG Power – Capacity Factors (%) PSEG Power – Fuel Costs 22 7,288 7,675 1,343 1,301 3,124 3,023 0 2,000 4,000 6,000 8,000 10,000 12,000 2016 2017 Quarter ended December 31, 2016 2017 Combined Cycle PJM and NY 41.5% 39.6% Coal** PA 74.5% 71.3% CT 10.1% 12.2% Nuclear 85.3% 89.9% Quarter ended December 31, ($ millions) 2016 2017 Gas $ 58 $ 75 Coal 31 31 Total Fossil 89 106 Nuclear 49 47 Total Fuel Cost $ 138 $ 153 Total Generation (GWh) 11,755 11,999 $ / MWh 11.74 12.75 PSEG Power – Q4 Generation up 2% on improved nuclear output |
 Total
Nuclear Total Coal**
Natural Gas * Excludes solar and Kalaeloa. ** Includes figures for Pumped Storage.
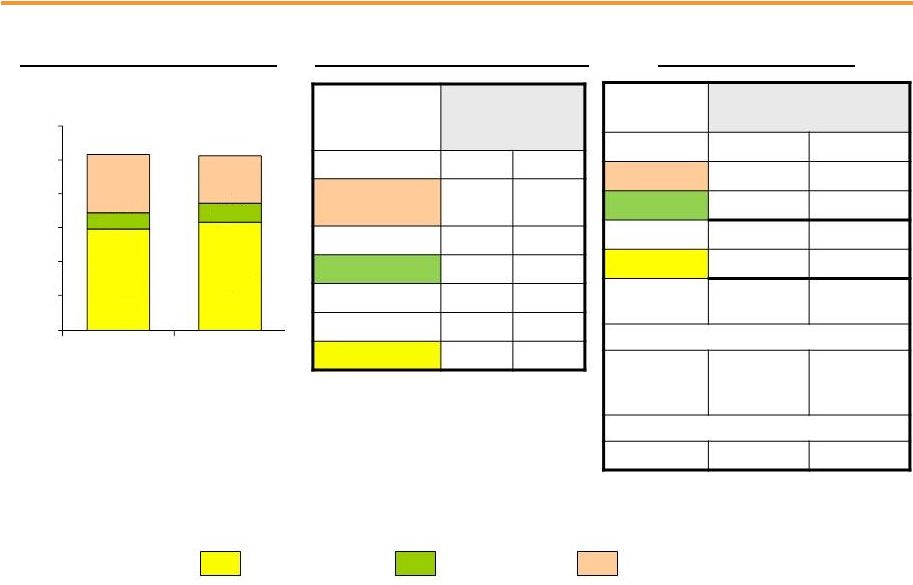
PSEG Power – Generation (GWh)* 51,510 51,089 PSEG Power – Capacity Factors (%) Twelve months ended December 31, 2016 2017 Combined Cycle PJM and NY 57.2% 46.9% Coal** PA 65.1% 77.5% CT 5.4% 6.0% Nuclear 86.9% 93.9% Twelve months ended December 31, ($ millions) 2016 2017 Gas $ 272 $ 300 Coal 109 123 Total Fossil 381 423 Nuclear 203 200 Total Fuel Cost $ 584 $ 623 Total Generation (GWh) 51,510 51,089 $ / MWh 11.34 12.19 PSEG Power – Fuel Costs 23 29,553 31,805 4,776 5,337 17,181 13,947 0 10,000 20,000 30,000 40,000 50,000 60,000 2016 2017 PSEG Power – YTD Generation down ~1% on mild Q1/Q3 weather |
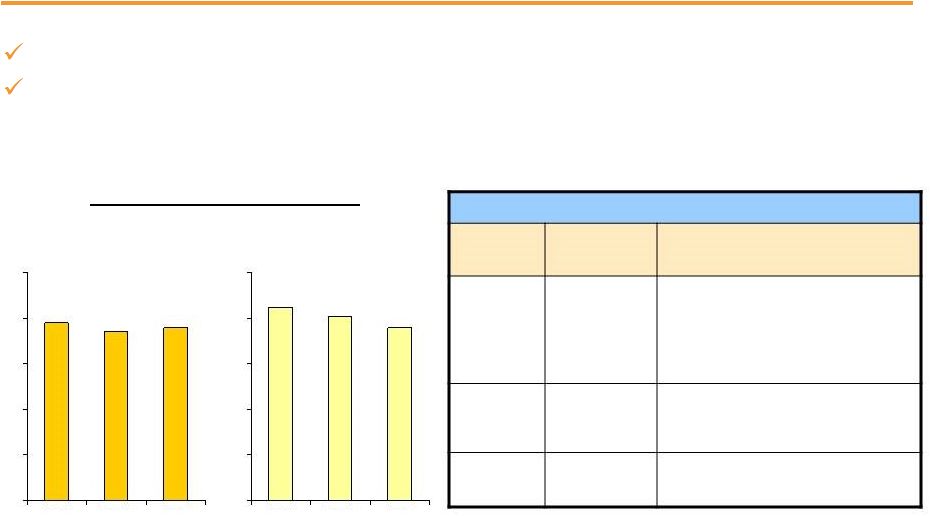 24 PSEG Power – Gross Margin Performance Market prices improved across PJM, NE and NY Capacity revenues step up June 2017 through May 2018 Regional Performance Region Q4 Gross Margin ($M) Q4 2017 Performance PJM $414 Higher market prices and generation output New England $27 Higher prices New York $13 Higher prices PSEG Power Gross Margin ($/MWh) $39 $37 $38 $42 $40 $38 $10 $20 $30 $40 $50 2015 2016 2017 $10 2015 2016 2017 $0 $20 $30 $40 $50 $0 Quarter ended December 31 Twelve Months ended December 31 |
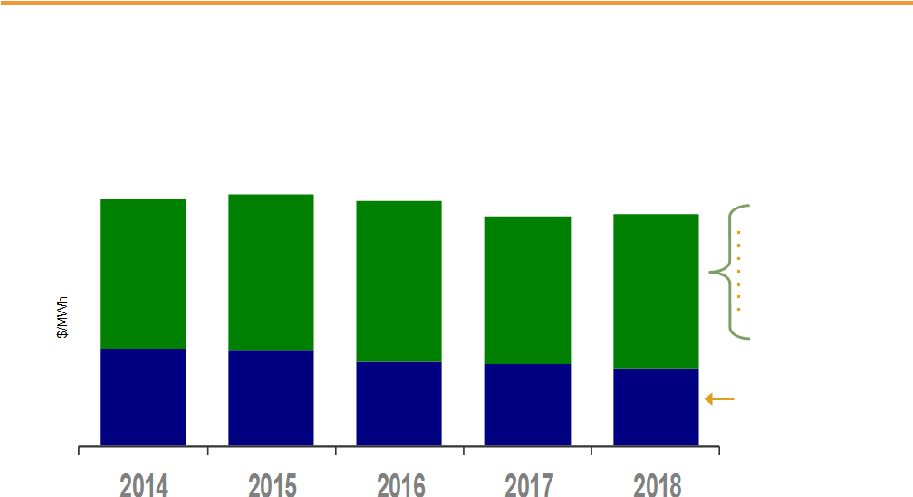 25 Increase in Full Requirements Component Due to: Growing Renewable Energy/Transmission Component for Market Risk Offset by Decline in Energy and Capacity Prices NJ Basic Generation Service (BGS) 2018 Auction Results The BGS auction is a critical component of Power’s annual hedging strategy, accounting for ~ 10 TWh Note: BGS prices are quoted in $/MWh and reflect PSE&G Zone; results from the 2016-2018 auctions will be the new blended prices beginning
June 1, 2018. ~ $59
~ $62 ~ $63
$37 - $38 $33 - $34 $38 - $39 $32 - $33 $30 - $31 $99.54 $97.39 $96.38 $90.78 $91.77 ~ $61 ~ $58 Capacity Load shape Transmission Congestion Ancillary services Risk premium Green Three-Year Average Round the Clock PJM West Forward Energy Price |
 Hedging
Update – Reflects recent BGS auction
Contracted Energy* * HEDGE PERCENTAGES AND PRICES AS OF FEBRUARY 7, 2018 AND REFLECT REVENUES OF FULL REQUIREMENT LOAD DEALS BASED ON CONTRACT PRICE, INCLUDING RENEWABLE ENERGY CREDITS, ANCILLARY, AND TRANSMISSION COMPONENTS BUT EXCLUDING CAPACITY. HEDGES INCLUDE POSITIONS WITH MTM ACCOUNTING TREATMENT AND OPTIONS. 26 2018 2019 2020 Volume TWh 35 34 35 Base Load % Hedged 100% 95-100% 50-55% (Nuclear and Base Load Coal) Price $/MWh $40 $38 $38 Volume TWh 20-22 25-27 28-30 Intermediate, Combined Cycle, % Hedged 50-60% 10-15% 0% Peaking Price $/MWh $40 $38 - Volume TWh 55-57 59-61 63-65 Total % Hedged 80-85% 55-60% 25-30% Price $/MWh $40 $38 $38 |
 Financial Regulatory and Market Environment Operations PSEG Power – Q4 Highlights Q4 output up 2% on higher nuclear production and higher energy prices; full-year 2017 generation
of 51 TWh exceeded projected output of 49-50 TWh
Nuclear fleet’s average capacity factor was ~90% in Q4, producing 7.7 TWh of
energy; Full-year 2017 capacity factor was ~94%, producing an
all-time peak output of 31.8 TWh; Hope Creek achieved a 100% capacity
factor for 2017 CCGT fleet capacity factor was ~47% for the year,
reflecting lower NJ market demand Coal production was up 12% for the full
year, as competitiveness improved with higher gas prices NJ Legislature
continues to evaluate supportive action to preserve nuclear’s economic viability PJM price formation reform discussions continue on multiple issues
BGS load for 2018 projected at 10 TWh; Recent BGS auction set a $91.77/MWh price for
the PS Zone Keys Energy Center and Sewaren 7 targeted for mid-2018
in-service; Bridgeport Harbor 5 targeted for mid-2019
in-service Power invested $1,040 million in 2017 on construction
projects at Keys, Sewaren 7 & Bridgeport Harbor 5 Power’s total
debt as a percentage of capitalization at December 31 was 29% Power
increased its ARO liability by $276 million to reflect increased risk of nuclear plant closure Power’s 2018 non-GAAP Operating Earnings guidance range is $485 - $560 million; non-GAAP Adjusted EBITDA guidance for 2018 is $1,075 to $1,180 million 27 |
 PSEG |
 Tax Cuts
and Jobs Act: PSEG well positioned Our estimates and analysis are
preliminary. The SEC has provided companies one year to finalize 2017 accounting requirements. Further adjustments in 2018 may be required. Positive non-utility contribution to earnings, strong balance sheet maintained
and lower customer bills mitigate the impact of T&D investment
29 Federal Tax Reform PSE&G PSEG Power Enterprise/Other Reduction of Corporate Tax Rate to 21% Customer rates lowered with reduction in tax rate Return of excess deferred tax liability – impact on cash and rate base growth dependent on payback period Estimated excess deferred tax balance of $2.1 Billion at YE 2017 After-tax earnings and cash flow increase One-time, non-cash earnings benefit from reduction in deferred tax liability reflected in 2017 GAAP results: $588 Million After-tax earnings and cash flow increase One-time, non-cash earnings benefit from reduction in deferred tax liability reflected in 2017 GAAP results: $147 Million Expensing of Capital Expenditures Bonus depreciation eliminated post 2017 Rate base growth increases by ~1%/year through 2022 relative to prior tax rules 100% expensing -- cash flow increases Interest Disallowance Rule 30% Limitation Based on Tax – EBITDA Not applicable Well positioned given low debt balance Well positioned given low debt balance |
 Initiating
PSEG 2018 Guidance - By Subsidiary
$ millions (except EPS)
2018E 2017 PSE&G $1,000 - $1,030 $963 PSEG Power $485 - $560 $505 PSEG Enterprise/Other $35 - $35 $20 Operating Earnings (non-GAAP)* $1,520 - $1,625 $1,488 Operating EPS (non-GAAP)* $3.00 - $3.20E $2.93 Segment Operating Earnings Guidance and Prior Results (non-GAAP, except as noted)* $ millions 2018E 2017 PSEG Power $1,075 - $1,180 $1,172 PSEG Power Adjusted EBITDA (non-GAAP)* * See Slides A and C for Items excluded from Net Income to reconcile to Operating Earnings (non-GAAP) and Slide B for Items excluded from Net
Income/(Loss) to reconcile to Operating Earnings (non-GAAP) and
Adjusted EBITDA (non-GAAP). E = Estimate. 30
|
 PSEG
Financial Highlights Initiating 2018 non-GAAP Operating Earnings
guidance of $3.00 - $3.20 per share
PSE&G’s return of tax benefits reduces the customer bill
PSEG’s 5-Year capital spending forecast of $13 -
$15 billion over the 2018 –
2022 period mainly directed at PSE&G capital program PSE&G capital spend forecast of $11.5 - $13.2 billion (GSMP II, Transmission, upcoming filings for Energy Strong and Clean Energy, as well as benefits from tax
reform) supports its five-year, 7 -
9% annual growth in rate base over 2018 –
2022 PSEG Power’s capital program, including completion of new generation, will improve fleet efficiency and geographic diversity Increased 2018 indicative common dividend by 4.7% to $1.80 per share Financial position remains strong: PSEG is a net beneficiary from the Tax Act Cash from Power and increasing cash flow from operations at PSE&G supports dividend growth and funds capital spending program without the need to issue equity
Debt as a percentage of capitalization was 50% at December 31
31 |
 PSEG
Liquidity as of December 31, 2017 32
Expiration Total Available Company Facility Date Facility Usage Liquidity ($ Millions) PSE&G 5-year Credit Facility Mar-22 $600 $15 $585 PSEG Money Pool PSEG / Power 5-year Credit Facilities (PSEG) Mar-22 $1,500 $556 $944 5-Year Credit Facilities (Power) Mar-22 $1,900 $39 $1,861 3-year LC Facilities (Power) Mar-20 $200 $112 $88 Total Money Pool $3,600 $707 $2,893 Total $4,200 $722 $3,478 $0 PSE&G ST Investment $223 Total Liquidity Available $3,701 PSEG Money Pool ST Investment |
 Reconciliation of Non-GAAP Operating Earnings
Please see Slide 2 for an explanation of PSEG’s use of Operating Earnings as a
non-GAAP financial measure and how it differs from Net
Income. A |
 Reconciliation of Non-GAAP Operating Earnings and Non-GAAP
Adjusted EBITDA Please see Slide 2 for an explanation of PSEG’s use of Operating Earnings and Adjusted EBITDA as non-GAAP financial measures and how
they differ from Net Income/(Loss). B |
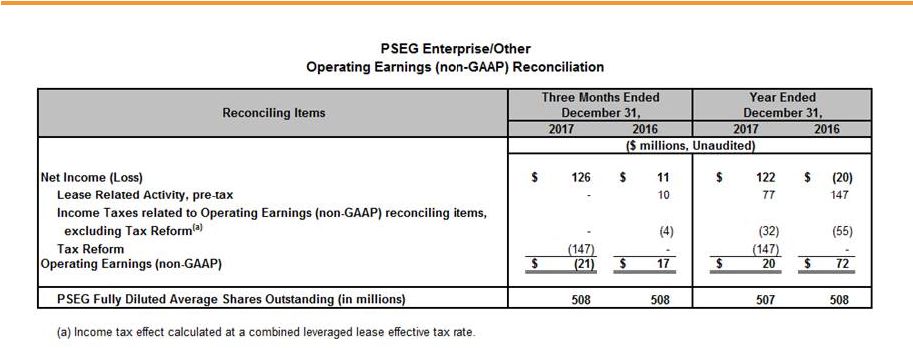 Reconciliation of Non-GAAP Operating Earnings
Please see Slide 2 for an explanation of PSEG’s use of Operating Earnings and
Adjusted EBITDA as non-GAAP financial measures and how they differ from Net Income/(Loss). C |