Attached files
| file | filename |
|---|---|
| 8-K - WEX INC. 8-K - WEX Inc. | a51761862.htm |
Exhibit 99.1

WEX Fourth Quarter 2017 Earnings February 21, 2018
Forward Looking Statements The attached materials and our commentary relating to those materials contain statements about future plans and expectations, which constitute forward-looking statements within the meaning of the Private Securities Litigation Reform Act of 1995. Such forward looking statements are generally stated in terms of the Company’s plans, expectations and intentions. Any statements that are not statements of historical facts are forward-looking statements. When used in the attached materials and our commentary, the words "may," "could," "anticipate," "plan," "continue," "project," "intend," "estimate," "believe," "expect" and similar expressions are intended to identify forward-looking statements, although not all forward-looking statements contain such words. These forward-looking statements are subject to a number of risks and uncertainties that could cause actual results to differ materially, including: the effects of general economic conditions on fueling patterns as well as payment and transaction processing activity; the impact of foreign currency exchange rates on the Company’s operations, revenue and income; changes in interest rates; the impact of fluctuations in fuel prices; the effects of the Company’s business expansion and acquisition efforts; potential adverse changes to business or employee relationships, including those resulting from the completion of an acquisition; competitive responses to any acquisitions; uncertainty of the expected financial performance of the combined operations following completion of an acquisition; the ability to successfully integrate the Company's acquisitions; the ability to realize anticipated synergies and cost savings; unexpected costs, charges or expenses resulting from an acquisition; the Company's failure to successfully operate and expand ExxonMobil's European and Asian commercial fuel card programs; the failure of corporate investments to result in anticipated strategic value; the impact and size of credit losses; the impact of changes to the Company's credit standards; breaches of the Company’s technology systems or those of our third-party service providers and any resulting negative impact on our reputation, liabilities or relationships with customers or merchants; the Company’s failure to maintain or renew key agreements; failure to expand the Company’s technological capabilities and service offerings as rapidly as the Company’s competitors; failure to successfully implement the Company's information technology strategies and capabilities in connection with its technology outsourcing and insourcing arrangements and any resulting cost associated with that failure; the actions of regulatory bodies, including banking and securities regulators, or possible changes in banking or financial regulations impacting the Company’s industrial bank, the Company as the corporate parent or other subsidiaries or affiliates; the impact of the Company’s outstanding notes on its operations; the impact of increased leverage on the Company's operations, results or borrowing capacity generally, and as a result of acquisitions specifically; the incurrence of impairment charges if our assessment of the fair value of certain of our reporting units changes; the uncertainties of litigation; as well as other risks and uncertainties identified in Item 1A of our annual report for the year ended December 31, 2016, filed on Form 10-K with the SEC on March 6, 2017 and our quarterly report on Form 10-Q for the three months ended March 31, 2017 filed with the SEC on May 8, 2017. The Company's forward-looking statements do not reflect the potential future impact of any alliance, merger, acquisition, disposition or stock repurchases. The forward-looking statements speak only as of the date of the attached materials and undue reliance should not be placed on these statements. The Company disclaims any obligation to update any forward-looking statements as a result of new information, future events or otherwise. Non-GAAP Information:For additional important information and disclosure regarding non-GAAP metrics, specifically adjusted net income, please see our most recent earnings release, issued on February 21, 2018, for an explanation and reconciliation of non-GAAP adjusted net income (or “ANI”) to GAAP net income. 2
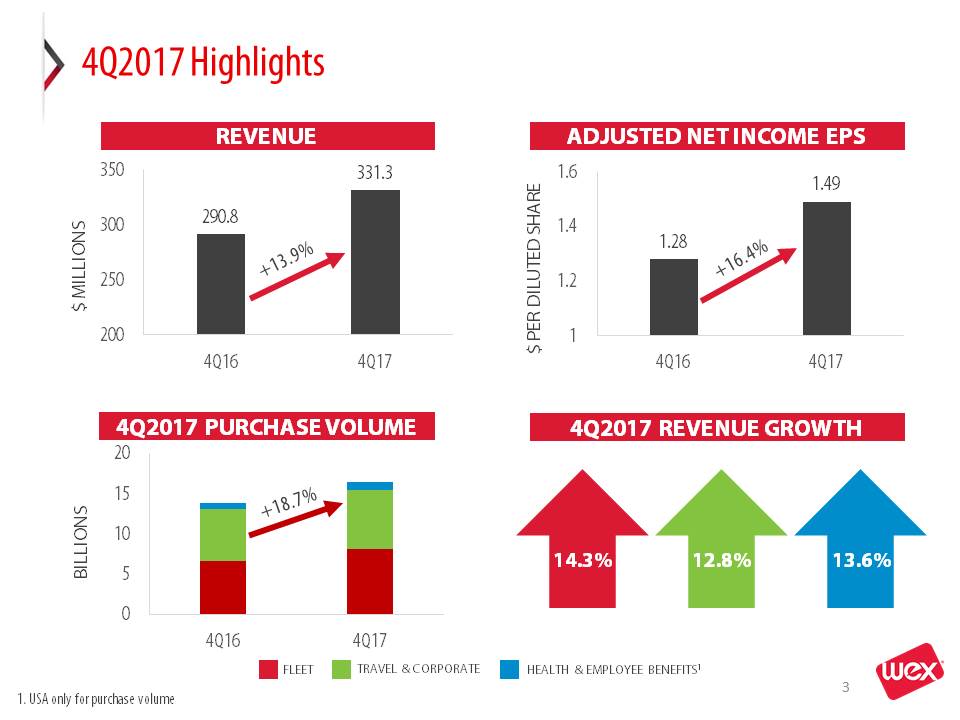
4Q2017 Highlights REVENUE +13.9% $ PER DILUTED SHARE +16.4% ADJUSTED NET INCOME EPS +18.7% 4Q2017 PURCHASE VOLUME $ MILLIONS BILLIONS FLEET TRAVEL & CORPORATE HEALTH & EMPLOYEE BENEFITS1 4Q2017 REVENUE GROWTH 14.3% 12.8% 13.6% 1. USA only for purchase volume 3
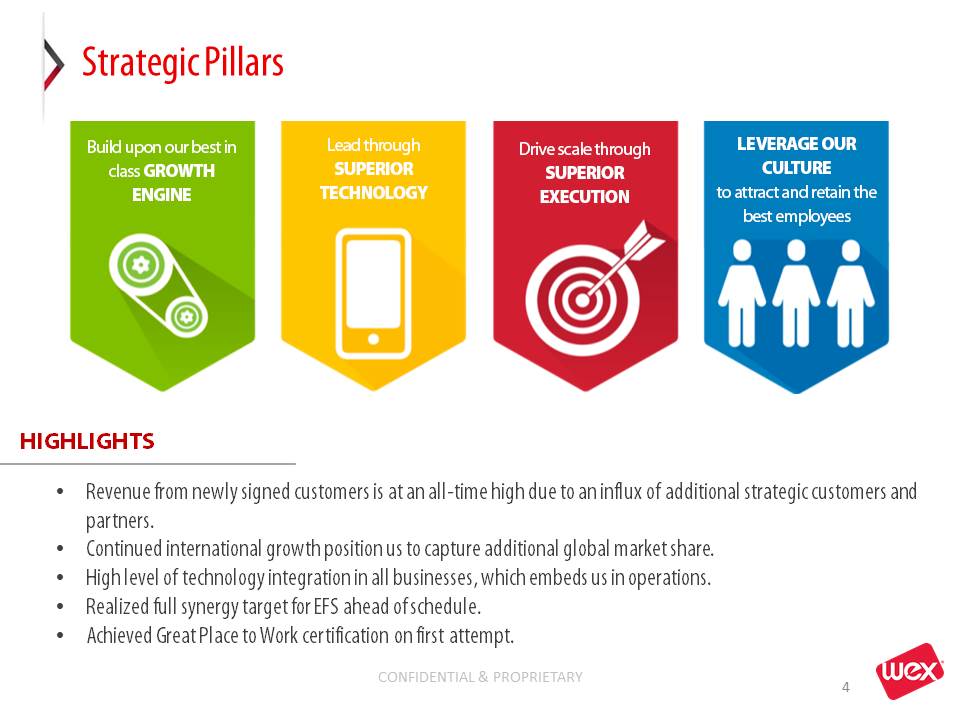
Strategic Pillars HIGHLIGHTS Revenue from newly signed customers is at an all-time high due to an influx of additional strategic customers and partners.Continued international growth position us to capture additional global market share.High level of technology integration in all businesses, which embeds us in operations.Realized full synergy target for EFS ahead of schedule.Achieved Great Place to Work certification on first attempt. 4
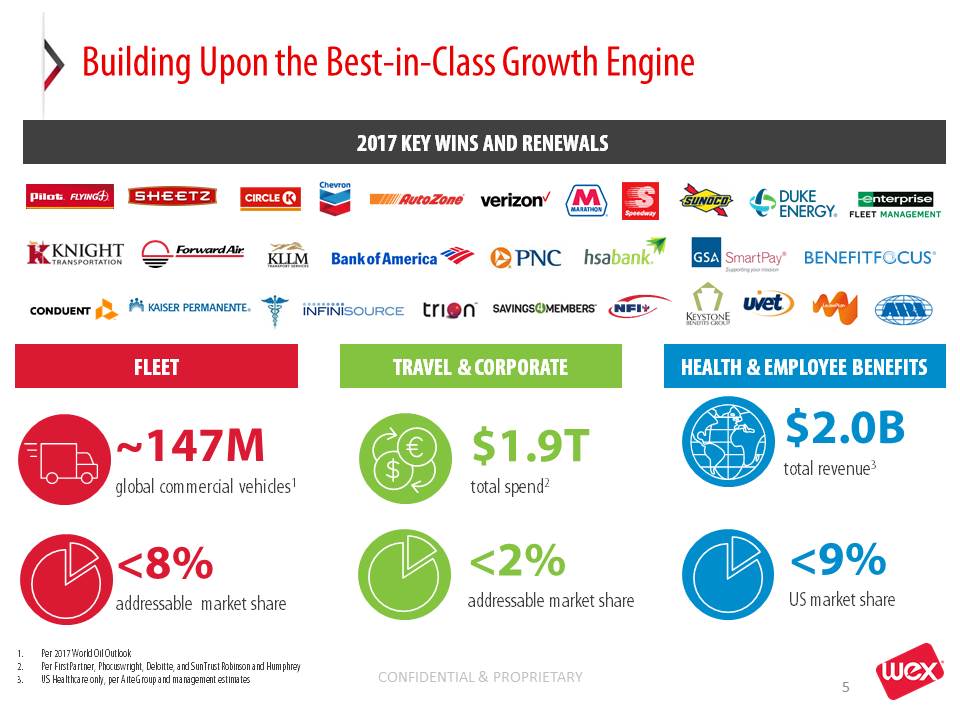
Building Upon the Best-in-Class Growth Engine HEALTH & EMPLOYEE BENEFITS TRAVEL & CORPORATE FLEET ~147M global commercial vehicles1 <8% addressable market share $1.9T total spend2 <2% addressable market share $2.0B total revenue3 <9% US market share Per 2017 World Oil OutlookPer FirstPartner, Phocuswright, Deloitte, and SunTrust Robinson and HumphreyUS Healthcare only, per Aite Group and management estimates 2017 KEY WINS AND RENEWALS 5
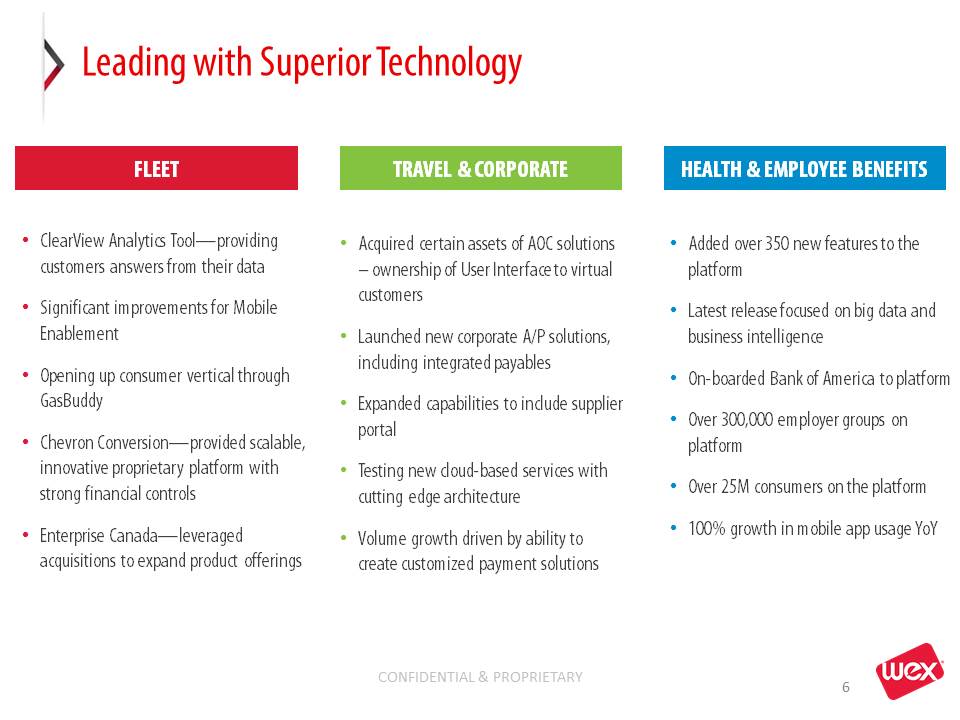
Leading with Superior Technology HEALTH & EMPLOYEE BENEFITS TRAVEL & CORPORATE FLEET ClearView Analytics Tool—providing customers answers from their dataSignificant improvements for Mobile EnablementOpening up consumer vertical through GasBuddyChevron Conversion—provided scalable, innovative proprietary platform with strong financial controls Enterprise Canada—leveraged acquisitions to expand product offerings Added over 350 new features to the platformLatest release focused on big data and business intelligence On-boarded Bank of America to platformOver 300,000 employer groups on platformOver 25M consumers on the platform100% growth in mobile app usage YoY Acquired certain assets of AOC solutions – ownership of User Interface to virtual customersLaunched new corporate A/P solutions, including integrated payablesExpanded capabilities to include supplier portal Testing new cloud-based services with cutting edge architectureVolume growth driven by ability to create customized payment solutions 6
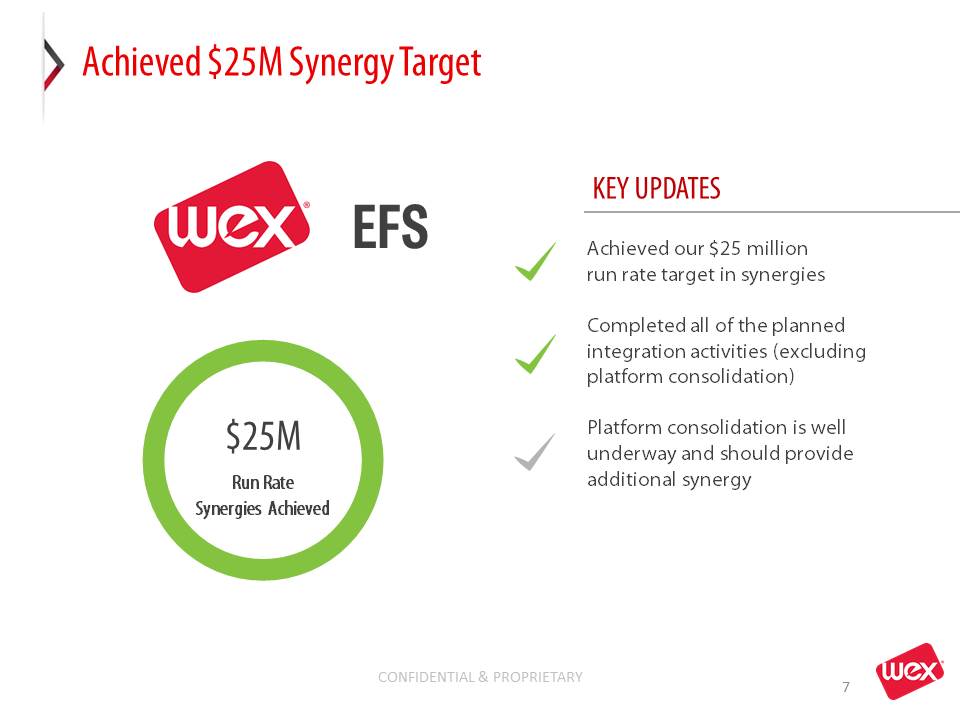
Achieved $25M Synergy Target Achieved our $25 million run rate target in synergiesCompleted all of the planned integration activities (excluding platform consolidation)Platform consolidation is well underway and should provide additional synergy EFS 7 KEY UPDATES $25M Run RateSynergies Achieved

WEX Fourth Quarter 2017 Financial Results 8
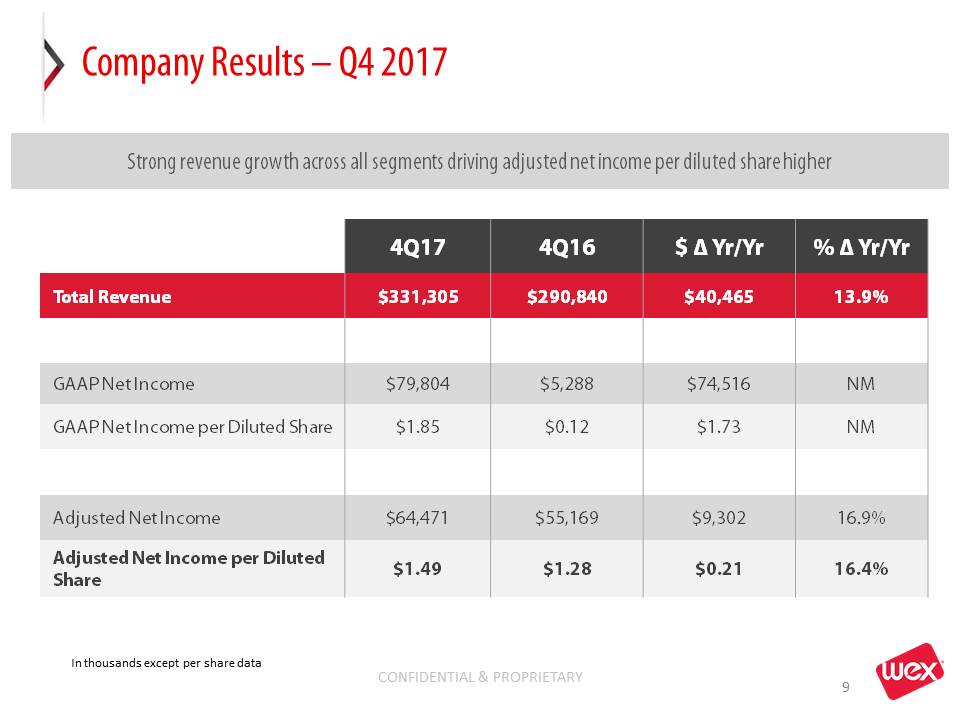
Company Results – Q4 2017 4Q17 4Q16 $ ∆ Yr/Yr % ∆ Yr/Yr Total Revenue $331,305 $290,840 $40,465 13.9% GAAP Net Income $79,804 $5,288 $74,516 NM GAAP Net Income per Diluted Share $1.85 $0.12 $1.73 NM Adjusted Net Income $64,471 $55,169 $9,302 16.9% Adjusted Net Income per Diluted Share $1.49 $1.28 $0.21 16.4% Strong revenue growth across all segments driving adjusted net income per diluted share higher 9 In thousands except per share data
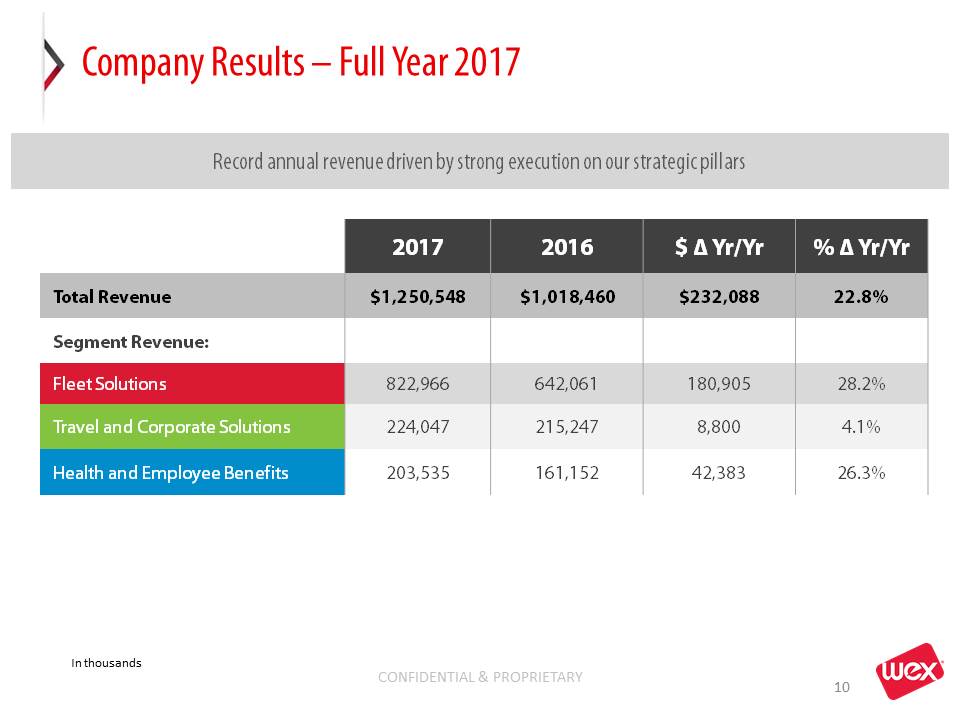
Company Results – Full Year 2017 2017 2016 $ ∆ Yr/Yr % ∆ Yr/Yr Total Revenue $1,250,548 $1,018,460 $232,088 22.8% Segment Revenue: Fleet Solutions 822,966 642,061 180,905 28.2% Travel and Corporate Solutions 224,047 215,247 8,800 4.1% Health and Employee Benefits 203,535 161,152 42,383 26.3% Record annual revenue driven by strong execution on our strategic pillars 10 In thousands
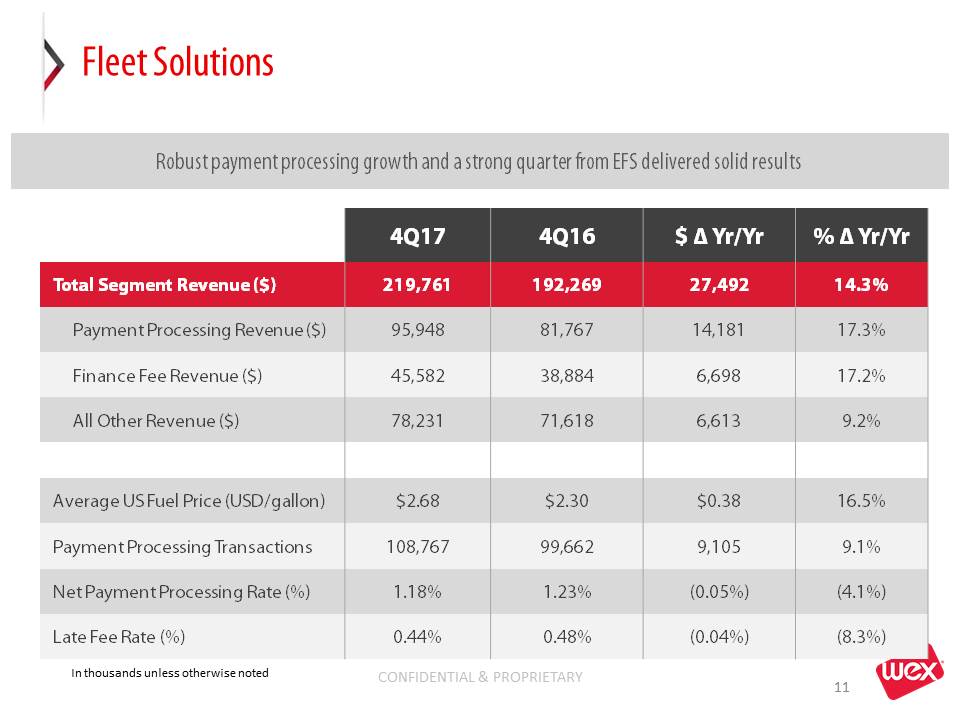
Fleet Solutions Robust payment processing growth and a strong quarter from EFS delivered solid results 4Q17 4Q16 $ ∆ Yr/Yr % ∆ Yr/Yr Total Segment Revenue ($) 219,761 192,269 27,492 14.3% Payment Processing Revenue ($) 95,948 81,767 14,181 17.3% Finance Fee Revenue ($) 45,582 38,884 6,698 17.2% All Other Revenue ($) 78,231 71,618 6,613 9.2% Average US Fuel Price (USD/gallon) $2.68 $2.30 $0.38 16.5% Payment Processing Transactions 108,767 99,662 9,105 9.1% Net Payment Processing Rate (%) 1.18% 1.23% (0.05%) (4.1%) Late Fee Rate (%) 0.44% 0.48% (0.04%) (8.3%) 11 In thousands unless otherwise noted
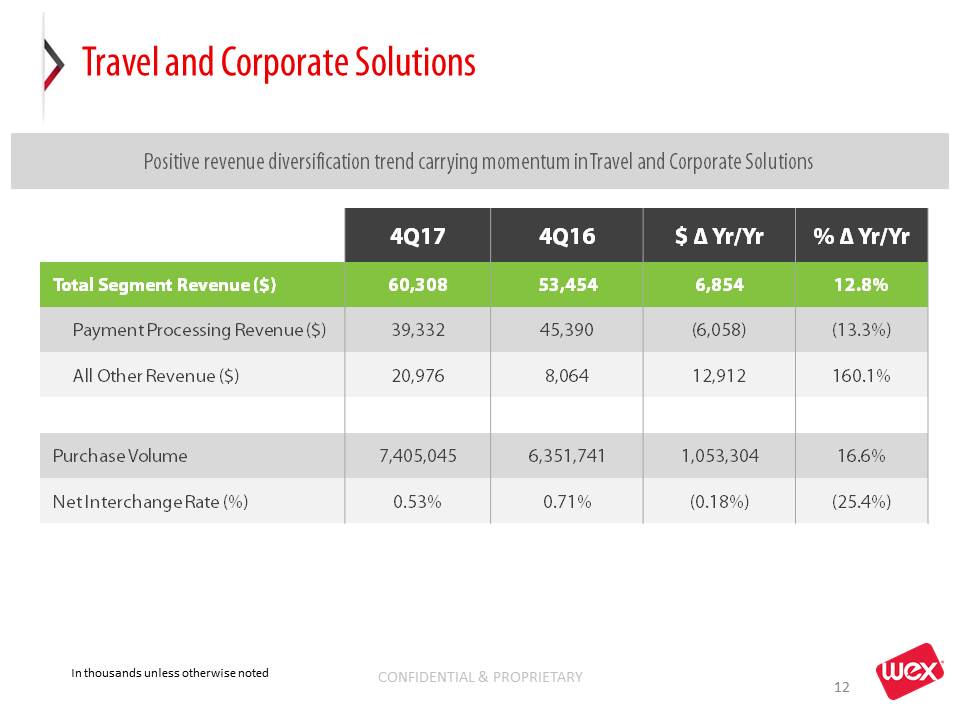
Travel and Corporate Solutions Positive revenue diversification trend carrying momentum in Travel and Corporate Solutions 4Q17 4Q16 $ ∆ Yr/Yr % ∆ Yr/Yr Total Segment Revenue ($) 60,308 53,454 6,854 12.8% Payment Processing Revenue ($) 39,332 45,390 (6,058) (13.3%) All Other Revenue ($) 20,976 8,064 12,912 160.1% Purchase Volume 7,405,045 6,351,741 1,053,304 16.6% Net Interchange Rate (%) 0.53% 0.71% (0.18%) (25.4%) 12 In thousands unless otherwise noted

Health and Employee Benefits Solutions Account growth and spend volume both deliver double-digit increases year-over-year 4Q17 4Q16 $ ∆ Yr/Yr % ∆ Yr/Yr Total Segment Revenue ($) 51,236 45,117 6,119 13.6% Payment Processing Revenue ($) 10,452 10,144 308 3.0% Account Servicing Revenue ($) 28,184 23,141 5,043 21.8% All Other Revenue ($) 12,600 11,832 768 6.5% Purchase Volume* 887,511 803,045 84,466 10.5% Average Number of SaaS Accounts* 9,774 7,551 2,223 29.4% 13 In thousands unless otherwise noted* US Only
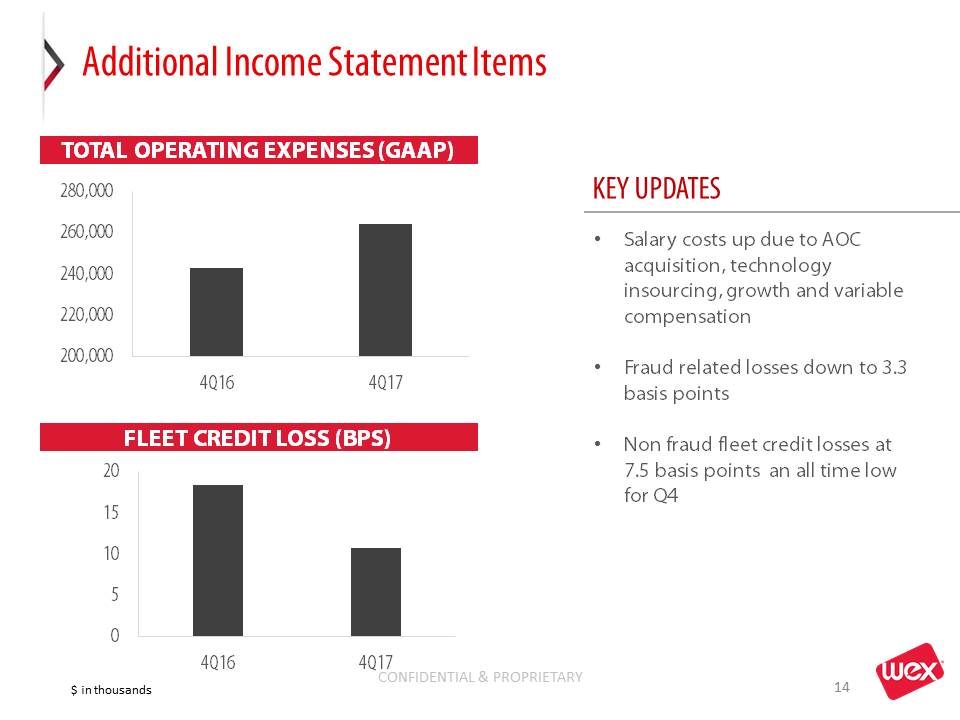
Additional Income Statement Items Salary costs up due to AOC acquisition, technology insourcing, growth and variable compensation Fraud related losses down to 3.3 basis pointsNon fraud fleet credit losses at 7.5 basis points an all time low for Q4 TOTAL OPERATING EXPENSES (GAAP) FLEET CREDIT LOSS (BPS) 14 KEY UPDATES $ in thousands
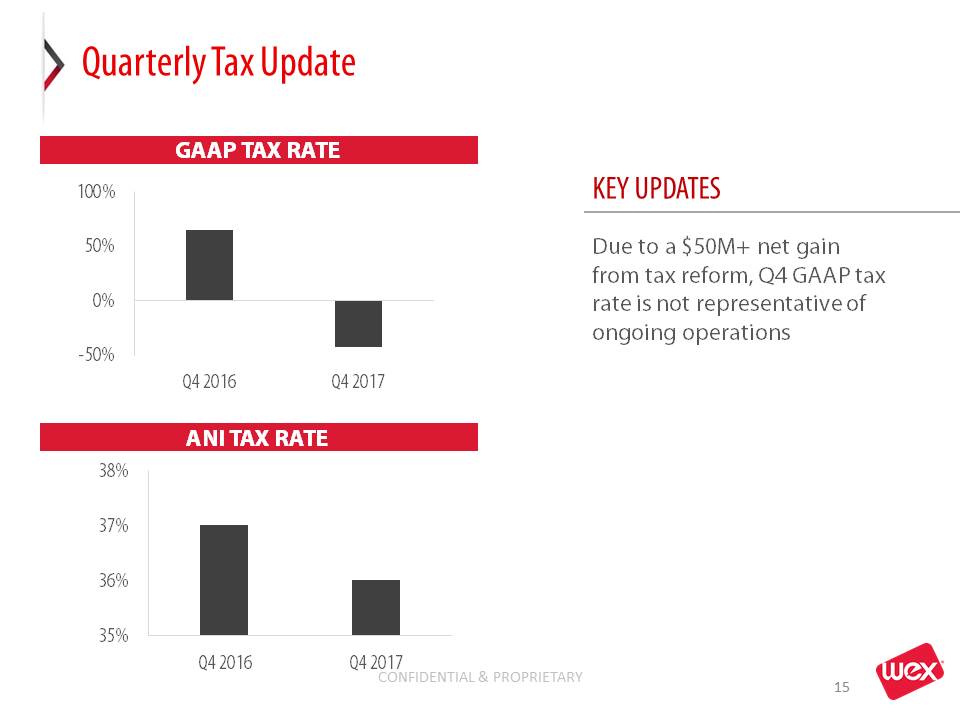
Quarterly Tax Update Due to a $50M+ net gain from tax reform, Q4 GAAP tax rate is not representative of ongoing operations GAAP TAX RATE ANI TAX RATE 15 KEY UPDATES
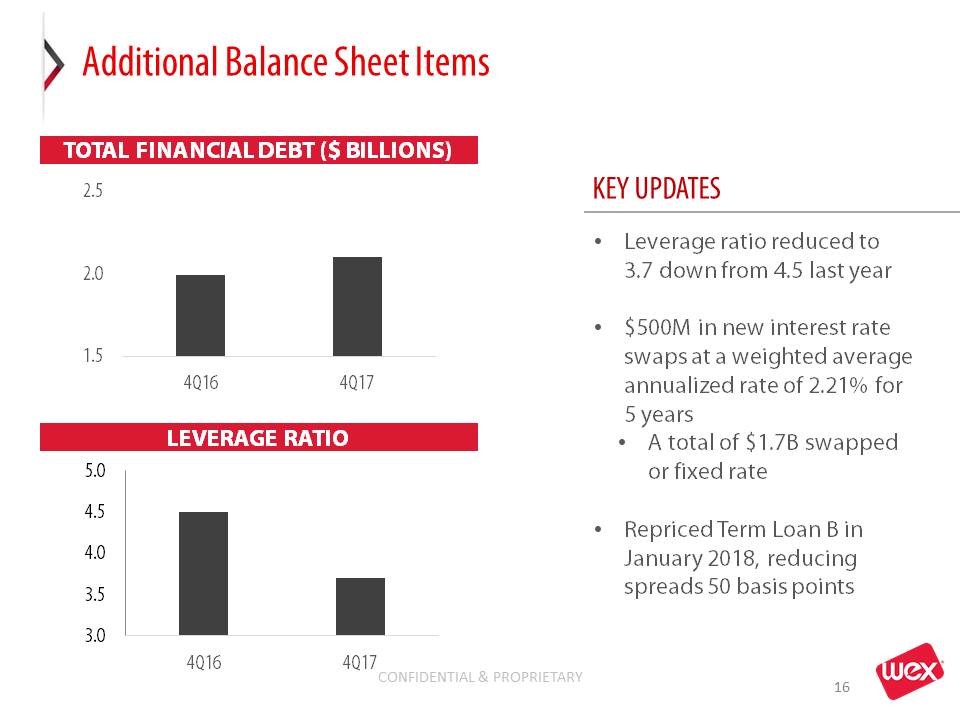
Additional Balance Sheet Items Leverage ratio reduced to 3.7 down from 4.5 last year$500M in new interest rate swaps at a weighted average annualized rate of 2.21% for 5 yearsA total of $1.7B swapped or fixed rateRepriced Term Loan B in January 2018, reducing spreads 50 basis points TOTAL FINANCIAL DEBT ($ BILLIONS) LEVERAGE RATIO 16 KEY UPDATES
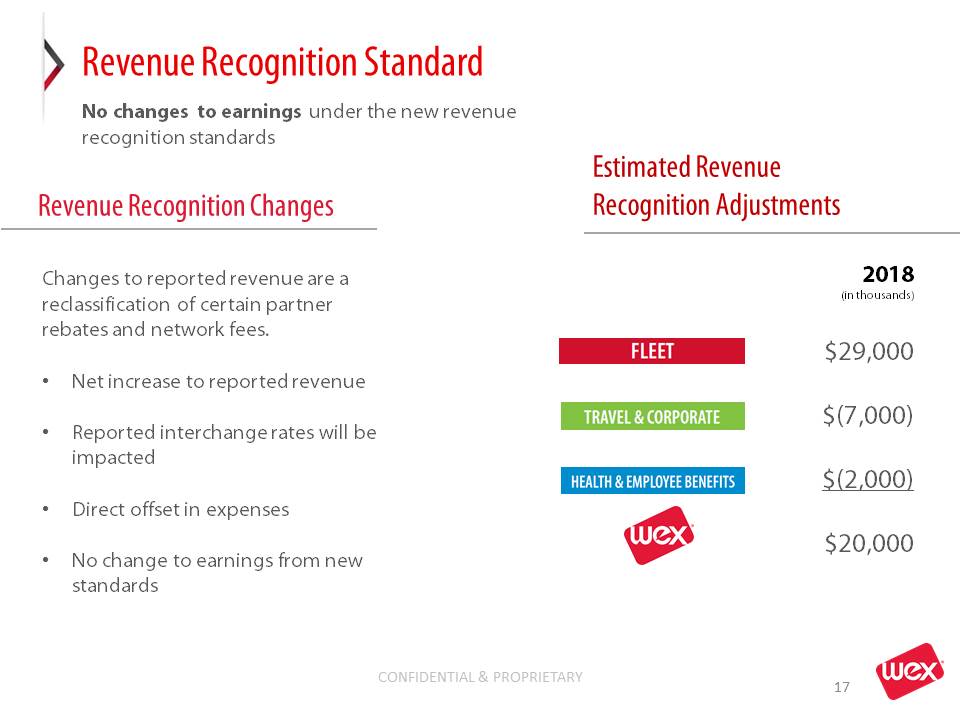
Revenue Recognition Standard Est. Rev. Rec. Adjustments 2018 (in thousands)$29,000$(7,000)$(2,000)$20,000 No changes to earnings under the new revenue recognition standards Changes to reported revenue are a reclassification of certain partner rebates and network fees.Net increase to reported revenueReported interchange rates will be impactedDirect offset in expensesNo change to earnings from new standards 17 Revenue Recognition Changes Estimated Revenue Recognition Adjustments
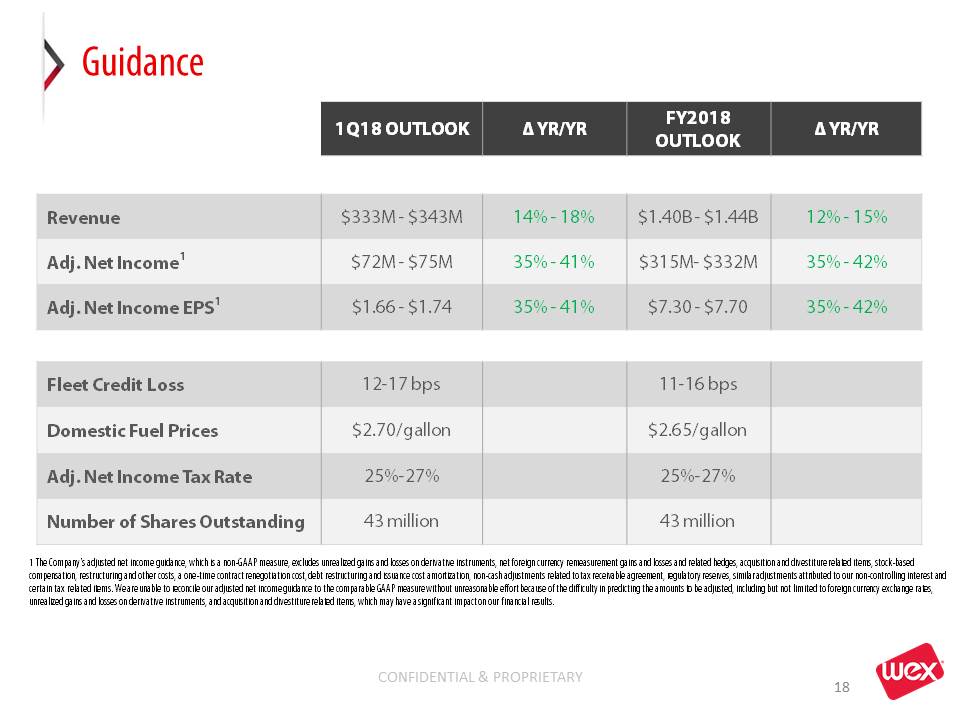
Guidance 1Q18 OUTLOOK ∆ YR/YR FY2018 OUTLOOK ∆ YR/YR Revenue $333M - $343M 14% - 18% $1.40B - $1.44B 12% - 15% Adj. Net Income1 $72M - $75M 35% - 41% $315M- $332M 35% - 42% Adj. Net Income EPS1 $1.66 - $1.74 35% - 41% $7.30 - $7.70 35% - 42% Fleet Credit Loss 12-17 bps 11-16 bps Domestic Fuel Prices $2.70/gallon $2.65/gallon Adj. Net Income Tax Rate 25%-27% 25%-27% Number of Shares Outstanding 43 million 43 million 1 The Company's adjusted net income guidance, which is a non-GAAP measure, excludes unrealized gains and losses on derivative instruments, net foreign currency remeasurement gains and losses and related hedges, acquisition and divestiture related items, stock-based compensation, restructuring and other costs, a one-time contract renegotiation cost, debt restructuring and issuance cost amortization, non-cash adjustments related to tax receivable agreement, regulatory reserves, similar adjustments attributed to our non-controlling interest and certain tax related items. We are unable to reconcile our adjusted net income guidance to the comparable GAAP measure without unreasonable effort because of the difficulty in predicting the amounts to be adjusted, including but not limited to foreign currency exchange rates, unrealized gains and losses on derivative instruments, and acquisition and divestiture related items, which may have a significant impact on our financial results. 18

Appendix 19
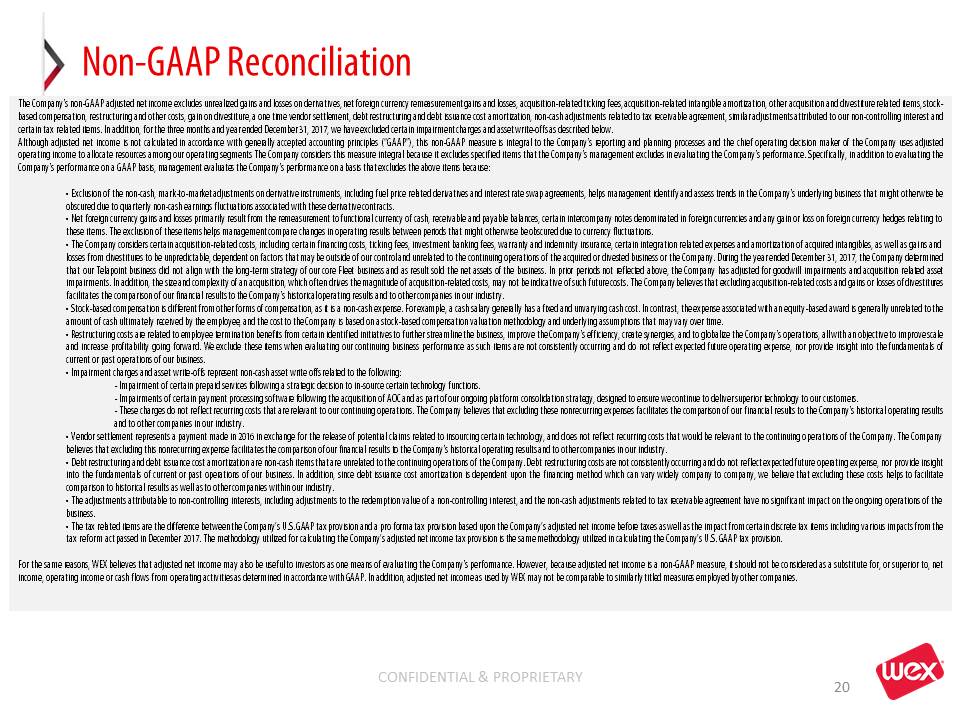
Non-GAAP Reconciliation The Company's non-GAAP adjusted net income excludes unrealized gains and losses on derivatives, net foreign currency remeasurement gains and losses, acquisition-related ticking fees, acquisition-related intangible amortization, other acquisition and divestiture related items, stock-based compensation, restructuring and other costs, gain on divestiture, a one time vendor settlement, debt restructuring and debt issuance cost amortization, non-cash adjustments related to tax receivable agreement, similar adjustments attributed to our non-controlling interest and certain tax related items. In addition, for the three months and year ended December 31, 2017, we have excluded certain impairment charges and asset write-offs as described below.Although adjusted net income is not calculated in accordance with generally accepted accounting principles (“GAAP”), this non-GAAP measure is integral to the Company's reporting and planning processes and the chief operating decision maker of the Company uses adjusted operating income to allocate resources among our operating segments The Company considers this measure integral because it excludes specified items that the Company's management excludes in evaluating the Company's performance. Specifically, in addition to evaluating the Company's performance on a GAAP basis, management evaluates the Company's performance on a basis that excludes the above items because:• Exclusion of the non-cash, mark-to-market adjustments on derivative instruments, including fuel price related derivatives and interest rate swap agreements, helps management identify and assess trends in the Company's underlying business that might otherwise be obscured due to quarterly non-cash earnings fluctuations associated with these derivative contracts.• Net foreign currency gains and losses primarily result from the remeasurement to functional currency of cash, receivable and payable balances, certain intercompany notes denominated in foreign currencies and any gain or loss on foreign currency hedges relating to these items. The exclusion of these items helps management compare changes in operating results between periods that might otherwise be obscured due to currency fluctuations.• The Company considers certain acquisition-related costs, including certain financing costs, ticking fees, investment banking fees, warranty and indemnity insurance, certain integration related expenses and amortization of acquired intangibles, as well as gains and losses from divestitures to be unpredictable, dependent on factors that may be outside of our control and unrelated to the continuing operations of the acquired or divested business or the Company. During the year ended December 31, 2017, the Company determined that our Telapoint business did not align with the long-term strategy of our core Fleet business and as result sold the net assets of the business. In prior periods not reflected above, the Company has adjusted for goodwill impairments and acquisition related asset impairments. In addition, the size and complexity of an acquisition, which often drives the magnitude of acquisition-related costs, may not be indicative of such future costs. The Company believes that excluding acquisition-related costs and gains or losses of divestitures facilitates the comparison of our financial results to the Company's historical operating results and to other companies in our industry.• Stock-based compensation is different from other forms of compensation, as it is a non-cash expense. For example, a cash salary generally has a fixed and unvarying cash cost. In contrast, the expense associated with an equity-based award is generally unrelated to the amount of cash ultimately received by the employee, and the cost to the Company is based on a stock-based compensation valuation methodology and underlying assumptions that may vary over time.• Restructuring costs are related to employee termination benefits from certain identified initiatives to further streamline the business, improve the Company's efficiency, create synergies, and to globalize the Company's operations, all with an objective to improve scale and increase profitability going forward. We exclude these items when evaluating our continuing business performance as such items are not consistently occurring and do not reflect expected future operating expense, nor provide insight into the fundamentals of current or past operations of our business.• Impairment charges and asset write-offs represent non-cash asset write offs related to the following: - Impairment of certain prepaid services following a strategic decision to in-source certain technology functions. - Impairments of certain payment processing software following the acquisition of AOC and as part of our ongoing platform consolidation strategy, designed to ensure we continue to deliver superior technology to our customers. - These charges do not reflect recurring costs that are relevant to our continuing operations. The Company believes that excluding these nonrecurring expenses facilitates the comparison of our financial results to the Company's historical operating results and to other companies in our industry.• Vendor settlement represents a payment made in 2016 in exchange for the release of potential claims related to insourcing certain technology, and does not reflect recurring costs that would be relevant to the continuing operations of the Company. The Company believes that excluding this nonrecurring expense facilitates the comparison of our financial results to the Company's historical operating results and to other companies in our industry.• Debt restructuring and debt issuance cost amortization are non-cash items that are unrelated to the continuing operations of the Company. Debt restructuring costs are not consistently occurring and do not reflect expected future operating expense, nor provide insight into the fundamentals of current or past operations of our business. In addition, since debt issuance cost amortization is dependent upon the financing method which can vary widely company to company, we believe that excluding these costs helps to facilitate comparison to historical results as well as to other companies within our industry.• The adjustments attributable to non-controlling interests, including adjustments to the redemption value of a non-controlling interest, and the non-cash adjustments related to tax receivable agreement have no significant impact on the ongoing operations of the business.• The tax related items are the difference between the Company’s U.S. GAAP tax provision and a pro forma tax provision based upon the Company’s adjusted net income before taxes as well as the impact from certain discrete tax items including various impacts from the tax reform act passed in December 2017. The methodology utilized for calculating the Company’s adjusted net income tax provision is the same methodology utilized in calculating the Company’s U.S. GAAP tax provision.For the same reasons, WEX believes that adjusted net income may also be useful to investors as one means of evaluating the Company's performance. However, because adjusted net income is a non-GAAP measure, it should not be considered as a substitute for, or superior to, net income, operating income or cash flows from operating activities as determined in accordance with GAAP. In addition, adjusted net income as used by WEX may not be comparable to similarly titled measures employed by other companies. 20
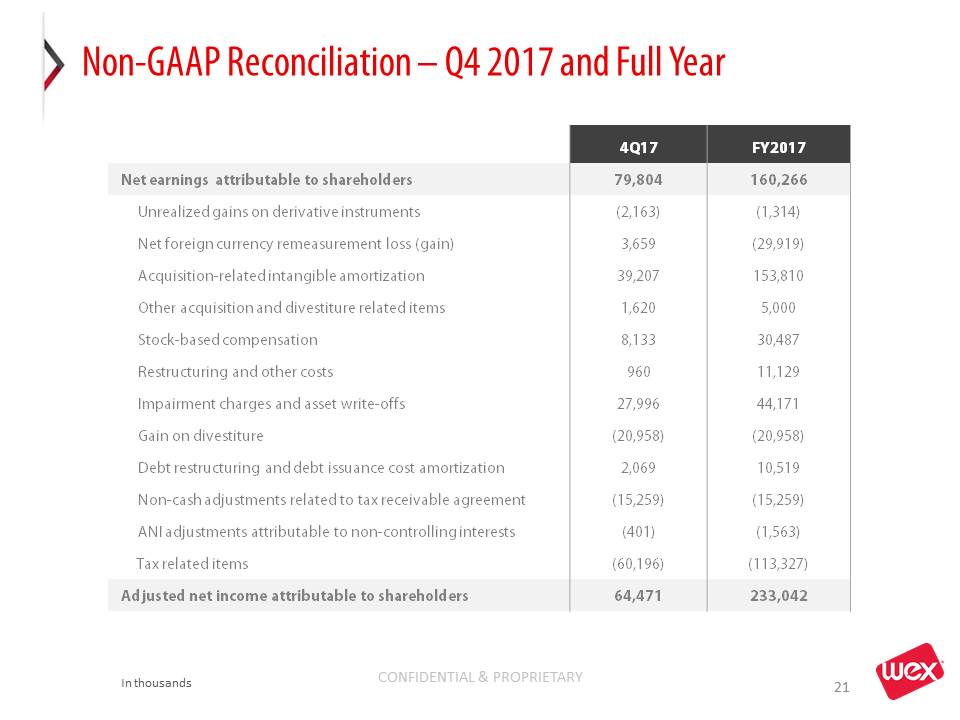
Non-GAAP Reconciliation – Q4 2017 and Full Year In thousands 4Q17 FY2017 Net earnings attributable to shareholders 79,804 160,266 Unrealized gains on derivative instruments (2,163) (1,314) Net foreign currency remeasurement loss (gain) 3,659 (29,919) Acquisition-related intangible amortization 39,207 153,810 Other acquisition and divestiture related items 1,620 5,000 Stock-based compensation 8,133 30,487 Restructuring and other costs 960 11,129 Impairment charges and asset write-offs 27,996 44,171 Gain on divestiture (20,958) (20,958) Debt restructuring and debt issuance cost amortization 2,069 10,519 Non-cash adjustments related to tax receivable agreement (15,259) (15,259) ANI adjustments attributable to non-controlling interests (401) (1,563) Tax related items (60,196) (113,327) Adjusted net income attributable to shareholders 64,471 233,042 21