Attached files
| file | filename |
|---|---|
| 8-K - 8-K - Q4 EARNINGS RELEASE, SUPPLEMENT & SLIDES - KAR Auction Services, Inc. | form8-kxearningsreleasesup.htm |
| EX-99.1 - EXHIBIT 99.1 - Q4 2017 EARNINGS RELEASE - KAR Auction Services, Inc. | exhibit991-q42017earningsr.htm |
| EX-99.2 - EXHIBIT 99.2 - Q4 2017 SUPPLEMENTAL FINANCIAL INFORMATION - KAR Auction Services, Inc. | exhibit992-q42017ersupplem.htm |

Q4 2017 & Annual Earnings Slides
February 20, 2018
Forward-Looking Statements
This presentation includes forward-looking statements as that term is
defined in the Private Securities Litigation Reform Act of 1995. Such forward
looking statements are subject to certain risks, trends, and uncertainties that
could cause actual results to differ materially from those projected,
expressed or implied by such forward-looking statements. Many of these
risk factors are outside of the company’s control, and as such, they involve
risks which are not currently known to the company that could cause actual
results to differ materially from forecasted results. Factors that could cause
or contribute to such differences include those matters disclosed in the
company’s Securities and Exchange Commission filings. The forward-
looking statements in this document are made as of the date hereof and the
company does not undertake to update its forward-looking statements.
2

2017 Highlights
3
Revenues Highlights Fundamentals
KAR
• Revenue growth +10%
• Operating Adjusted EPS +21%
• Adjusted EBITDA +12%
• Adjusted EBITDA margin grew to
24.2% from 23.7% in prior year
• Diversified and complementary
business services model
• Controlling SG&A
ADESA
• Revenue +10%
• Strong volume growth +10%
• Physical volumes +5%
• Physical auction RPU +$22
• Incremental operating profit +22%
• Adjusted EBITDA +13%
• Off-lease supply driving volume
and physical auction fee growth
• Commercial vehicle mix at
physical auctions increased to
55% from 52% in prior year
IAA
• Revenue +11%
• Volume growth +8%
• North American inv growth +3%
• Adjusted EBITDA +18%
• Total Loss 18.0% 2017 vs. 16.9%
2016 (CCC)
• Scrap pricing +20% (American
Recycler, 2017 vs. 2016)
• Miles driven +1.3% (FHWA, YTD
through Nov. 2017 vs. 2016)
AFC
• Revenue +5%
• LTU growth -2%
• Provision for credit losses as a
percent of managed receivables
1.9%
• Adjusted EBITDA +3%
• Conservative portfolio
management
• Increasing gross revenue per
loan transaction due to higher
average loan balances offset by
increased credit losses
2018 Outlook
4
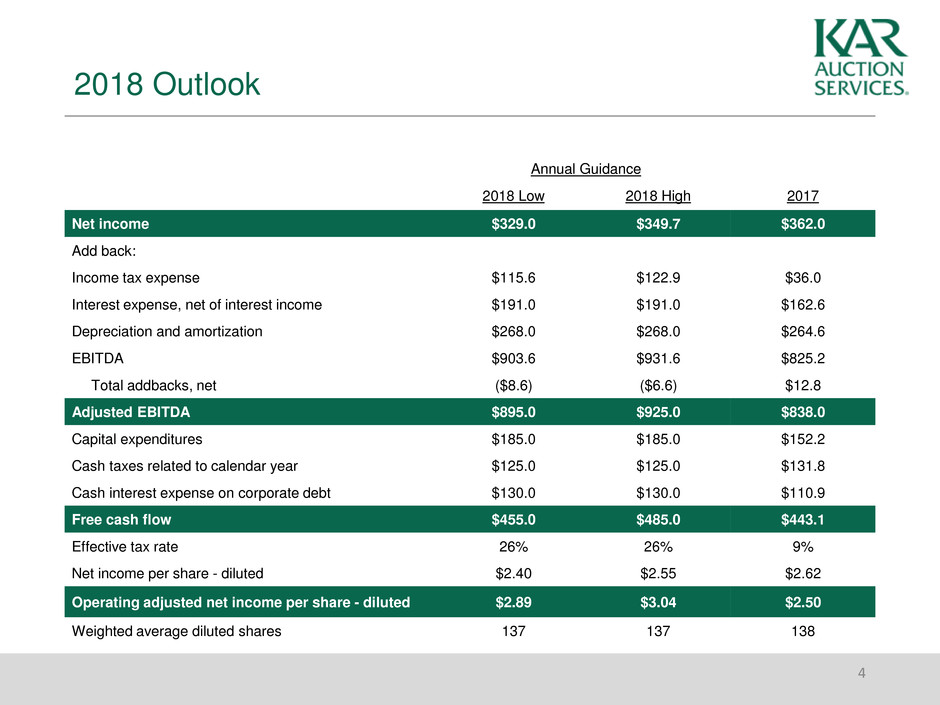
Annual Guidance
2018 Low 2018 High 2017
Net income $329.0 $349.7 $362.0
Add back:
Income tax expense $115.6 $122.9 $36.0
Interest expense, net of interest income $191.0 $191.0 $162.6
Depreciation and amortization $268.0 $268.0 $264.6
EBITDA $903.6 $931.6 $825.2
Total addbacks, net ($8.6) ($6.6) $12.8
Adjusted EBITDA $895.0 $925.0 $838.0
Capital expenditures $185.0 $185.0 $152.2
Cash taxes related to calendar year $125.0 $125.0 $131.8
Cash interest expense on corporate debt $130.0 $130.0 $110.9
Free cash flow $455.0 $485.0 $443.1
Effective tax rate 26% 26% 9%
Net income per share - diluted $2.40 $2.55 $2.62
Operating adjusted net income per share - diluted $2.89 $3.04 $2.50
Weighted average diluted shares 137 137 138

Key Operating Metrics
5
4Q17 4Q16 2017 2016
ADESA
Total Vehicles Sold Growth 6% 16% 10% 17%
Physical Vehicles Sold Growth1 -4% 0% -2% 4%
Online Only Vehicles Sold Growth 34% 16% 26% 26%
Physical RPU Growth 6% 4% 3% 7%
IAA
Vehicles Sold Growth (includes HBC) 4% 18% 8% 11%
Inventory Growth (excludes HBC) 3% 25% 3% 25%
RPU Growth (includes HBC) 6% -2% 2% 0%
AFC
LTU Growth -1% 2% -2% 7%
Provision for Credit Losses 1.4% 2.6% 1.9% 1.8%
Revenue per LTU excluding “Other service revenue” $178 $145 $159 $148
Revenue per LTU before provision for credit losses $193 $173 $179 $166
1 Excluding acquisitions

Share
Repurchases
Clear Shareholder Friendly Capital
Allocation Framework
6
Priorities
Priorities
Historically ~18% - 20% of
Adjusted EBITDA, plus
strategic investments
45% - 50% of FCF
Highlights consistency &
strength of free cash flow
Acquisitions that leverage
wholecar auction cyclical
recovery (indep auctions)
Complementary technology
New geographies
Tool for managing cash and
leverage
2015
$135M Spent $152M Paid $118M Acquisitions $228M Repurchased
Technology $63M
Physical $56M
Chicago Greenfield $16M
$1.08 per share paid
Pittsburgh (Indep Auction)
DataScan (Veh Inspections)
Autoniq (Price Guide
Aggregator)
MobileTrac (Veh History)
HBC (UK Salvage)
$300M two year
authorization approved in
October 2014
6.2M shares repurchased
2016
$155M Spent $157M Paid $432M Acquisitions $80M Repurchased
Technology $77M
Physical $51M
Chicago Greenfield $27M
$1.14 per share paid Brashers (8 Ind Auctions)
Orlando (Indep Auction)
GRS (UK Online Auctions)
Flint (Indep Auction)
$500M three year
authorization approved in
October 2016
1.9M shares repurchased
2017
$152M Spent $175M Paid $73M Acquisitions $150M Repurchased
Technology $90M
Physical $62M
$1.28 per share paid DRIVIN (Data Analytics)
(April 2017)
DAS (Transportation)
(May 2017)
TradeRev (Online Sales)
(October 2017)
POIS (Total Loss Solutions)
(December 2017)
3.3M shares repurchased
$270M Authorization
Remaining
Dividends
Strategic
Investments
Capex 4

Tax Reform Impact
7
2018 Estimate
26% - 28% Effective Rate
Note: ~13%-15% KAR Revenues
Generated Outside U.S.
2017 Annualized
Proforma Impact
~$0.30 EPS Increase
Over $40M Cash Tax
Reduction
4Q17 Impact
1. Deferred tax liability revaluation
$102.7M benefit
$0.75 EPS impact
2. Repatriation tax 4Q17
($11.1) million expense
($0.08) EPS impact

Catastrophic Events (Hurricanes Harvey & Irma)
8
Real Estate
Enough acreage to store 100K+ units to
meet initial estimates from providers
Trucks
900 trucks within 4 days; 1,100 trucks &
3,000+ daily pickups at peak
Personnel
350 IAA Volunteers Deployed
~100 Non-IAA KAR employees
Financial Impact
4Q17 Volume Sold 65,000+
Revenue $44.6M
Gross Profit $4.0M
2017 Volume Sold 65,000+
Revenue $45.1M
Gross Profit/(Loss) ($0.3M)

KAR Q4 2017 Highlights
9
($ in millions, except per share amounts)
KAR Q4 2017 Q4 2016 Highlights*
Total operating revenues $890.4 $813.7 $10.0M acquisitions and $44.6M hurricanes Harvey & Irma
Gross profit** $365.3 $325.4
% of revenue 41.0% 40.0%
SG&A $172.5 $148.8 $10.8M acquired SG&A
EBITDA $214.3 $174.8
Adjusted EBITDA $194.6 $176.5 Margin consistent 22%
Net Income $172.8 $45.5
Net income per share - diluted $1.27 $0.33 $0.67 tax reform effect and $0.16 TradeRev revaluation
Operating adjusted net income per share - diluted $0.63 $0.45
Weighted average diluted shares 136.5 138.9 1.0M shares purchased ($50M)
Dividends declared per common share $0.35 $0.32 4Q increase $0.03; no other increases in 2017
Effective tax rate -67.6% 37.0% 36.2% excluding tax reform
Capital expenditures $42.1 $36.6
* For a more complete explanation of these changes, see the MD&A in the company's supplemental financial information
and Form 10-K, both for the year ended December 31, 2017.
** Exclusive of depreciation and amortization
ADESA Q4 2017 Highlights
10
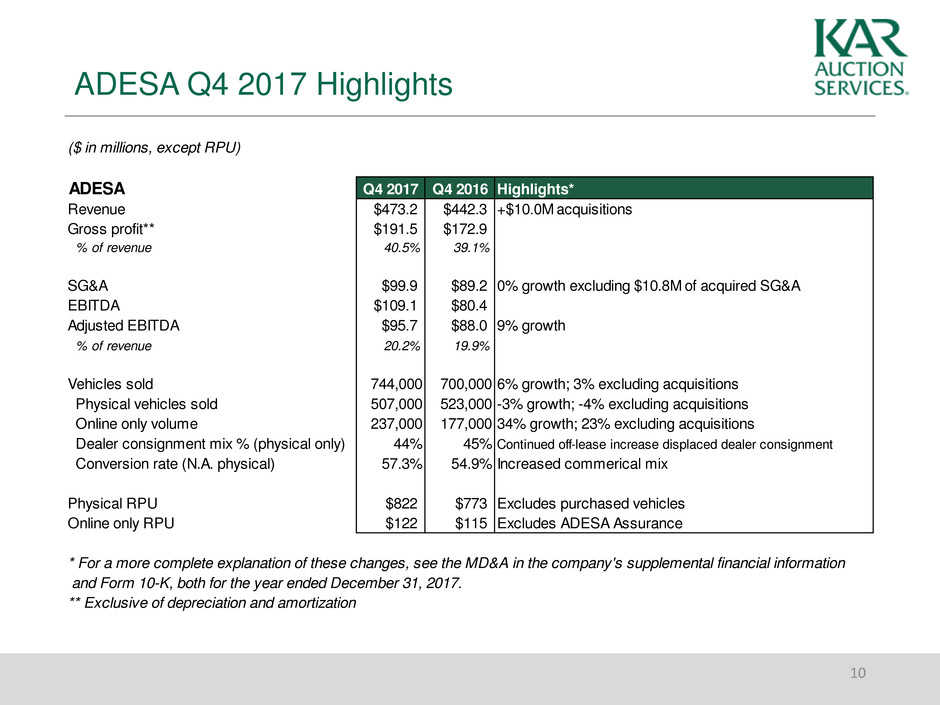
($ in millions, except RPU)
ADESA Q4 2017 Q4 2016 Highlights*
Revenue $473.2 $442.3 +$10.0M acquisitions
Gross profit** $191.5 $172.9
% of revenue 40.5% 39.1%
SG&A $99.9 $89.2 0% growth excluding $10.8M of acquired SG&A
EBITDA $109.1 $80.4
Adjusted EBITDA $95.7 $88.0 9% growth
% of revenue 20.2% 19.9%
Vehicles sold 744,000 700,000 6% growth; 3% excluding acquisitions
Physical vehicles sold 507,000 523,000 -3% growth; -4% excluding acquisitions
Online only volume 237,000 177,000 34% growth; 23% excluding acquisitions
Dealer consignment mix % (physical only) 44% 45% Continued off-lease increase displaced dealer consignment
Conversion rate (N.A. physical) 57.3% 54.9% Increased commerical mix
Physical RPU $822 $773 Excludes purchased vehicles
Online only RPU $122 $115 Excludes ADESA Assurance
* For a more complete explanation of these changes, see the MD&A in the company's supplemental financial information
and Form 10-K, both for the year ended December 31, 2017.
** Exclusive of depreciation and amortization

IAA Q4 2017 Highlights
11
($ in millions)
IAA Q4 2017 Q4 2016 Highlights*
Revenue $335.4 $302.6 $44.6M from hurricanes Harvey & Irma
Gross profit** $112.7 $103.9 $4.0M gross profit from hurricanes Harvey & Irma
% of revenue 33.6% 34.3% Excluding HBC and Harvey & Irma 37.9% vs 35.1% PY
SG&A $27.2 $25.3
EBITDA $85.4 $78.8
Adjusted EBITDA $87.4 $80.2 $4.0M gross profit from hurricanes Harvey & Irma
% of revenue 26.1% 26.5% 28.7% excluding hurricanes Harvey & Irma
Vehicles sold 635,000 610,000 +4% volume
Inventory growth (N.A.) 3% 25%
% Purchased contract vehiclces 4% 6% Reduced HBC purchase vehicles
* For a more complete explanation of these changes, see the MD&A in the company's supplemental financial information
and Form 10-K, both for the year ended December 31, 2017.
** Exclusive of depreciation and amortization
AFC Q4 2017 Highlights
12
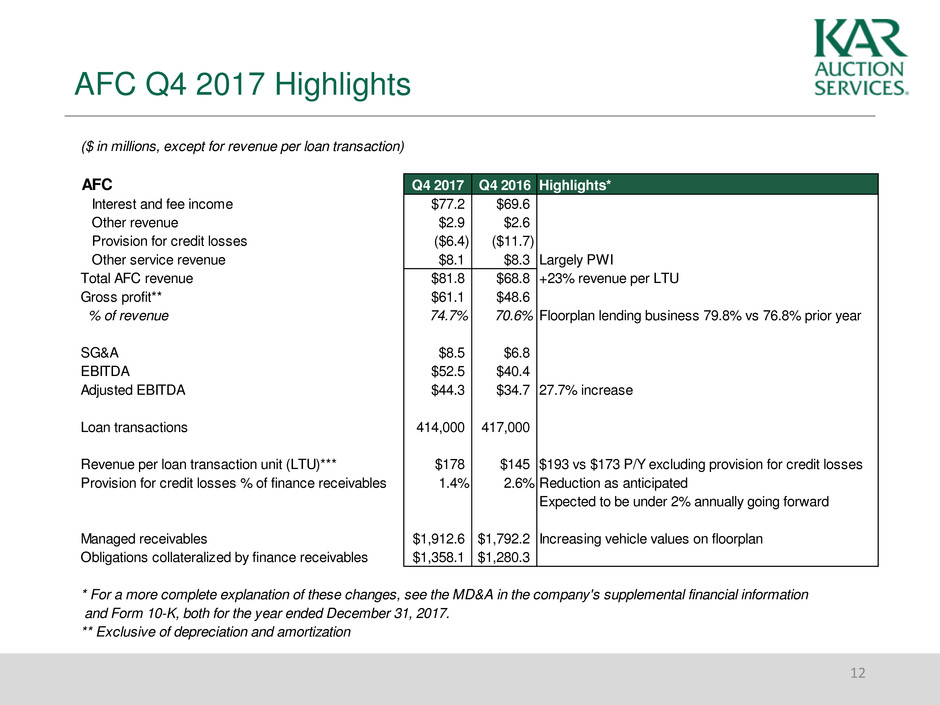
($ in millions, except for revenue per loan transaction)
AFC Q4 2017 Q4 2016 Highlights*
Interest and fee income $77.2 $69.6
Other revenue $2.9 $2.6
Provision for credit losses ($6.4) ($11.7)
Other service revenue $8.1 $8.3 Largely PWI
Total AFC revenue $81.8 $68.8 +23% revenue per LTU
Gross profit** $61.1 $48.6
% of revenue 74.7% 70.6% Floorplan lending business 79.8% vs 76.8% prior year
SG&A $8.5 $6.8
EBITDA $52.5 $40.4
Adjusted EBITDA $44.3 $34.7 27.7% increase
Loan transactions 414,000 417,000
Revenue per loan transaction unit (LTU)*** $178 $145 $193 vs $173 P/Y excluding provision for credit losses
Provision for credit losses % of finance receivables 1.4% 2.6% Reduction as anticipated
Expected to be under 2% annually going forward
Managed receivables $1,912.6 $1,792.2 Increasing vehicle values on floorplan
Obligations collateralized by finance receivables $1,358.1 $1,280.3
* For a more complete explanation of these changes, see the MD&A in the company's supplemental financial information
and Form 10-K, both for the year ended December 31, 2017.
** Exclusive of depreciation and amortization

Year-to-Date Slides
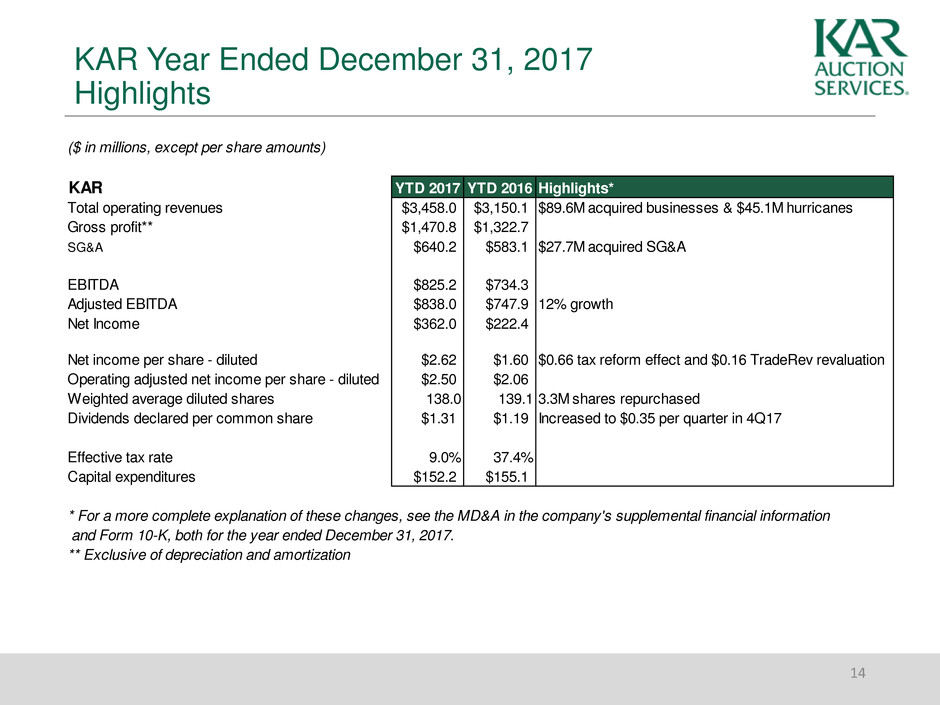
KAR Year Ended December 31, 2017
Highlights
14
($ in millions, except per share amounts)
KAR YTD 2017 YTD 2016 Highlights*
Total operating revenues $3,458.0 $3,150.1 $89.6M acquired businesses & $45.1M hurricanes
Gross profit** $1,470.8 $1,322.7
SG&A $640.2 $583.1 $27.7M acquired SG&A
EBITDA $825.2 $734.3
Adjusted EBITDA $838.0 $747.9 12% growth
Net Income $362.0 $222.4
Net income per share - diluted $2.62 $1.60 $0.66 tax reform effect and $0.16 TradeRev revaluation
Operating adjusted net income per share - diluted $2.50 $2.06
Weighted average diluted shares 138.0 139.1 3.3M shares repurchased
Dividends declared per common share $1.31 $1.19 Increased to $0.35 per quarter in 4Q17
Effective tax rate 9.0% 37.4%
Capital expenditures $152.2 $155.1
* For a more complete explanation of these changes, see the MD&A in the company's supplemental financial information
and Form 10-K, both for the year ended December 31, 2017.
** Exclusive of depreciation and amortization
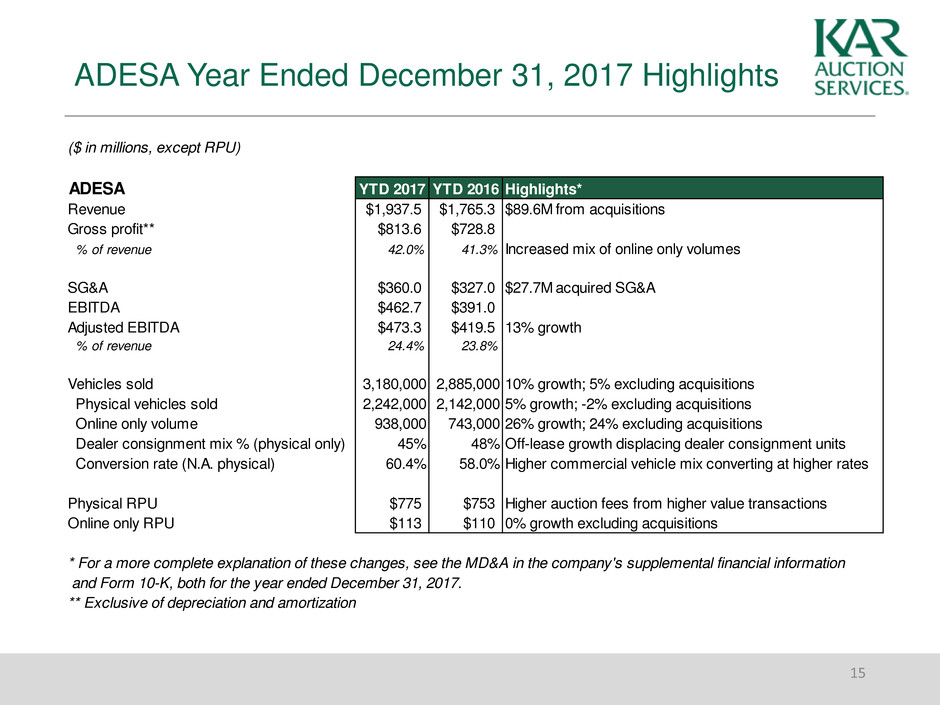
ADESA Year Ended December 31, 2017 Highlights
15
($ in millions, except RPU)
ADESA YTD 2017 YTD 2016 Highlights*
Revenue $1,937.5 $1,765.3 $89.6M from acquisitions
Gross profit** $813.6 $728.8
% of revenue 42.0% 41.3% Increased mix of online only volumes
SG&A $360.0 $327.0 $27.7M acquired SG&A
EBITDA $462.7 $391.0
Adjusted EBITDA $473.3 $419.5 13% growth
% of revenue 24.4% 23.8%
Vehicles sold 3,180,000 2,885,000 10% growth; 5% excluding acquisitions
Physical vehicles sold 2,242,000 2,142,000 5% growth; -2% excluding acquisitions
Online only volume 938,000 743,000 26% growth; 24% excluding acquisitions
Dealer consignment mix % (physical only) 45% 48% Off-lease growth displacing dealer consignment units
Conversion rate (N.A. physical) 60.4% 58.0% Higher commercial vehicle mix converting at higher rates
Physical RPU $775 $753 Higher auction fees from higher value transactions
Online only RPU $113 $110 0% growth excluding acquisitions
* For a more complete explanation of these changes, see the MD&A in the company's supplemental financial information
and Form 10-K, both for the year ended December 31, 2017.
** Exclusive of depreciation and amortization

IAA Year Ended December 31, 2017
Highlights
16
($ in millions)
IAA YTD 2017 YTD 2016 Highlights*
Revenue $1,219.2 $1,098.0 $45.1M hurricanes Harvey & Irma
Gross profit** $441.1 $390.0 ($0.3M) loss from hurricanes Harvey & Irma
% of revenue 36.2% 35.5% 38.3% excluding hurricanes Harvey & Irma and HBC
SG&A $107.1 $104.2 3% growth
EBITDA $334.9 $286.1
Adjusted EBITDA $339.5 $288.9 18% growth
% of revenue 27.8% 26.3% 28.9% excluding hurricanes Harvey & Irma
Vehicles sold 2,369,000 2,184,000 8% growth
Inventory growth (N.A.) 3% 25%
% Purchased contract vehiclces 5% 7% Lower HBC purchased vehicles
* For a more complete explanation of these changes, see the MD&A in the company's supplemental financial information
and Form 10-K, both for the year ended December 31, 2017.
** Exclusive of depreciation and amortization
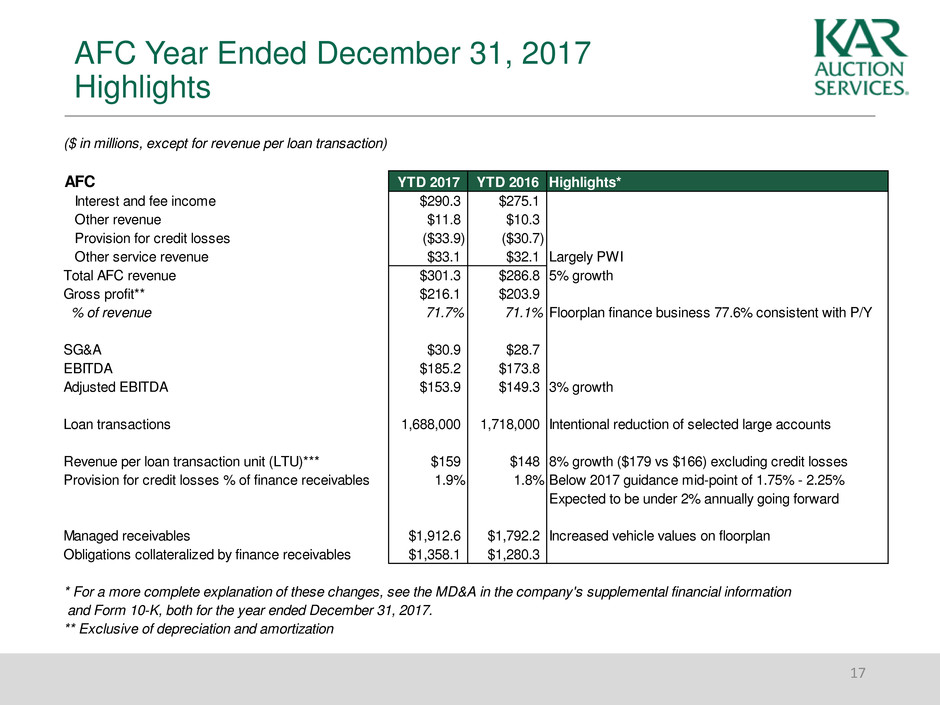
AFC Year Ended December 31, 2017
Highlights
17
($ in millions, except for revenue per loan transaction)
AFC YTD 2017 YTD 2016 Highlights*
Interest and fee income $290.3 $275.1
Other revenue $11.8 $10.3
Provision for credit losses ($33.9) ($30.7)
Other service revenue $33.1 $32.1 Largely PWI
Total AFC revenue $301.3 $286.8 5% growth
Gross profit** $216.1 $203.9
% of revenue 71.7% 71.1% Floorplan finance business 77.6% consistent with P/Y
SG&A $30.9 $28.7
EBITDA $185.2 $173.8
Adjusted EBITDA $153.9 $149.3 3% growth
Loan transactions 1,688,000 1,718,000 Intentional reduction of selected large accounts
Revenue per loan transaction unit (LTU)*** $159 $148 8% growth ($179 vs $166) excluding credit losses
Provision for credit losses % of finance receivables 1.9% 1.8% Below 2017 guidance mid-point of 1.75% - 2.25%
Expected to be under 2% annually going forward
Managed receivables $1,912.6 $1,792.2 Increased vehicle values on floorplan
Obligations collateralized by finance receivables $1,358.1 $1,280.3
* For a more complete explanation of these changes, see the MD&A in the company's supplemental financial information
and Form 10-K, both for the year ended December 31, 2017.
** Exclusive of depreciation and amortization

Historical Data
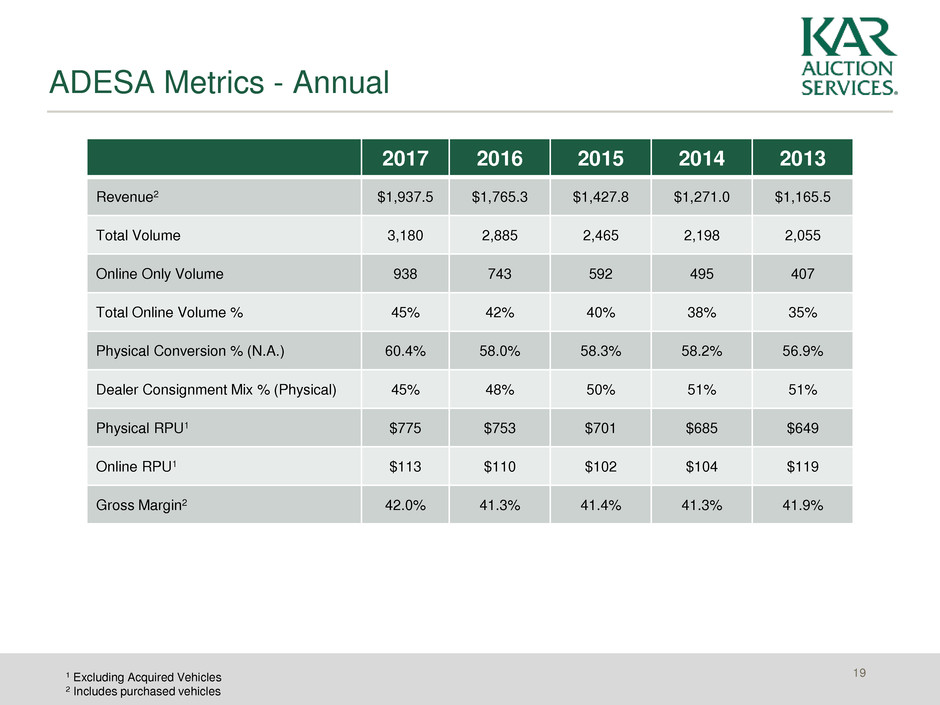
ADESA Metrics - Annual
2017 2016 2015 2014 2013
Revenue2 $1,937.5 $1,765.3 $1,427.8 $1,271.0 $1,165.5
Total Volume 3,180 2,885 2,465 2,198 2,055
Online Only Volume 938 743 592 495 407
Total Online Volume % 45% 42% 40% 38% 35%
Physical Conversion % (N.A.) 60.4% 58.0% 58.3% 58.2% 56.9%
Dealer Consignment Mix % (Physical) 45% 48% 50% 51% 51%
Physical RPU1 $775 $753 $701 $685 $649
Online RPU1 $113 $110 $102 $104 $119
Gross Margin2 42.0% 41.3% 41.4% 41.3% 41.9%
1 Excluding Acquired Vehicles
2 Includes purchased vehicles
19

ADESA Metrics - Quarter
4Q17 3Q17 2Q17 1Q17 4Q16 3Q16 2Q16 1Q16
Revenue2 $473.2 $477.1 $489.2 $498.0 $442.3 $457.4 $450.8 $414.8
Total Volume 744 788 830 818 700 732 750 703
Online Only Volume 237 241 245 215 177 180 198 188
Total Online Volume % 48% 45% 45% 42% 41% 40% 41% 43%
Physical Conversion %
(N.A.)
57.3% 61.3% 61.1% 61.8% 54.9% 57.2% 59.1% 61.0%
Dealer Consignment Mix %
(Physical)
44% 47% 46% 44% 45% 50% 49% 47%
Physical RPU1 $822 $781 $748 $755 $773 $758 $742 $737
Online RPU1 $122 $112 $105 $111 $115 $108 $109 $110
Gross Margin2 40.5% 42.9% 43.0% 41.6% 39.1% 41.1% 42.5% 42.5%
1 Excluding Acquired Vehicles
2 Includes purchased vehicles
20

Increased industry (commercial) volumes drive average industry
transaction wholesale prices higher (ADESA)
Revenue per unit sold increased as a result of increased commercial
mix (ADESA)
Declining used car values increase likelihood of total losses (IAA)
YoY Index
Change
Age 1Q17 2Q17 3Q17 4Q17 YTD17
Industry All +4.1% +3.7% +1.9% +2.3% +3.0%
JCP/NADA 0-8 yrs -4.7% -4.5% -2.6% -0.1% -3.0%
Black Book 2-6 yrs -5.9% -5.1% -3.5% -0.8% -3.9%
RVI 2-5 yrs -6.1% -5.6% -2.7% +0.1% -3.3%
Used Vehicle Value Indices – Quarterly 2017
21
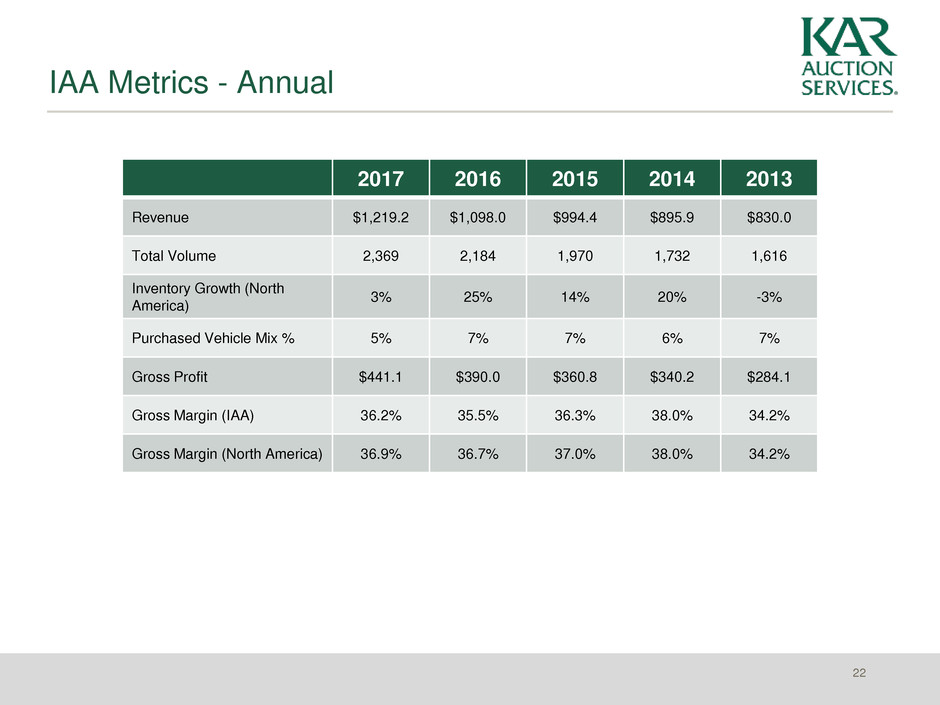
IAA Metrics - Annual
2017 2016 2015 2014 2013
Revenue $1,219.2 $1,098.0 $994.4 $895.9 $830.0
Total Volume 2,369 2,184 1,970 1,732 1,616
Inventory Growth (North
America)
3% 25% 14% 20% -3%
Purchased Vehicle Mix % 5% 7% 7% 6% 7%
Gross Profit $441.1 $390.0 $360.8 $340.2 $284.1
Gross Margin (IAA) 36.2% 35.5% 36.3% 38.0% 34.2%
Gross Margin (North America) 36.9% 36.7% 37.0% 38.0% 34.2%
22

IAA Metrics - Quarter
4Q17 3Q17 2Q17 1Q17 4Q16 3Q16 2Q16 1Q16
Revenue $335.4 $287.7 $298.7 $297.4 $302.6 $261.0 $264.8 $269.6
Total Volume 635 562 580 592 610 516 523 534
Inventory Growth (North America) 3% 12% 9% 17% 25% 22% 11% 4%
Purchased Vehicle Mix % 4% 5% 5% 5% 6% 7% 6% 7%
Gross Profit $112.7 $102.9 $117.2 $108.3 $103.9 $92.5 $97.5 $96.1
Gross Margin (IAA) 33.6% 35.8% 39.2% 36.4% 34.3% 35.4% 36.8% 35.6%
Gross Margin (North America) 33.9% 36.3% 40.2% 37.4% 35.1% 36.6% 38.4% 37.1%
23
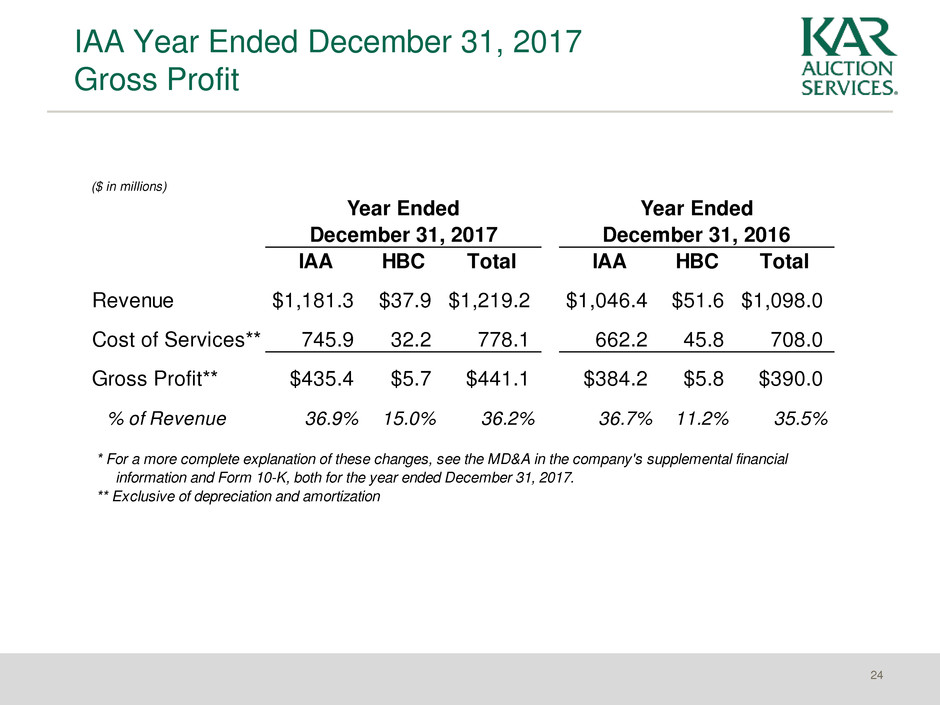
IAA Year Ended December 31, 2017
Gross Profit
24
($ in millions)
IAA HBC Total IAA HBC Total
Revenue $1,181.3 $37.9 $1,219.2 $1,046.4 $51.6 $1,098.0
Cost of Services** 745.9 32.2 778.1 662.2 45.8 708.0
Gross Profit** $435.4 $5.7 $441.1 $384.2 $5.8 $390.0
% of Revenue 36.9% 15.0% 36.2% 36.7% 11.2% 35.5%
* For a more complete explanation of these changes, see the MD&A in the company's supplemental financial
information and Form 10-K, both for the year ended December 31, 2017.
** Exclusive of depreciation and amortization
Year Ended
December 31, 2017
Year Ended
December 31, 2016

IAA Q4 2017 Gross Profit
25
($ in millions)
IAA HBC Total IAA HBC Total
Revenue $327.8 $7.6 $335.4 $290.6 $12.0 $302.6
Cost of Services** 216.6 6.1 222.7 188.6 10.1 198.7
Gross Profit** $111.2 $1.5 $112.7 $102.0 $1.9 $103.9
% of Revenue 33.9% 19.7% 33.6% 35.1% 15.8% 34.3%
* For a more complete explanation of these changes, see the MD&A in the company's supplemental financial
information and Form 10-K, both for the year ended December 31, 2017.
** Exclusive of depreciation and amortization
Three Months Ended
December 31, 2017
Three Months Ended
December 31, 2016

AFC Metrics - Annual
2017 2016 2015 2014 2013
Revenue $301.3 $286.8 $268.4 $250.1 $224.7
Loan Transaction Units (LTU) 1,688 1,718 1,607 1,445 1,355
Revenue per Loan Transaction,
Excluding “Other Service
Revenue”
$159 $148 $150 $155 $157
Ending Managed Finance
Receivables
$1,912.6 $1,792.2 $1,641.0 $1,371.1 $1,107.6
Ending Obligations Collateralized
by Finance Receivables
$1,358.1 $1,280.3 $1,189.0 $859.3 $763.3
% Vehicles Purchased at Auction 85% 83% 84% 84% 83%
Active Dealers 12,400 12,200 11,300 10,100 9,300
Vehicles per active dealer 15 15 16 16 14
Average Credit Line $250,000 $260,000 $230,000 $219,000 $185,000
Avg Value Outstanding per
Vehicle
$9,900 $9,500 $9,100 $8,630 $8,360
26
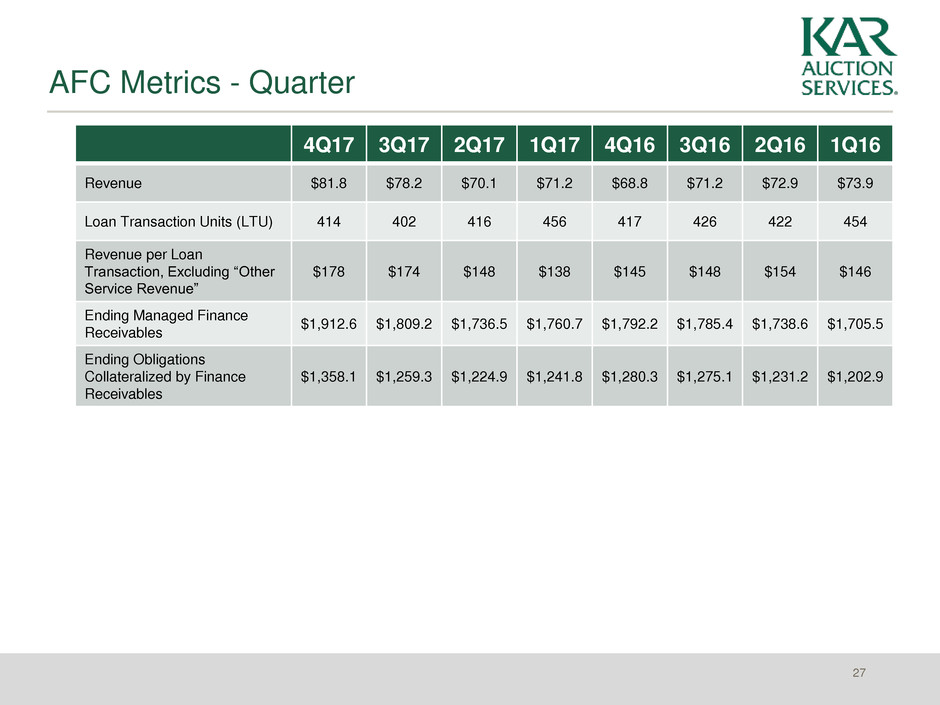
AFC Metrics - Quarter
4Q17 3Q17 2Q17 1Q17 4Q16 3Q16 2Q16 1Q16
Revenue $81.8 $78.2 $70.1 $71.2 $68.8 $71.2 $72.9 $73.9
Loan Transaction Units (LTU) 414 402 416 456 417 426 422 454
Revenue per Loan
Transaction, Excluding “Other
Service Revenue”
$178 $174 $148 $138 $145 $148 $154 $146
Ending Managed Finance
Receivables
$1,912.6 $1,809.2 $1,736.5 $1,760.7 $1,792.2 $1,785.4 $1,738.6 $1,705.5
Ending Obligations
Collateralized by Finance
Receivables
$1,358.1 $1,259.3 $1,224.9 $1,241.8 $1,280.3 $1,275.1 $1,231.2 $1,202.9
27
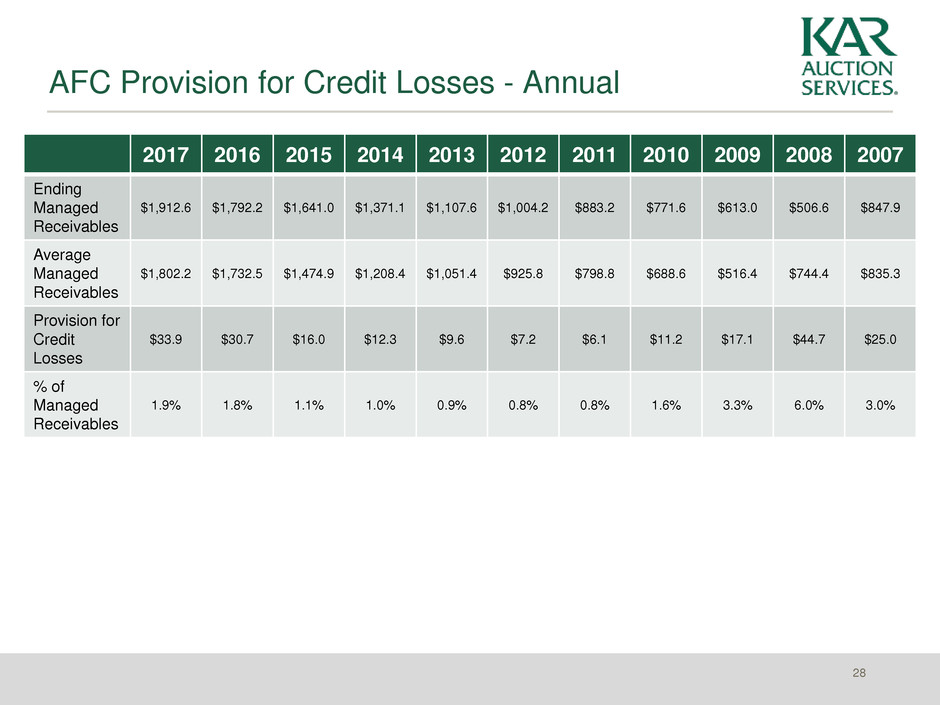
AFC Provision for Credit Losses - Annual
2017 2016 2015 2014 2013 2012 2011 2010 2009 2008 2007
Ending
Managed
Receivables
$1,912.6 $1,792.2 $1,641.0 $1,371.1 $1,107.6 $1,004.2 $883.2 $771.6 $613.0 $506.6 $847.9
Average
Managed
Receivables
$1,802.2 $1,732.5 $1,474.9 $1,208.4 $1,051.4 $925.8 $798.8 $688.6 $516.4 $744.4 $835.3
Provision for
Credit
Losses
$33.9 $30.7 $16.0 $12.3 $9.6 $7.2 $6.1 $11.2 $17.1 $44.7 $25.0
% of
Managed
Receivables
1.9% 1.8% 1.1% 1.0% 0.9% 0.8% 0.8% 1.6% 3.3% 6.0% 3.0%
28
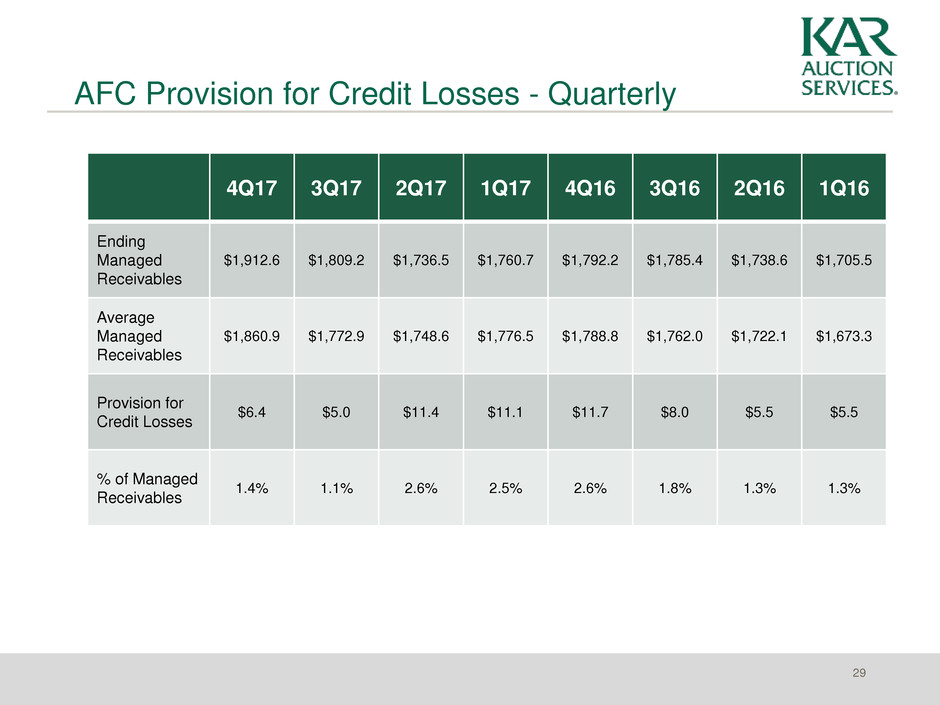
AFC Provision for Credit Losses - Quarterly
4Q17 3Q17 2Q17 1Q17 4Q16 3Q16 2Q16 1Q16
Ending
Managed
Receivables
$1,912.6 $1,809.2 $1,736.5 $1,760.7 $1,792.2 $1,785.4 $1,738.6 $1,705.5
Average
Managed
Receivables
$1,860.9 $1,772.9 $1,748.6 $1,776.5 $1,788.8 $1,762.0 $1,722.1 $1,673.3
Provision for
Credit Losses
$6.4 $5.0 $11.4 $11.1 $11.7 $8.0 $5.5 $5.5
% of Managed
Receivables
1.4% 1.1% 2.6% 2.5% 2.6% 1.8% 1.3% 1.3%
29

Appendix
Non-GAAP Financial Measures
31
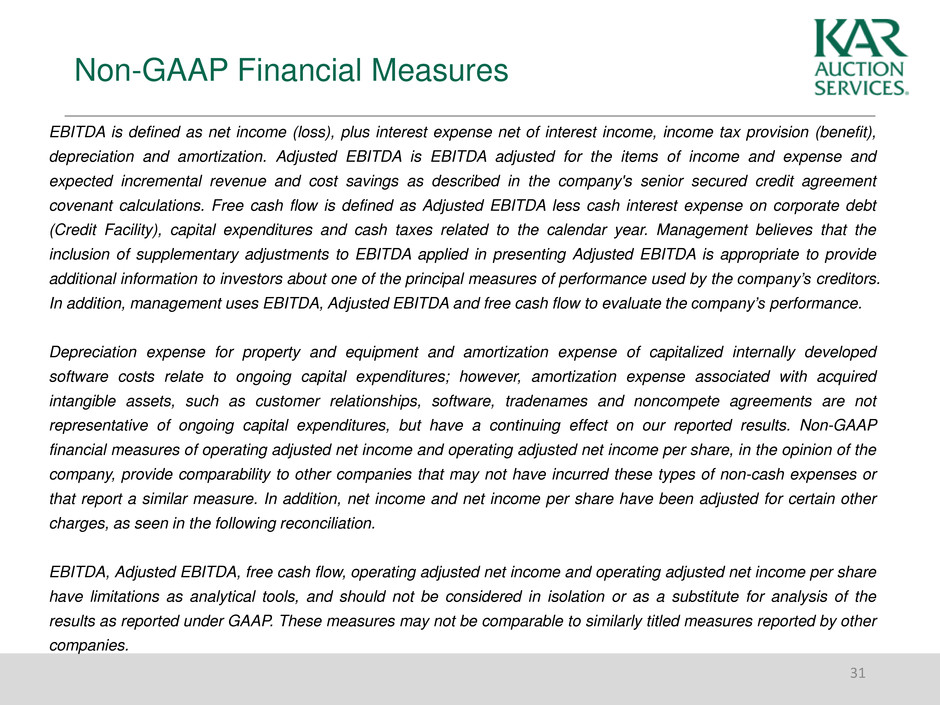
EBITDA is defined as net income (loss), plus interest expense net of interest income, income tax provision (benefit),
depreciation and amortization. Adjusted EBITDA is EBITDA adjusted for the items of income and expense and
expected incremental revenue and cost savings as described in the company's senior secured credit agreement
covenant calculations. Free cash flow is defined as Adjusted EBITDA less cash interest expense on corporate debt
(Credit Facility), capital expenditures and cash taxes related to the calendar year. Management believes that the
inclusion of supplementary adjustments to EBITDA applied in presenting Adjusted EBITDA is appropriate to provide
additional information to investors about one of the principal measures of performance used by the company’s creditors.
In addition, management uses EBITDA, Adjusted EBITDA and free cash flow to evaluate the company’s performance.
Depreciation expense for property and equipment and amortization expense of capitalized internally developed
software costs relate to ongoing capital expenditures; however, amortization expense associated with acquired
intangible assets, such as customer relationships, software, tradenames and noncompete agreements are not
representative of ongoing capital expenditures, but have a continuing effect on our reported results. Non-GAAP
financial measures of operating adjusted net income and operating adjusted net income per share, in the opinion of the
company, provide comparability to other companies that may not have incurred these types of non-cash expenses or
that report a similar measure. In addition, net income and net income per share have been adjusted for certain other
charges, as seen in the following reconciliation.
EBITDA, Adjusted EBITDA, free cash flow, operating adjusted net income and operating adjusted net income per share
have limitations as analytical tools, and should not be considered in isolation or as a substitute for analysis of the
results as reported under GAAP. These measures may not be comparable to similarly titled measures reported by other
companies.
Q4 2017 Adjusted EBITDA Reconciliation
32
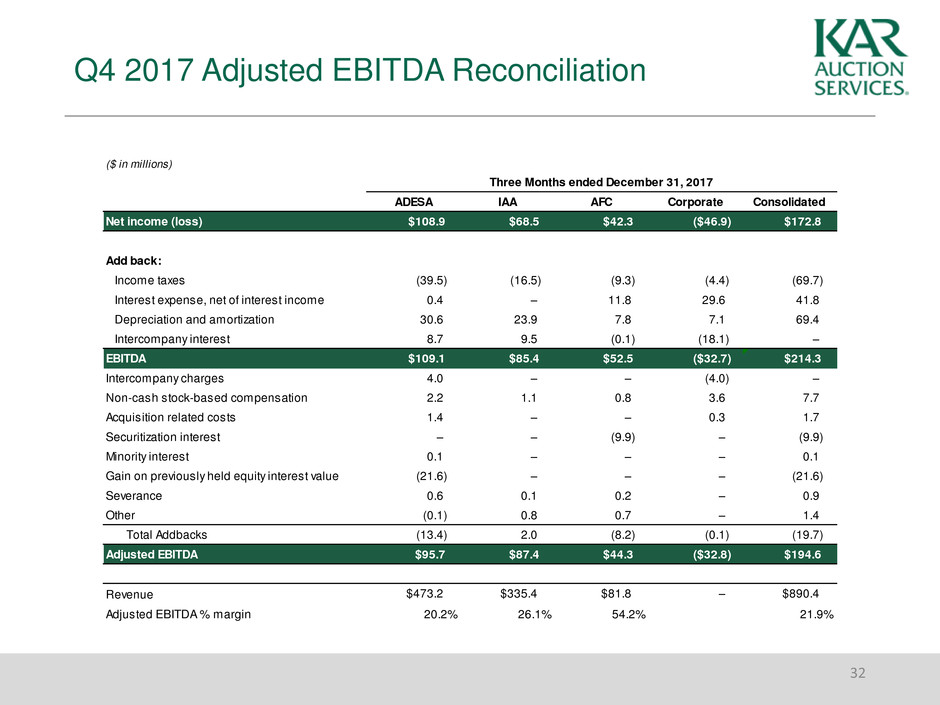
($ in millions)
Three Months ended December 31, 2017
ADESA IAA AFC Corporate Consolidated
Net income (loss) $108.9 $68.5 $42.3 ($46.9) $172.8
Add back:
Income taxes (39.5) (16.5) (9.3) (4.4) (69.7)
Interest expense, net of interest income 0.4 – 11.8 29.6 41.8
Depreciation and amortization 30.6 23.9 7.8 7.1 69.4
Intercompany interest 8.7 9.5 (0.1) (18.1) –
EBITDA $109.1 $85.4 $52.5 ($32.7) $214.3
Intercompany charges 4.0 – – (4.0) –
Non-cash stock-based compensation 2.2 1.1 0.8 3.6 7.7
Acquisition related costs 1.4 – – 0.3 1.7
Securitization interest – – (9.9) – (9.9)
Minority interest 0.1 – – – 0.1
Gain on previously held equity interest value (21.6) – – – (21.6)
Severance 0.6 0.1 0.2 – 0.9
Other (0.1) 0.8 0.7 – 1.4
Total Addbacks (13.4) 2.0 (8.2) (0.1) (19.7)
Adjusted EBITDA $95.7 $87.4 $44.3 ($32.8) $194.6
Revenue $473.2 $335.4 $81.8 – $890.4
Adjusted EBITDA % margin 20.2% 26.1% 54.2% 21.9%
Q4 2016 Adjusted EBITDA Reconciliation
33
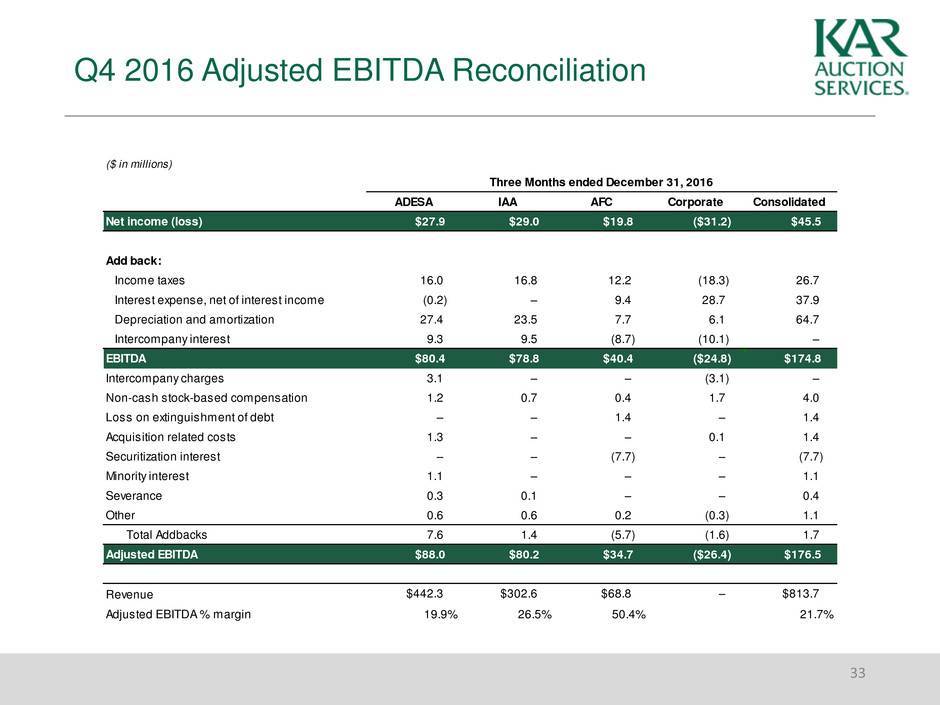
($ in millions)
Three Months ended December 31, 2016
ADESA IAA AFC Corporate Consolidated
Net income (loss) $27.9 $29.0 $19.8 ($31.2) $45.5
Add back:
Income taxes 16.0 16.8 12.2 (18.3) 26.7
Interest expense, net of interest income (0.2) – 9.4 28.7 37.9
Depreciation and amortization 27.4 23.5 7.7 6.1 64.7
Intercompany interest 9.3 9.5 (8.7) (10.1) –
EBITDA $80.4 $78.8 $40.4 ($24.8) $174.8
Intercompany charges 3.1 – – (3.1) –
Non-cash stock-based compensation 1.2 0.7 0.4 1.7 4.0
Loss on extinguishment of debt – – 1.4 – 1.4
Acquisition related costs 1.3 – – 0.1 1.4
Securitization interest – – (7.7) – (7.7)
Minority interest 1.1 – – – 1.1
Severance 0.3 0.1 – – 0.4
Other 0.6 0.6 0.2 (0.3) 1.1
Total Addbacks 7.6 1.4 (5.7) (1.6) 1.7
Adjusted EBITDA $88.0 $80.2 $34.7 ($26.4) $176.5
Revenue $442.3 $302.6 $68.8 – $813.7
Adjusted EBITDA % margin 19.9% 26.5% 50.4% 21.7%
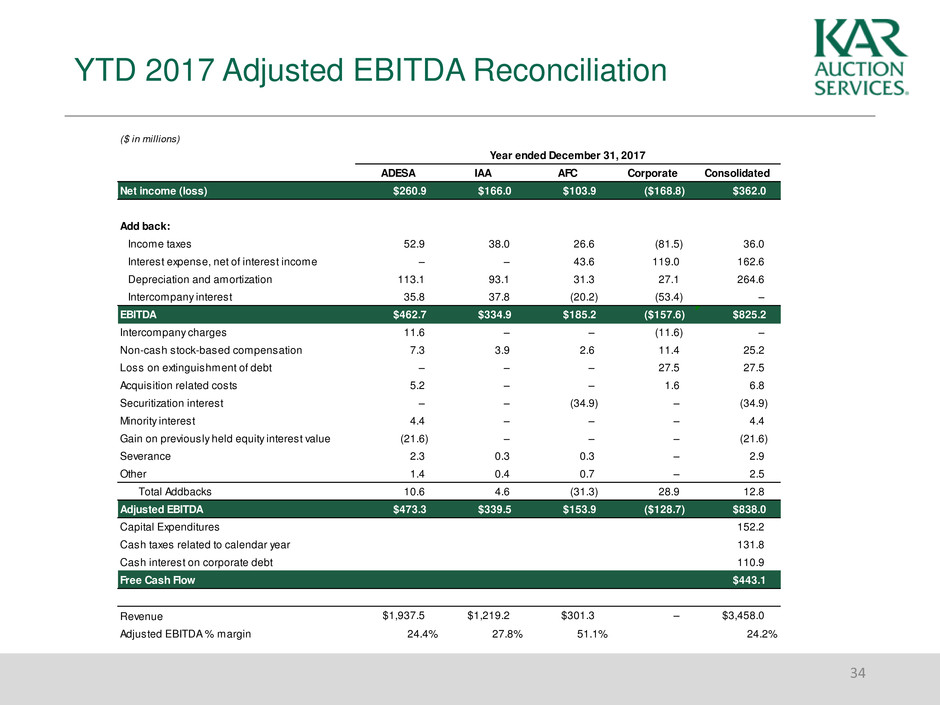
YTD 2017 Adjusted EBITDA Reconciliation
34
($ in millions)
Year ended December 31, 2017
ADESA IAA AFC Corporate Consolidated
Net income (loss) $260.9 $166.0 $103.9 ($168.8) $362.0
Add back:
Income taxes 52.9 38.0 26.6 (81.5) 36.0
Interest expense, net of interest income – – 43.6 119.0 162.6
Depreciation and amortization 113.1 93.1 31.3 27.1 264.6
Intercompany interest 35.8 37.8 (20.2) (53.4) –
EBITDA $462.7 $334.9 $185.2 ($157.6) $825.2
Intercompany charges 11.6 – – (11.6) –
Non-cash stock-based compensation 7.3 3.9 2.6 11.4 25.2
Loss on extinguishment of debt – – – 27.5 27.5
Acquisition related costs 5.2 – – 1.6 6.8
Securitization interest – – (34.9) – (34.9)
Minority interest 4.4 – – – 4.4
Gain on previously held equity interest value (21.6) – – – (21.6)
Severance 2.3 0.3 0.3 – 2.9
Other 1.4 0.4 0.7 – 2.5
Total Addbacks 10.6 4.6 (31.3) 28.9 12.8
Adjusted EBITDA $473.3 $339.5 $153.9 ($128.7) $838.0
Capital Expenditures 152.2
Cash taxes related to calendar year 131.8
Cash interest on corporate debt 110.9
Free Cash Flow $443.1
Revenue $1,937.5 $1,219.2 $301.3 – $3,458.0
Adjusted EBITDA % margin 24.4% 27.8% 51.1% 24.2%
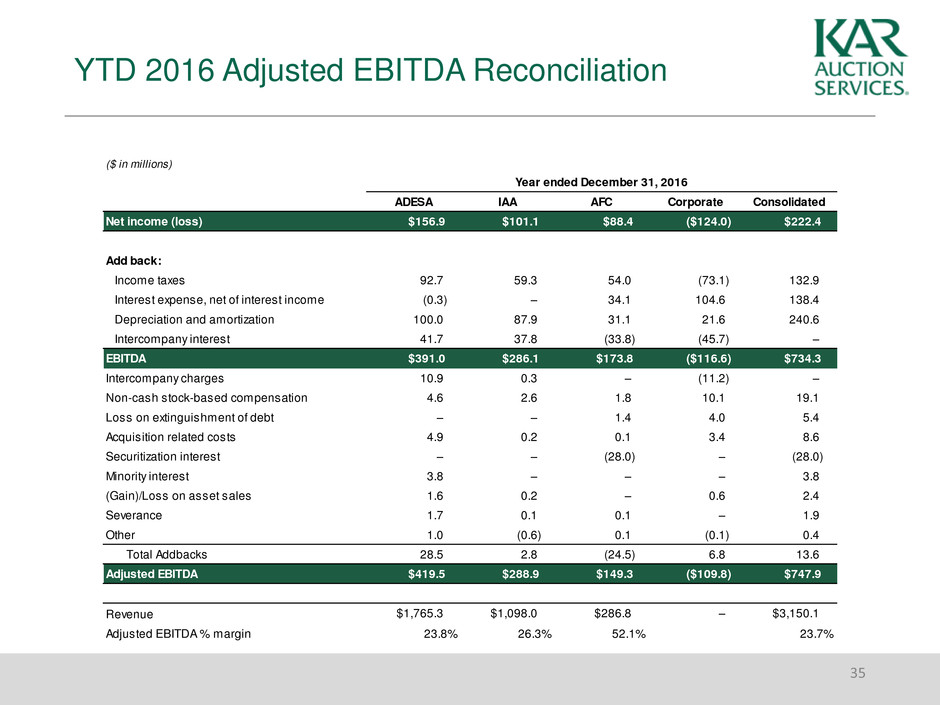
YTD 2016 Adjusted EBITDA Reconciliation
35
($ in millions)
Year ended December 31, 2016
ADESA IAA AFC Corporate Consolidated
Net income (loss) $156.9 $101.1 $88.4 ($124.0) $222.4
Add back:
Income taxes 92.7 59.3 54.0 (73.1) 132.9
Interest expense, net of interest income (0.3) – 34.1 104.6 138.4
Depreciation and amortization 100.0 87.9 31.1 21.6 240.6
Intercompany interest 41.7 37.8 (33.8) (45.7) –
EBITDA $391.0 $286.1 $173.8 ($116.6) $734.3
Intercompany charges 10.9 0.3 – (11.2) –
Non-cash stock-based compensation 4.6 2.6 1.8 10.1 19.1
Loss on extinguishment of debt – – 1.4 4.0 5.4
Acquisition related costs 4.9 0.2 0.1 3.4 8.6
Securitization interest – – (28.0) – (28.0)
Minority interest 3.8 – – – 3.8
(Gain)/Loss on asset sales 1.6 0.2 – 0.6 2.4
Severance 1.7 0.1 0.1 – 1.9
Other 1.0 (0.6) 0.1 (0.1) 0.4
Total Addbacks 28.5 2.8 (24.5) 6.8 13.6
Adjusted EBITDA $419.5 $288.9 $149.3 ($109.8) $747.9
Revenue $1,765.3 $1,098.0 $286.8 – $3,150.1
Adjusted EBITDA % margin 23.8% 26.3% 52.1% 23.7%

Operating Adjusted Net Income
per Share Reconciliation
36
($ in millions, except per share amounts), (unaudited)
2017 2016 2017 2016
Net income $172.8 $45.5 $362.0 $222.4
Acquired amortization expense 27.0 25.8 103.7 97.1
Loss on extinguishment of debt – 1.4 27.5 5.4
Gain on previously held equity interest value (21.6) – (21.6) –
Reduction in taxes for revaluation of deferred taxes (102.7) – (102.7) –
Increase in taxes for mandatory repatriation of undistributed
foreign earnings
11.1 – 11.1 –
Income taxes
(1) (1.1) (10.0) (35.1) (38.3)
Operating adjusted net income $85.5 $62.7 $344.9 $286.6
Net income per share − diluted $1.27 $0.33 $2.62 $1.60
Acquired amortization expense 0.20 0.19 0.75 0.70
Loss on extinguishment of debt – 0.01 0.20 0.04
Gain on previously held equity interest value (0.16) – (0.16) –
Reduction in taxes for revaluation of deferred taxes (0.75) – (0.74) –
Increase in taxes for mandatory repatriation of undistributed
foreign earnings
0.08 – 0.08 –
Income taxes (0.01) (0.08) (0.25) (0.28)
Operating adjusted net income per share − diluted $0.63 $0.45 $2.50 $2.06
Weighted average diluted shares 136.5 138.9 138.0 139.1
Three Months ended
December 31,
Year ended
December 31,
(1)The effective tax rate for 2016 was used to determine the amount of income tax benefit on the adjustments to net income. The effective
income tax rates for 2017 were adjusted to reflect the tax reform items reflected as separate line items in the above reconciliation
(revaluation of deferred taxes and repatriation of undistributed foreign earnings).
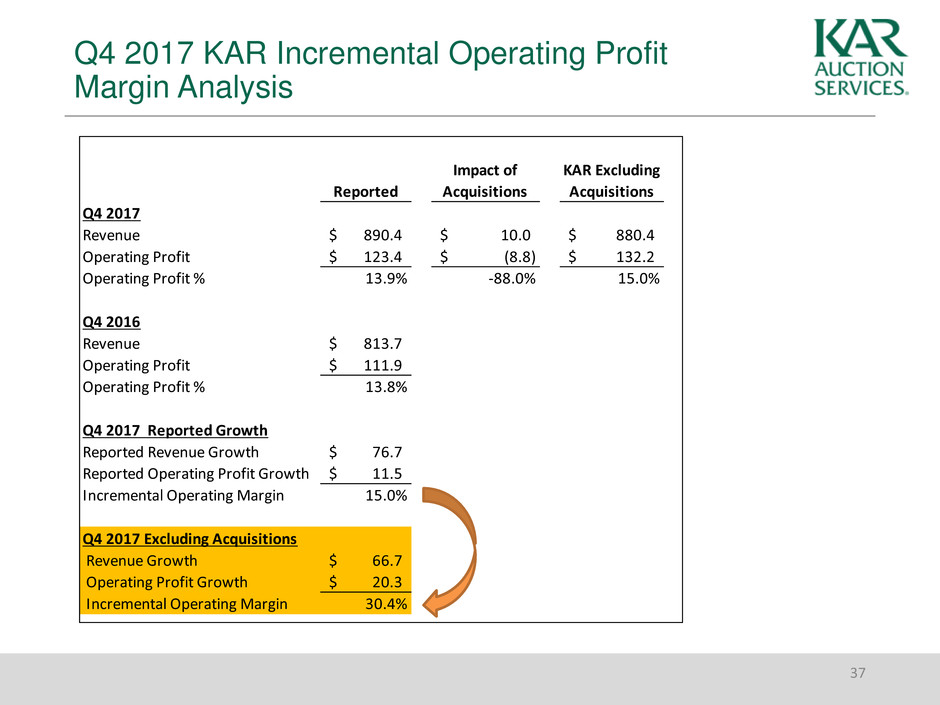
Q4 2017 KAR Incremental Operating Profit
Margin Analysis
37
Reported
Impact of
Acquisitions
KAR Excluding
Acquisitions
Q4 2017
Revenue 890.4$ 10.0$ 880.4$
Operating Profit 123.4$ (8.8)$ 132.2$
Operating Profit % 13.9% -88.0% 15.0%
Q4 2016
Revenue 813.7$
Operating Profit 111.9$
Operating Profit % 13.8%
Q4 2017 Reported Growth
Reported Revenue Growth 76.7$
Reported Operating Profit Growth 11.5$
Incremental Operating Margin 15.0%
Q4 2017 Excluding Acquisitions
Revenue Growth 66.7$
Operating Profit Growth 20.3$
Incremental Operating Margin 30.4%
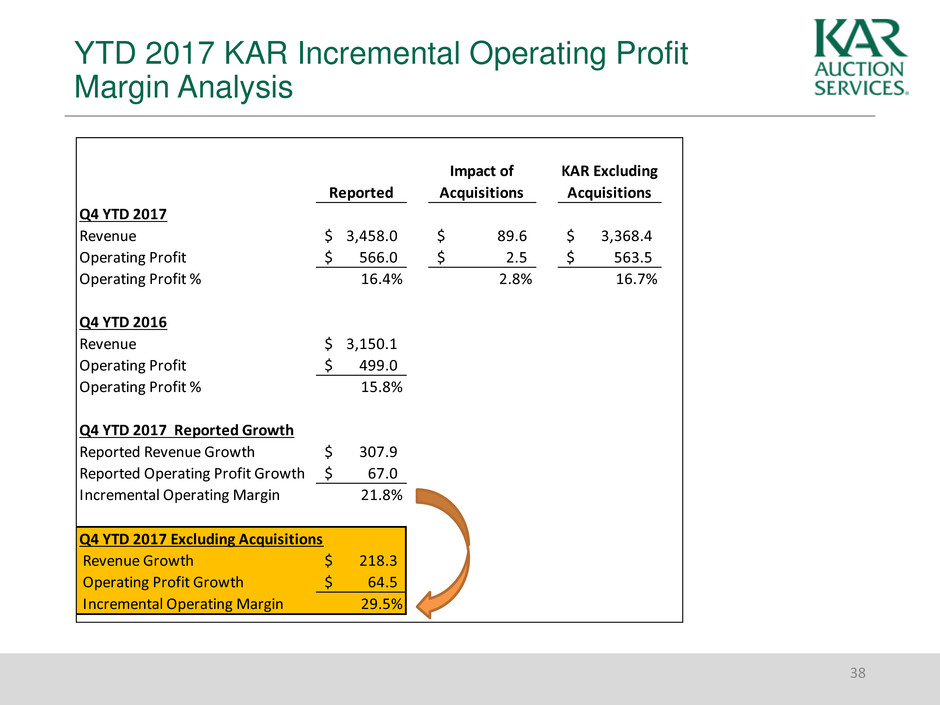
YTD 2017 KAR Incremental Operating Profit
Margin Analysis
38
Reported
Impact of
Acquisitions
KAR Excluding
Acquisitions
Q4 YTD 2017
Revenue 3,458.0$ 89.6$ 3,368.4$
Operating Profit 566.0$ 2.5$ 563.5$
Operating Profit % 16.4% 2.8% 16.7%
Q4 YTD 2016
Revenue 3,150.1$
Operating Profit 499.0$
Operating Profit % 15.8%
Q4 YTD 2017 Reported Growth
Reported Revenue Growth 307.9$
Reported Operating Profit Growth 67.0$
Incremental Operating Margin 21.8%
Q4 YTD 2017 Excluding Acquisitions
Revenue Growth 218.3$
Operating Profit Growth 64.5$
Incremental Operating Margin 29.5%
