Attached files
| file | filename |
|---|---|
| 8-K - 8-K - Nexeo Solutions, Inc. | q32017earningsrelease.htm |
| EX-99.1 - EXHIBIT 99.1 - Nexeo Solutions, Inc. | q320178kexhibit991.htm |

1
THIRD QUARTER FISCAL YEAR 2017
Earnings Conference Call & Presentation
August 9, 2017 at 9:00 a.m. CT (10:00 a.m. ET)

2
Third Quarter Fiscal Year 2017
Welcome to Nexeo’s Earnings Conference Call and Presentation
August 9, 2017 beginning at 9:00 a.m. CT (10:00 a.m. ET)
…Please stand by, we will begin momentarily
Dial-In Information
Domestic: +1.844.412.1004
International: +1.216.562.0451
Passcode: 50090074
3
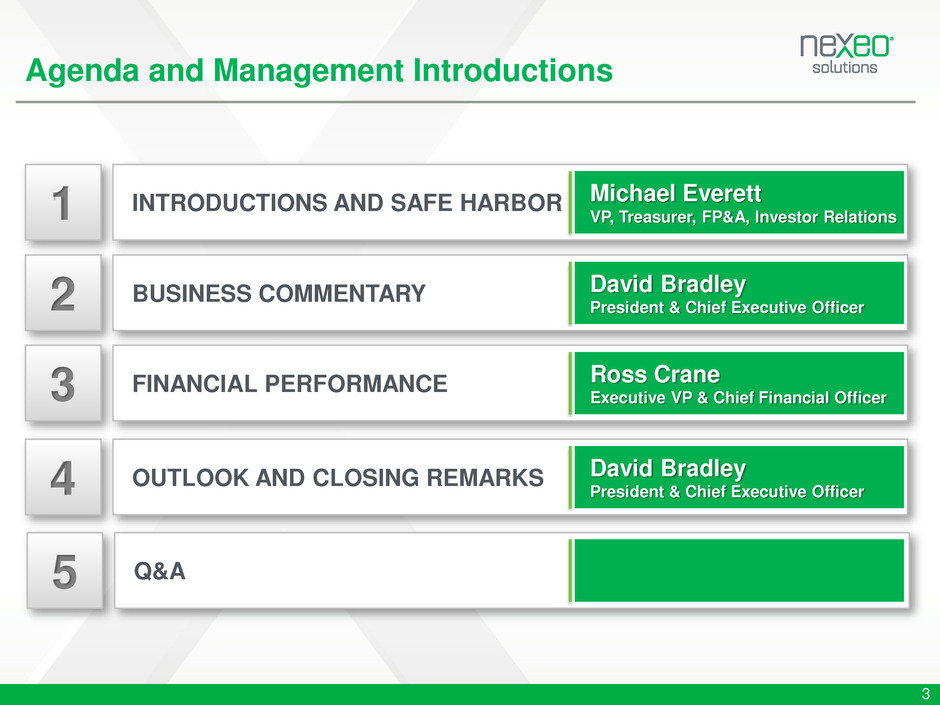
Agenda and Management Introductions
1 INTRODUCTIONS AND SAFE HARBOR
2 BUSINESS COMMENTARY
3 FINANCIAL PERFORMANCE
4 OUTLOOK AND CLOSING REMARKS
Michael Everett
VP, Treasurer, FP&A, Investor Relations
David Bradley
President & Chief Executive Officer
Ross Crane
Executive VP & Chief Financial Officer
David Bradley
President & Chief Executive Officer
5 Q&A

4
Non-GAAP Financial Measures and Safe Harbor
Non-GAAP Financial Measures
Certain financial measures presented herein, including EBITDA, Adjusted EBITDA and Net Debt were derived based
on methodologies other than in accordance with generally accepted accounting principles (GAAP). We have included
these measures because we believe they are indicative of our operating performance, are used by investors and
analysts to evaluate us and can facilitate comparisons across periods. As presented by us, these measures may not
be comparable to similarly titled measures reported by other companies. EBITDA, Adjusted EBITDA and Net Debt
should be considered in addition to, not as substitutes for, financial measures presented in accordance with GAAP. For
a reconciliation of EBITDA, Adjusted EBITDA and Net Debt to the most comparable GAAP financial measure, see the
appendix slides.
Safe Harbor
Forward Looking Statements: This presentation contains statements related to Nexeo Solutions, Inc.’s (“Nexeo” or the
“Company”) future plans and expectations and, as such, includes “forward-looking statements” within the meaning of
the federal securities laws. Forward-looking statements are those statements that are based upon management’s
current plans and expectations as opposed to historical and current facts. Although the forward-looking statements
contained in this presentation reflect management’s current assumptions based upon information currently available to
management and based upon that which management believes to be reasonable assumptions, the Company cannot
be certain that actual results will be consistent with these forward-looking statements. The Company’s future results
will depend upon various risks and uncertainties, including the risks and uncertainties discussed in the Company’s
SEC filings, including in the sections entitled “Risk Factors” in such SEC filings. The Company does not intend to
provide all information enclosed in this presentation on an ongoing basis.
BUSINESS COMMENTARY
David Bradley
President & Chief Executive Officer
Third Quarter Performance and Achievements
6
Attractive Industry
Growth Characteristics
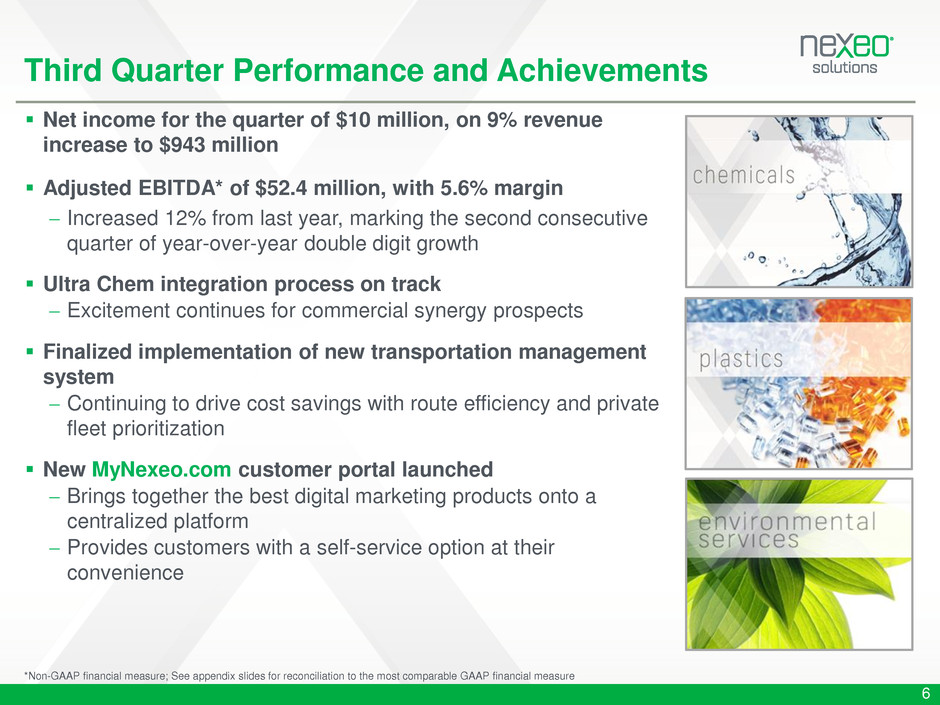
Net income for the quarter of $10 million, on 9% revenue
increase to $943 million
Adjusted EBITDA* of $52.4 million, with 5.6% margin
Increased 12% from last year, marking the second consecutive
quarter of year-over-year double digit growth
Ultra Chem integration process on track
Excitement continues for commercial synergy prospects
Finalized implementation of new transportation management
system
Continuing to drive cost savings with route efficiency and private
fleet prioritization
New MyNexeo.com customer portal launched
Brings together the best digital marketing products onto a
centralized platform
Provides customers with a self-service option at their
convenience
*Non-GAAP financial measure; See appendix slides for reconciliation to the most comparable GAAP financial measure

FINANCIAL PERFORMANCE
Ross Crane
Chief Financial Officer
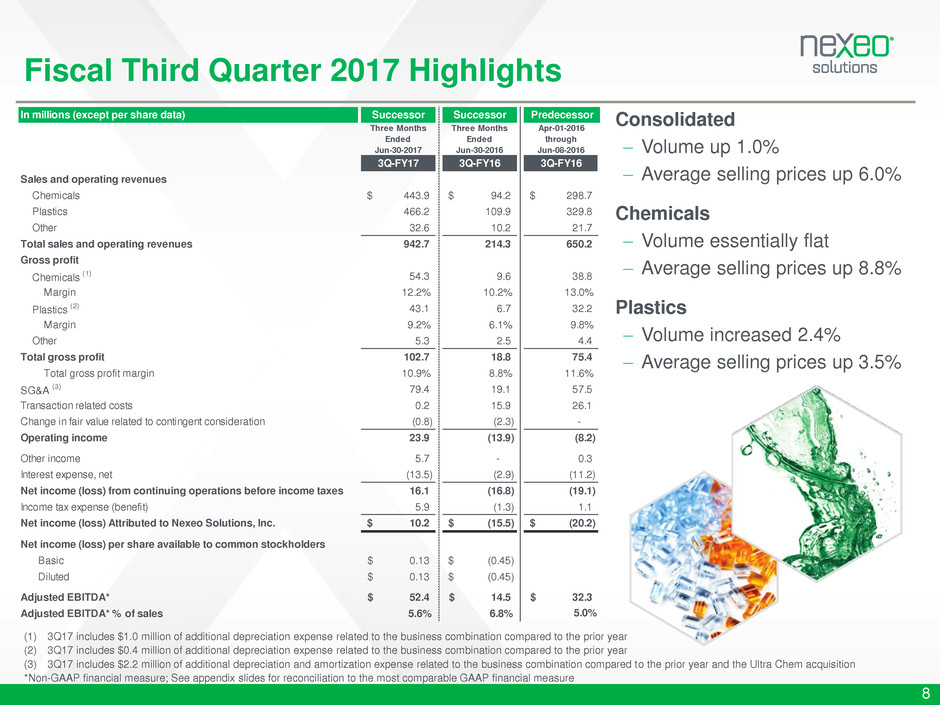
Consolidated
Volume up 1.0%
Average selling prices up 6.0%
Chemicals
Volume essentially flat
Average selling prices up 8.8%
Plastics
Volume increased 2.4%
Average selling prices up 3.5%
Fiscal Third Quarter 2017 Highlights
8
(1) 3Q17 includes $1.0 million of additional depreciation expense related to the business combination compared to the prior year
(2) 3Q17 includes $0.4 million of additional depreciation expense related to the business combination compared to the prior year
(3) 3Q17 includes $2.2 million of additional depreciation and amortization expense related to the business combination compared to the prior year and the Ultra Chem acquisition
*Non-GAAP financial measure; See appendix slides for reconciliation to the most comparable GAAP financial measure
In millions (except per share data) Successor Successor
Three Months
Ended
Jun-30-2017
Three Months
Ended
Jun-30-2016
Apr-01-2016
through
Jun-08-2016
3Q-FY17 3Q-FY16 3Q-FY16
Sales and operating revenues
Chemicals 443.9$ 94.2$ 298.7$
Plastics 466.2 109.9 329.8
Other 32.6 10.2 21.7
Total sales and operating revenues 942.7 214.3 650.2
Gross profit
Chemicals
(1) 54.3 9.6 38.8
Margin 12.2% 10.2% 13.0%
Plastics
(2) 43.1 6.7 32.2
Margin 9.2% 6.1% 9.8%
Other 5.3 2.5 4.4
Total gross profit 102.7 18.8 75.4
Total gross profit margin 10.9% 8.8% 11.6%
SG&A
(3) 79.4 19.1 57.5
Transaction related costs 0.2 15.9 26.1
Change in fair value related to contingent consideration (0.8) (2.3) -
Operating income 23.9 (13.9) (8.2)
Other income 5.7 - 0.3
Interest expense, net (13.5) (2.9) (11.2)
Net income (loss) from continuing operations before income taxes 16.1 (16.8) (19.1)
Income tax expense (benefit) 5.9 (1.3) 1.1
Net income (loss) Attributed to Nexeo Solutions, Inc. 10.2$ (15.5)$ (20.2)$
Net income (loss) per share available to common stockholders
Basic 0.13$ (0.45)$
Diluted 0.13$ (0.45)$
Adjusted EBITDA* 52.4$ 14.5$ 32.3$
Adjusted EBITDA* % of sales 5.6% 6.8%
Predecessor
5.0%
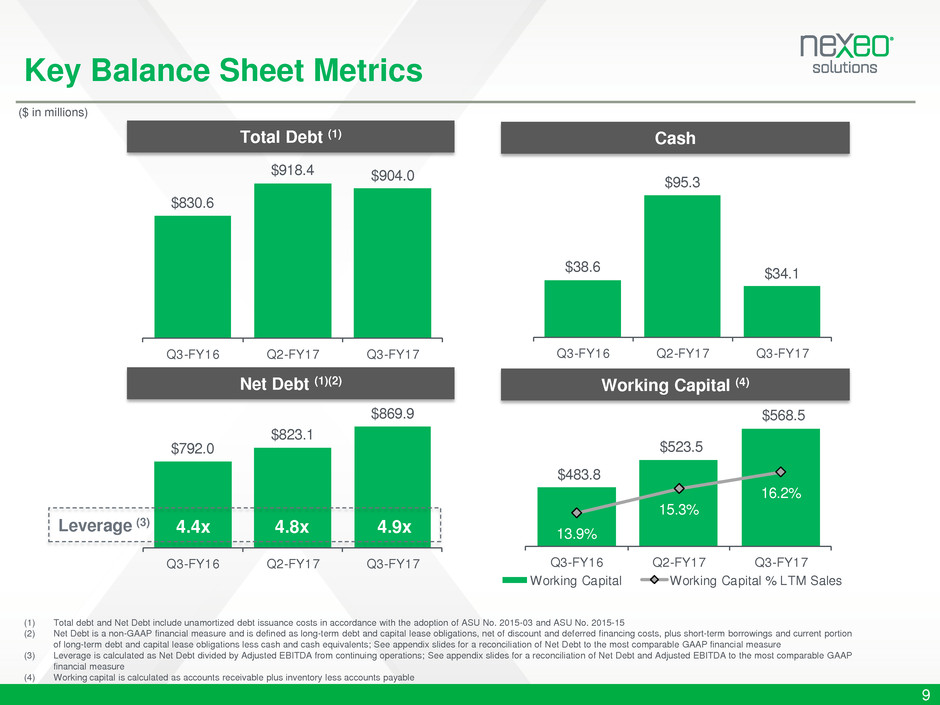
Key Balance Sheet Metrics
9
(1) Total debt and Net Debt include unamortized debt issuance costs in accordance with the adoption of ASU No. 2015-03 and ASU No. 2015-15
(2) Net Debt is a non-GAAP financial measure and is defined as long-term debt and capital lease obligations, net of discount and deferred financing costs, plus short-term borrowings and current portion
of long-term debt and capital lease obligations less cash and cash equivalents; See appendix slides for a reconciliation of Net Debt to the most comparable GAAP financial measure
(3) Leverage is calculated as Net Debt divided by Adjusted EBITDA from continuing operations; See appendix slides for a reconciliation of Net Debt and Adjusted EBITDA to the most comparable GAAP
financial measure
(4) Working capital is calculated as accounts receivable plus inventory less accounts payable
$830.6
$918.4 $904.0
Q3-FY16 Q2-FY17 Q3-FY17
$792.0
$823.1
$869.9
Q3-FY16 Q2-FY17 Q3-FY17
$483.8
$523.5
$568.5
13.9%
15.3%
16.2%
Q3-FY16 Q2-FY17 Q3-FY17
Working Capital Working Capital % LTM Sales
$38.6
$95.3
$34.1
Q3-FY16 Q2-FY17 Q3-FY17
Working Capital (4)Net Debt (1)(2)
CashTotal Debt (1)
($ in millions)
4.9x4.8x4.4xLeverage (3)
CLOSING REMARKS
David Bradley
President & Chief Executive Officer

Guidance and Outlook
11
Item 2016 2017
Revenue $3,406 M
Gross Profit $380 M
SG&A $301 M
FY Capex (1) $19 M
Cash Tax $6 M
D&A $58 M
Cash Interest $50 M
FY Adjusted EBITDA* $174 M $180 - 185 M
Revised Fiscal Year 2017 Guidance
(1) Net of asset sales
*Non-GAAP financial measure; See appendix slides for reconciliation to the most comparable GAAP financial measure
Supplier disruption in Plastics
Persisting issues since major supplier’s
transition to a new IT platform last October
Estimated FY17 negative impact
of approximately $5 million
Common carrier rate increases
Adjusting prices to reflect increased
freight costs
Estimated FY17 negative impact
between $4 and $5 million
Long-term growth objectives
Grow commodity volumes better than GDP
Grow specialty volumes twice the rate of
commodities
Supplement growth through targeted bolt-on acquisitions at reasonable multiples
Strategic plan for margin expansion
Leverage industry-leading, centralized, proprietary operating platform to drive productivity and cost
enhancements across the company
Improve specialty mix by continuing to expand specialty line-card with new supplier authorizations
and targeted acquisitions

QUESTION AND ANSWER
To ask a question live over the phone, please press * then the
number 1 on your telephone keypad to queue our operator
If your question has been answered or you wish to remove
yourself from the queue, please press #

THANK YOU FOR ATTENDING
We look forward to hosting you next quarter!
Please feel free to reach out to our Investor Relations Personnel via the contact
information below with any outstanding questions you have or if you would like to
discuss our strategy and investment proposition in further detail
+1.281.297.0856
Investor.Relations@nexeosolutions.com
Appendix

Capital Structure Summary
15
Shares Used For
Basic and Fully Diluted EPS Calculation
Share
Count
Basic - Average Common Shares Outstanding 76.7 million
Diluted - Average Common Shares Outstanding 76.8 million
Shares Excluded From
Basic and Fully Diluted EPS Calculation
Share
Count
Founder Shares (1) 12.5 million
Warrants (2) 5.8 million*
Excess Shares (Deferred Cash Consideration) 5.2 million
Note: For a complete description of the Founder Shares, Warrants and Deferred Cash Consideration, see the Company’s (i) Final prospectus related to the Registration Statement on
Form S-3/A filed on 08/30/16, (ii) Current Report on Form 8-K filed with the SEC on 06/15/16, and (iii) Current Report on Form 8-K filed with the SEC on 03/22/16
(1) Founder Shares Vesting and Forfeiture: The Founder Shares vest as follows: (i) 50% of the Founder Shares vest on the first day that the last sale price of the Company’s Common
Stock equals or exceeds $12.50 per share for any 20 trading days within any 30 trading day period; and (ii) the remaining 50% of the Founder Shares vest on the first day that the last
sale price of the Company’s common stock equals or exceeds $15.00 per share for any 20 trading days within any 30 trading day period; If none of the above vesting requirements are
met, the Founder Shares will be forfeited on 06/09/26
(2) Warrants: 50,025,000 warrants are outstanding and have an exercise price of $5.75 per half share of common stock (25,012,500 shares of common stock issuable); Warrants expire
06/09/21
*Assumes cashless exercise and stock price of $15.00 per share; Full cash exercise would require $288 million from warrant holders

Non-GAAP Reconciliation
16
(1) Includes 69 days of operating activities
(2) Includes 22 days of the acquired business’ operating activities
(3) See Non-GAAP Reconciliation: Quarterly – Other Operating Expenses, Net
Nexeo Solutions, Inc. and Subsidiaries
Quarterly Adjusted EBITDA Reconciliation
Apr. 1 - Jun. 8
2016(1) Q3-FY16(2) Q4-FY16 Q1-FY17 Q2-FY17 Q3-FY17
Net income (loss) $ (20.2) $ (15.5) $ 8.7 $ (8.3) $ (1.1) $ 10.2
Interest expense, net 11.2 2.9 12.0 11.9 12.4 13.5
Income tax expense (benefit) 1.1 (1.3) 2.5 (2.7) 0.8 5.9
Depreciation and amortization 10.3 4.3 16.3 16.8 17.8 18.9
Other operating expenses, net (3) 29.9 24.1 6.9 16.1 15.8 3.9
Adjusted EBITDA from continuing operations $ 32.3 $ 14.5 $ 46.4 $ 33.8 $ 45.7 $ 52.4
($ in millions, Unaudited)
Predecessor Successor
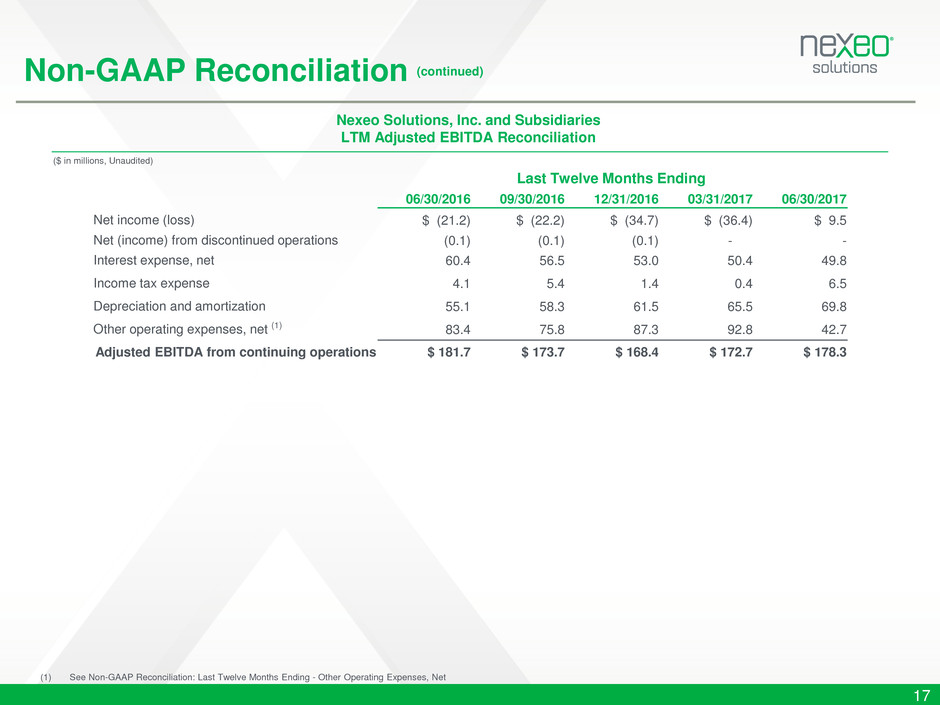
Non-GAAP Reconciliation (continued)
17
(1) See Non-GAAP Reconciliation: Last Twelve Months Ending - Other Operating Expenses, Net
Nexeo Solutions, Inc. and Subsidiaries
LTM Adjusted EBITDA Reconciliation
06/30/2016 09/30/2016 12/31/2016 03/31/2017 06/30/2017
Net income (loss) $ (21.2) $ (22.2) $ (34.7) $ (36.4) $ 9.5
Net (income) from discontinued operations (0.1) (0.1) (0.1) - -
Interest expense, net 60.4 56.5 53.0 50.4 49.8
Income tax expense 4.1 5.4 1.4 0.4 6.5
Depreciation and amortization 55.1 58.3 61.5 65.5 69.8
Other operating expenses, net (1) 83.4 75.8 87.3 92.8 42.7
Adjusted EBITDA from continuing operations $ 181.7 $ 173.7 $ 168.4 $ 172.7 $ 178.3
Last Twelve Months Ending
($ in millions, Unaudited)

Non-GAAP Reconciliation (continued)
18
Nexeo Solutions, Inc. and Subsidiaries
Quarterly Other Operating Expenses, Net
Apr. 1-Jun. 8
2016(1) Q3-FY16(2) Q4-FY16 Q1-FY17 Q2-FY17 Q3-FY17
Management add-backs (3) $ 1.9 $ 0.6 $ 3.4 $ 2.5 $ 3.4 $ 2.2
Change in FV of contingent consideration obligations - - (11.2) 10.6 10.0 (0.8)
Foreign exchange (gains) losses, net (4) 1.3 0.4 0.7 0.8 0.8 (0.4)
Management fees (5) 0.5 - - - - -
Compensation expense related to management
equity plan (non-cash)
0.1 0.3 1.2 1.4 1.3 1.5
Gain on sale of Franklin Park facility - - 2.6 - - -
Inventory step up - 6.9 6.9 - - 1.2
Transaction and other transaction-related items (6) 26.1 15.9 3.3 0.8 0.3 0.2
Other operating expenses, net $ 29.9 $ 24.1 $ 6.9 $ 16.1 $ 15.8 $ 3.9
(1) Includes 69 days of operating activities
(2) Includes 22 days of the acquired business’ operating activities
(3) One-time management adjustments associated with integration, restructuring and transformational activities not directly related to the business combination
(4) Includes the impact of net realized and unrealized foreign exchange gains and losses related to transactions in currencies other than the functional currency of the respective legal entity for the purpose of
evaluating the Company’s performance and facilitate more meaningful comparisons of performance to other fiscal periods
(5) Management, monitoring, consulting, reimbursable fees and leverage fees, per the agreement with TPG Capital, L.P.; In connection with the business combination, this agreement was terminated
(6) Includes professional and transaction costs related to acquisitions, potential acquisitions and other business combination related items
Predecessor Successor
($ in millions, Unaudited)
Non-GAAP Reconciliation (continued)
19
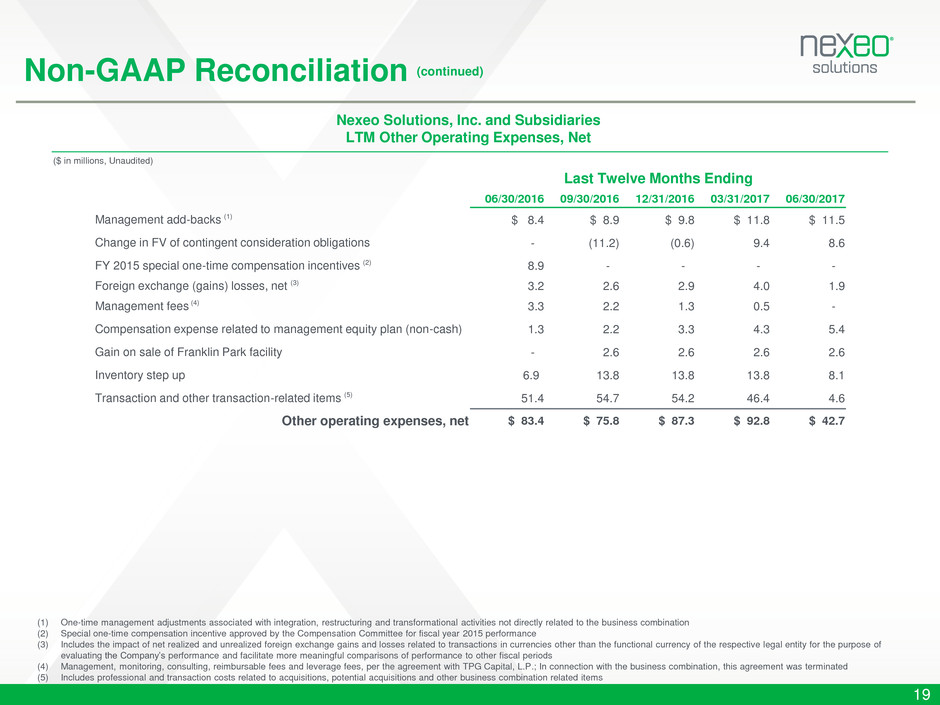
Nexeo Solutions, Inc. and Subsidiaries
LTM Other Operating Expenses, Net
06/30/2016 09/30/2016 12/31/2016 03/31/2017 06/30/2017
Management add-backs (1) $ 8.4 $ 8.9 $ 9.8 $ 11.8 $ 11.5
Change in FV of contingent consideration obligations - (11.2) (0.6) 9.4 8.6
FY 2015 special one-time compensation incentives (2) 8.9 - - - -
Foreign exchange (gains) losses, net (3) 3.2 2.6 2.9 4.0 1.9
Management fees (4) 3.3 2.2 1.3 0.5 -
Compensation expense related to management equity plan (non-cash) 1.3 2.2 3.3 4.3 5.4
Gain on sale of Franklin Park facility - 2.6 2.6 2.6 2.6
Inventory step up 6.9 13.8 13.8 13.8 8.1
Transaction and other transaction-related items (5) 51.4 54.7 54.2 46.4 4.6
Other operating expenses, net $ 83.4 $ 75.8 $ 87.3 $ 92.8 $ 42.7
(1) One-time management adjustments associated with integration, restructuring and transformational activities not directly related to the business combination
(2) Special one-time compensation incentive approved by the Compensation Committee for fiscal year 2015 performance
(3) Includes the impact of net realized and unrealized foreign exchange gains and losses related to transactions in currencies other than the functional currency of the respective legal entity for the purpose of
evaluating the Company’s performance and facilitate more meaningful comparisons of performance to other fiscal periods
(4) Management, monitoring, consulting, reimbursable fees and leverage fees, per the agreement with TPG Capital, L.P.; In connection with the business combination, this agreement was terminated
(5) Includes professional and transaction costs related to acquisitions, potential acquisitions and other business combination related items
Last Twelve Months Ending
($ in millions, Unaudited)
Non-GAAP Reconciliation (continued)
20
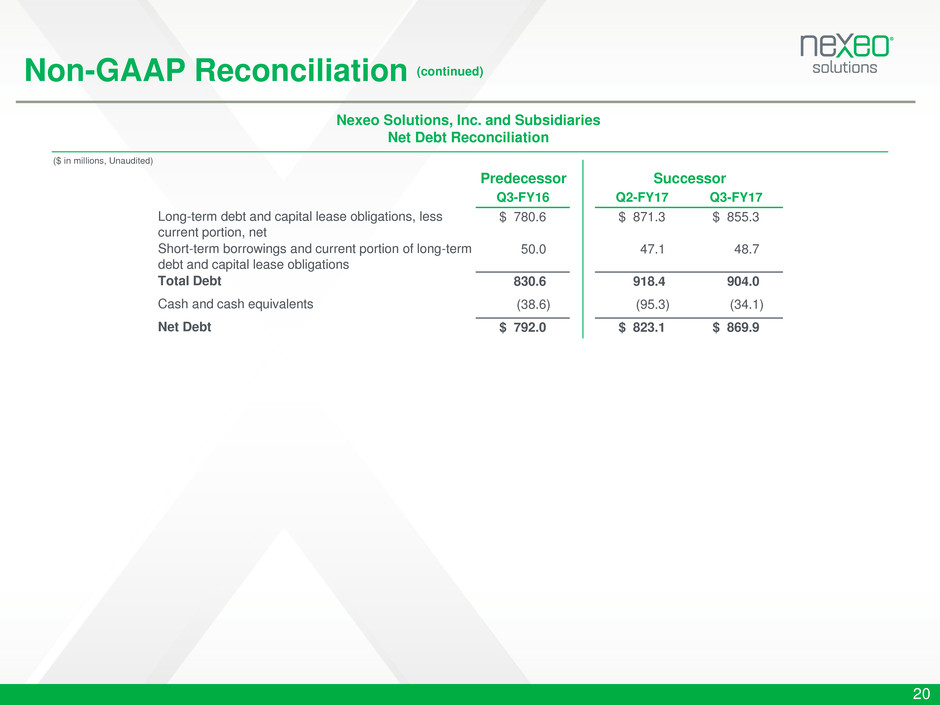
Nexeo Solutions, Inc. and Subsidiaries
Net Debt Reconciliation
Q3-FY16 Q2-FY17 Q3-FY17
Long-term debt and capital lease obligations, less
current portion, net
$ 780.6 $ 871.3 $ 855.3
Short-term borrowings and current portion of long-term
debt and capital lease obligations
50.0 47.1 48.7
Total Debt 830.6 918.4 904.0
Cash and cash equivalents (38.6) (95.3) (34.1)
Net Debt $ 792.0 $ 823.1 $ 869.9
Predecessor Successor
($ in millions, Unaudited)

NEXEO SOLUTIONS, INC.
