Attached files
| file | filename |
|---|---|
| 8-K - FIRST CONNECTICUT BANCORP, INC. 8-K - First Connecticut Bancorp, Inc. | fcb8k.htm |
2017 KBW Community Bank Investor Conference August 1 , 2017 NASDAQ: FBNK
Forward Looking Statements Disclaimer & Forward-Looking StatementsStatements in this document and presented orally at the conference, if any, concerning future results, performance, expectations or intentions are forward-looking statements. Actual results, performance or developments may differ materially from forward-looking statements as a result of known or unknown risks, uncertainties and other factors, including those identified from time to time in the Company’s filings with the Securities and Exchange Commission, press releases and other communications. Actual results also may differ based on the Company’s ability to successfully maintain and integrate customers from acquisitions.The Company intends any forward-looking statements to be covered by the Litigation Reform Act of 1995 and is including this statement for purposes of said safe harbor provisions. Readers and attendees are cautioned not to place undue reliance on forward-looking statements, which speak only as of the date of this presentation. Except as required by applicable law or regulation, the Company undertakes no obligation to update any forward-looking statements to reflect events or circumstances that occur after the date as of which such statements are made.The Company’s capital strategy includes deployment of excess capital, the success of which efforts cannot be guaranteed.
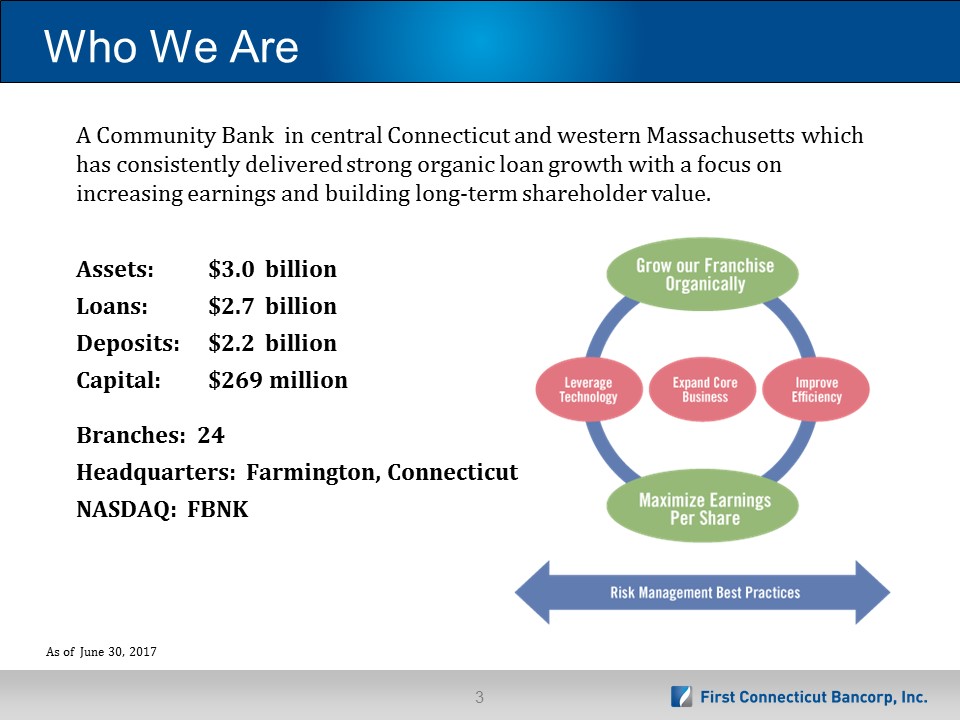
Who We Are Assets: $3.0 billion Loans: $2.7 billion Deposits: $2.2 billionCapital: $269 millionBranches: 24Headquarters: Farmington, ConnecticutNASDAQ: FBNK A Community Bank in central Connecticut and western Massachusetts which has consistently delivered strong organic loan growth with a focus on increasing earnings and building long-term shareholder value. As of June 30, 2017
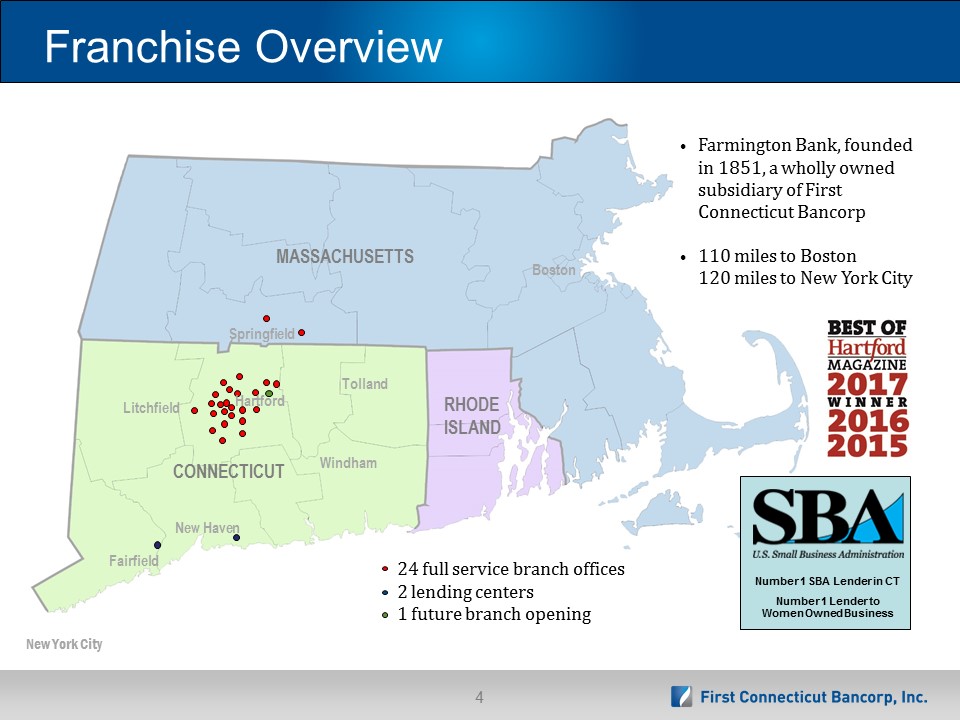
Franchise Overview 24 full service branch offices2 lending centers1 future branch opening Farmington Bank, founded in 1851, a wholly owned subsidiary of First Connecticut Bancorp110 miles to Boston120 miles to New York City Number 1 SBA Lender in CTNumber 1 Lender to Women Owned Business Boston Hartford Springfield New Haven Fairfield Litchfield Windham Tolland New York City MASSACHUSETTS CONNECTICUT RHODE ISLAND
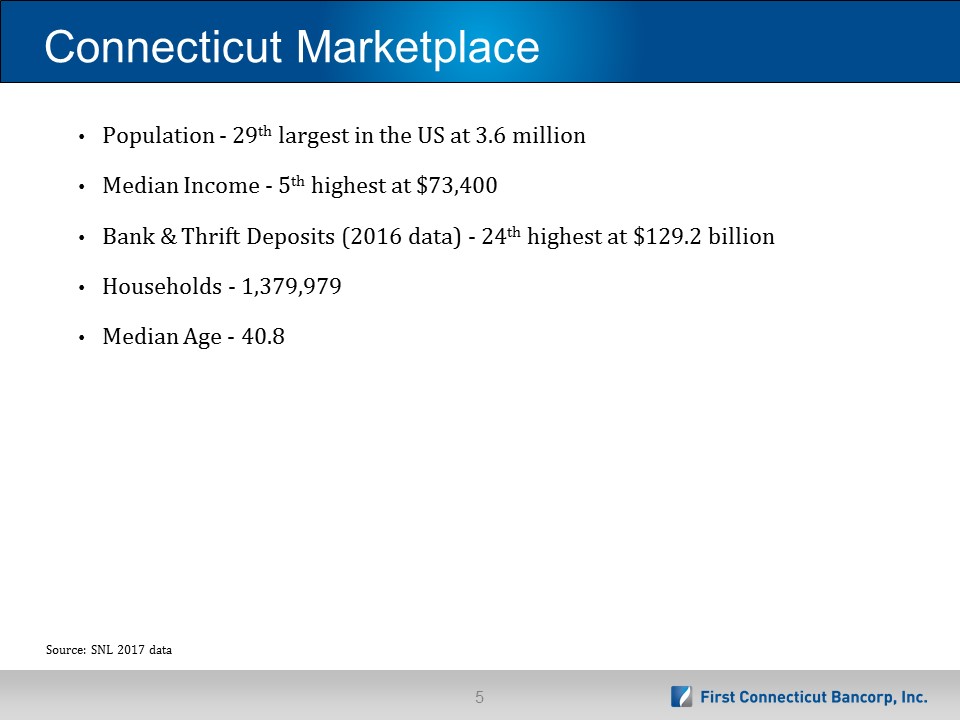
Connecticut Marketplace Focus on Fundamentals Source: SNL 2017 data Population - 29th largest in the US at 3.6 millionMedian Income - 5th highest at $73,400Bank & Thrift Deposits (2016 data) - 24th highest at $129.2 billionHouseholds - 1,379,979Median Age - 40.8
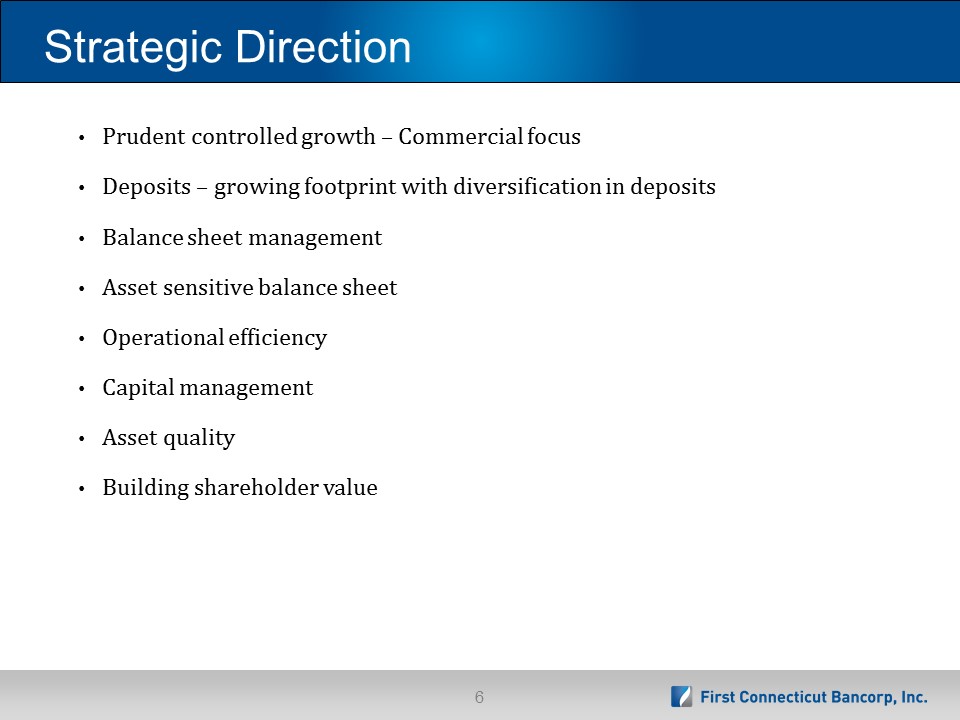
Strategic Direction Prudent controlled growth – Commercial focusDeposits – growing footprint with diversification in depositsBalance sheet management Asset sensitive balance sheetOperational efficiencyCapital managementAsset qualityBuilding shareholder value
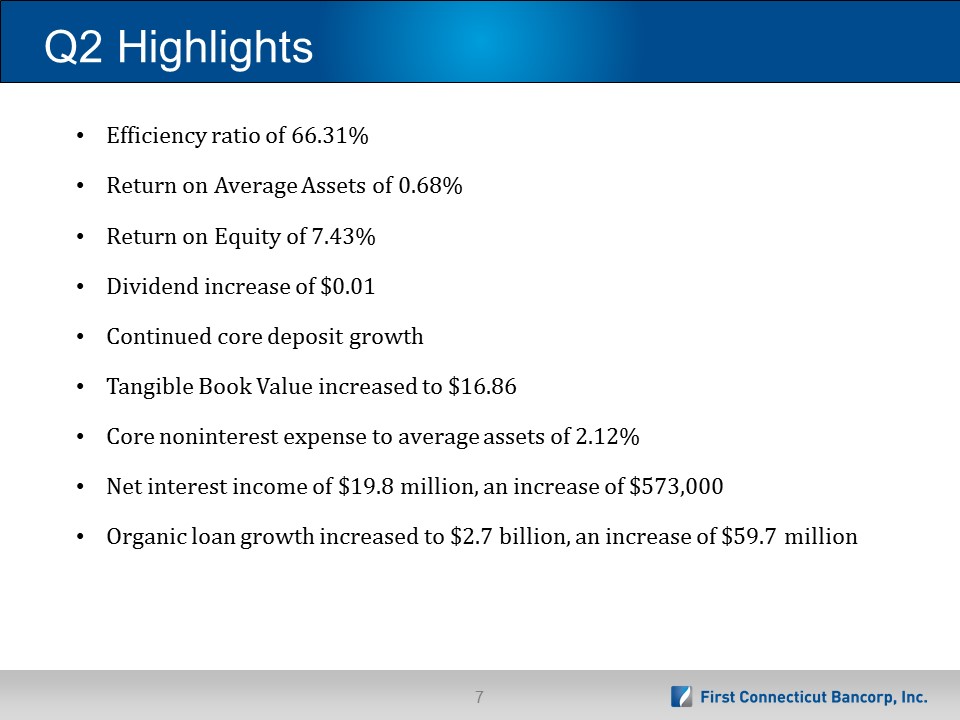
Q2 Highlights Efficiency ratio of 66.31%Return on Average Assets of 0.68%Return on Equity of 7.43%Dividend increase of $0.01Continued core deposit growth Tangible Book Value increased to $16.86Core noninterest expense to average assets of 2.12% Net interest income of $19.8 million, an increase of $573,000Organic loan growth increased to $2.7 billion, an increase of $59.7 million
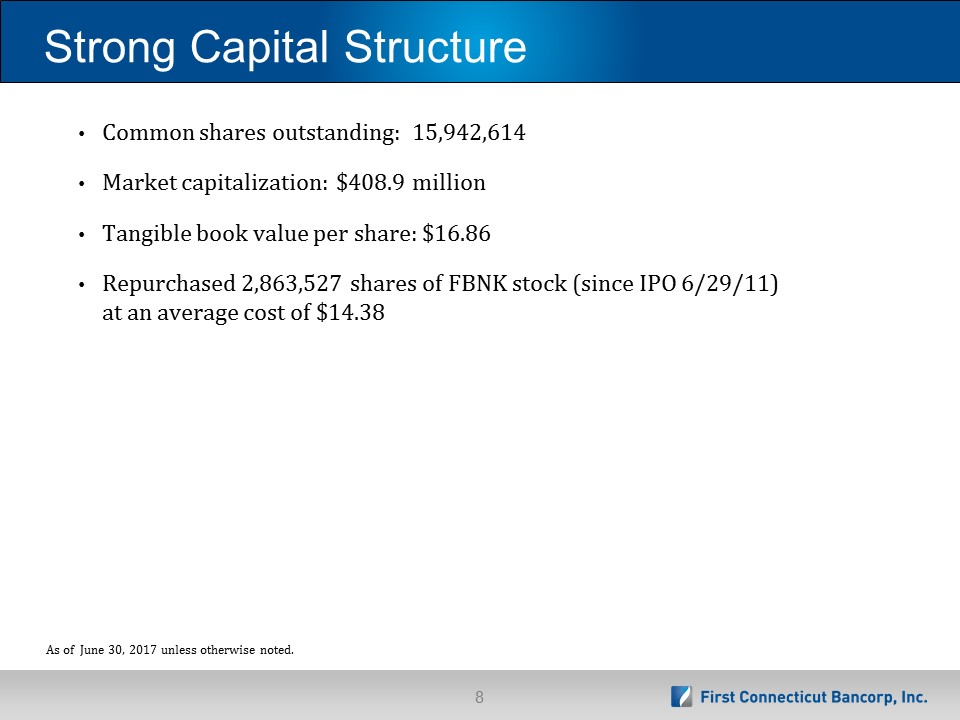
Strong Capital Structure Common shares outstanding: 15,942,614Market capitalization: $408.9 millionTangible book value per share: $16.86Repurchased 2,863,527 shares of FBNK stock (since IPO 6/29/11) at an average cost of $14.38 As of June 30, 2017 unless otherwise noted.
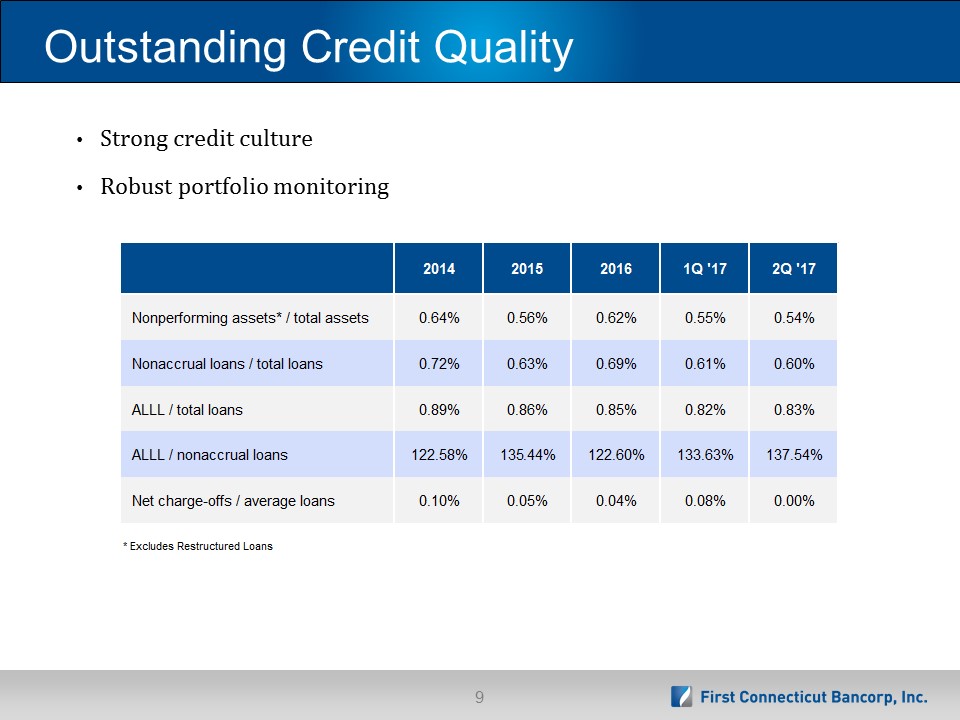
Outstanding Credit Quality Strong credit cultureRobust portfolio monitoring
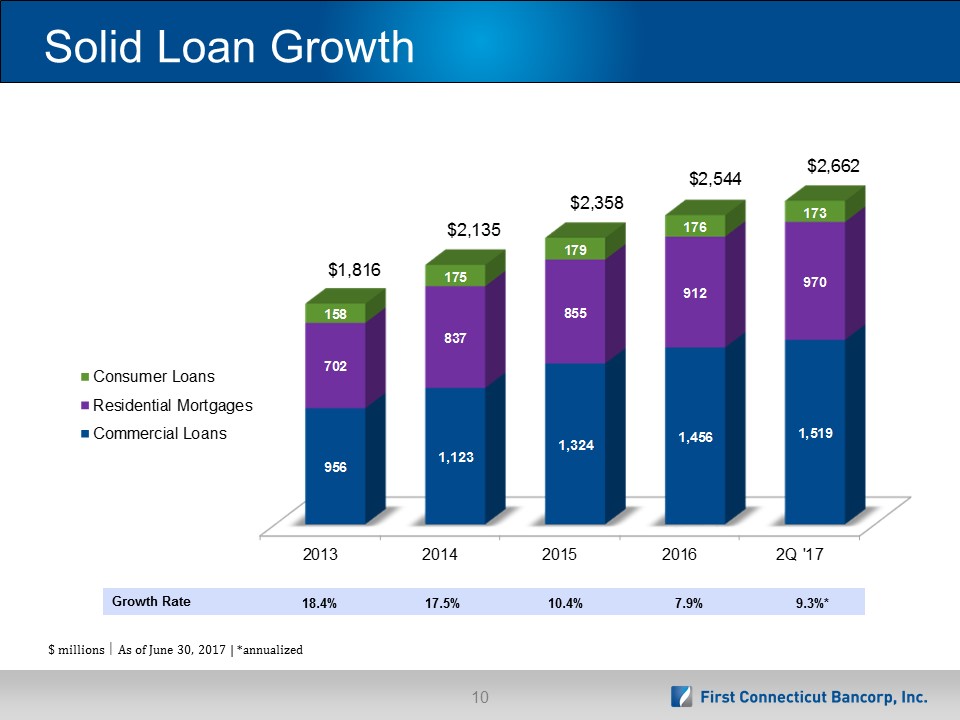
Solid Loan Growth $ millions As of June 30, 2017 | *annualized Growth Rate 17.5% 10.4% 7.9% 9.3%* 18.4%
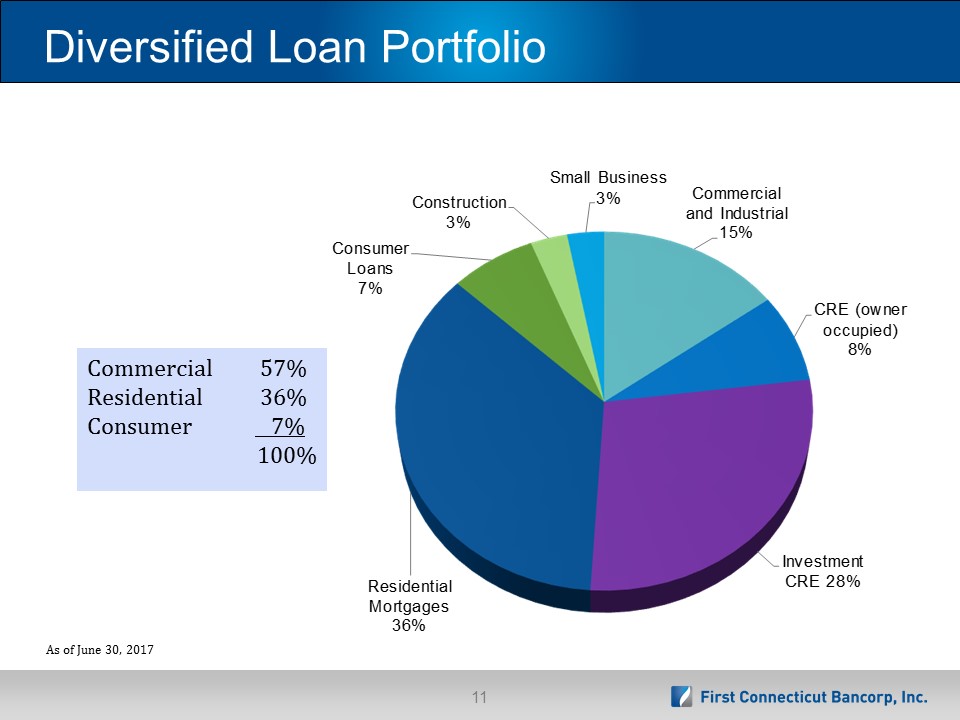
Diversified Loan Portfolio As of June 30, 2017 Commercial 57%Residential 36%Consumer 7% 100%
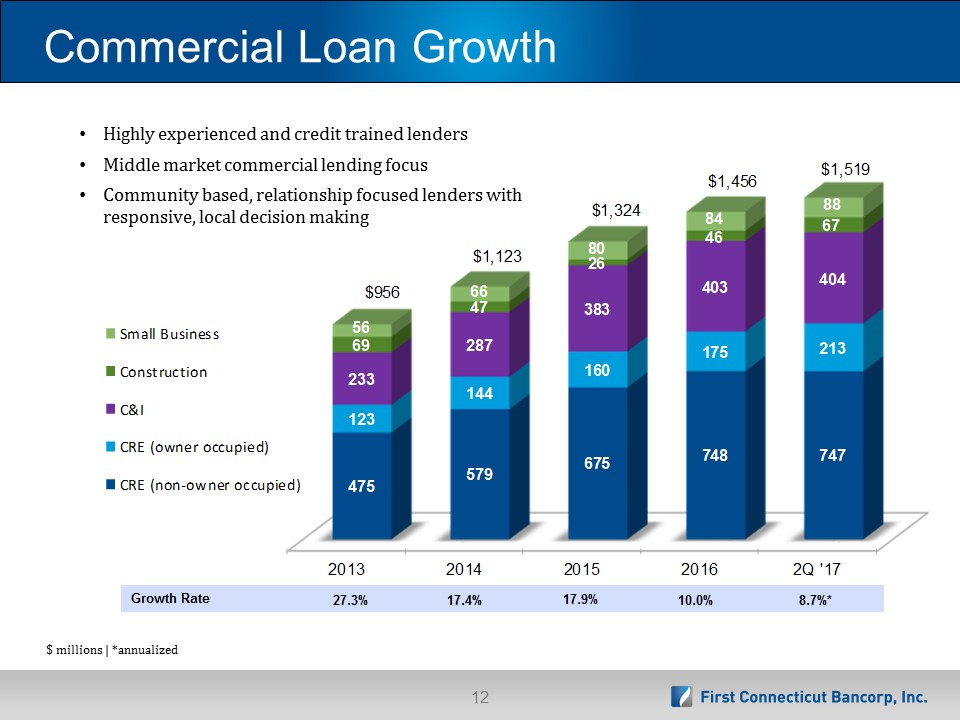
Commercial Loan Growth $ millions | *annualized Growth Rate 27.3% 17.4% 8.7%* 17.9% 10.0% Highly experienced and credit trained lenders Middle market commercial lending focusCommunity based, relationship focused lenders with responsive, local decision making

Investment CRE Concentration Disciplined deal selection and underwritingStrong monitoring including semi-annual stress testingMinimal commercial construction exposure (3.7% of Investment CRE portfolio)*Strong portfolio credit metricsGeographic diversification within portfolio $ millions | *Construction outstandings are included in the loan categories above | As of June 30, 2017
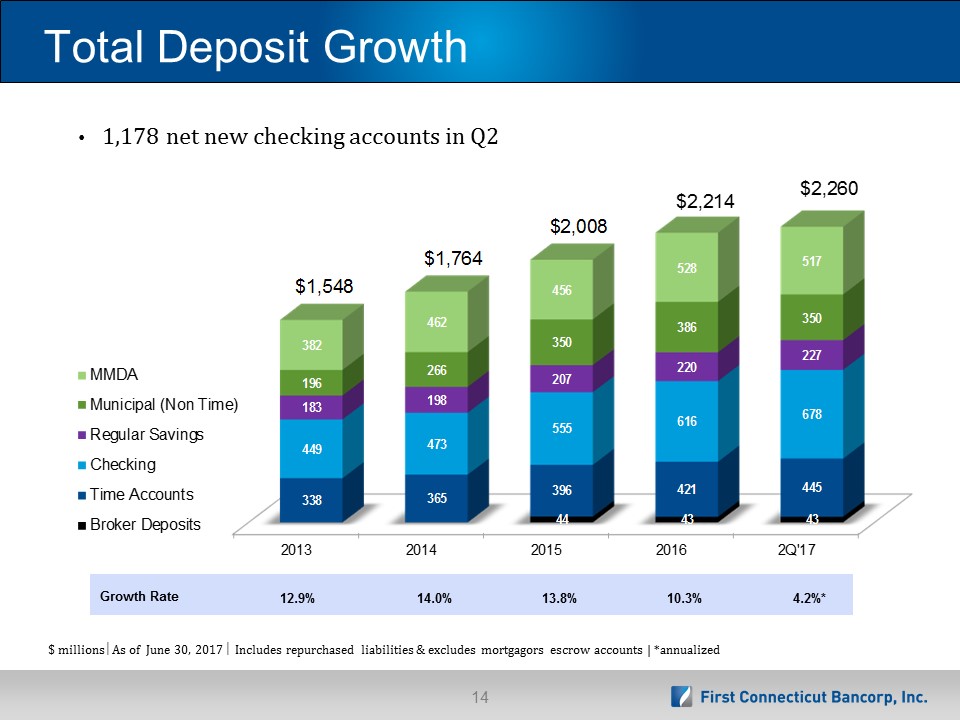
Total Deposit Growth 1,178 net new checking accounts in Q2 $ millions As of June 30, 2017 Includes repurchased liabilities & excludes mortgagors escrow accounts | *annualized Growth Rate 14.0% 13.8% 10.3% 4.2%* 12.9%
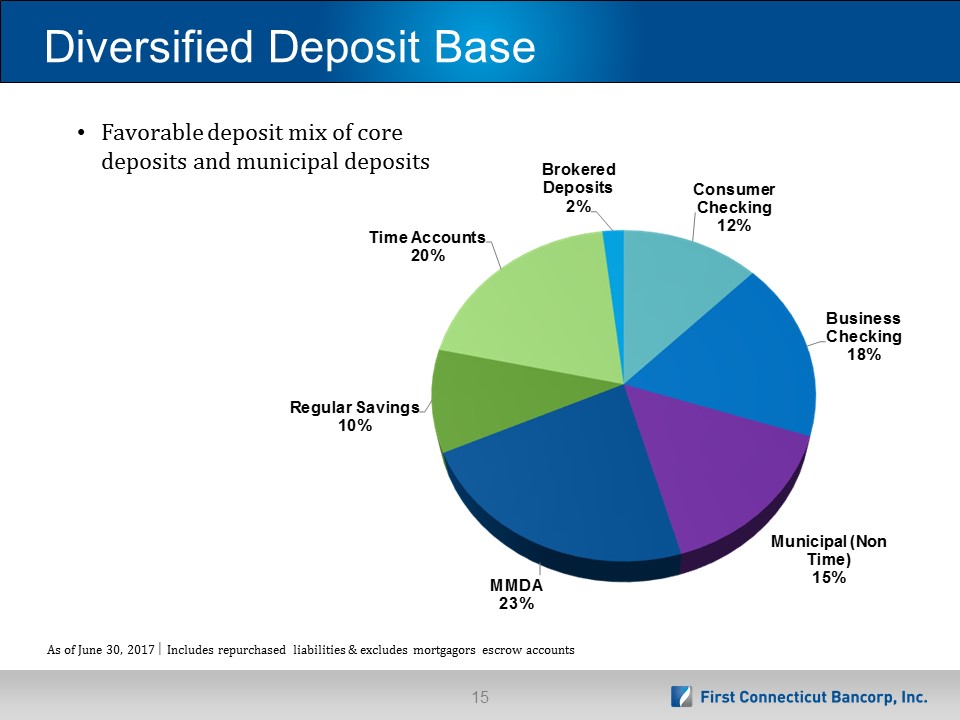
Diversified Deposit Base As of June 30, 2017 Includes repurchased liabilities & excludes mortgagors escrow accounts Favorable deposit mix of core deposits and municipal deposits

ROA, ROE & EPS

Controlled Expenses
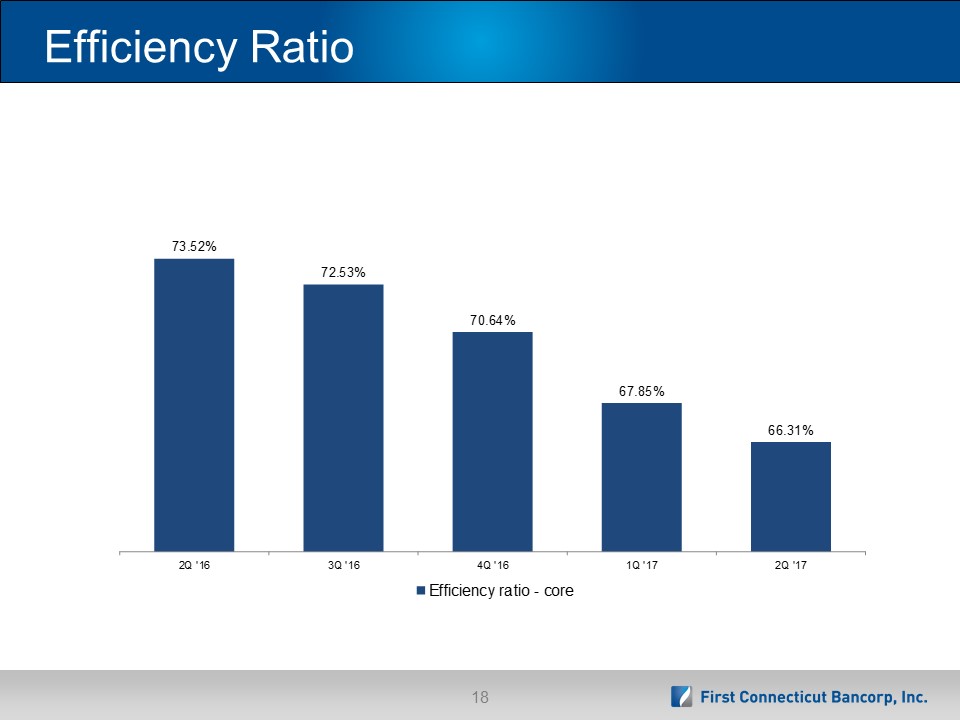
Efficiency Ratio
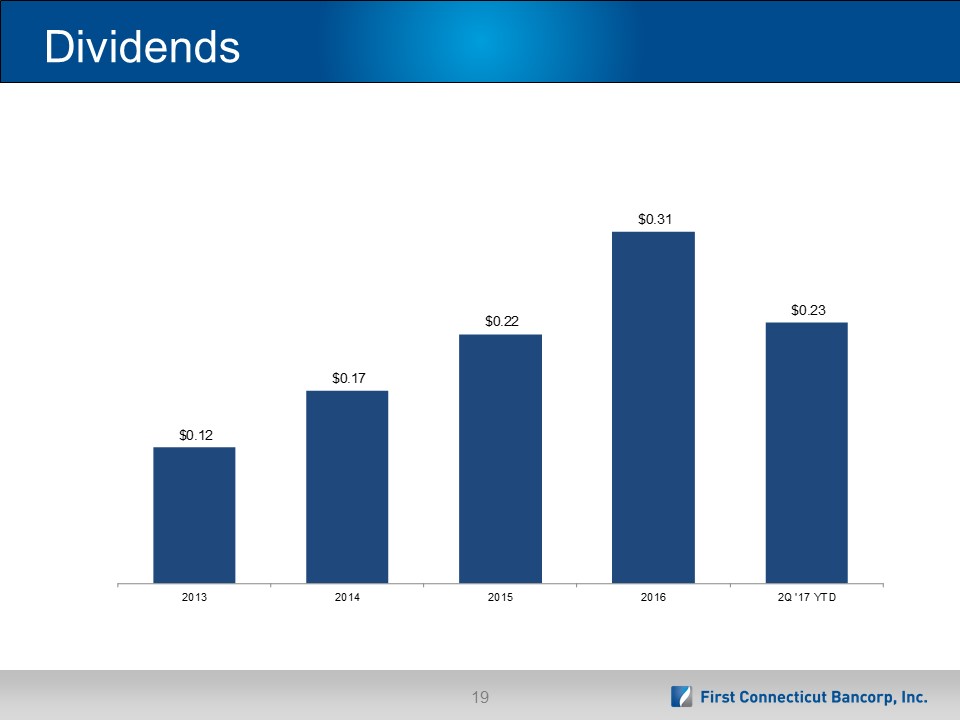
Dividends

Financial Highlights

Financial Highlights
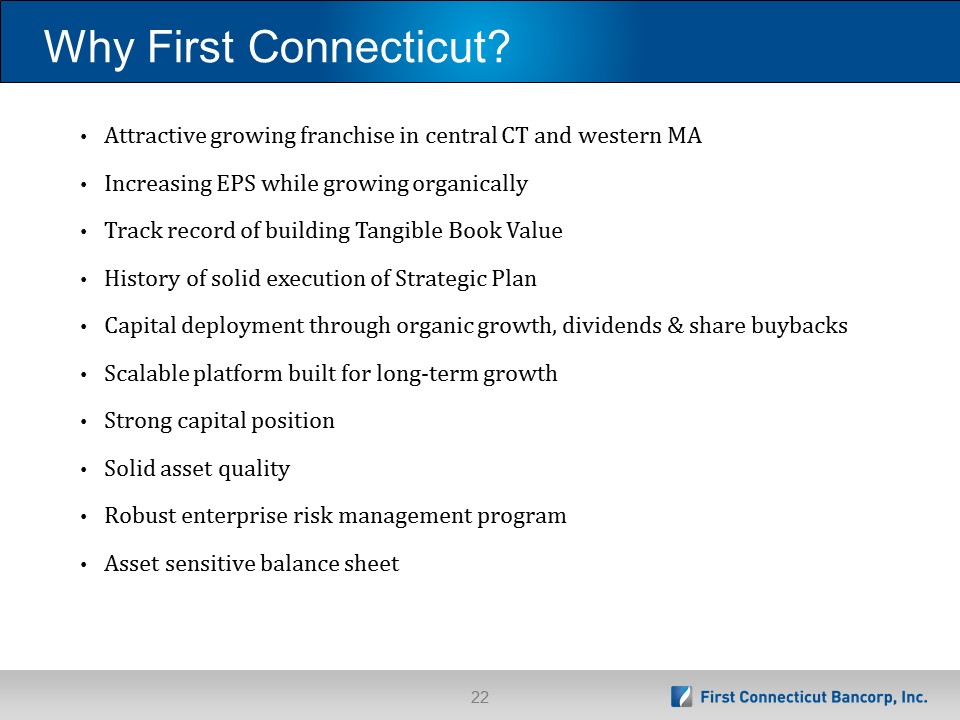
Why First Connecticut? Attractive growing franchise in central CT and western MAIncreasing EPS while growing organicallyTrack record of building Tangible Book ValueHistory of solid execution of Strategic PlanCapital deployment through organic growth, dividends & share buybacks Scalable platform built for long-term growthStrong capital positionSolid asset qualityRobust enterprise risk management programAsset sensitive balance sheet

Appendix Supplemental Information
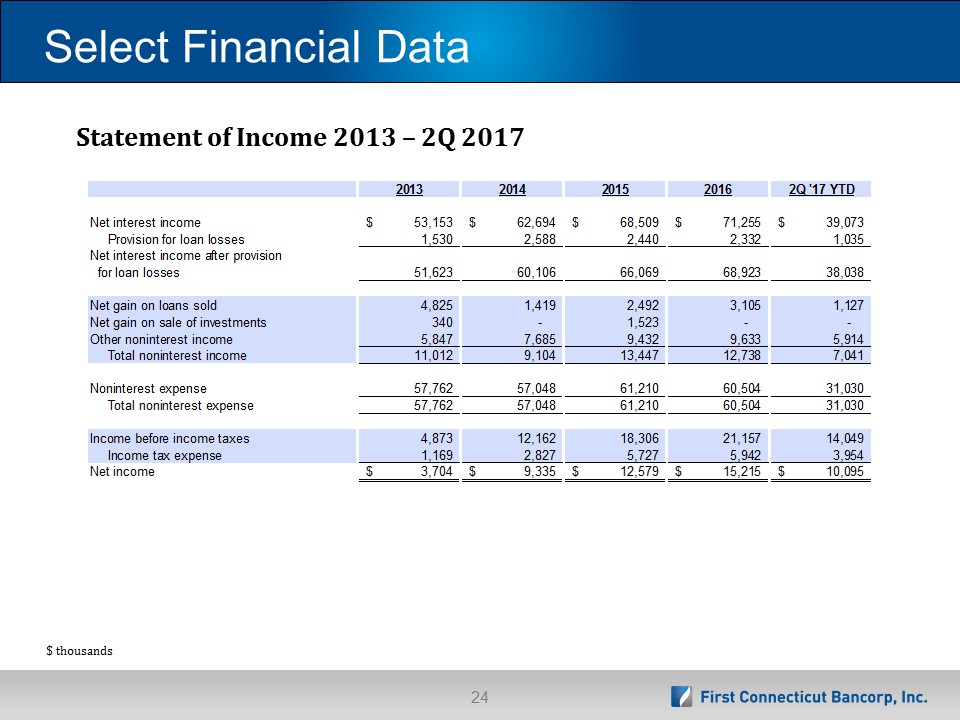
Select Financial Data Statement of Income 2013 – 2Q 2017 $ thousands
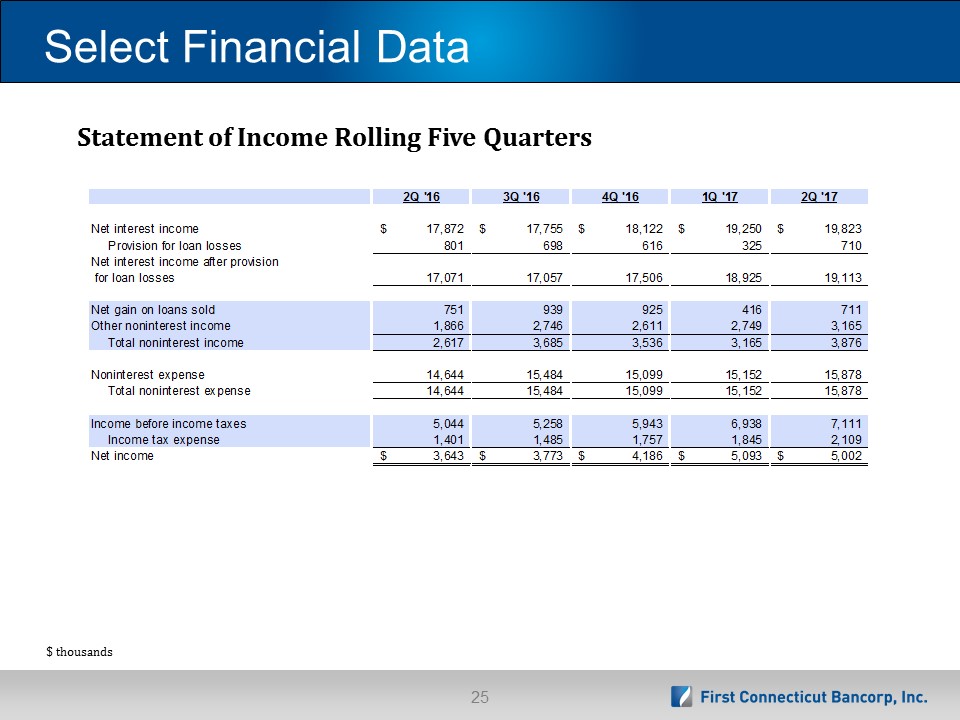
Select Financial Data Statement of Income Rolling Five Quarters $ thousands

Select Financial Data Selected Annual Financial Data $ millions
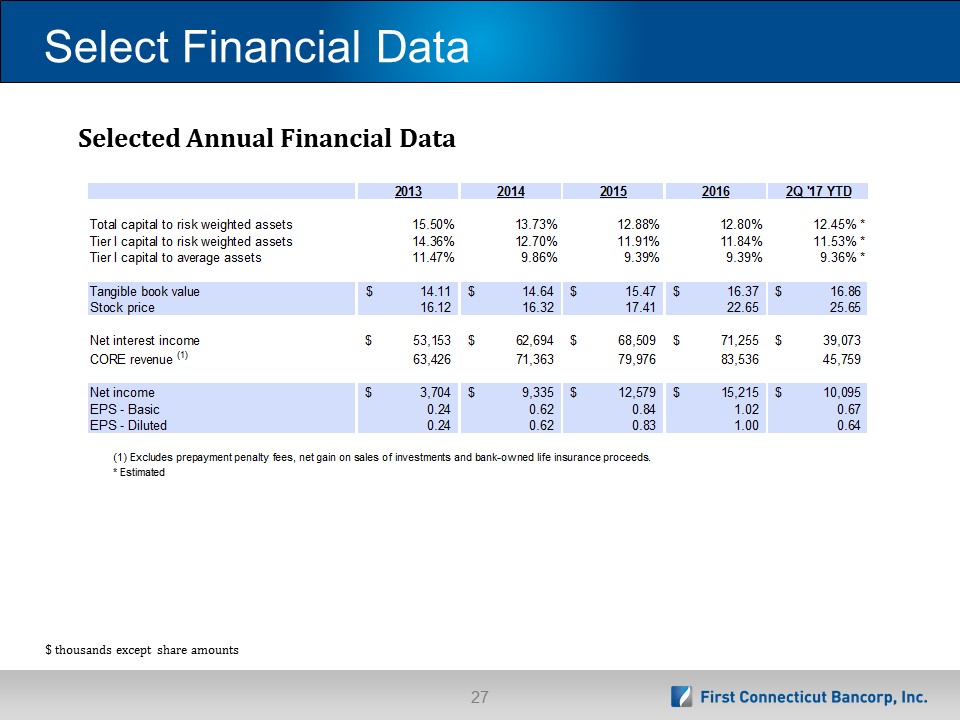
Select Financial Data Selected Annual Financial Data $ thousands except share amounts
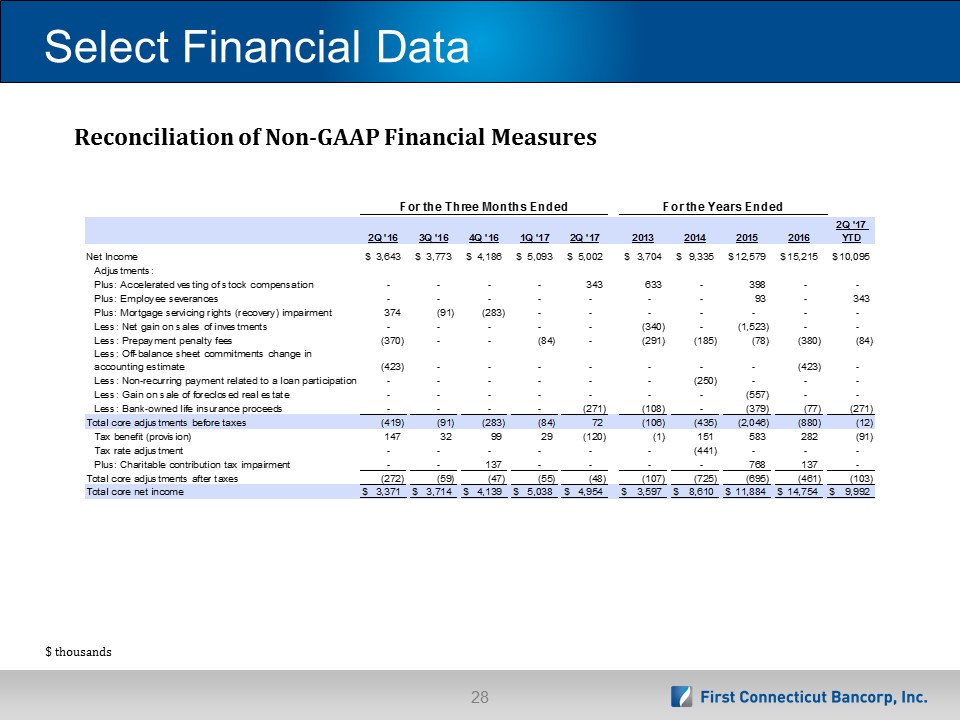
Select Financial Data Reconciliation of Non-GAAP Financial Measures $ thousands
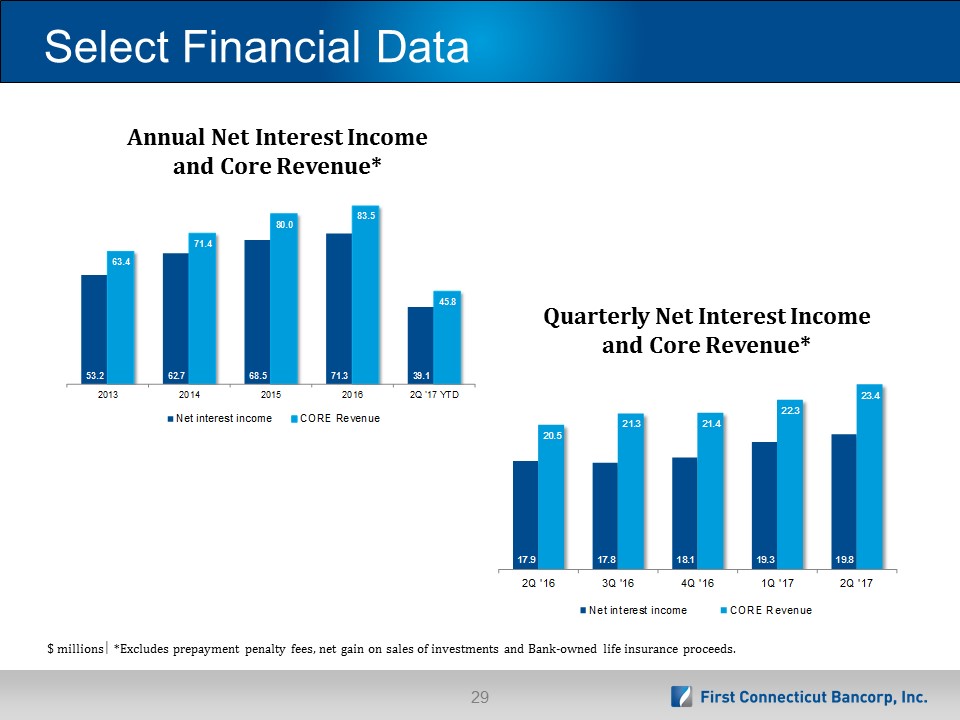
Select Financial Data Quarterly Net Interest Income and Core Revenue* Annual Net Interest Income and Core Revenue* $ millions *Excludes prepayment penalty fees, net gain on sales of investments and Bank-owned life insurance proceeds.

Select Financial Data Annual Average Earning Assets and NIM Quarterly Average Earning Assets and NIM $ billions
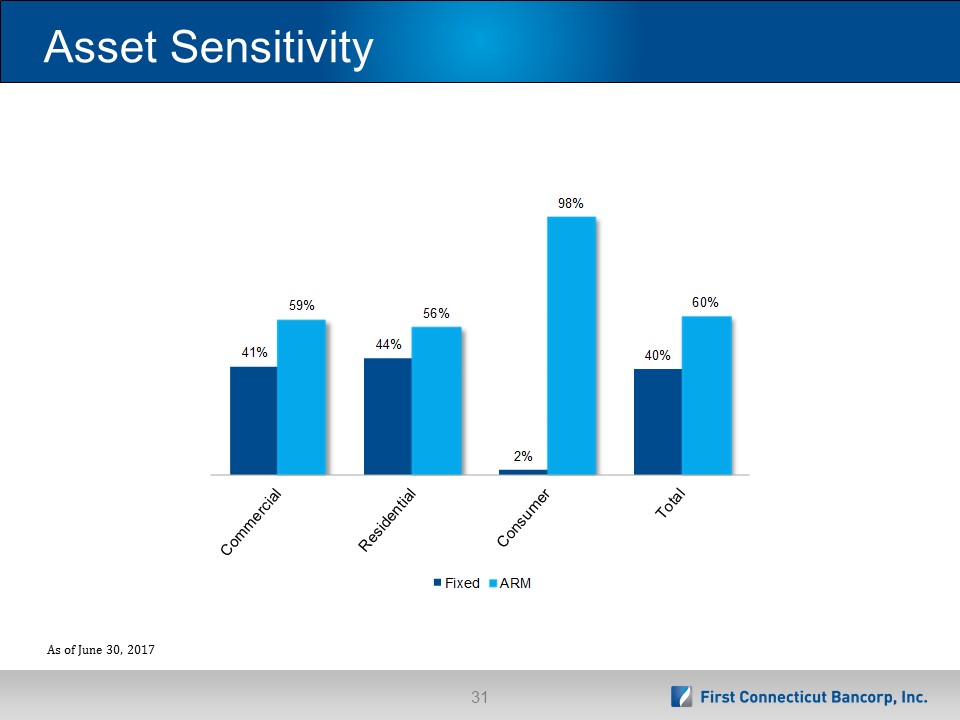
Asset Sensitivity As of June 30, 2017
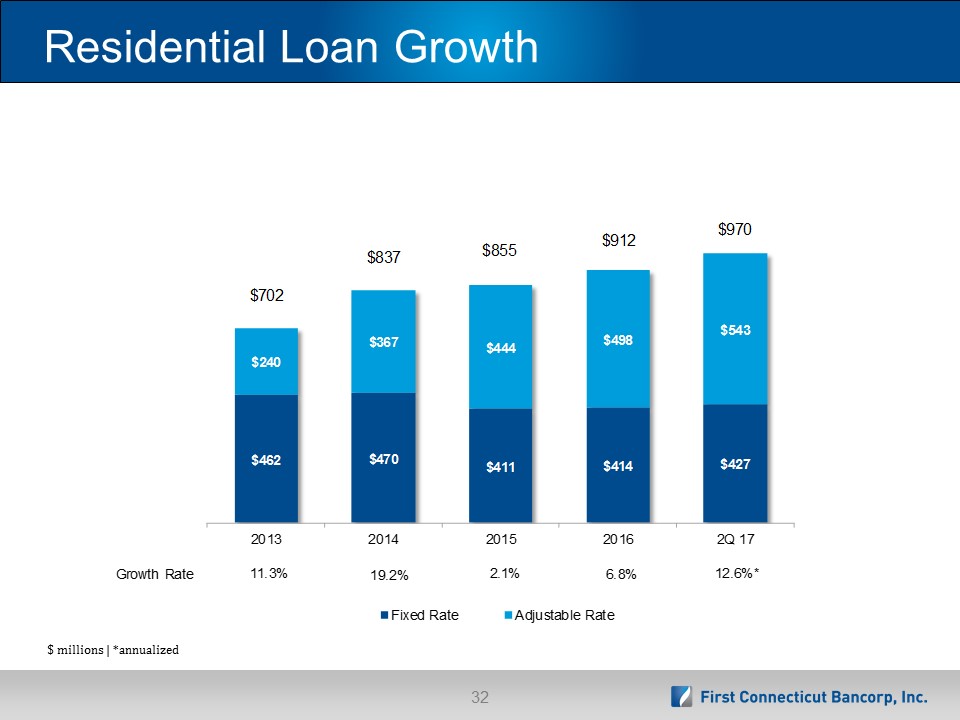
Residential Loan Growth $ millions | *annualized
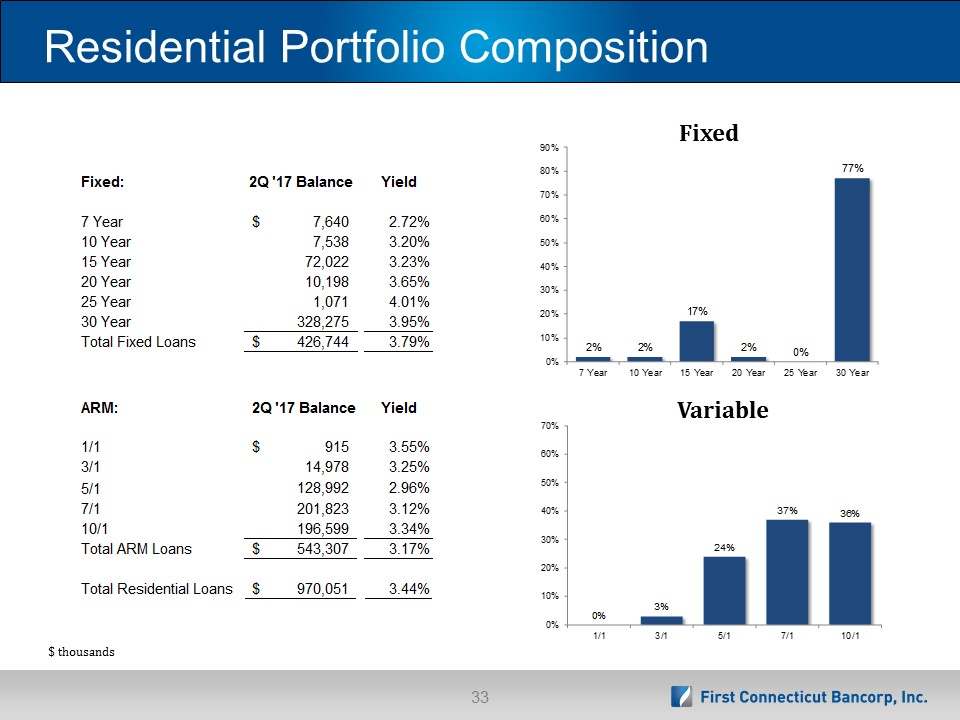
Residential Portfolio Composition Fixed Variable $ thousands
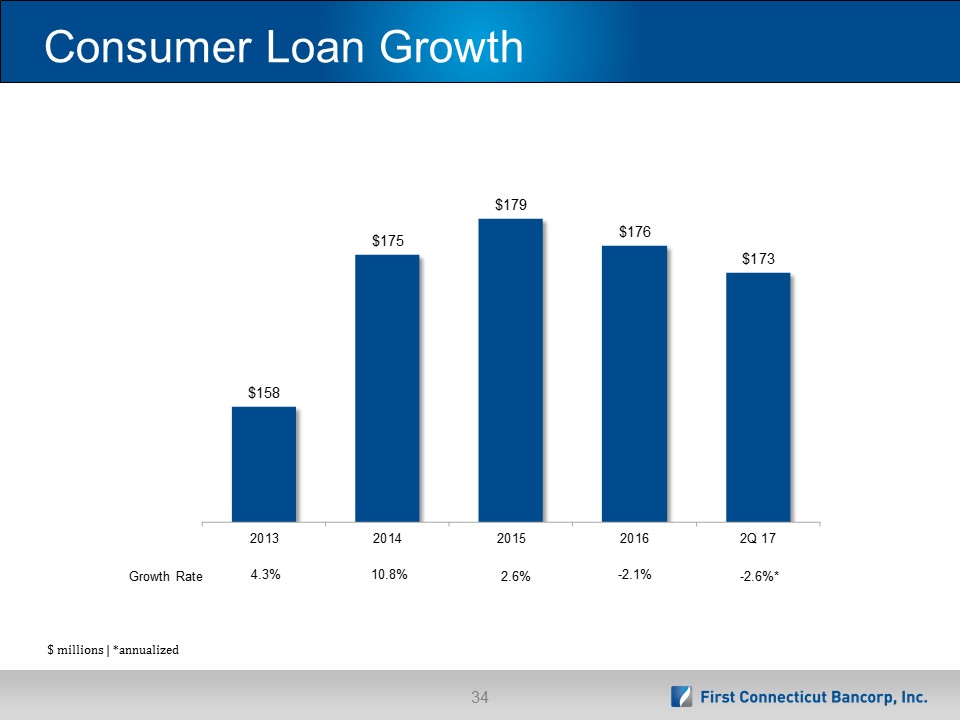
Consumer Loan Growth $ millions | *annualized

Asset Quality Metrics Non-Performing Loans / Total Loans Loan Loss Reserves / Non-Accrual Loans
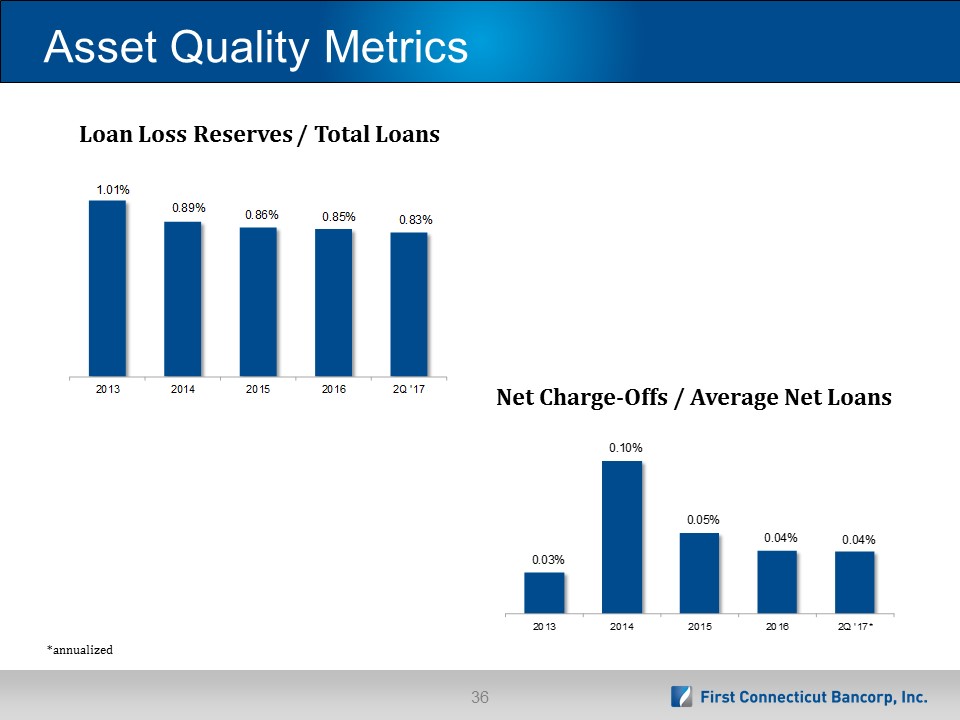
Asset Quality Metrics Loan Loss Reserves / Total Loans Net Charge-Offs / Average Net Loans *annualized
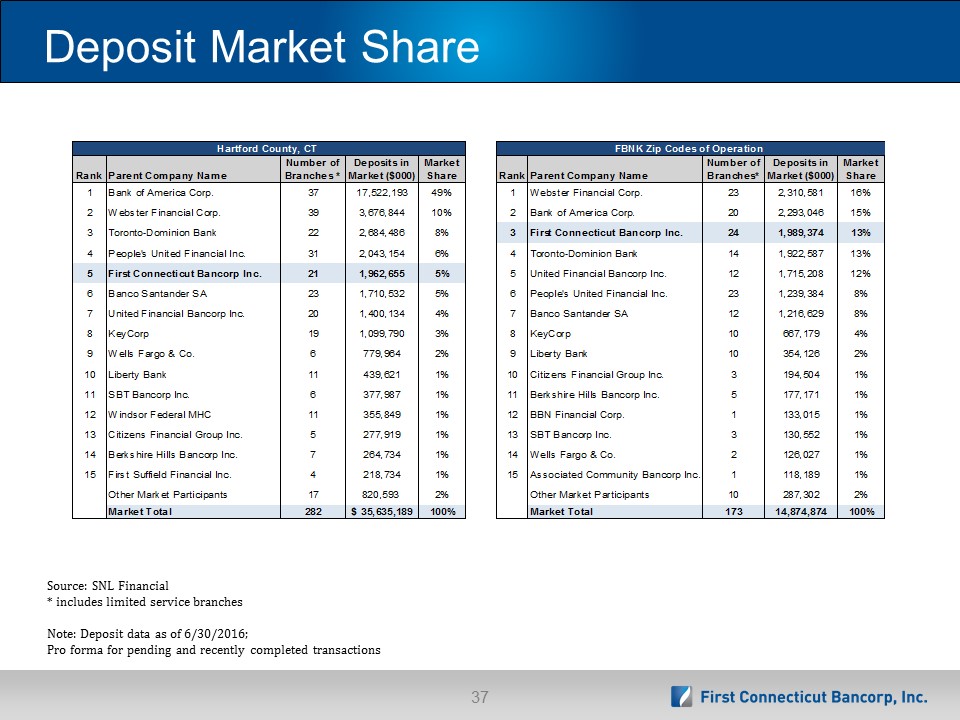
Deposit Market Share Source: SNL Financial* includes limited service branchesNote: Deposit data as of 6/30/2016; Pro forma for pending and recently completed transactions
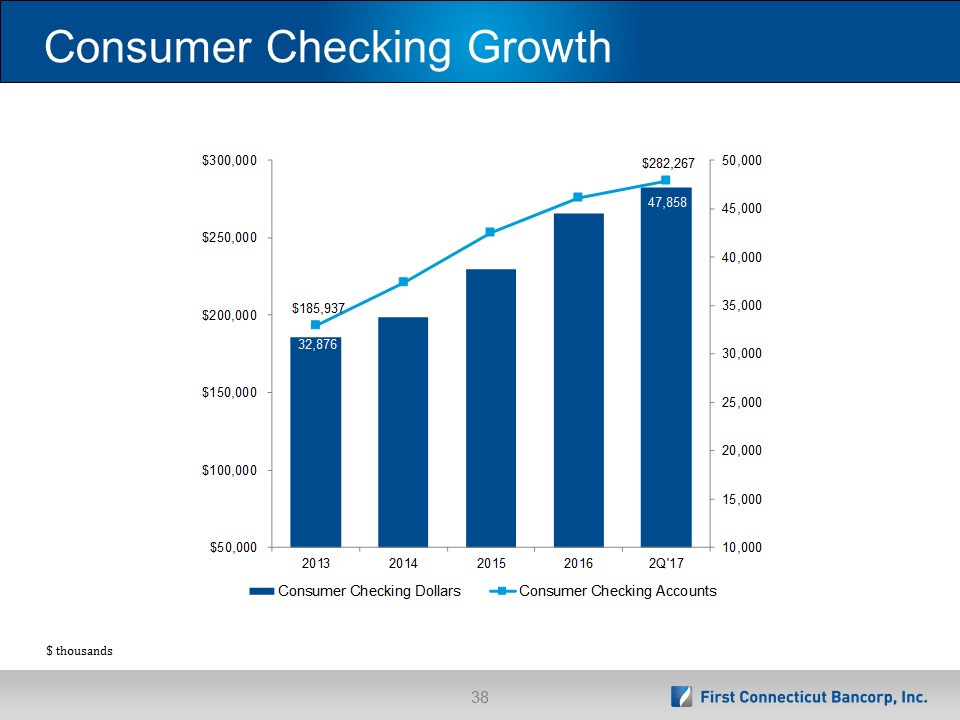
Consumer Checking Growth $ thousands
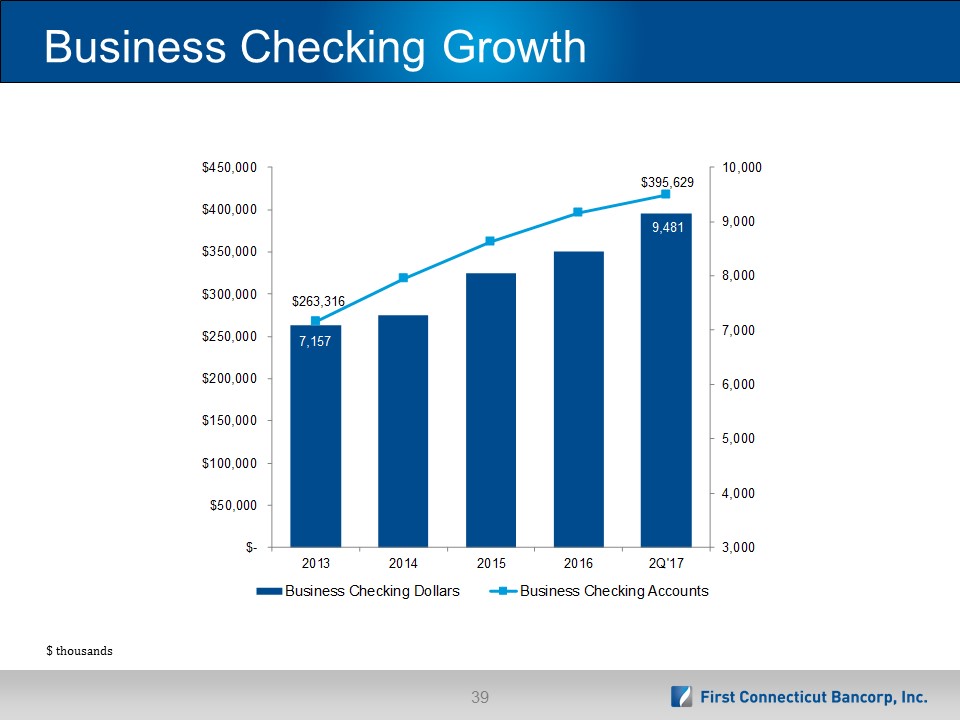
Business Checking Growth $ thousands
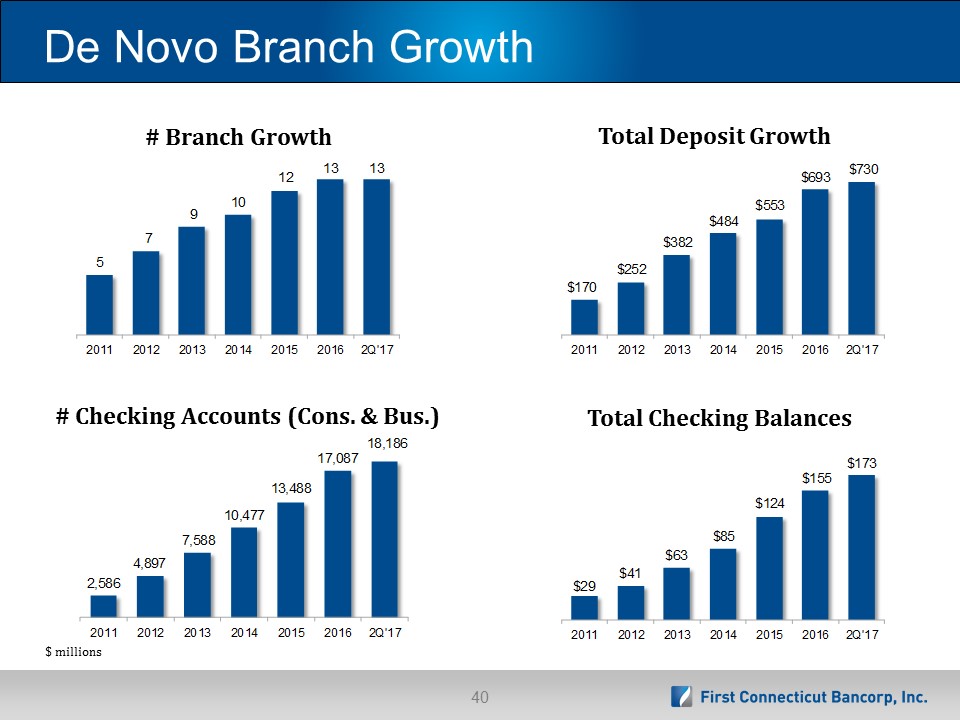
De Novo Branch Growth Total Deposit Growth Total Checking Balances # Checking Accounts (Cons. & Bus.) # Branch Growth $ millions
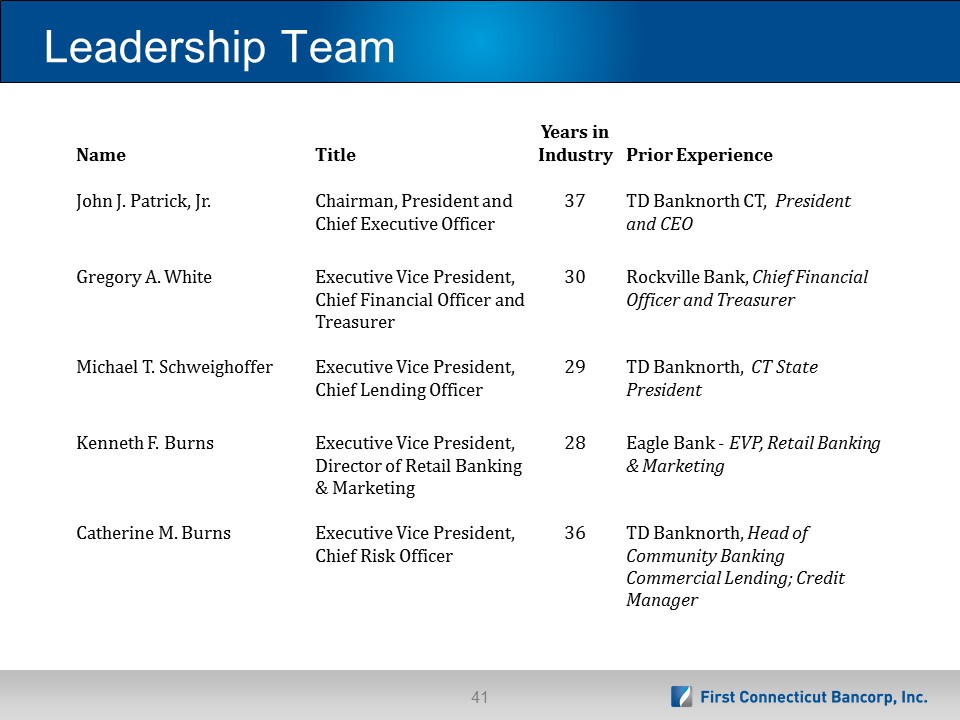
Leadership Team Name Title Years in Industry Prior Experience John J. Patrick, Jr. Chairman, President and Chief Executive Officer 37 TD Banknorth CT, President and CEO Gregory A. White Executive Vice President, Chief Financial Officer and Treasurer 30 Rockville Bank, Chief Financial Officer and Treasurer Michael T. Schweighoffer Executive Vice President, Chief Lending Officer 29 TD Banknorth, CT State President Kenneth F. Burns Executive Vice President, Director of Retail Banking & Marketing 28 Eagle Bank - EVP, Retail Banking & Marketing Catherine M. Burns Executive Vice President,Chief Risk Officer 36 TD Banknorth, Head of Community BankingCommercial Lending; Credit Manager
Corporate Contacts John J. Patrick, Jr. Chairman, President and Chief Executive OfficerGregory A. White Executive Vice President, Chief Financial OfficerInvestor Information:Jennifer H. Daukas Vice President, Investor Relations Officer 860-284-6359 or jdaukas@farmingtonbankct.com