Attached files
| file | filename |
|---|---|
| EX-99.1 - EXHIBIT 99.1 - MERIT MEDICAL SYSTEMS INC | a07262017-8kpressreleaseex.htm |
| 8-K - 8-K - MERIT MEDICAL SYSTEMS INC | a07262017-8k.htm |
1
Second Quarter FY2017 Results
FRED LAMPROPOULOS
Chairman & CEO
BERNARD BIRKETT
CFO
TM
Exhibit 99.2
2
DISCLOSURE REGARDING FORWARD-LOOKING STATEMENTS
This presentation and any accompanying management commentary include “forward-looking statements,” as defined within applicable securities laws and regulations. All statements in this
presentation, other than statements of historical fact, are “forward-looking statements”, including projections of earnings, revenues or other financial items, statements regarding our plans and
objectives for future operations, statements concerning proposed products or services, statements regarding the integration, development or commercialization of our business or any business,
assets or operations we have acquired or may acquire, statements regarding future economic conditions or performance, statements regarding governmental inquiries, investigations or
proceedings and statements of assumptions underlying any of the foregoing. All forward-looking statements, including financial projections, included in this presentation are made as of the
date of this presentation, and are based on information available to us as of such date. We assume no obligation to update or disclose revisions to any forward-looking statement, except as
required by law or regulation. In some cases, forward-looking statements can be identified by the use of terminology such as “may,” “will,” “likely,” “expects,” “plans,” “anticipates,” “intends,”
“believes,” “estimates,” “projects,” ”forecast,” “potential,” “plan,” or other comparable terminology. Forward-looking statements are based on our current beliefs, expectations and assumptions
regarding our business, domestic and global economies, regulatory and competitive environments and other conditions. There can be no assurance that such beliefs, expectations or
assumptions or any of the forward-looking statements will prove to be correct. Actual results will likely differ, and may differ materially, from those projected or assumed in the forward-looking
statements. Our future financial and operating results and condition, as well as any forward-looking statements, are subject to inherent risks and uncertainties such as those described in our
Annual Report on Form 10-K for the year ended December 31, 2016 and other filings with the U.S. Securities and Exchange Commission. Such risks and uncertainties include risks relating to our
potential inability to successfully manage growth through acquisitions, including the inability to commercialize technology acquired through completed, proposed or future transactions; product
recalls and product liability claims; expenditures relating to research, development, testing and regulatory approvals of our products and risks that such products may not be developed
successfully or approved for commercial use; governmental scrutiny and regulation of the medical device industry, including governmental inquiries, investigations or proceedings; reforms to
the 510(k) process administered by the U.S. Food and Drug Administration; restrictions on our liquidity or business operations resulting from our debt agreements; infringement of our
technology or the assertion that our technology infringes the rights of other parties; the potential of fines, penalties or other adverse consequences if our employees or agents violate the U.S.
Foreign Corrupt Practices Act or other laws or regulations; laws and regulations targeting fraud and abuse in the healthcare industry; potential for significant adverse changes in governing
regulations; changes in tax laws and regulations in the United States or other countries; increases in the prices of commodity components; negative changes in economic and industry conditions
in the United States or other countries; termination or interruption of relationships with our suppliers, or failure of such suppliers to perform; fluctuations in exchange rates; concentration of a
substantial portion of our revenues among a few products and procedures; development of new products and technology that could render our existing products obsolete; market acceptance of
new products; volatility in the market price of our common stock; modification or limitation of governmental or private insurance reimbursement policies; changes in healthcare policies or
markets related to healthcare reform initiatives; failure to comply with applicable environmental laws; changes in key personnel; work stoppage or transportation risks; introduction of products
in a timely fashion; price and product competition; availability of labor and materials; and fluctuations in and obsolescence of inventory.
All forward-looking statements attributable to us or persons acting on our behalf are expressly qualified in their entirety by these cautionary statements. The financial projections set forth in this
presentation are based on a number of assumptions, estimates and forecasts. The inaccuracy of any one of those assumptions, estimates or forecasts could materially impact our financial
results. Inevitably, some of those assumptions, estimates or forecasts will not occur and unanticipated events and circumstances will occur subsequent to the date of this presentation. In
addition to changes in the underlying assumptions, our future performance is subject to a number of risks and uncertainties with respect to our existing and proposed business, and other factors
that may cause our actual results or performance to be materially different from any predicted or implied. Although we have attempted to identify important assumptions in the financial
projections, there may be other factors that could materially affect our actual financial performance, and no assurance can be given that all material factors have been considered in the
preparation of the financial projections. Accordingly, you should not place undue reliance on such projections. Future operating results are, in fact, impossible to predict.
3
NON-GAAP FINANCIAL MEASURES
Although Merit’s financial statements are prepared in accordance with accounting principles which are generally accepted in the United
States of America (“GAAP”), Merit’s management believes that certain non-GAAP financial measures provide investors with useful
information regarding the underlying business trends and performance of Merit’s ongoing operations and can be useful for period-over-
period comparisons of such operations. Certain financial measures included in this presentation, or which may be referenced in
management’s discussion of Merit’s historical and future operations and financial results, have not been calculated in accordance with GAAP,
and, therefore, are referenced as non-GAAP financial measures. Readers should consider non-GAAP measures used in this presentation in
addition to, not as a substitute for, financial reporting measures prepared in accordance with GAAP. These non-GAAP financial measures
generally exclude some, but not all, items that may affect Merit's net income. In addition, they are subject to inherent limitations as they
reflect the exercise of judgment by management about which items are excluded. Additionally, non-GAAP financial measures used in this
presentation may not be comparable with similarly titled measures of other companies. Merit urges investors and potential investors to
review the reconciliations of its non-GAAP financial measures to the comparable GAAP financial measures, and not to rely on any single
financial measure to evaluate Merit’s business or results of operations. Please refer to “Notes to Non-GAAP Financial Measures” at the end
of these materials for more information.
TRADEMARKS
Unless noted otherwise, trademarks used in this presentation are the property of Merit Medical Systems, Inc., in the United States and other
jurisdictions.
4
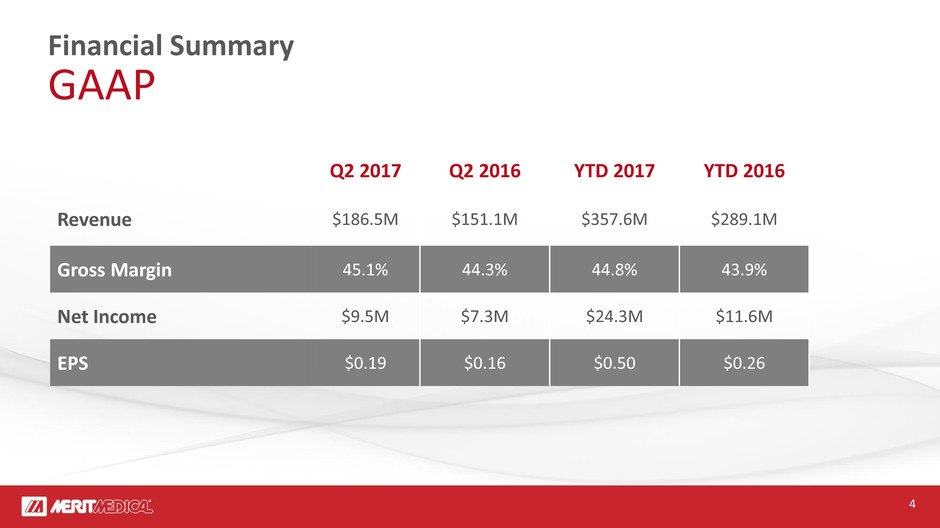
Financial Summary
GAAP
Q2 2017 Q2 2016 YTD 2017 YTD 2016
Revenue $186.5M $151.1M $357.6M $289.1M
Gross Margin 45.1% 44.3% 44.8% 43.9%
Net Income $9.5M $7.3M $24.3M $11.6M
EPS $0.19 $0.16 $0.50 $0.26
5
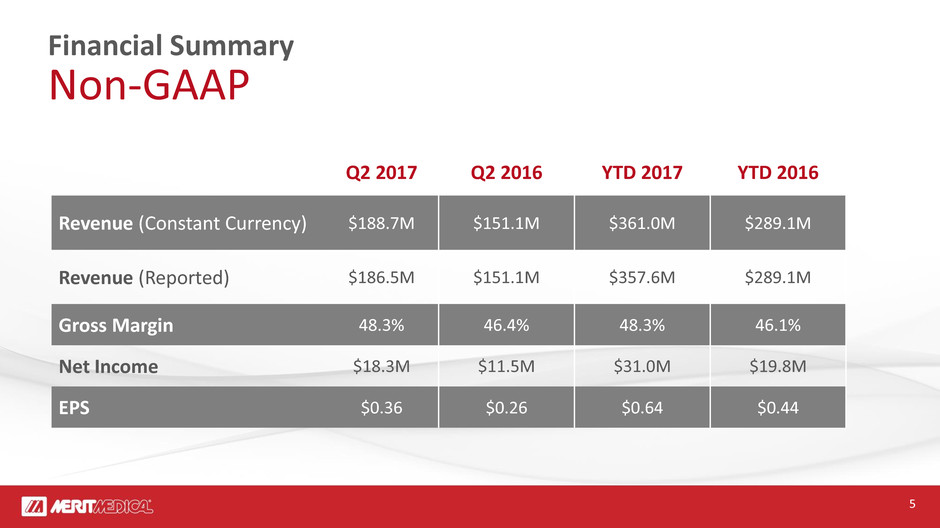
Financial Summary
Non-GAAP
Q2 2017 Q2 2016 YTD 2017 YTD 2016
Revenue (Constant Currency) $188.7M $151.1M $361.0M $289.1M
Revenue (Reported) $186.5M $151.1M $357.6M $289.1M
Gross Margin 48.3% 46.4% 48.3% 46.1%
Net Income $18.3M $11.5M $31.0M $19.8M
EPS $0.36 $0.26 $0.64 $0.44
6
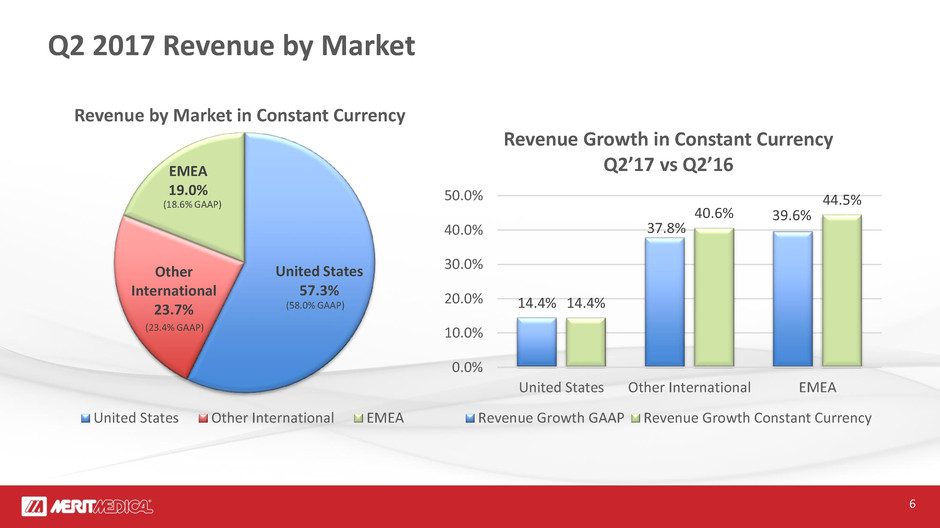
Q2 2017 Revenue by Market
United States
57.3%
Other
International
23.7%
EMEA
19.0%
Revenue by Market in Constant Currency
United States Other International EMEA
14.4%
37.8%
39.6%
14.4%
40.6%
44.5%
0.0%
10.0%
20.0%
30.0%
40.0%
50.0%
United States Other International EMEA
Revenue Growth in Constant Currency
Q2’17 vs Q2’16
Revenue Growth GAAP Revenue Growth Constant Currency
(58.0% GAAP)
(23.4% GAAP)
(18.6% GAAP)
7
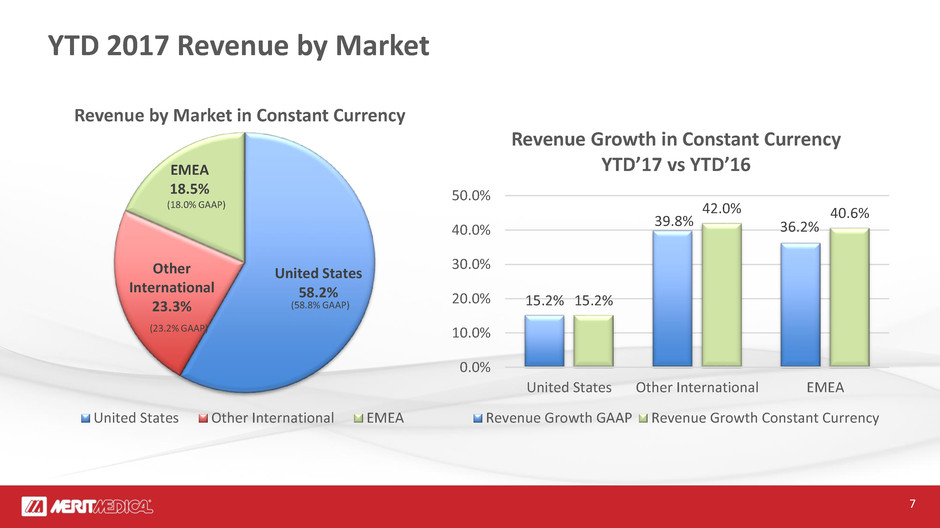
YTD 2017 Revenue by Market
United States
58.2%
Other
International
23.3%
EMEA
18.5%
Revenue by Market in Constant Currency
United States Other International EMEA
15.2%
39.8% 36.2%
15.2%
42.0% 40.6%
0.0%
10.0%
20.0%
30.0%
40.0%
50.0%
United States Other International EMEA
Revenue Growth in Constant Currency
YTD’17 vs YTD’16
Revenue Growth GAAP Revenue Growth Constant Currency
(58.8% GAAP)
(23.2% GAAP)
(18.0% GAAP)
8
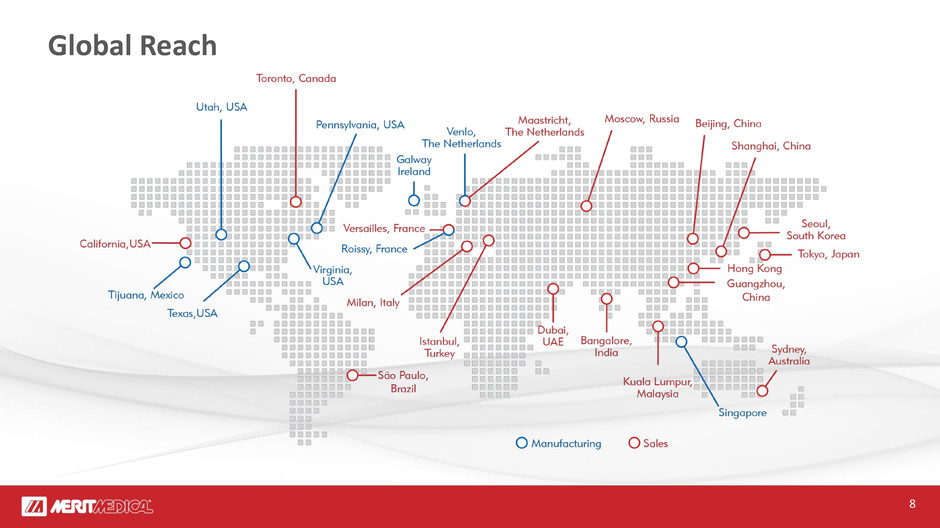
Global Reach
9
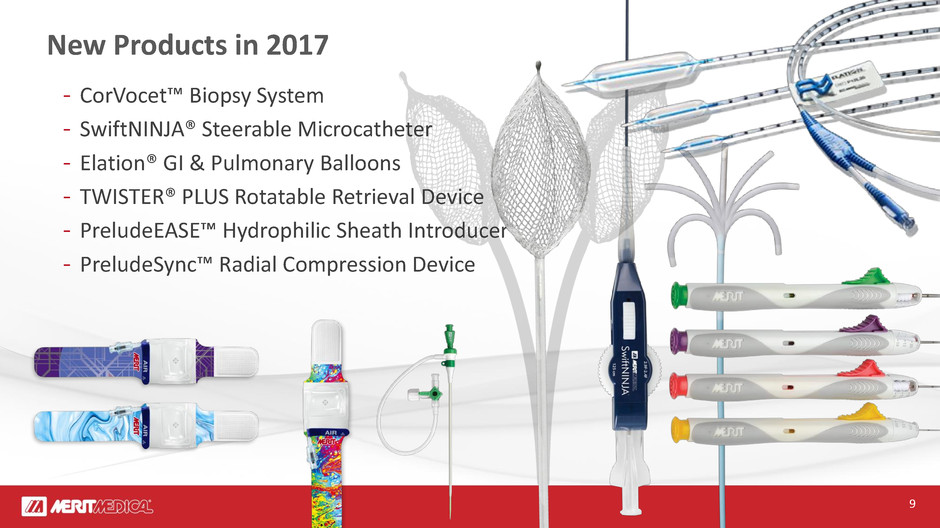
New Products in 2017
- CorVocet™ Biopsy System
- SwiftNINJA® Steerable Microcatheter
- Elation® GI & Pulmonary Balloons
- TWISTER® PLUS Rotatable Retrieval Device
- PreludeEASE™ Hydrophilic Sheath Introducer
- PreludeSync™ Radial Compression Device
10
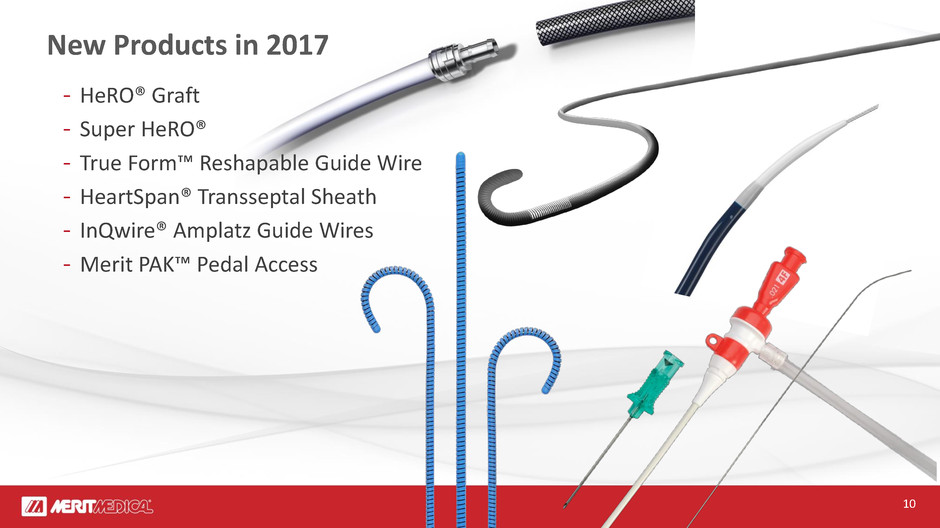
New Products in 2017
- HeRO® Graft
- Super HeRO®
- True Form™ Reshapable Guide Wire
- HeartSpan® Transseptal Sheath
- InQwire® Amplatz Guide Wires
- Merit PAK™ Pedal Access
11
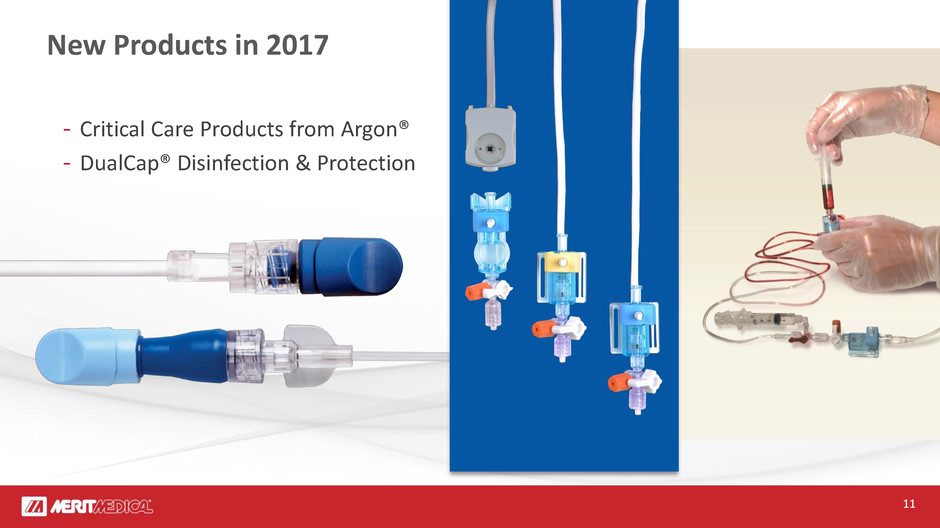
New Products in 2017
- Critical Care Products from Argon®
- DualCap® Disinfection & Protection
12
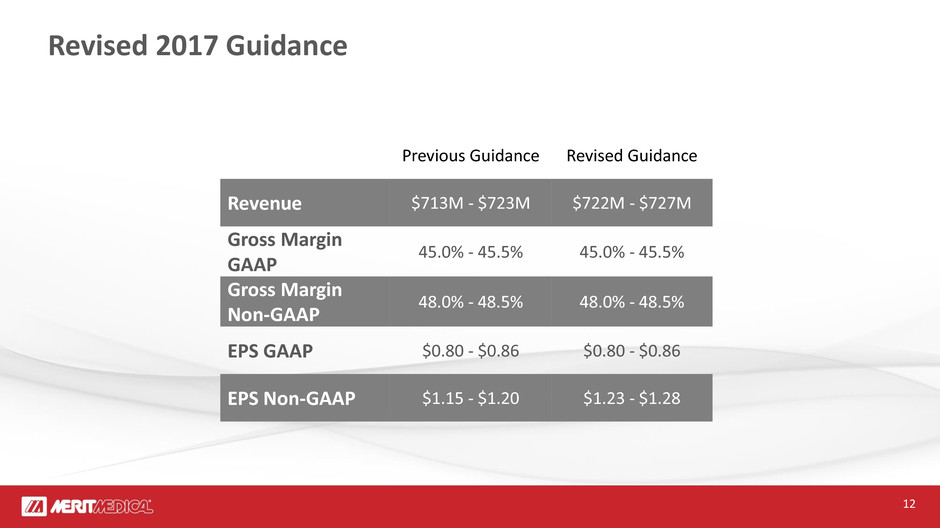
Revised 2017 Guidance
Previous Guidance Revised Guidance
Revenue $713M - $723M $722M - $727M
Gross Margin
GAAP
45.0% - 45.5% 45.0% - 45.5%
Gross Margin
Non-GAAP
48.0% - 48.5% 48.0% - 48.5%
EPS GAAP $0.80 - $0.86 $0.80 - $0.86
EPS Non-GAAP $1.15 - $1.20 $1.23 - $1.28
13
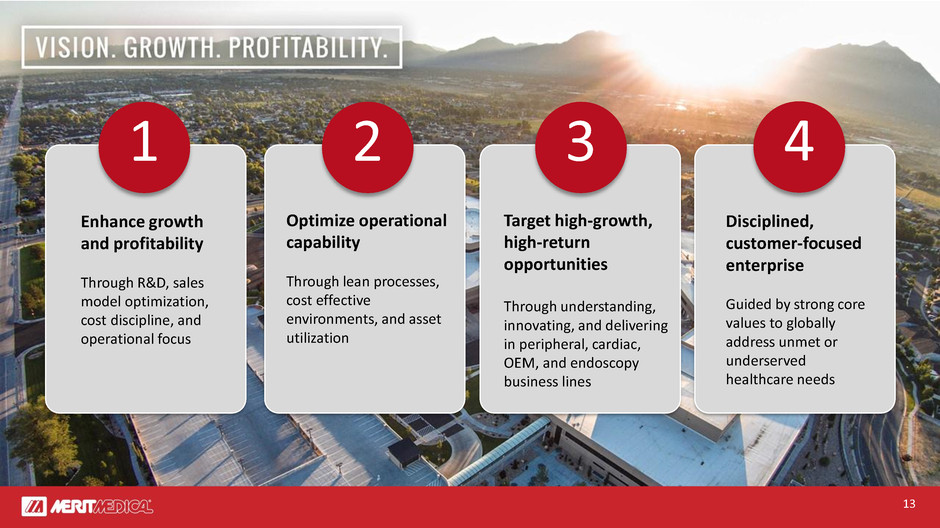
1 2 3 4
Disciplined,
customer-focused
enterprise
Guided by strong core
values to globally
address unmet or
underserved
healthcare needs
Target high-growth,
high-return
opportunities
Through understanding,
innovating, and delivering
in peripheral, cardiac,
OEM, and endoscopy
business lines
Optimize operational
capability
Through lean processes,
cost effective
environments, and asset
utilization
Enhance growth
and profitability
Through R&D, sales
model optimization,
cost discipline, and
operational focus
14
NOTES TO NON-GAAP FINANCIAL MEASURES
For additional details, please see the accompanying press release and forward-looking statement disclosure.
These presentation materials and associated commentary from Merit’s management, as well as the press release issued today,
use non-GAAP financial measures, including:
• constant currency revenue;
• core revenue;
• core revenue on a constant currency basis;
• non-GAAP earnings per share;
• non-GAAP gross margin; and
• non-GAAP net income.
Merit’s management team uses these non-GAAP financial measures to evaluate Merit’s profitability and efficiency, to compare
operating results to prior periods, to evaluate changes in the operating results of each segment, and to measure and allocate
financial resources internally. However, Merit’s management does not consider such non-GAAP measures in isolation or as an
alternative to such measures determined in accordance with GAAP.
Readers should consider non-GAAP measures in addition to, not as a substitute for, financial reporting measures prepared in
accordance with GAAP. These non-GAAP financial measures generally exclude some, but not all, items that may affect Merit's
net income. In addition, they are subject to inherent limitations as they reflect the exercise of judgment by management about
which items are excluded. Merit believes it is useful to exclude such expenses in the calculation of non-GAAP net income, non-
GAAP earnings per share and non-GAAP gross margin (in each case, as further illustrated in the reconciliation table below)
because such amounts in any specific period may not directly correlate to the underlying performance of Merit’s business
operations and can vary significantly between periods as a result of factors such as new acquisitions, non-cash expense related
to amortization of previously acquired tangible and intangible assets, unusual compensation expenses or expenses resulting
from litigation or governmental proceedings. Merit may incur similar types of expenses in the future, and the non-GAAP
financial information included in this presentation should not be viewed as a statement or indication that these types of
expenses will not recur. Additionally, the non-GAAP financial measures used in this presentation may not be comparable with
similarly titled measures of other companies. Merit urges investors and potential investors to review the reconciliations of its
non-GAAP financial measures to the comparable GAAP financial measures, and not to rely on any single financial measure to
evaluate Merit’s business or results of operations.
15
NOTES TO NON-GAAP FINANCIAL MEASURES (continued)
Constant Currency Revenue
Merit’s revenue on a constant currency basis is prepared by translating the current-period reported sales of subsidiaries whose functional
currency is other than the U.S. dollar at the applicable foreign exchange rates in effect during the comparable prior-year period. The constant
currency revenue adjustment of $2.1 million and $3.4 million for the three and six-month periods ended June 30, 2017, respectively, was
calculated using the applicable average foreign exchange rates for the three and six-month periods ended June 30, 2016, respectively.
Core Revenue
Merit’s core revenue is defined as reported revenue, excluding revenues attributable to the acquisitions of the HeRO® Graft and DFINE, Inc. in
2016 and from the acquisitions of the critical care division of Argon Medical Devices, Inc. and Catheter Connections, Inc. in 2017. Core revenue
on a constant currency basis is defined as core revenue plus the foreign exchange impact related to those core sales, using the applicable foreign
exchange rates in effect for the comparable periods presented.
Non-GAAP Gross Margin
Non-GAAP gross margin is calculated by reducing GAAP cost of sales by amounts recorded for amortization of intangible assets and inventory
mark-up related to acquisitions.
Non-GAAP Net Income
Non-GAAP net income is calculated by reducing GAAP net income by certain expenses which are deemed by Merit’s management to be of a
special or non-recurring nature, such as expenses related to new acquisitions, non-cash expense related to amortization of previously acquired
tangible and intangible assets, unusual compensation expenses or expense resulting from litigation or governmental proceedings, as well as
other expenses as set forth in the table below.
Non-GAAP EPS
Non-GAAP EPS is defined as non-GAAP net income divided by the diluted shares outstanding for the corresponding period.
Other Non-GAAP Financial Measure Reconciliation
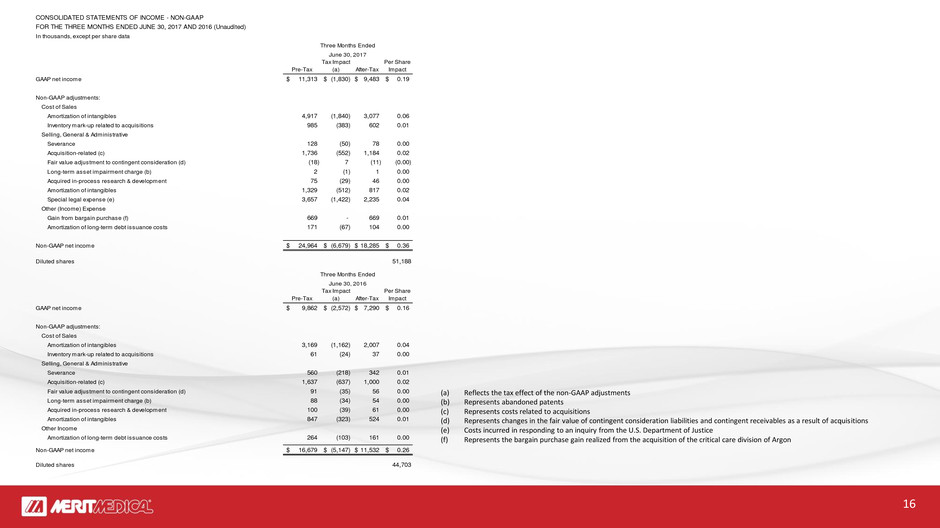
The following table sets forth supplemental financial data and corresponding reconciliations of non-GAAP net income and non-GAAP earnings
per share to Merit’s net income and earnings per share prepared in accordance with GAAP, in each case, for the three and six-month periods
ended June 30, 2017 and 2016. The non-GAAP income adjustments referenced in the following table do not reflect stock-based compensation
expense of approximately $1.1 million and $0.8 million for the three-month periods ended June 30, 2017 and 2016, respectively, and
approximately $1.7 million and $1.4 million for the six-month periods ended June 30, 2017 and 2016, respectively.
16
CONSOLIDATED STATEMENTS OF INCOME - NON-GAAP
FOR THE THREE MONTHS ENDED JUNE 30, 2017 AND 2016 (Unaudited)
In thousands, except per share data
Pre-Tax
Tax Impact
(a) After-Tax
Per Share
Impact
GAAP net income 11,313$ (1,830)$ 9,483$ 0.19$
Non-GAAP adjustments:
Cost of Sales
Amortization of intangibles 4,917 (1,840) 3,077 0.06
Inventory mark-up related to acquisitions 985 (383) 602 0.01
Selling, General & Administrative
Severance 128 (50) 78 0.00
Acquisition-related (c) 1,736 (552) 1,184 0.02
Fair value adjustment to contingent consideration (d) (18) 7 (11) (0.00)
Long-term asset impairment charge (b) 2 (1) 1 0.00
Acquired in-process research & development 75 (29) 46 0.00
Amortization of intangibles 1,329 (512) 817 0.02
Special legal expense (e) 3,657 (1,422) 2,235 0.04
Other (Income) Expense
Gain from bargain purchase (f) 669 - 669 0.01
Amortization of long-term debt issuance costs 171 (67) 104 0.00
Non-GAAP net income 24,964$ (6,679)$ 18,285$ 0.36$
Diluted shares 51,188
Pre-Tax
Tax Impact
(a) After-Tax
Per Share
Impact
GAAP net income 9,862$ (2,572)$ 7,290$ 0.16$
Non-GAAP adjustments:
Cost of Sales
Amortization of intangibles 3,169 (1,162) 2,007 0.04
Inventory mark-up related to acquisitions 61 (24) 37 0.00
Selling, General & Administrative
Severance 560 (218) 342 0.01
Acquisition-related (c) 1,637 (637) 1,000 0.02
Fair value adjustment to contingent consideration (d) 91 (35) 56 0.00
Long-term asset impairment charge (b) 88 (34) 54 0.00
Acquired in-process research & development 100 (39) 61 0.00
Amortization of intangibles 847 (323) 524 0.01
Other Income
Amortization of long-term debt issuance costs 264 (103) 161 0.00
Non-GAAP net income 16,679$ (5,147)$ 11,532$ 0.26$
Diluted shares 44,703
Three Months Ended
June 30, 2017
Three Months Ended
June 30, 2016
(a) Reflects the tax effect of the non-GAAP adjustments
(b) Represents abandoned patents
(c) Represents costs related to acquisitions
(d) Represents changes in the fair value of contingent consideration liabilities and contingent receivables as a result of acquisitions
(e) Costs incurred in responding to an inquiry from the U.S. Department of Justice
(f) Represents the bargain purchase gain realized from the acquisition of the critical care division of Argon
17
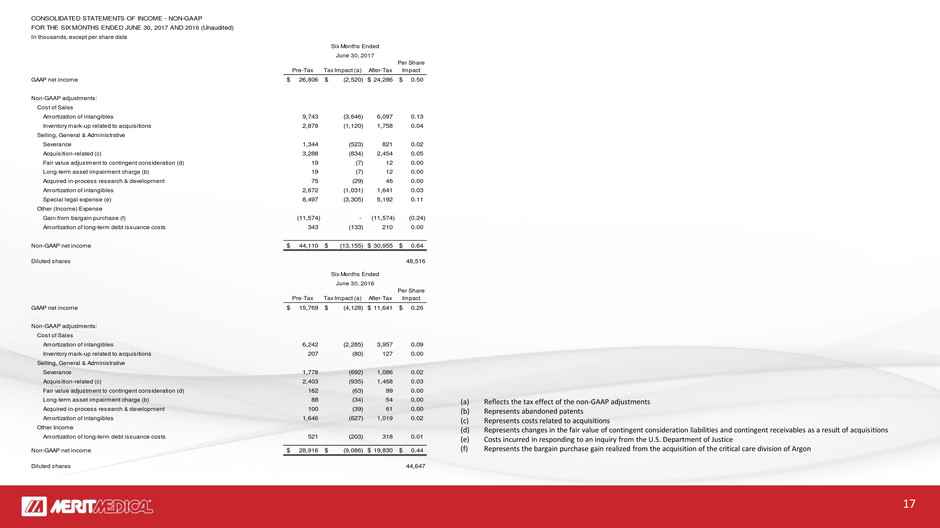
CONSOLIDATED STATEMENTS OF INCOME - NON-GAAP
FOR THE SIX MONTHS ENDED JUNE 30, 2017 AND 2016 (Unaudited)
In thousands, except per share data
Pre-Tax Tax Impact (a) After-Tax
Per Share
Impact
GAAP net income 26,806$ (2,520)$ 24,286$ 0.50$
Non-GAAP adjustments:
Cost of Sales
Amortization of intangibles 9,743 (3,646) 6,097 0.13
Inventory mark-up related to acquisitions 2,878 (1,120) 1,758 0.04
Selling, General & Administrative
Severance 1,344 (523) 821 0.02
Acquisition-related (c) 3,288 (834) 2,454 0.05
Fair value adjustment to contingent consideration (d) 19 (7) 12 0.00
Long-term asset impairment charge (b) 19 (7) 12 0.00
Acquired in-process research & development 75 (29) 46 0.00
Amortization of intangibles 2,672 (1,031) 1,641 0.03
Special legal expense (e) 8,497 (3,305) 5,192 0.11
Other (Income) Expense
Gain from bargain purchase (f) (11,574) - (11,574) (0.24)
Amortization of long-term debt issuance costs 343 (133) 210 0.00
Non-GAAP net income 44,110$ (13,155)$ 30,955$ 0.64$
Diluted shares 48,516
Pre-Tax Tax Impact (a) After-Tax
Per Share
Impact
GAAP net income 15,769$ (4,128)$ 11,641$ 0.26$
Non-GAAP adjustments:
Cost of Sales
Amortization of intangibles 6,242 (2,285) 3,957 0.09
Inventory mark-up related to acquisitions 207 (80) 127 0.00
Selling, General & Administrative
Severance 1,778 (692) 1,086 0.02
Acquisition-related (c) 2,403 (935) 1,468 0.03
Fair value adjustment to contingent consideration (d) 162 (63) 99 0.00
Long-term asset impairment charge (b) 88 (34) 54 0.00
Acquired in-process research & development 100 (39) 61 0.00
Amortization of intangibles 1,646 (627) 1,019 0.02
Other Income
Amortization of long-term debt issuance costs 521 (203) 318 0.01
Non-GAAP net income 28,916$ (9,086)$ 19,830$ 0.44$
Diluted shares 44,647
Six Months Ended
June 30, 2017
Six Months Ended
June 30, 2016
(a) Reflects the tax effect of the non-GAAP adjustments
(b) Represents abandoned patents
(c) Represents costs related to acquisitions
(d) Represents changes in the fair value of contingent consideration liabilities and contingent receivables as a result of acquisitions
(e) Costs incurred in responding to an inquiry from the U.S. Department of Justice
(f) Represents the bargain purchase gain realized from the acquisition of the critical care division of Argon
18
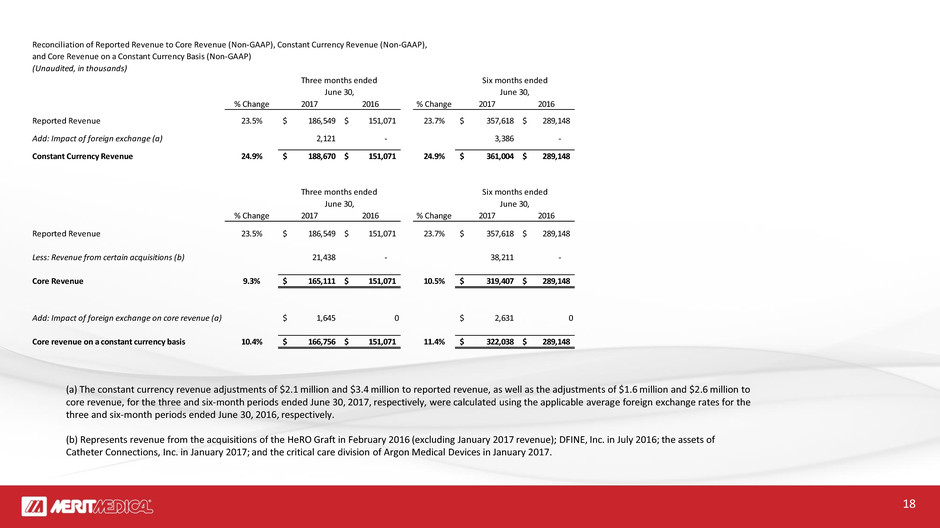
Reconciliation of Reported Revenue to Core Revenue (Non-GAAP), Constant Currency Revenue (Non-GAAP),
and Core Revenue on a Constant Currency Basis (Non-GAAP)
(Unaudited, in thousands)
% Change 2017 2016 % Change 2017 2016
Reported Revenue 23.5% 186,549$ 151,071$ 23.7% 357,618$ 289,148$
Add: Impact of foreign exchange (a) 2,121 - 3,386 -
Constant Currency Revenue 24.9% 188,670$ 151,071$ 24.9% 361,004$ 289,148$
% Change 2017 2016 % Change 2017 2016
Reported Revenue 23.5% 186,549$ 151,071$ 23.7% 357,618$ 289,148$
Less: Revenue from certain acquisitions (b) 21,438 - 38,211 -
Core Revenue 9.3% 165,111$ 151,071$ 10.5% 319,407$ 289,148$
Add: Impact of foreign exchange on core revenue (a) 1,645$ 0 2,631$ 0
Core revenue on a constant currency basis 10.4% 166,756$ 151,071$ 11.4% 322,038$ 289,148$
June 30, June 30,
June 30,
Six months ended
June 30,
Three months ended
Three months ended Six months ended
(a) The constant currency revenue adjustments of $2.1 million and $3.4 million to reported revenue, as well as the adjustments of $1.6 million and $2.6 million to
core revenue, for the three and six-month periods ended June 30, 2017, respectively, were calculated using the applicable average foreign exchange rates for the
three and six-month periods ended June 30, 2016, respectively.
(b) Represents revenue from the acquisitions of the HeRO Graft in February 2016 (excluding January 2017 revenue); DFINE, Inc. in July 2016; the assets of
Catheter Connections, Inc. in January 2017; and the critical care division of Argon Medical Devices in January 2017.
19
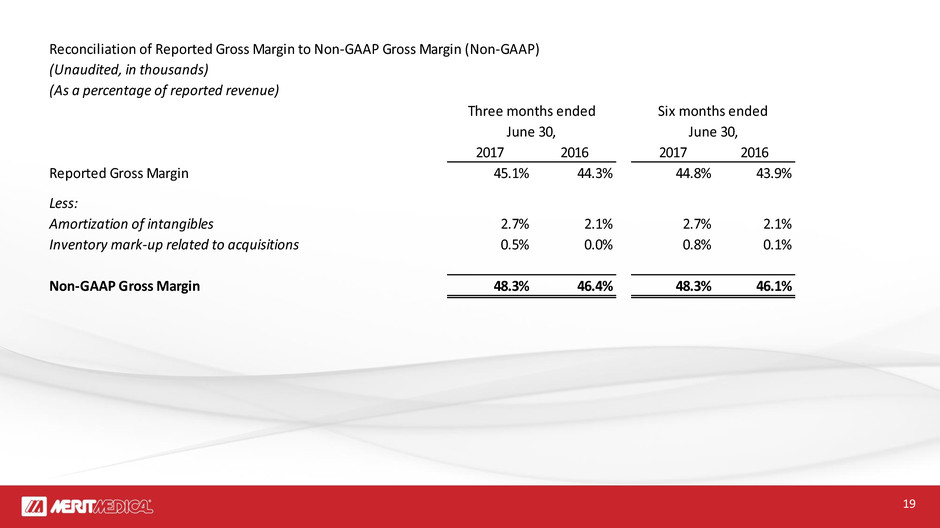
Reconciliation of Reported Gross Margin to Non-GAAP Gross Margin (Non-GAAP)
(Unaudited, in thousands)
(As a percentage of reported revenue)
2017 2016 2017 2016
Reported Gross Margin 45.1% 44.3% 44.8% 43.9%
Less:
Amortization of intangibles 2.7% 2.1% 2.7% 2.1%
Inventory mark-up related to acquisitions 0.5% 0.0% 0.8% 0.1%
Non-GAAP Gross Margin 48.3% 46.4% 48.3% 46.1%
June 30,
Three months ended Six months ended
June 30,
20
